Embed Size (px)
Citation preview

Academy of Strategic Management Journal Volume 20, Issue 4, 2021
1 1939-6104-20-4-801
TECHNOLOGY ACCEPTANCE MODEL (TAM) AND E-
LEARNING SYSTEM USE FOR EDUCATION
SUSTAINABILITY
Mohammed Almulla, King Faisal University
ABSTRACT
In higher education around the world, e-learning is considered a necessary teaching and
learning solution. Despite its value and success, there are quite a few questions about how to use
it and how powerful it is. Universities are grappling with issues of e-learning use by students and
even academic personnel in order to ensure the long-term viability of schooling. This research
uses an updated TAM paradigm to look at students' adoption of e-learning in university, which
includes seven constructs: computer self-efficacy, subjective norm, perceived enjoyment,
perceived usefulness, perceived ease of use, attitude towards use, and behavioral intention to use
e-learning system for education sustainability. As a result, the research methodology for this
thesis was an expanded variant of the Technology Acceptance Model (TAM), and quantitative
data collection and interpretation techniques were used to sample 174 university students who
were selected by stratified random sampling. Student responses were sorted into eight research
constructs and evaluated using structural equation modeling (SEM) to describe their plans to
use an e-learning system for educational sustainability. Computer self-efficacy (CSE), subjective
norm (SN), and perceived enjoyment (PE) were found to be major determinants of perceived
ease of use (PEU) and perceived usefulness (PU). Students' intentions to use an e-learning
system for educational sustainability were influenced by PEU, PU, and attitudes toward use. As
a result, the frameworks were effective in demonstrating Saudi university students' plans to use
an e-learning system for educational sustainability.
Keywords: E-Learning, Sustainability, Technology Acceptance Model (TAM), Structural
Equation Modeling (SEM).
INTRODUCTION
Universities must keep up with students' expectations, preferences, and standards in
today's higher education system, which is constantly changing. As a result, information
technology and E-learning platforms are seen as critical components of universities' operations,
with these organizations increasingly investing in multimedia systems and devices (Popovici &
Mironov, 2015) However, in this technological age, one of the most significant problems facing
universities is the integration of groundbreaking E-learning platforms to help and strengthen both
teaching and learning (Fischer et al., 2014). Many concepts for the idea of E-learning system
have been suggested due to its scope. E-learning, to put it simply, is the use of information and
computing technology and programs to create and design learning environments (Horton, 2006).
E-learning system, according to Ellaria Engelbrecht, is a term that uses interactive platforms
such as the internet, CDs, cell phones, and even television to provide distance learning and
teaching (Engelbrecht, 2005). In a summary, E-learning is the process of transmitting
information and education through the use of different electronic devices (Koohang & Harman,

Academy of Strategic Management Journal Volume 20, Issue 4, 2021
2 1939-6104-20-4-801
2005) and the term is best understood when placed in the light of technology being used to
satisfy people's desire to learn and develop (Cohen & Nycz, 2006). E-learning system, according
to a more nuanced and inclusive concept is a form of teaching and learning that incorporates
electronic tools and mediums with the goal of fostering growth and improving education and
training quality (Sangrà et al., 2011). E-learning system may also refer to a system for formal
education or a network through which knowledge is disseminated to a wide audience through
electronic media. Computers and the internet are the primary components that guarantee the
smooth operation of those networks (Babu & Sridevi, 2018). E-learning system has many
features that facilitate and foster the learning-teaching process by providing a broad variety of
options for exchanging knowledge and downloading documents in various formats. Since it is a
web-based framework, no extra resources are needed, and once the content is posted, users can
access it at any time (Raheem & Khan, 2020). Given that the evolution and application of
programs and technology favored the creation and extension of educational opportunities
(Sarikhani et al., 2016), the use of E-learning system in higher education, as well as students'
perceptions of its utility, became subjects of concern for many researchers. The Technology
Acceptance Model (TAM), which has proven to be useful in assessing and comprehending how
students expect to use E-learning system (Almarabeh, 2014), is important in exploring the use of
E-learning system. Various multimedia tools are used in the E-learning system in higher
education. Many terms, such as Computer-mediated learning (Anaraki, 2004), Web-based
teaching, E-learning system, and Learning Management Systems (Costa et al., 2012), have been
used to describe online learning over time. In the event of a pandemic, online learning is a viable
option (Basilaia & Kvavadze, 2020; Taha et al., 2020). Since it can be accessed anywhere and at
any time, online learning is very realistic (Silverman & Hoyos, 2018). Do not, however, believe
that implementing online learning can solve all of the problems (Hung & Chou, 2015; Smart &
Cappel, 2006). As a result, higher education institutions with little to no familiarity with e-
learning or e-learning services face challenges, especially where lecturers are unfamiliar with
how to use online applications (Zaharah et al., 2020). There are benefits and drawbacks of
implementing online learning in higher education. The benefits of online learning include its
flexibility and ability to be used extensively, while the disadvantages include the propensity for
plagiarism, internet signal power, and devices that allow it (Arkorful & Abaidoo, 2015). As a
result, e-learning system usage for educational sustainability among students is a starting point
for assessing and then designing technology integration training to see to what degree they
follow and are pleased with using accessible e-learning system is a starting point for assessing
and then designing technology integration training. Also, as a result, the aim of this research is to
look at students' attitudes toward using e-learning systems and their behavioral intentions to use
them for educational sustainability. This research adds to the Technology Acceptance Model
(TAM) literature by looking at the relationship between TAM variables and students' attitudes
toward using e-learning systems and their behavioral plan to use them in the long run. As a
result, the following seven variables were used in this study: computer self-efficacy, subjective
norm, perceived enjoyment, perceived usefulness, perceived ease of use, attitude toward use, and
behavioral desire to use an e-learning system for educational sustainability. This research could
help researchers build and test hypotheses about e-learning systems for educational
sustainability, as well as practitioners who design and promote e-learning systems for
educational sustainability. The present study's second section covers model construction and
hypotheses, the third section covers research methods, and the fourth section covers findings and

Academy of Strategic Management Journal Volume 20, Issue 4, 2021
3 1939-6104-20-4-801
interpretation, as well as debate and consequences. The final section of the report is the thesis,
which discusses prospective research.
LITERATURE REVIEW
According to the TAM model, emerging technology adoption is determined by four
factors: perceived ease of usage (PEOU), perceived utility (PU), attitude toward use (ATU), and
behavioral purpose to use (BIU). To analyze the adoption and use of inventions, a variety of
models have been used. The Technology Acceptance Model (TAM) is one of the most well-
known methods for analyzing users' acceptance of innovations, and it has been used extensively
in several studies (Binyamin et al., 2017; Alharbi & Drew, 2014; Binyamin et al., 2017;
Mohammadi, 2015). The model has been quoted over 36,000 times, according to Google
Scholar. Fred Davis introduced TAM in 1989 as a scientific paradigm focused on the principle of
rational behavior (TRA) (Davis 1989). TAM discusses the interaction between consumers and
devices in order to estimate the user's technology adoption (Holden & Rada, 2011). Most
acceptance models have struggled to integrate psychological and technical frameworks into a
single theory; however, TAM is one of the few hypotheses that will do (Holden & Rada, 2011),
see Figure 1.
FIGURE 1
RESEARCH MODEL AND HYPOTHESES
Computer Self-Efficacy (CSE)
CSE is the first and most commonly used vector to extend TAM in the area of e-learning
(Abdullah & Ward, 2016). Venkatesh and Davis proposed this element as a PEOU determinant
in 1996 (Davis, 1989). CSE is a test that assesses a person's ability to use computer technology
(Compeau & Higgins, 1995). As a result, whether a person believes he or she has a high potential
to use computer technology, they are more likely to use it. CSE refers to the students' confidence
in their abilities to use the e-learning system offered by their institution for the purposes of this
report. CSE has been reported to impact students' PEOU and PU of e-learning systems based on

Academy of Strategic Management Journal Volume 20, Issue 4, 2021
4 1939-6104-20-4-801
TAM in Saudi Arabia (Al-Mushasha, 2013). The TAM3 model (Venkatesh & Bala, 2008) and
Venkatesh's model (Venkatesh, 2000). investigated the impact of CSE and hypothesized that
CSE has an impact on PEOU. TAM3 (Al-Gahtani, 2016) was used to explain this hypothesis in
Saudi Arabia.
Subjective Norm (SN)
SN is the second most commonly used vector to apply TAM in the field of e-learning
(Abdullah & Ward, 2016). Scholars exchange the words “external power” and “subjective
norm” (Tarhini et al., 2014). This dimension shows how much people believe others believe they
can or should not engage in a specific action (Venkatesh & Davis, 2000). In this research, a
student is more likely to use an e-learning system whether he or she believes that people who
matter to him or her agree that he or she does. It is fair to assume that subjective norms influence
technology use in developed countries (Baker et al., 2010). The impact of SN on TAM constructs
in e-learning has been examined in the literature, with conflicting results (Tarhini et al., 2014).
Perceived Enjoyment (PE)
PE refers to how enjoyable an activity provided by an e-learning system is viewed,
regardless of predicted output outcomes (Van der Heijden, 2004). This construct can be
interpreted as a bi-perspective mode of pleasure derived from using an e-learning device with
friends and assisting others (Hsu et al., 2009). The PE of students is characterized in this study as
the degree to which they enjoy using the e-learning method.
Perceived Usefulness (PU)
The level of belief that using technology can increase one's work efficiency is referred to
as PU (Davis, 1989). In this report, PU refers to the extent to which students perceive the use of
an e-learning method to be beneficial to their learning. PU has been shown to affect attitudes
toward technology and user intentions in recent research (Teo & Zhou, 2014; Al-Rahmi et al.,
2018; Alamri et al., 2019 & 2020). Since PU has a direct effect on behaviors, it is believed that it
would have an indirect effect on intention to use an e-learning scheme.
Perceived Ease of Use (PEU)
PEU is the degree to which a person believes that using an e-learning device is painless.
According to Davis (1989); Venkatesh et al. (2003), when a technology is perceived to be simple
to use, people are more inclined to cultivate a favorable outlook about it (Teo & Zhou, 2014).
PEU refers to a student's belief that using an e-learning method is both simple and useful in this
analysis. Though PU is concerned with the impact of technology on job efficiency, perceived
ease is concerned with the impact of technology on performance processes (Davis, 1989).
Attitude towards Use (ATU)
ATU is affected by their classroom (Fabunmi et al., 2007) or their dedication to and
recognition of their learning activities (Riaz et al., 2011), according to the literature. PEU and the
TAM, according to Davis (1989), affect PU and, when combined, affect consumer approaches to
e-learning system use. PEU and PU were considered key cues for interactive course

Academy of Strategic Management Journal Volume 20, Issue 4, 2021
5 1939-6104-20-4-801
identification in another study (Alalwan et al., 2019; Tan, 2019) PEU has an effect on learners'
attitudes toward the BIU e-learning framework and their plans to use it. The BIU for e-learning
system use in this study relates to the degree to which students believe that using an e-learning
system enriches their learning, which increases their ATU e-learning system use.
Behavioral Intention to Use (BIU)
BIU is the probability that individuals will engage in the behavior in question is known as
behavioral intention to use (BIU) (Al-Rahmi et al., 2019). According to Ajzen (1991), BIU is a
clear antecedent of actual behavior, because the stronger an individual's purpose towards a
certain behavior, the more likely such behavior will occur (Ajzen, 1991). A significant number
of studies have been published that support the connection between BIU and user behavior
(Davis, 1989; Al-Rahmi et al., 2019). The vast majority of research on technology adoption in
the e-learning world has shown that behavioral intention has a strong positive impact on e-
learning system utilization (Alshehri et al., 2019; Salloum & Shaalan, 2018)
METHODOLOGY
Many institutions have promoted the use of available e-learning systems for educational
sustainability. As a result, through an observational investigation of students' adoption of e-
learning system usage for education sustainability, this report aims to create a model of
calculation of students' intention to use e-learning system for education sustainability.
Undergraduate and postgraduate students who used an e-learning system for education
sustainability made up the research group. For objects containing the TAM constructs and
demographic features, a five-point Likert scale ranging from 1 (strongly disagree) to 5 (strongly
agree) was used. Respondents were asked to provide input on e-learning system usage for
education sustainability, its impact on students' attitudes toward use, and behavioral intention to
use an e-learning system for education sustainability in the future using self-administration. To
check the quality and efficiency of the calculation model, the data was evaluated using the
Statistical Package for the Social Sciences (SPSS) and Partial Least Squares–Structural Equation
Modeling (PLS-SEM) using Smart PLS 2.0. Factor loadings were used to ensure construct
validity, composite reliability, Cronbach's alpha, and convergence validity for the model's
goodness of fit, as recommended by Hair et al. (2012).
Instruments of Measurement
The build elements adopted from previous research confirmed the measurement scales'
material validity. There were two sections of the sample questionnaire: Basic demographic data
(gender, age, educational level, and specialization) and questionnaire items measuring machine
self-efficacy and subjective norm were adapted from [28], as were items measuring perceived
enjoyment, perceived usefulness, perceived ease of use, attitude toward use, and behavioral
intention to use were adapted from Davis (1989); Al-Rahmi et al. (2019).
RESULTS
The Cronbach's alpha reliability coefficient was found to be 0.891, indicating that the
variables that affected attitude toward usage and behavioral intention to use an e-learning system
for education sustainability was reliable. Three criteria were used to assess discriminant validity:

Academy of Strategic Management Journal Volume 20, Issue 4, 2021
6 1939-6104-20-4-801
According to Hair et al. (2012), variable indices must be less than 0.70, the Average Variance
Extracted (AVE) of each construct must be equal to or greater than 0.5, and the AVE square root
of each construct must be greater than the Inter-Construct Correlations (IC) for a factor. Aside
from the above factors, build factor analysis results with factor loadings of 0.70 or greater
(Cronbach's alpha 0.70 and composite reliability 0.70) is sufficient (Hair et al., 2012).
Construct Validity of Measurements
Build validity (Alamri et al., 2020) refers to the degree to which individual objects assess
the definition for which they were created. This was measured using a systematic analysis of
previously reviewed products in the literature. Table 1 lists the items and their loadings, which
are required to load into the construct that they were designed to test (Chow & Teicher, 2012).
Table 1
LOADINGS AND CROSS-LOADINGS OF ITEMS
Factors Items ATU BIU CSE PE PEU PU SN
Attitude towards Use
ATU1 0.854489 0.585720 0.094517 0.356804 0.625866 0.621607 0.163071
ATU2 0.868354 0.534915 0.093805 0.654040 0.417070 0.555444 0.129753
ATU3 0.841266 0.468622 0.055914 0.602425 0.372779 0.508893 0.008887
ATU4 0.823617 0.450444 0.066075 0.405158 0.416847 0.583883 0.013183
Behavioral Intention to
Use
BIU1 0.452069 0.803486 0.217293 0.297294 0.443521 0.433156 0.296703
BIU2 0.499467 0.849453 0.285775 0.340338 0.434555 0.577988 0.207029
BIU3 0.519881 0.845686 0.158930 0.317575 0.587341 0.665157 0.172384
BIU4 0.550362 0.843148 0.123046 0.320580 0.443348 0.509175 0.160918
Computer Self-
Efficacy
CSE1 0.081468 0.230974 0.886301 0.033532 0.272345 0.268148 0.354914
CSE2 0.044079 0.237678 0.816209 0.076791 0.260064 0.150673 0.494894
CSE3 0.025947 0.110081 0.859065 0.015642 0.135133 0.238790 0.392306
Perceived Enjoyment
PE1 0.522873 0.385895 0.012291 0.889702 0.254769 0.379052 0.011363
PE2 0.491143 0.321050 0.027522 0.897108 0.235417 0.345636 0.035830
PE3 0.544539 0.294872 0.098668 0.856047 0.256969 0.273096 0.098971
Perceived Ease of Use
PEU1 0.542575 0.586688 0.299414 0.233823 0.974260 0.721889 0.262220
PEU2 0.583842 0.448994 0.140555 0.397367 0.845558 0.749668 0.032480
PEU3 0.408736 0.536209 0.207712 0.172353 0.830115 0.551454 0.273368
PEU4 0.378149 0.462753 0.307134 0.168581 0.875392 0.607062 0.183905
Perceived Usefulness
PU1 0.660877 0.633345 0.241988 0.430695 0.696700 0.908846 0.142758
PU2 0.548527 0.640864 0.233992 0.328033 0.630728 0.918926 0.071483
PU3 0.631249 0.581858 0.144502 0.318810 0.667321 0.898084 0.101168
PU4 0.568004 0.520083 0.317188 0.280788 0.701986 0.860687 0.095794
Subjective Norm
SN1 0.016100 0.047942 0.372317 0.035026 0.126771 0.071839 0.792699
SN2 0.069134 0.312479 0.508708 0.076200 0.160443 0.064045 0.744956
SN3 0.129045 0.212870 0.319398 0.065180 0.205653 0.130247 0.887879
Convergent Validity of Measurements
The factor loadings of 25 products were considered suitable because they were greater
than 0.70, and their composite reliability was over 0.70, varying from 0.851215 - 0.942675.
Cronbach's alpha coefficient values ranged from 0.742610 - 0.918775, indicating that the
findings were adequate. In terms of AVE, the numbers ranged from 0.657220 - 0.804441. The
results of the Confirmatory Factor Analysis (CFA) are mentioned in Hair et al. (2012), see Table
2.

Academy of Strategic Management Journal Volume 20, Issue 4, 2021
7 1939-6104-20-4-801
Table 2
FACTORS LOADINGS AND CONFIRMATORY FACTOR ANALYSIS RESULTS
Factors Items Loadings AVE Composite Reliability Cronbach's Alpha
Attitude towards Use
ATU1 0.854489
0.717566
0.910384
0.869083
ATU2 0.868354
ATU3 0.841266
ATU4 0.823617
Behavioral Intention to Use
BIU1 0.803486
0.698310
0.902478
0.856559
BIU2 0.849453
BIU3 0.845686
BIU4 0.843148
Computer Self-Efficacy
CSE1 0.886301
0.729907
0.890086
0.817270 CSE2 0.816209
CSE3 0.859065
Perceived Enjoyment
PE1 0.889702
0.776396
0.912375
0.856438 PE2 0.897108
PE3 0.856047
Perceived Ease of Use
PEU1 0.974260
0.779888
0.933842
0.904616
PEU2 0.845558
PEU3 0.830115
PEU4 0.875392
Perceived Usefulness
PU1 0.908846
0.804441
0.942675
0.918775
PU2 0.918926
PU3 0.898084
PU4 0.860687
Subjective Norm
SN1 0.792699
0.657220
0.851215
0.742610 SN2 0.744956
SN3 0.887879
Convergent Validity of Measurements
Differences between collections of definitions and their metrics are referred to as
discriminant validity. The discriminant validity of all constructs was verified with values greater
than 0.50 and meaningful at p=0.001, as required by Fornell & Larcker (1981). Table 3 shows
that the AVE square root shared by objects in a single construct should be smaller than the
correlations between items in the two constructs (Hair et al., 2012).
Table 3
DISCRIMINANT VALIDITY
Factors ATU BIU CSE PEU PE PU SN
Attitude towards Use 0.943332
Behavioral Intention to Use 0.606682 0.893733
Computer Self-Efficacy 0.063295 0.232352 0.907733
Perceived Ease of Use 0.550250 0.576726 0.268390 0.899878
Perceived Enjoyment 0.588019 0.381989 0.048975 0.282202 0.908864
Perceived Usefulness 0.673141 0.663488 0.260665 0.751991 0.381118 0.887646
Subjective Norm 0.599258 0.244631 0.477303 0.209057 0.051850 0.115690 0.893332

Academy of Strategic Management Journal Volume 20, Issue 4, 2021
8 1939-6104-20-4-801
The Structural Model's Analysis
Smart PLS 2.0 was used to test the analysis theories and investigate construct
relationships. Figure 1 shows the hypothesis development, Figure 2 shows the path coefficient
findings, and Figure 3 shows the path coefficient (T-Values) findings.
FIGURE 2
PATH COEFFICIENT RESULTS
FIGURE 3
PATH T-VALUES
Academy of Strategic Management Journal Volume 20, Issue 4, 2021
9 1939-6104-20-4-801
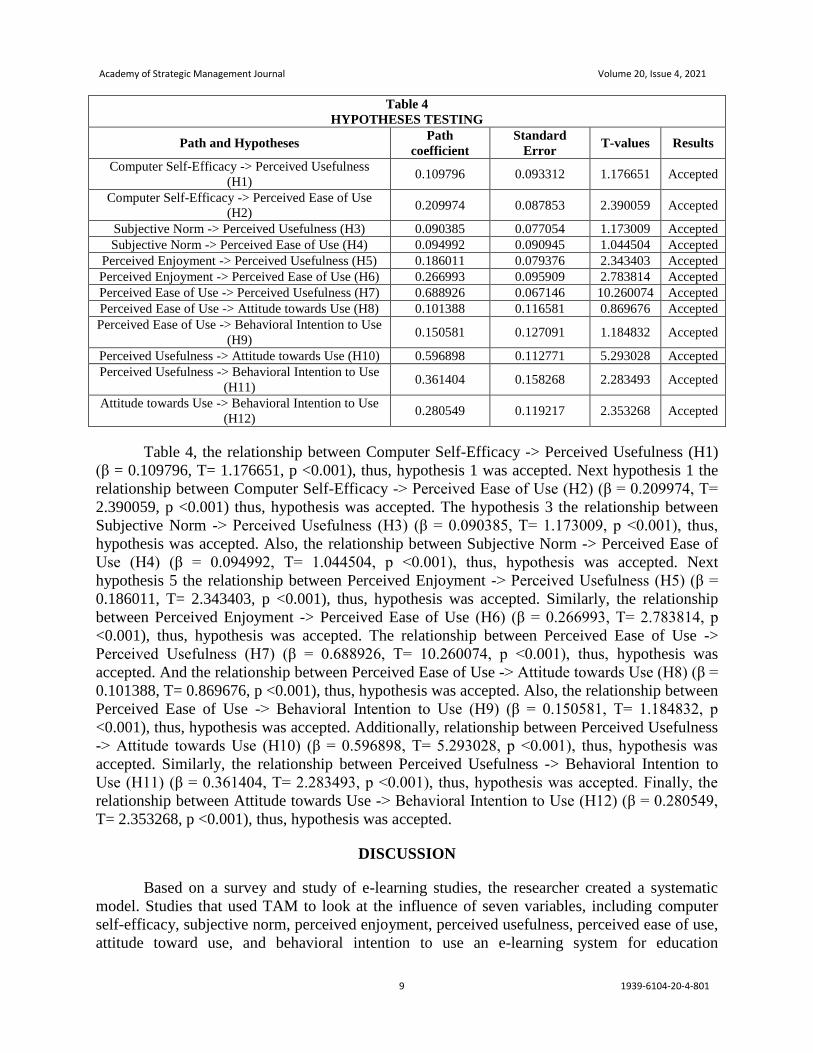
Table 4
HYPOTHESES TESTING
Path and Hypotheses Path
coefficient
Standard
Error T-values Results
Computer Self-Efficacy -> Perceived Usefulness
(H1) 0.109796 0.093312 1.176651 Accepted
Computer Self-Efficacy -> Perceived Ease of Use
(H2) 0.209974 0.087853 2.390059 Accepted
Subjective Norm -> Perceived Usefulness (H3) 0.090385 0.077054 1.173009 Accepted
Subjective Norm -> Perceived Ease of Use (H4) 0.094992 0.090945 1.044504 Accepted
Perceived Enjoyment -> Perceived Usefulness (H5) 0.186011 0.079376 2.343403 Accepted
Perceived Enjoyment -> Perceived Ease of Use (H6) 0.266993 0.095909 2.783814 Accepted
Perceived Ease of Use -> Perceived Usefulness (H7) 0.688926 0.067146 10.260074 Accepted
Perceived Ease of Use -> Attitude towards Use (H8) 0.101388 0.116581 0.869676 Accepted
Perceived Ease of Use -> Behavioral Intention to Use
(H9) 0.150581 0.127091 1.184832 Accepted
Perceived Usefulness -> Attitude towards Use (H10) 0.596898 0.112771 5.293028 Accepted
Perceived Usefulness -> Behavioral Intention to Use
(H11) 0.361404 0.158268 2.283493 Accepted
Attitude towards Use -> Behavioral Intention to Use
(H12) 0.280549 0.119217 2.353268 Accepted
Table 4, the relationship between Computer Self-Efficacy -> Perceived Usefulness (H1)
(β = 0.109796, T= 1.176651, p <0.001), thus, hypothesis 1 was accepted. Next hypothesis 1 the
relationship between Computer Self-Efficacy -> Perceived Ease of Use (H2) (β = 0.209974, T=
2.390059, p <0.001) thus, hypothesis was accepted. The hypothesis 3 the relationship between
Subjective Norm -> Perceived Usefulness (H3) (β = 0.090385, T= 1.173009, p <0.001), thus,
hypothesis was accepted. Also, the relationship between Subjective Norm -> Perceived Ease of
Use (H4) (β = 0.094992, T= 1.044504, p <0.001), thus, hypothesis was accepted. Next
hypothesis 5 the relationship between Perceived Enjoyment -> Perceived Usefulness (H5) (β =
0.186011, T= 2.343403, p <0.001), thus, hypothesis was accepted. Similarly, the relationship
between Perceived Enjoyment -> Perceived Ease of Use (H6) (β = 0.266993, T= 2.783814, p
<0.001), thus, hypothesis was accepted. The relationship between Perceived Ease of Use ->
Perceived Usefulness (H7) (β = 0.688926, T= 10.260074, p <0.001), thus, hypothesis was
accepted. And the relationship between Perceived Ease of Use -> Attitude towards Use (H8) (β =
0.101388, T= 0.869676, p <0.001), thus, hypothesis was accepted. Also, the relationship between
Perceived Ease of Use -> Behavioral Intention to Use (H9) (β = 0.150581, T= 1.184832, p
<0.001), thus, hypothesis was accepted. Additionally, relationship between Perceived Usefulness
-> Attitude towards Use (H10) (β = 0.596898, T= 5.293028, p <0.001), thus, hypothesis was
accepted. Similarly, the relationship between Perceived Usefulness -> Behavioral Intention to
Use (H11) (β = 0.361404, T= 2.283493, p <0.001), thus, hypothesis was accepted. Finally, the
relationship between Attitude towards Use -> Behavioral Intention to Use (H12) (β = 0.280549,
T= 2.353268, p <0.001), thus, hypothesis was accepted.
DISCUSSION
Based on a survey and study of e-learning studies, the researcher created a systematic
model. Studies that used TAM to look at the influence of seven variables, including computer
self-efficacy, subjective norm, perceived enjoyment, perceived usefulness, perceived ease of use,
attitude toward use, and behavioral intention to use an e-learning system for education

Academy of Strategic Management Journal Volume 20, Issue 4, 2021
10 1939-6104-20-4-801
sustainability. Many scholars have performed studies on the use and implementation of e-
learning programs (Almaiah et al., 2016, 2018 & 2019). However, observational studies focusing
exclusively on Saudi Arabia were scarce (Almaiah et al., 2017 & 2019a). While the majority of
Saudi Arabian universities effectively adopted the e-learning scheme, the percentage of teachers
and students who used it was low (Selim, 2007). This inspired the current research, which aimed
to fill a gap in the literature on the use of e-learning systems for long-term educational
sustainability. This was undertaken in order to figure out what aspects influenced students'
decision to use the university's e-learning scheme. The results of this study will be addressed in
this section, and professionals, scholars, and educators will gain valuable insight into the reasons
that improve the use of e-learning programs in universities for educational sustainability. The
results about model characteristics specifically showed that e-learning system authors,
programmers, and purchasers use for educational sustainability. Sustainability of online learning
in higher education and task-technology-fit (TTF) and compatibility on students' satisfaction and
success have an effect on its use in higher education (Almaiah et al., 2015a). As a result,
consumer expectations and principles should be considered to ensure that the device addresses
student needs. This perceived fit between system features and student needs has the potential to
improve e-learning system use and education sustainability. According to Almaiah et al. (2015b
& 2019b, all of the hypotheses were endorsed and positively linked to educational sustainability,
confirming important links between online learning and student interactivity and utility.
Indirectly, considerations such as machine self-efficacy, subjective standard, and presumed
satisfaction influence students' behavioral intention to use an e-learning system for education
sustainability. In terms of the study's implications, it reinforces the well-known importance of
belief structures in e-learning system usage for education sustainability in Saudi Higher
education, as measured by perceived usefulness, perceived ease of use, and attitude toward using
e-learning systems for education sustainability. The results also revealed the role of faculty in
explaining how students should use e-learning systems for education sustainability to learn
course material, as attitude toward e-learning systems for education sustainability improves
behavioral intention to use one.
CONCLUSION
This study contributes to the body of knowledge about the use and implementation of e-
learning systems. The factors that influence students' actual use of e-learning systems in Saudi
Arabia were identified using an adapted TAM model. To begin, the findings demonstrate a
connection between the TAM model and the use of an e-learning system for educational
sustainability. Second, the findings show that perceived utility and perceived ease of use both
add to the decision to use e-learning platforms for education sustainability, according to the
TAM model constructs. Finally, this indicates that machine self-efficacy, subjective norm, and
perceived enjoyment affect perceived usefulness, perceived ease of use, and attitude toward use,
as well as behavioral intention to use an e-learning system for educational sustainability. As
major determinants of e-learning environment for educational sustainability, this research used
eight novel TAM model characteristics. However, mixed findings in the literature suggest that
the association between machine self-efficacy, subjective standard, and perceived pleasure and
TAM model variables should be investigated further. In light of the study design's limitations
and the quantitative methodology selected, subsequent experiments might use interview methods
to address these concerns. Furthermore, prospective scholars should investigate these areas by
using this model and cross-validate them across cultures by including cultural aspects.

Academy of Strategic Management Journal Volume 20, Issue 4, 2021
11 1939-6104-20-4-801
ACKNOWLEDGEMENT
The author extends his appreciation to the Deputyship for Research & Innovation,
Ministry of Education in Saudi Arabia for funding this research work through the project number
IFT20183.
REFERENCES
Abdullah, F., & Ward, R. (2016). Developing a general extended technology acceptance model for e-learning
(GETAMEL) by analysing commonly used external factors. Computers in human behavior, 56, 238-256.
Ajzen, I. (1991). The theory of planned behavior. Organizational Behavior and Human Decision Processes, 50(2),
179– 211.
Alalwan, N., Al-Rahmi, W.M., Alfarraj, O., Alzahrani, A., Yahaya, N., & Al-Rahmi, A.M. (2019). Integrated three
theories to develop a model of factors affecting students’ academic performance in higher education. Ieee
Access, 7, 98725-98742.
Alamri, M.M., Almaiah, M.A., & Al-Rahmi, W.M. (2020). Social media applications affecting Students’ academic
performance: A model developed for sustainability in higher education. Sustainability, 12(16), 6471.
Alenazy, W.M., Al-Rahmi, W.M., & Khan, M.S. (2019). Validation of TAM model on social media use for
collaborative learning to enhance collaborative authoring. Ieee Access, 7, 71550-71562.
Al-Gahtani, S.S. (2016). Empirical investigation of e-learning acceptance and assimilation: A structural equation
model. Applied Computing and Informatics, 12(1), 27-50.
Alharbi, S., & Drew, S. (2014). Using the technology acceptance model in understanding academics’ behavioural
intention to use learning management systems. International Journal of Advanced Computer Science and
Applications, 5(1), 143-155.
Almaiah, M.A., Alamri, M.M., & Al-Rahmi, W.M. (2019). Analysis the effect of different factors on the
development of Mobile learning applications at different stages of usage. IEEE Access, 8, 16139-16154.
Almaiah, M.A., Jalil, M.A., & Man, M. (2016). Extending the TAM to examine the effects of quality features on
mobile learning acceptance. Journal of Computers in Education, 3(4), 453-485.
Almarabeh, T. (2014). Students' Perceptions of E-Learning at the University of Jordan. International Journal of
Emerging Technologies in Learning, 9(3), 31-35.
Al-Mushasha, N.F.A. (2013). Determinants of e-learning acceptance in higher education environment based on
extended technology acceptance model. In 2013 Fourth International Conference on e-Learning" Best
Practices in Management, Design and Development of e-Courses: Standards of Excellence and
Creativity" (pp. 261-266), IEEE.
Al-Rahmi, W.M., Aldraiweesh, A., Yahaya, N., & Kamin, Y.B. (2018). Massive open online courses (MOOCS):
Systematic literature review in Malaysian higher education. International Journal of Engineering &
Technology, 7(4), 2197-2202.
Al-Rahmi, W.M., Alias, N., Othman, M.S., Ahmed, I.A., Zeki, A.M., & Saged, A.A. (2017). Social Media Use,
Collaborative Learning and Students' academic Performance: A Systematic Literature Review of
Theoretical Models. Journal of Theoretical & Applied Information Technology, 95(20).
Al-Rahmi, W.M., Othman, M.S., & Yusuf, L.M. (2015). Effect of engagement and collaborative learning on
satisfaction through the use of social media on Malaysian higher education. Research Journal of Applied
Sciences, Engineering and Technology, 9(12), 1132-1142.
Al-rahmi, W.M., Othman, M.S., & Yusuf, L.M. (2015). Using social media for research: The role of interactivity,
collaborative learning, and engagement on the performance of students in Malaysian post-secondary
institutes. Mediterranean Journal of Social Sciences, 6(5), 536. Al-Rahmi, W.M., Yahaya, N., Alamri, M.M., Aljarboa, N.A., Kamin, Y.B., & Moafa, F.A. (2018). A model of
factors affecting cyber bullying behaviors among university students. IEEE Access, 7, 2978-2985.
Al-Rahmi, W.M., Yahaya, N., Alamri, M.M., Alyoussef, I.Y., Al-Rahmi, A.M., & Kamin, Y.B. (2019). Integrating
innovation diffusion theory with technology acceptance model: Supporting students’ attitude towards using
a massive open online courses (MOOCs) systems. Interactive Learning Environments, 1-13.
Al-Rahmi, W.M., Yahaya, N., Aldraiweesh, A.A., Alturki, U., Alamri, M.M., Saud, M.S.B., Kamin, Y.B.,
Aljeraiwi, A.A., & Alhamed, O.A. (2019). Big data adoption and knowledge management sharing: An
empirical investigation on their adoption and sustainability as a purpose of education. IEEE Access, 7,
47245-47258.

Academy of Strategic Management Journal Volume 20, Issue 4, 2021
12 1939-6104-20-4-801
Alshehri, A., Rutter, M.J., & Smith, S. (2019). An implementation of the UTAUT model for understanding students'
perceptions of learning management systems: A study within tertiary institutions in Saudi
Arabia. International Journal of Distance Education Technologies (IJDET), 17(3), 1-24.
Anaraki, F. (2004). Developing an effective and efficient eLearning platform. International Journal of the computer,
the internet and management, 12(2), 57-63.
Arkorful, V., & Abaidoo, N. (2015). The role of e-learning, advantages and disadvantages of its adoption in higher
education. International Journal of Instructional Technology and Distance Learning, 12(1), 29-42.
Babu, G.S., & Sridevi, K. (2018). Importance of E-learning in Higher Education: A study. International Journal of
Research Culture Society, 2(5), 84–88.
Baker, E.W., Al-Gahtani, S.S., & Hubona, G.S. (2010). Cultural impacts on acceptance and adoption of information
technology in a developing country. Journal of Global Information Management (JGIM), 18(3), 35-58.
Basilaia, G., & Kvavadze, D. (2020). Transition to online education in schools during a SARS-CoV-2 coronavirus
(COVID-19) pandemic in Georgia. Pedagogical Research, 5(4), 1-9.
Binyamin, S., Rutter, M., & Smith, S. (2017). The students’ acceptance of learning management systems in Saudi
Arabia: A case study of King Abdulaziz University. In Proceedings of the 11th Annual International
Conference of Technology, Education and Development (INTED2017) (pp. 9324-9333).
Binyamin, S., Rutter, M., & Smith, S. (2017). Factors influencing the students' use of learning management systems:
A case study of King Abdulaziz University. In International Conference on e-Learning (pp. 289-297).
Academic Conferences International Limited.
Chow, Y.S., & Teicher, H. (2012). Probability theory: independence, interchangeability, martingales. Springer
Science & Business Media, Berlin, Germany, 2012.
Cohen, E., & Nycz, M. (2006). Learning objects and e-learning: An informing science perspective. Interdisciplinary
Journal of E-Learning and Learning Objects, 2(1), 23-34.
Compeau, D.R., & Higgins, C.A. (1995). Computer self-efficacy: Development of a measure and initial test. MIS
Quarterly, 189-211.
Costa, C., Alvelos, H., & Teixeira, L. (2012). The use of Moodle e-learning platform: a study in a Portuguese
University. Procedia Technology, 5, 334-343.
Davis, F.D. (1989). Perceived usefulness, perceived ease of use, and user acceptance of information
technology. MIS quarterly, 13(3), 319-340.
Engelbrecht, E. (2005). Adapting to changing expectations: Post-graduate students’ experience of an e-learning tax
program. Computers & Education, 45(2), 217-229.
Fabunmi, M., Brai-Abu, P., & Adeniji, I.A. (2007). Class factors as determinants of secondary school student’s
academic performance in Oyo State, Nigeria. Journal of Social Sciences, 14(3), 243-247.
Fischer, H., Heise, L., Heinz, M., Moebius, K., & Koehler, T. (2014). E-Learning trends and hypes in academic
teaching. methodology and findings of a trend study, International association for development of the
information society.
Fornell, C., & Larcker, D.F. (1981). Evaluating structural equation models with unobservable variables and
measurement error. Journal of Marketing Research, 18(1), 39-50.
Hair, J.F., Sarstedt, M., Ringle, C.M., & Mena, J.A. (2012). An assessment of the use of partial least squares
structural equation modeling in marketing research. Journal of the Academy of Marketing Science, 40(3),
414-433.
Holden, H., & Rada, R. (2011). Understanding the influence of perceived usability and technology self-efficacy on
teachers’ technology acceptance. Journal of Research on Technology in Education, 43(4), 343-367.
Horton, W. (2006). E-Learning by design. Pfeiffer: San Francisco, CA, USA, 2006; ISBN -13.
Hsu, M.K., Wang, S.W., & Chiu, K.K. (2009). Computer attitude, statistics anxiety and self-efficacy on statistical
software adoption behavior: An empirical study of online MBA learners. Computers in Human
Behavior, 25(2), 412-420.
Hung, M.L., & Chou, C. (2015). Students' perceptions of instructors' roles in blended and online learning
environments: A comparative study. Computers & Education, 81, 315-325.
Koohang, A., & Harman, K. (2005). Open source: A metaphor for e-learning. Informing Science, 8, 75-86.
Mohammadi, H. (2015). Investigating users’ perspectives on e-learning: An integration of TAM and IS success
model. Computers in Human Behavior, 45, 359-374.
Popovici, A., & Mironov, C. (2015). Students’ perception on using e-Learning technologies. Procedia-Social and
Behavioral Sciences, 180, 1514-1519.
Raheem, B.R., & Khan, M.A. (2020). The role of e-Learning in COVID-19 crisis. International Journal of Creative
Research Thought (IJCRT), 8(3), 3135-3138.

Academy of Strategic Management Journal Volume 20, Issue 4, 2021
13 1939-6104-20-4-801
Riaz, A., Riaz, A., & Hussain, M. (2011). Students’ acceptance and commitment to e-learning: Evidence from
Pakistan. Journal of Educational and Social Research, 1(5), 21-30.
Salloum, S.A., & Shaalan, K. (2018, September). Factors affecting students’ acceptance of e-learning system in
higher education using UTAUT and structural equation modeling approaches. In International Conference
on Advanced Intelligent Systems and Informatics (pp. 469-480). Springer, Cham.
Sangrà, A., Vlachopoulos, D., Cabrera, N., & Bravo, S. (2011). Towards an inclusive definition of e-
learning. Barcelona: E Learn Centre, UOC Open University Catalonia. Barcelona, Spain, 2011.
Sarikhani, R., Salari, M., & Mansouri, V. (2016). The impact of e-learning on university students’academic
achievement and creativity. Journal of Technical Education and Training, 8(1), 25-33.
Selim, H.M. (2007). Critical success factors for e-learning acceptance: Confirmatory factor models. Computers &
Education, 49(2), 396-413.
Silverman, J., & Hoyos, V. (2018). Distance learning, e-learning and blended learning in mathematics education.
Springer.
Smart, K.L., & Cappel, J.J. (2006). Students’ perceptions of online learning: A comparative study. Journal of
Information Technology Education: Research, 5(1), 201-219.
Taha, M.H., Abdalla, M.E., Wadi, M., & Khalafalla, H. (2020). Curriculum delivery in Medical Education during
an emergency: A guide based on the responses to the COVID-19 pandemic. Med Ed Publish, 9.
Tan, P.J.B. (2019). An empirical study of how the learning attitudes of college students toward English e-tutoring
websites affect site sustainability. Sustainability, 11(6), 1748.
Tarhini, A., Hone, K., & Liu, X. (2014). The effects of individual differences on e-learning users’ behaviour in
developing countries: A structural equation model. Computers in Human Behavior, 41, 153-163.
Teo, T., & Zhou, M. (2014). Explaining the intention to use technology among university students: a structural
equation modeling approach. Journal of Computing in Higher education, 26(2), 124-142.
Van der Heijden, H. (2004). User acceptance of hedonic information systems. MIS Quarterly, 695-704.
Venkatesh, V. (2000). Determinants of perceived ease of use: Integrating control, intrinsic motivation, and emotion
into the technology acceptance model. Information systems research, 11(4), 342-365.
Venkatesh, V., & Bala, H. (2008). Technology acceptance model 3 and a research agenda on interventions. Decision
Sciences, 39(2), 273-315.
Venkatesh, V., & Davis, F.D. (2000). A theoretical extension of the technology acceptance model: Four longitudinal
field studies. Management Science, 46(2), 186-204.
Venkatesh, V., Morris, M.G., Davis, G.B., & Davis, F.D. (2003). User acceptance of information technology:
Toward a unified view. MIS Quarterly, 425-478.
Zaharah, Z., Kirilova, G.I., & Windarti, A. (2020). Impact of corona virus outbreak towards teaching and learning
activities in Indonesia. SALAM: Jurnal Sosial dan Budaya Syar-i, 7(3), 269-282.
Mohammed Almulla*
*Corresponding author: Department of Curriculum
and Instruction, Faculty of Education, King Faisal
University, Al Ahsa 31982, Saudi Arabia.
Email: [email protected]