Embed Size (px)
Citation preview

Technologies for adapting to climate change
A case study of Korean cities and implications for Latin American cities
PROJECTS DOCUMENTS
Hyejung Kim

ECLACPublications
Thank you for your interest in
this ECLAC publication
Please register if you would like to receive information on our editorial
products and activities. When you register, you may specify your particular
areas of interest and you will gain access to our products in other formats.
www.cepal.org/en/publications
Publicaciones www.cepal.org/apps
Projects Documents
Technologies for adapting to climate change
A case study of Korean cities and implications for Latin American cities
Hyejung Kim
This document was prepared by Hyejung Kim, Consultant with the Climate Change Unit in the Division of Sustainable Development and Human Settlements of the Economic Commission for Latin America and the Caribbean (ECLAC), in the framework of cooperation activities between ECLAC and the Republic of Korea, and was reviewed by José Eduardo Alatorre, Environmental Affairs Officer in the Climate Change Unit of ECLAC.
The views expressed in this document, which has been reproduced without formal editing, are those of the authors and do not necessarily reflect the views of the Organization.
United Nations publication LC/TS.2021/54 Distribution: L Copyright © United Nations, 2021 All rights reserved Printed at United Nations, Santiago S.21-00001 This publication should be cited as: H. Kim, “Technologies for adapting to climate change: a case study of Korean cities and implications for Latin American cities”, Projects Documents (LC/TS.2021/54), Santiago, Economic Commission for Latin America and the Caribbean (ECLAC), 2021. Applications for authorization to reproduce this work in whole or in part should be sent to the Economic Commission for Latin America and the Caribbean (ECLAC), Documents and Publications Division, [email protected]. Member States and their governmental institutions may reproduce this work without prior authorization but are requested to mention the source and to inform ECLAC of such reproduction.

ECLAC Technologies for adapting to climate change... 3
Contents
Introduction ......................................................................................................................................... 7
I. Technologies for adapting to climate change .......................................................................... 9
II. Mechanisms for developing and transferring technologies for adaptation ........................... 13 A. UNFCCC technology mechanism....................................................................................... 13 B. National mechanisms related to adaptation technologies in Korea ................................... 17
III. Case study Korean cities practices on adaptation technologies ............................................ 27 A. Selection of cities for case study ........................................................................................ 31 B. Case 1: Seoul, an inland megacity ...................................................................................... 33
1. Adaptation challenges ............................................................................................... 33 2. Adaptation technologies in practice .......................................................................... 36
C. Case 2: Busan and Incheon, coastal cities (port cities) ........................................................ 40 1. Adaptation challenges ............................................................................................... 40 2. Adaptation technologies in practice .......................................................................... 42
D. Case 3: Daegu, city in a mountain basin .............................................................................46 1. Adaptation challenges ...............................................................................................46 2. Adaptation technologies in practice .......................................................................... 47
E. Case 4: Sejong, a planned administrative city .................................................................... 50 1. Adaptation challenges ............................................................................................... 50 2. Adaptation technologies in practice .......................................................................... 51
IV. Analytical framework: assessing local practices on adaptation technologies ....................... 53 A. A framework for analyzing practices on adaptation technologies ...................................... 53 B. Application of analytical framework .................................................................................. 57
V. Latin American cities’ needs for adaptation technologies ..................................................... 61 A. Climate adaptation challenges in LAC cities ...................................................................... 61

ECLAC Technologies for adapting to climate change... 4
B. Climate adaptation technology needs in the LAC region ................................................... 63
VI. Conclusion: Implications for developing and transferring adaptation technologies in LAC cities ........................................................................................................ 65
Bibliography ...................................................................................................................................... 69
Annexes ............................................................................................................................................. 75 Annex 1 ..................................................................................................................................... 76 Annex 2 ..................................................................................................................................... 77 Annex 3 ..................................................................................................................................... 81 Annex 4 ..................................................................................................................................... 82 Annex 5 ..................................................................................................................................... 83 Annex 6 ..................................................................................................................................... 88
Tables
Table 1 Key milestones of global climate technology negotiations ........................................ 14 Table 2 Milestones related to adaptation technology ............................................................ 17 Table 3 Classification of adaptation technologies .................................................................. 21 Table 4 Adaptation technologies presented in the Guidelines
for Climate Change Adaptation Projects .................................................................... 30 Table 5 Key features of the five target cities .......................................................................... 32 Table 6 Policies related to the development of Seoul Metropolitan City’s
adaptation action plans ............................................................................................. 33 Table 7 Technological adaptation projects of Seoul in 2018 ................................................... 36 Table 8 Factors in developing and transferring climate technologies
identified in the literature review ............................................................................... 55 Table 9 Framework for analyzing practices on adaptation technologies ................................ 57 Table 10 List of potential adaptation technologies for LAC cities ............................................ 66 Table A1 Classification of technologies for mitigation and adaptation ..................................... 76 Table A2 List of adaptation measures by Seoul Metropolitan Government, 2018 ..................... 77 Table A3 Technologies for coastal adaptation .......................................................................... 82 Table A4 Milestones of green building policies ......................................................................... 84 Table A5 Standards of materials and resources in G-SEED ....................................................... 84 Table A6 Examples of green building materials ........................................................................ 85 Table A7 Construction materials from waste recycling .............................................................86 Table A8 Analysis result on Korean national and local governments’
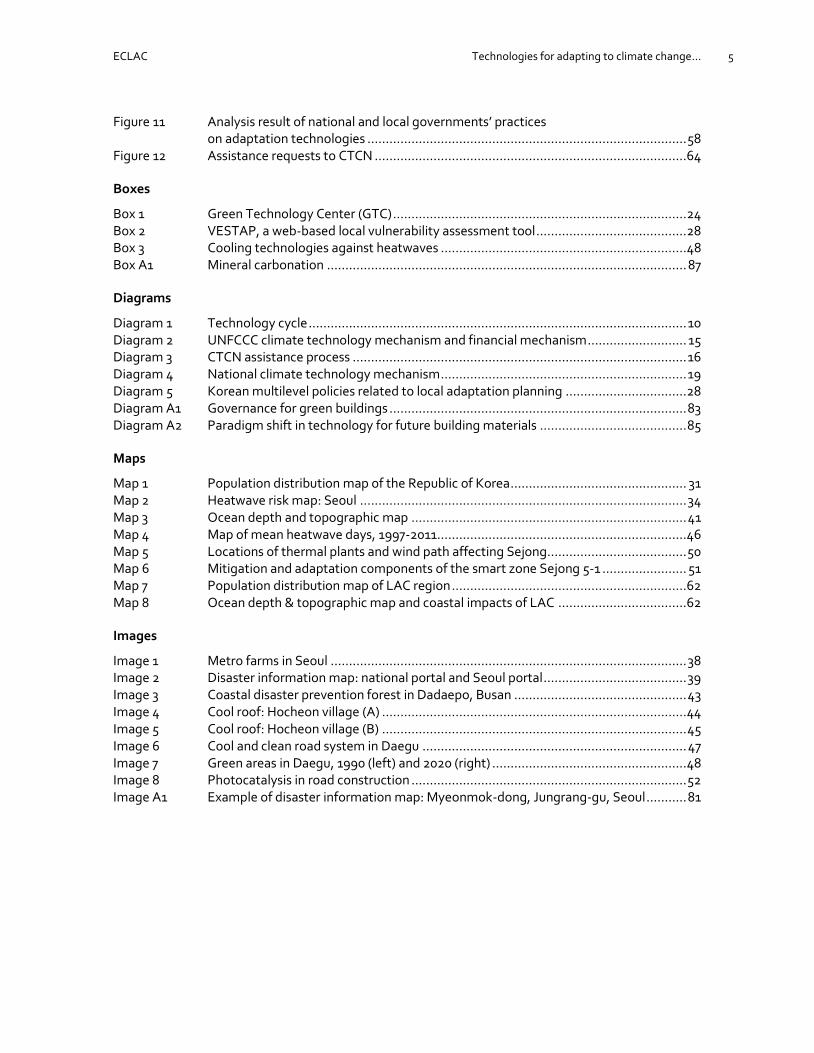
technological practices in adapting to climate change ............................................... 88 Figures
Figure 1 Global climate finance in adaptation, 2017-2018 average (A) ..................................... 11 Figure 2 Global climate finance in adaptation, 2017-2018 average (B) ..................................... 11 Figure 3 CTCN members by region and country ...................................................................... 16 Figure 4 R&D investment in the Republic of Korea, 2013-2018 ................................................ 20 Figure 5 Korean government’s R&D budget composition in 2020 ........................................... 20 Figure 6 Private companies with patented climate technologies (A) ....................................... 22 Figure 7 Private companies with patented climate technologies (B)........................................ 22 Figure 8 Government-funded institutes with patented climate technologies (A) ..................... 23 Figure 9 Government-funded institutes with patented climate technologies (B) ..................... 24 Figure 10 Precipitation and frequency of heavy rainfall in Seoul ................................................ 35
ECLAC Technologies for adapting to climate change... 5
Figure 11 Analysis result of national and local governments’ practices on adaptation technologies ....................................................................................... 58
Figure 12 Assistance requests to CTCN .....................................................................................64
Boxes
Box 1 Green Technology Center (GTC) ................................................................................ 24 Box 2 VESTAP, a web-based local vulnerability assessment tool ......................................... 28 Box 3 Cooling technologies against heatwaves ................................................................... 48 Box A1 Mineral carbonation .................................................................................................. 87
Diagrams
Diagram 1 Technology cycle ....................................................................................................... 10 Diagram 2 UNFCCC climate technology mechanism and financial mechanism ........................... 15 Diagram 3 CTCN assistance process ........................................................................................... 16 Diagram 4 National climate technology mechanism ................................................................... 19 Diagram 5 Korean multilevel policies related to local adaptation planning ................................. 28 Diagram A1 Governance for green buildings ................................................................................. 83 Diagram A2 Paradigm shift in technology for future building materials ........................................ 85
Maps
Map 1 Population distribution map of the Republic of Korea ................................................ 31 Map 2 Heatwave risk map: Seoul ......................................................................................... 34 Map 3 Ocean depth and topographic map ........................................................................... 41 Map 4 Map of mean heatwave days, 1997-2011....................................................................46 Map 5 Locations of thermal plants and wind path affecting Sejong...................................... 50 Map 6 Mitigation and adaptation components of the smart zone Sejong 5-1 ....................... 51 Map 7 Population distribution map of LAC region ................................................................62 Map 8 Ocean depth & topographic map and coastal impacts of LAC ...................................62
Images
Image 1 Metro farms in Seoul ................................................................................................. 38 Image 2 Disaster information map: national portal and Seoul portal ....................................... 39 Image 3 Coastal disaster prevention forest in Dadaepo, Busan ............................................... 43 Image 4 Cool roof: Hocheon village (A) ................................................................................... 44 Image 5 Cool roof: Hocheon village (B) ................................................................................... 45 Image 6 Cool and clean road system in Daegu ........................................................................ 47 Image 7 Green areas in Daegu, 1990 (left) and 2020 (right) ..................................................... 48 Image 8 Photocatalysis in road construction ........................................................................... 52 Image A1 Example of disaster information map: Myeonmok-dong, Jungrang-gu, Seoul ........... 81


ECLAC Technologies for adapting to climate change... 7
Introduction
Global society continues to seek sustainable ways to respond to climate change more efficiently and effectively. In particular, technology has been recognized as one of the essential enabling elements for adapting to climate change: finance, technology, and knowledge of management practices (UNEP, 2014; IPCC, 2015). In this regard, climate technologies started receiving global attention since 1992, and earnest efforts began in 2010 by establishing the Technology Mechanism led by UNFCCC in order to guide and support to develop and transfer technologies for mitigating and adapting to climate change. Under the Paris Agreement, the Technology Framework was established with the aim to guide the linework of the Technology Mechanism in supporting international, national, and regional institutions to achieve targets set by the agreement for both mitigation and adaptation (UNFCCC, 2019). A recent IPCC special report (2019) also implies that many things need to be done in both mitigation and adaptation in order to achieve the 1.5 °C target. Global investments, however, have given much more attention to mitigation actions than adaptation, and it was also the case in technologies (Wheeler, 2008; Aylett, 2015; CPI, 2019; iied, 2018).
Adaptation cost estimates by 2050 have increased from USD 70 billion-100 billion to USD 280 billion-500 billion a year (UNEP, 2016). On the other hand, a significant level of return on investments in adaptation is expected according to the recent report by the Global Commission on Adaptation (2019). The report indicated that investments of USD 1.8 trillion in adaptation could bring USD 7.1 trillion of net benefits by 2030 in five areas: early warning systems; infrastructure resilience; dryland agriculture crop production; mangroves protection; and resilient water resources management. Investments in technologies and R&D are showing an upward trend in grants from governments, and non-profit sectors. The UK allocated GBP 1 billion in research on climate solutions (CPI, 2019).
As local level efforts play key roles for adapting to climate change, cities need to identify climatic challenges and seek ways to respond to them considering local conditions. UNFCCC (2006) stated in its special technical report that adaptation activities involve diverse forms of technology, including knowledge and materials science. It is necessary to develop and take into practice in-demand technologies in developing countries and vulnerable groups. Furthermore, the effective use of technologies is determined by local circumstances, such as institutional, regulatory, social, and cultural conditions (IPCC, 2015).

ECLAC Technologies for adapting to climate change... 8
Some Latin American and the Caribbean (LAC) countries are recognized as among the most vulnerable to climate change. Three countries from the region have been listed in the 20 countries most affected by climatic disasters from 1999 through 2018: Haiti, Dominica, and Guatemala ranked the 3rd, 10th, and 16th respectively (Eckstein, et al., 2019). The region also shows overall limited capacities to deal with climate adaptation issues considering their environmental, economic, and social conditions. As the most urbanized region in the world, expected to reach nearly 90 percent by 2050 (UN DESA, 2019), urban poverty became a growing issue and remains a challenge to climate-resilient development. Thus, it is apparent that cities in the LAC region need to exert concerted efforts to strengthen adaptive capacities to climate change in socially inclusive ways. In this context, technical development and technology transfer have been considered as key adaptation strategies in the region, yet there was relatively limited progress on it over the past two decades (Leal Filho & Mannke, 2014).
While economic, social, and environmental conditions and settlements culture in Latin American countries are different from those in the Republic of Korea, they still have several climate adaptation issues in common. Korea, as one of the most innovative countries in the world and with over 91% of total population living in cities, has invested in climate-related technologies as part of its actions for strengthening the adaptive capacity of cities. In this regard, this study aims to analyze Korea’s city-level efforts to adapt to climate change by supporting the development and transfer of technologies considering local conditions. The study also draws implications for Latin American cities on identifying potential technologies as well as planning and implementing appropriate action plans to further enhance their climate resilience more efficiently and effectively.
In the course of the research, it is hardly found studies of assessing practices for adaptation technologies by applying an analytical framework and even harder at the local level. In this way, this study also contributes to the body of knowledge in analyzing local practices on technologies for adaptation with a comprehensive methodology developed based on the UNF CCC Technology Framework and other relevant pieces of literature.
The first section of this report addresses the extent of technologies for adaptation, followed by the second section of how the Technology Mechanism works under UNFCCC and how technologies for adaptation have been developed and transferred in Korea. In the third section, major climatic challenges and actions of the selected five Korean cities – Seoul, Busan, Incheon, Daegu, and Sejong were addressed based on the content analysis of policy documents and the interviews with the five city governments. These five cities were classified into four categories: an inland megacity-Seoul, coastal cities-Busan and Incheon, a city in a mountain basin-Daegu, and a planned administrative city-Sejong. The fourth section introduces a framework to analyze local practices on adaptation technologies, which framework was developed based on literature review and the Technology Framework by UNFCCC. In the next step, local governments’ practices for adapting to climate change with the deployment of technologies were assessed by applying the aforementioned analytical framework. Finally, adaptation issues in Latin American cities similar to the selected Korean cities are presented. Implications were drawn from the case studies of Korean cities considering Latin American contexts in order to help local officials and practitioners in incorporating adaptation technologies into local sustainable development as well as climate policies and action plans aiming to strengthen local resilience to climate change.

ECLAC Technologies for adapting to climate change... 9
I. Technologies for adapting to climate change
Technology is a proven driver of achieving sustainable development goals, which includes environmentally sound technologies in responding to climate change (UN Inter-agency Task on Financing for Development, 2019; IPCC, 2015). The global efforts for addressing climate technologies were initiated in 1992, led by the United Nations Framework Convention on Climate Change (UNFCCC). Since then, experiments on climate technologies have focused more on mitigation, particularly related to the energy sector, than adaptation (UNFCCC, 2006; IPCC, 2014). ‘Technologies for adaptation’ (or ‘adaptation technology’) were included in the work program of the Expert Group on Technology Transfer (EGTT) in 2004 and started receiving earnest attention since 2005 at the UNFCCC Seminar on the Development and Transfer of Environmentally Sound Technologies (ESTs) for Adaptation to Climate Change (UNFCCC, 2006).
Technologies and information resources are among the factors that influence exposure and vulnerability to climate change along with financial resources, infrastructure, managerial ability, institutional environment, political forces, and societal values (Smit & Wandel, 2006; Dodman, et al., 2009; IPCC, 2015). However, technology alone cannot ensure the enhancement of a country’s and community’s adaptive capacity since the factors mentioned above influence the effectiveness of adaptation measures in a complex way. Besides, it is undoubted that adaptation needs to be addressed aligning with development agenda (Ayers & Dodman, 2010; IPCC, 2014; Chu, et al., 2017). In this regard, it is generally known that developed countries are more capable of adapting to climate change than developing countries because of their advantageous conditions in terms of the aforementioned factors, including financial resources and technologies. The absolute amount of adaptation costs is higher for developed countries, but adaptation costs per gross domestic product are higher for developing countries (Chapagain, et al., 2020). Technology transfer, particularly from developed countries to developing countries, is necessary to assist sustainable paths for development across the world.

ECLAC Technologies for adapting to climate change... 10
IPCC defined ‘technology transfer’ as “a broad set of processes covering the flows of know-how, experience, and equipment for mitigating and adapting to climate change amongst different stakeholders such as governments, private sector entities, financial institutions, NGOs and research/education institutions (IPCC, 2000, p. 3).” Technology transfer beyond geographical and climatic conditions may decrease the cost of adaptation, particularly in energy supply (IPCC, 2014). Technology transfer is one of the ways to assist communities and countries in strengthening their adaptive capacity to climate change. For its effective implementation, it is necessary to consider the context of the use of technologies and climate information (Flagg & Kirchhoff, 2018). Understanding local contexts and adapting existing technologies are essential since climate change impacts on ecosystems, social groups, and sectors are shown in different forms depending on location, society, and adaptive capacity. Developing countries need to adopt modern technologies based on their own criteria and consider full knowledge of consequences that can likely occur. Not doing so, it can induce unpredicted adverse effects. Thus, combining existing and new technologies can be effective in achieving climate-related targets (IPCC, 2019; UNFCCC, 2006; iied, 2019; Lybecker & Lohse, 2015). When it comes to technologies as part of adaptation efforts, there are distinctive features of adaptation technologies that are different from technologies for mitigation. First, technologies for adaptation may not be new but may already be existing measures, while those for mitigation are more likely new. Second, there is no dominant sector. Third, there may be readily available adaptation technologies in developing countries, but people are not sufficiently using them. Forth, most adaptation technologies are more likely to be small-scale. Finally, different stakeholders and barriers can be observed across sectors (UNFCCC, 2006; IPCC, 2014).
Digital technologies can contribute to enhancing adaptive capacity to climate change by supporting the flow of useful and locally contextualized climate information as well as the communication between stakeholders in responding to climate impacts (iied, 2019). Thus, the current smart city development trend, with digitalization as its main component, triggers cities to build communication and information capacities and leads cities to strengthen their climate resilience.
As Diagram 1 shows, efforts directly related to technologies push the development of climate technologies, and after, the newly formed market naturally pulls the diffusion of technologies. The prior phase is usually led by academia and institutions with supports from governments and non-profit organizations, while the later phase can be carried out when the private sector and individuals actively participate in the market as consumers.
Diagram 1
Technology cycle
Source: Reformulated the figures from Grubb (2004, p. 20) and ECOSOC (2015, pp. 2, 6).
Technologies for adaptation can be generally classified into two categories, hard and soft technologies, and a combined method of adopting both hard and soft technologies would likely be more successful. One example of combined methods can be the use of multiple technologies in the forest
↓ ↑ ↓ Technology transfer and local adaptation ↓ ↑ ↓ Suppliers
Research Development DemonstrationMarket
FormationDiffusion
Market pull
Technology push
↑ ↑ ↑ Investments ↑ ↑ ↑
Consumers
Academia Government-funded labs Firms Non-profits
Individuals Governments Firms
ECLAC Technologies for adapting to climate change... 11
106 93
13 11
238
30 28 19 14 14 12
050
100150200250
Wes
tern
Euro
pe
Am
eri
cas
Jap
an, K
ore
aan
d Is
rael
Oth
er
Oce
ania
East
Asi
a an
dP
acif
ic
Sou
th A
sia
Lati
n A
mer
ica
& t
he…
Sub
-Sah
aran
Afr
ica
Mid
dle
Eas
tan
d N
ort
h…
Cen
tral
Asi
aan
d E
aste
rn…
Tran
sreg
ion
al
OECD Non-OECD
sector: improved cookstoves and land management for contributing to both fuel efficiency and deforestation (iied, 2018). This categorization can be further disaggregated in four types: traditional, modern, high technology, and future technology. As traditional technology has been usually developed in the course of adapting to variable and extreme climatic conditions, this type of technologies can be improved in consideration of local contexts (UNFCCC, 2006).
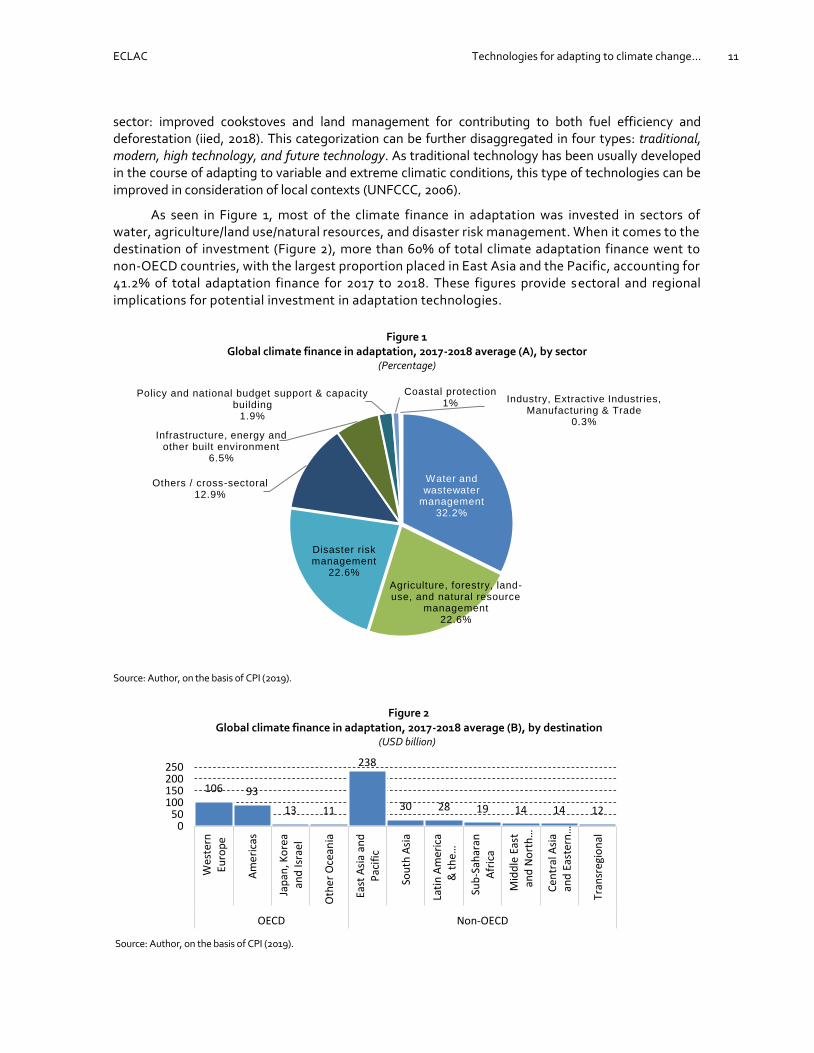
As seen in Figure 1, most of the climate finance in adaptation was invested in sectors of water, agriculture/land use/natural resources, and disaster risk management. When it comes to the destination of investment (Figure 2), more than 60% of total climate adaptation finance went to non-OECD countries, with the largest proportion placed in East Asia and the Pacific, accounting for 41.2% of total adaptation finance for 2017 to 2018. These figures provide sectoral and regional implications for potential investment in adaptation technologies.
Figure 1 Global climate finance in adaptation, 2017-2018 average (A), by sector
(Percentage)
Source: Author, on the basis of CPI (2019).
Figure 2 Global climate finance in adaptation, 2017-2018 average (B), by destination
(USD billion)
Source: Author, on the basis of CPI (2019).
Water and wastewater
management32.2%
Agriculture, forestry, land-use, and natural resource
management22.6%
Disaster risk management
22.6%
Others / cross-sectoral12.9%
Infrastructure, energy and other built environment
6.5%
Policy and national budget support & capacity building
1.9%
Coastal protection1% Industry, Extractive Industries,
Manufacturing & Trade0.3%

ECLAC Technologies for adapting to climate change... 13
II. Mechanisms for developing and transferring technologies for adaptation
A. UNFCCC technology mechanism
There have been increased efforts to develop climate technologies and enhance networks for technology transfer over the past two decades. In 1996, an initial report on the inventory and assessment of technologies was published by the UNFCCC, and this report mainly focused on mitigation. After this report, in 2006, UNFCCC published a technical report on adaptation technologies in response to the global change in perception and emphasis on adaptation issues (UNFCCC, 2006). The Climate Technology Center and Network (CTCN) and the Technology Executive Committee (TEC) were established as parts of the Technology Mechanism during the Conference of the Parties (COP) in 2010. However, efforts on climate technology still focused more on mitigation-related technologies as climate policies and projects were inclined to mitigation. In 2015, the Paris Agreement presented the vision of climate technology development and transfer for both measures, mitigation and adaptation. It introduced a technology framework with guidance to the Technology Mechanism. This framework is currently in the process of operationalization by the Subsidiary Body for Scientific and Technological Advice (SBSTA) (see Table 1).
The TEC is a policy arm of the technology mechanism, undertaking policy analysis and consultancy for technology development and transfer, and consists of 20 representatives from developing and developed countries. In addition to TEC, the technology mechanism has set the CTCN as its implementation arm, supporting climate technology projects/programs by providing technical assistance and access to knowledge as well as enhancing cooperation among stakeholders. The CTCN is hosted by the United Nations Environment Programme (UNEP) in partnership with the United Nations Industrial Development Organization (UNIDO) along with the support from 11 partner institutions (UNFCCC, 2015).

ECLAC Technologies for adapting to climate change... 14
Prior to the technology mechanism, the financial mechanism was established in 1994. Under the financial mechanism, there are operating entities, such as the Green Climate Fund (GCF) and the Global Environment Facility (GEF). The Standing Committee on Finance (SCF) was also established in 2010 to provide guidance and coordination for the financial mechanism and undertook the relevant work on climate finance under the Paris Agreement (UNFCCC, 2017).
Table 1 Key milestones of global climate technology negotiations
Year Milestone
1992 Technology and the Convention - Provisions on development and transfer of climate technologies included in Article 4 and 5
1995-2001
Consultative process - Understanding of global issues on climate technology - Understanding of national/regional/international issues on climate technology
* Regional workshop on the transfer of technology consultative process1 (1997) A provision on technology in Article 10(c) of the Kyoto Protocol; Clean Development Mechanism (CDM)
2001-2007
Technology transfer framework (2001) Framework for actions to enhance the implementation in Article 4 (2001) Establishment of the Expert Group on Technology transfer (EGTT) (2007) Four sub-themes of the mechanisms: innovative financing, international cooperation, endogenous development of technologies, and collaborative research and development
2008 Poznan strategic programme on technology transfer (by GEF) - To support scaled-up investments for technology transfer towards developing countries by supporting Technology
Needs Assessments (TNAs), supporting pilot projects, and disseminating best practices
2010 Technology Mechanism - Establishment of the Technology Mechanism, consisting of the Technology Executive Committee (TEC) and the
Climate Technology Centre and Network (CTCN) - The EGTT’s mandate was ended and taken by the Technology Executive Committee (TEC)
2015 Paris Agreement - Strengthening the Technology Mechanism, particularly in technology research, development, and demonstration in
addition to endogenous capacities and technologies - Establishment of the Technology Framework - Provision of a long-term vision on climate technology in Article 10
2018 Technology Framework - Adoption of the Technology Framework in the themes of innovation, implementation, enabling environment and
capacity building, stakeholder engagement, and support
Source: UNFCCC (2016) and TT: Clear-Information on climate technology negotiations.2
The linkages between the technology mechanism and financial mechanism (Diagram 2) have become stronger, and the practices of the collaboration between these two mechanisms were shared during COP 24. The identified collaboration includes the coordination between the National Designated Entities (NDEs) from the technology side and the National Designated Authorities (NDAs) and focal points from the financial side; the engagement of CTCN and GCF for the ‘Readiness and Preparatory Support Programme’ of the Fund; and the knowledge sharing between TEC, CTCN, and GCF about climate technology incubators and accelerators (UNFCCC, 2018). Recently in 2020, the CTCN has started managing a new small grants programme of the Adaptation Fund.
1 Latin America and the Caribbean Regional Workshop on Transfer of Technology Consultative Process. https://unfccc .int/ttclear/events/2000_event2. Accessed on March 3, 2020.
2 https://unfccc.int/ttclear/negotiations. Accessed on March 2, 2020.

ECLAC Technologies for adapting to climate change... 15
Diagram 2 UNFCCC climate technology mechanism and financial mechanism
Source: Author, based on CTCN official website and (UNFCCC, 2017; UNFCCC, 2015; UNFCCC, 2018). a) CMP: Conference of the Parties serving as the meeting of the Parties to the Kyoto Protocol. b) CMA: Conference of the Parties serving as the meeting of the Parties to the Paris Agreement.
As of March 2020, there are 161 National Designated Entities (NDEs) and 550 members in the network (see Figure 3). Among 33 countries in Latin America and the Caribbean, 28 NDEs are registered in the CTCN3. When it comes to the number of members, there are 63 members based in the LAC region, which accounts for 11.5% of the global total of 5504. Korea has been actively participating in CTCN by registering 69 Korean organizations as members of the Network, which is the largest number of members at the country level accounting for 12.5% of the total network members.
In 2001, the UNFCCC established the Technology Transfer Framework, which includes five themes: technology needs assessments, technology information, enabling environments, capacity building, and mechanisms for technology transfer (UNFCCC, 2008). The Technology Needs Assessments (TNAs) is to identify their needs for mitigation and adaptation in order to prioritize climate technologies, and the Technology Action Plans (TAPs) have been developed as part of TNAs since 2010. The Poznan Strategic Program on Technology Transfer managed by GEF supports developing countries to take on TNAs.
3 NDEs list and profiles. https://www.ctc-n.org/about-ctcn/national-designated-entities/national-designated-entities-by-country. Accessed on March 4, 2020.
4 Network members list and profiles. https://www.ctc-n.org/network/network-members. Accessed on March 2, 2020.
Technology Mechanism Financial Mechanism
Conference of the Parties (COP)
TEC
- 20 representatives from developing and developed countries
Policy
CTCN
- Hosted by UNEP in collaboration with UNIDO
- Supported by 11 institutions
Implementation
NDAs and focal points
GEF
SCF
Operating Entities
GCF
Collaboration
161 NDEs and 550 members (As of March 2020)
CMP a) CMA b)
AF

ECLAC Technologies for adapting to climate change... 16
1 2 6 315
4 511
22
3 2 19
69
415
1 2 19 8 7 5
19427
315
2
31
10
26
7 4 114
5 2 3 7
2636
93
010203040506070
BJ
and
oth
er 1
1 a
)C
M/E
G/M
U/R
WK
E/ZW N
G ZA TZB
D/I
RC
N INID
/KZ/
LKIQ
/NP
/PK
/PH
IL a
nd
oth
er 8
b)
JPR
ep. o
f K
ore
aTH V
NB
B/C
U/K
N/T
TD
O R
ep./
JM/L
CA
L an
d o
ther
5 c
)A
S/IT BE
DK FI FR GE
DE
GR
/NO NL
PT/
SE ES CH
UK
Inte
rnat
ion
alA
R/B
RB
Z/H
N/N
I/P
A/P
Y/In
tl.
CL
CO
/PE
CR
EC/U
YM
XC
AU
SA
U NZ
AF AS CARIB EU Intl. SA NA OC
Figure 3 CTCN members by region and country
(Number of members)
Source: Author, on the basis of CTCN official website (https://www.ctc-n.org/network/network-members). Accessed on March 2, 2020. a) Benin, Cape Verde, Ethiopia, Ghana, Guinea, Malawi, Morocco, Senegal, Sudan, Tunisia, Uganda, and one transnational. b) Israel, Kyrgyzstan, Lebanon, Malaysia, Mongolia, Palestine, Singapore, Tajikistan, and United Arab Emirates. c) Albania, Bosnia and Herzegovina, Ireland, Romania, Russian Federation, and Serbia.
Developing countries that desire to receive assistance can make requests free of charge up to USD 250,000 (for rapid response up to USD 50,000) through their NDEs, and CTCN members can participate in a bidding process through UNIDO e-procurement system to be selected as providers. As of July 2019, the CTCN supported 93 developing countries: 50% from Africa, 30% from Asia-Pacific, and 19% from LAC. 223 out of 273 requests have met the screening criteria, consisting of 52.3% for mitigation, 27.1% for adaptation, and the remaining 20.6% for adaptation and mitigation (UNFCCC, 2019). The entire CTCN assistance process is illustrated in Diagram 3.
Diagram 3 CTCN assistance process
Source: Author, based on CTCN (2016) and CTCN official website https://www.ctc-n.org/technical-assistance. Accessed on March 10, 2020.
Request Applicant
NDEs
Identify needs and formulate requests in consultation with NDE and experts
Prioritize needs, endorse, and submit requests
All: CTCN, applicant,
NDE, experts
Network
e-system by UNIDO
Consortium
All
Network members participate in bidding process
Request for Assistance Procurement
Support
Implementation Closure
Participation
Step:
Key
player:
Develop response plans in collaboration with experts, NDE and applicant
Design
Implement response plans
Impact review and feedback at closure
CTCN
Monitoring & Evaluation
Eligibility assessment and prioritization of requests

ECLAC Technologies for adapting to climate change... 17
Aside from the Technology Mechanism by UNFCCC, there are global assistance programs to promote technology transfer to developing countries, such as Asian and Pacific Centre for Transfer of Technology (APCTT) under the Economic and Social Commission for Asia and the Pacific (ESCAP) and the Technology Bank for the LDCs. When it comes to sustainable markets for climate technologies, some programs facilitate sharing intellectual properties and building partnerships between public and private sectors, such as the Green Climate Fund-Private Sector Facility, the Eco-Patent Commons of the World Business Council for Sustainable Development, and WIPO GREEN-the Marketable for Sustainable Technology. In particular, the GCF Board agreed in 2016 that GCF supports projects in climate technology development and transfer, and GCF revised Readiness and Preparatory Support Guidebook to reflect the board decision on technologies. As of 2018, six requests for technology related-Readiness Programme have been approved, accounting for USD 1.8 million in total, and diverse technology components have also been included in main projects and programs (GCF, 2018).
As for business incubators of innovative climate technologies, the World Bank Group has supported developing countries through a network of Climate Innovation Centers (CICs) in addition to the Climate-Smart Planning Platform. GCF recently recognized at the Board meeting in 2017 the importance of Innovation and Acceleration (I&A) to enable the application of climate technologies in context-specific conditions. National institutions can also play similar roles, such as the Centre for Innovation, Entrepreneurship and Technology in Brazil and the Centre for Innovation, Incubation and Entrepreneurship in India (UN Inter-agency Task on Financing for Development, 2019).
B. National mechanisms related to adaptation technologies in Korea
The Korean government has implemented combined climate policies focusing on both mitigation and adaptation. As for adaptation, under the Framework Act on Low-Carbon Green Growth and its Enforcement Decree, the government has continued incorporating adaptation strategies into the 5-year national climate change adaptation plans and also obligated local governments to develop and implement city and district-level adaptation action plans. While implementing the 1st National Adaptation Plan 2011~2015, the Korean government invested around USD 256.8 million in R&D of climate adaptation technologies (Korea Government, 2016). In addition, diverse projects have been implemented at the local level with purposes of stimulating local adaptation industries and boosting local economies as well as strengthening local adaptive capacity to climate change.
Table 2 Milestones related to adaptation technology
Year Line ministry Focus Milestone
2005 Joint ministerial decision led by Ministry of Environment
Mitigation/adaptation The 3rd Governmental comprehensive plan on Countermeasure to Climate Change 2005-2007 - Integration of adaptation into the national climate policy
2009 Committee on Green Growth Green growth/mitigation/adaptation
National Strategy for Green Growth 2009-2030
The Five-Year Plan for Green Growth 2009-2013
Joint ministerial decision led by Ministry of Environment
Adaptation National Climate Change Adaptation Master Plan 2009-2030
2010 Joint ministerial decision led by Ministry of Environment
Green growth/mitigation Enactment of the Framework Act on Low Carbon Green Growth
2011 Joint ministerial decision led by Ministry of Environment
Adaptation The 1st National Adaptation Plan 2011-2015 - the first adaptation plan on a legal basis - ground policy for local governments’ action plans
2012 Ministry of Finance Mitigation/adaptation Hosting the Green Climate Fund (GCF)
Ministry of Foreign Affairs Green growth/mitigation/adaptation
Conversion of the Global Green Growth Institute (GGGI) into an international organization
2013 Ministry of Science and ICT Mitigation/adaptation Establishment of Green Technology Center (GTC)
2014 Committee on Green Growth Green growth/mitigation/adaptation
The 2nd Five-Year Plan for Green Growth 2014-2018
ECLAC Technologies for adapting to climate change... 18
Year Line ministry Focus Milestone
Presidential Advisory Council on Science & Technology (PACST)
Mitigation/adaptation The 11th Meeting agenda included technologies for responding to climate change
2016 Joint ministerial decision led by Ministry of Environment
Mitigation/adaptation The 1st Basic Plan for Climate Change Response 2017-2036 - reflection of the Paris Agreement
Adaptation The 2nd National Climate Change Adaptation Plan 2016-2020
SDGs incl. mitigation and adaptation
The 3rd National Basic Plan for Sustainable Development 2016-2035
2018 Ministry of Science and ICT Mitigation/adaptation The Mid- and Long-term Plan for Climate Technology Cooperation 2018-2020
2019 Committee on Green Growth Green growth/mitigation/ adaptation
The 3rd Five-Year Plan for Green Growth 2019-2023
Joint ministerial decision led by Ministry of Environment
Mitigation/adaptation The 2nd Basic Plan for Climate Change Response 2020-2040 - early establishment for adopting the 2030 Reduction Roadmap of Korea
Yearly Ministry of Science and ICT Mitigation/adaptation Annual plan for national investment in R&D
Source: Author, based on the official websites of Ministry of Environment, Ministry of Science and ICT, and Committee on Green Growth.
After the Paris Agreement, Korea has reported its 2030 target of GHG emissions reduction by 37 % compared to business as usual (BAU) levels. To achieve this target, the Korean government established the First Basic Plan for Climate Change Response in 2016, and the Korean Ministry of Science and ICT developed the Mid- and Long-Term Plan for Climate Technology Cooperation 2018-2020. In this plan, the government aims to support by 2030 developing countries’ contribution to global GHG emission reduction, by 5 % (860 million tons) of total amount encouraged by the Parties, as well as prevention and mitigation of climate-related damages to 100 million people by mobilizing USD 10 billion through a variety of national and international financial mechanisms. Five implementation strategies were developed to achieve these long-term targets: investment in R&D of innovative technologies and its customization in developing countries; strengthening cooperation with climate-related multilateral development banks (MDBs) across all stages of projects; developing professionals in climate technologies and strengthening Green Technology Center (GTC) and Climate Technology Information System (CTis); proactively responding to international climate technology initiatives and strengthening cooperation with CTCN; and building a robust national system for inter-ministerial collaboration in climate technologies5.
5 Government 24. https://www.gov.kr/portal/ntnadmNews/1433371.
ECLAC Technologies for adapting to climate change... 19
Diagram 4 National climate technology mechanism
Source: Author, based on the official websites of Ministry of Technology and ICT, GCF and CTCN. a) Green Technology Center; b) National Government Adaptation Committee; c) Export-Import Bank of Korea; d) Economic Development Cooperation Fund; e) Korea Development Bank; f) Korea International Cooperation Agency.
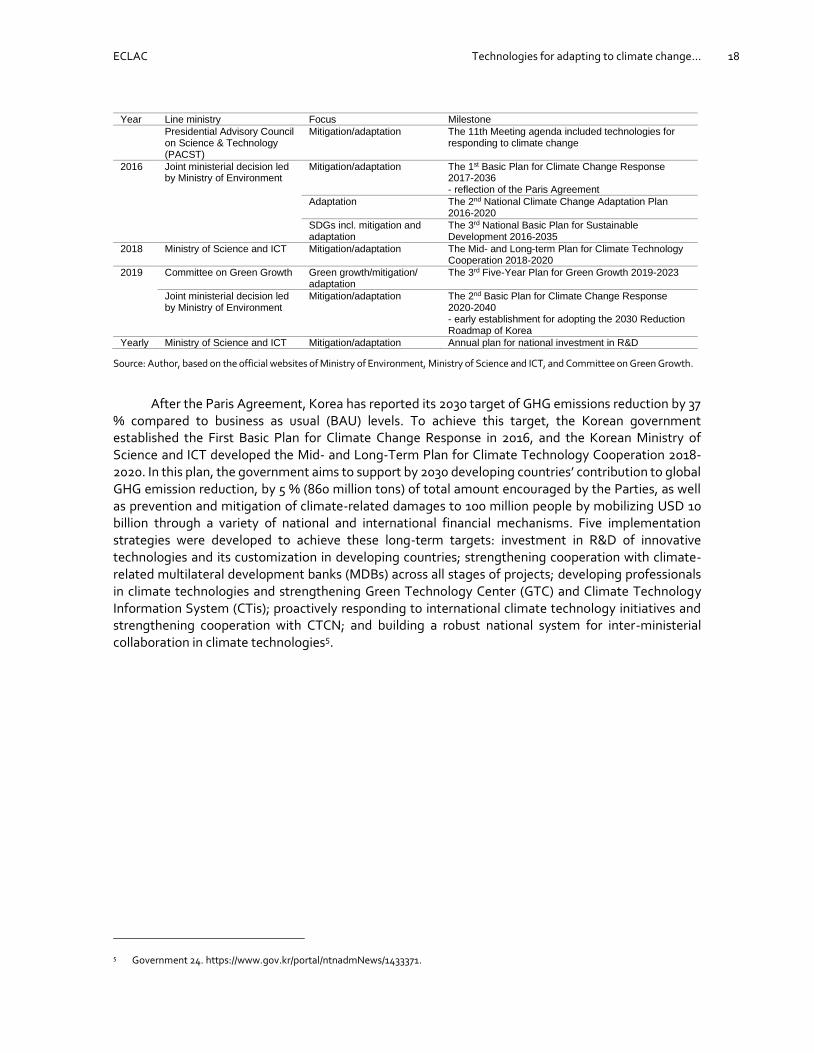
In 2008, the Korean government selected 27 strategic green technologies for responding to climate change, which technologies were categorized into four areas: alternative technologies to fossil fuels, energy efficiency, GHG treatment, and climate impact assessment and adaptation. During the 11th Meeting of the Presidential Advisory Council on Science & Technology in 2014, six technologies were selected as core climate technologies: solar energy, fuel cell, bioenergy, secondary battery, power IT, and carbon capture and storage6. Since the selection criteria focused on global marketability and impacts on national industries, none of the adaptation technologies was included in the core technologies but mentioned as another significant issue in terms of food security and response to disasters. Mitigation technologies are often recognized as more scalable and attractive to private investors than adaptation technologies.
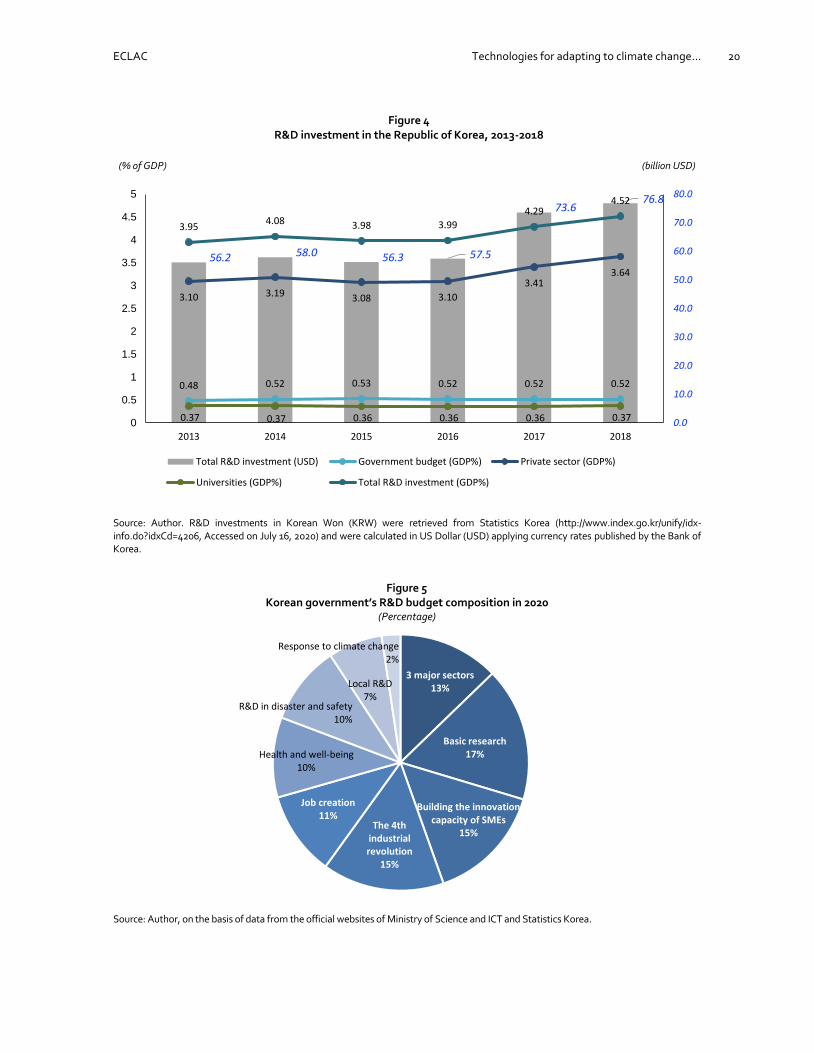
The Korean government has steadily increased the budget on Research and Development (R&D) sector, from USD 11.9 billion in 20107 to USD 18.3 billion in 2019, and to USD 20.9 billion in 20208, nearly doubling its figures in over a decade. With this effort, Korea became the second most innovative country in Asia and the 8th in the world, and its capital city Seoul ranked the third innovative city in the world in 2019 (Cornell University, INSEAD, and WIPO, 2019). Although the budget on ‘response to climate change’ accounts for 2% of the total, other components, such as ‘disaster and safety’, ‘building the Small and Medium-sized Enterprises (SMEs)’ innovation capacity’ and ‘local R&D’, can also directly or indirectly contribute to developing and transferring climate technologies. Key players of these activities are mostly SMEs seeking business opportunities for deploying climate technologies.
6 PACST. https://www.pacst.go.kr/jsp/post/postView.jsp?post_id=253&board_id=10&cpage=5&etc_cd1=C0001#this. Accessed on May 4, 2020.
7 Budget on R&D and average currency exchange rate in 2010 are respectively based on Statistics Korea http://index.go.kr/potal/main/EachDtlPageDetail.do?idx_cd=1330 and the Bank of Korea https://ecos.bok.or.kr/.
8 Budget on R&D and average currency exchange rate in 2019 are respectively based on Ministry of Science and ICT https://www.msit.go.kr/web/msipContents/contentsView.do?cateId=_tsta5511&artId=2680127 and the Bank of Korea https://ecos.bok.or.kr/. Currency exchange rate for government budget in 2020 is 1,190 ₩/$.
ECLAC Technologies for adapting to climate change... 20
56.2 58.0 56.3 57.5
73.676.8
0.48 0.52 0.53 0.52 0.52 0.52
3.10 3.19 3.08 3.10
3.413.64
0.37 0.37 0.36 0.36 0.36 0.37
3.954.08 3.98 3.99
4.294.52
0.0
10.0
20.0
30.0
40.0
50.0
60.0
70.0
80.0
0
0.5
1
1.5
2
2.5
3
3.5
4
4.5
5
2013 2014 2015 2016 2017 2018
Total R&D investment (USD) Government budget (GDP%) Private sector (GDP%)
Universities (GDP%) Total R&D investment (GDP%)
Figure 4 R&D investment in the Republic of Korea, 2013-2018
(% of GDP) (billion USD)
Source: Author. R&D investments in Korean Won (KRW) were retrieved from Statistics Korea (http://www.index.go.kr/unify/idx-info.do?idxCd=4206, Accessed on July 16, 2020) and were calculated in US Dollar (USD) applying currency rates published by the Bank of Korea.
Figure 5
Korean government’s R&D budget composition in 2020 (Percentage)
Source: Author, on the basis of data from the official websites of Ministry of Science and ICT and Statistics Korea.
3 major sectors13%
Basic research17%
Building the innovation capacity of SMEs
15%The 4th
industrial revolution
15%
Job creation11%
Health and well-being10%
R&D in disaster and safety10%
Local R&D7%
Response to climate change2%

ECLAC Technologies for adapting to climate change... 21
In 2013, the Green Technology Center was established as a significant implementor of climate technologies under the Ministry of Science and ICT. The Center has introduced a comprehensive categorization of climate technologies by grouping them into three categories: mitigation, adaptation, and the combined; and after then disaggregating by two layers: sectors and sub-sectors (GTC, 2018). A full list of categories of technologies for mitigation of and adaptation to climate change can be found in Annex 1.
Table 3 Classification of adaptation technologies
Category Sector Sub-sector
Adaptation Agriculture and livestock
Breeding
Crop production
Livestock disease control
Processing, storage, and distribution
Water management Hydrosphere and aquatic ecosystem
Water development and supply
Water treatment
Water-related disaster management
Prediction and monitoring of climate change
Climate prediction and modeling
Climate information and early warning system
Oceans, fisheries, and coasts
Ocean ecology
Fishery resources
Coastal disaster management
Health Infectious diseases management
Food safety and prevention
Forestry and surface Forestry production improvement
Reduction in forest disaster
Monitoring and restoration of ecosystem
Combined: mitigation and adaptation
Cross-cutting Hybrid renewable energy
Low power consumption device
Energy harvesting
Artificial photosynthesis
Other uncategorized climate-related technologies
Source: Climate Technology Information System (CTis). https://www.ctis.re.kr/ko/contents.do?key=1141. Accessed on Jan. 16, 2020.
GTC has recently conducted a study of the statistics of patents in climate technologies developed by private companies and government-funded institutes (GTC, Forthcoming). The result shows that mitigation-related technologies considerably predominate in both private companies and governmental institutes. Looking into private companies in adaptation, almost half of the companies with patents in adaptation have developed technologies in the water sector, followed by agriculture, forestry, health, prediction and monitoring of climate change, and finally, oceans and fisheries. More specifically, the most predominant sub-sectors were water treatment and crop production.

ECLAC Technologies for adapting to climate change... 22
Figure 6 Private companies with patented climate technologies (A)
Companies by category and companies with adaptation technologies by sector (Percentage)
Source: Combined two charts from GTC (Forthcoming, pp. 15, 16).
Figure 7 Private companies with patented climate technologies (B)
Number of companies with patented adaptation and mitigation & adaptation technologies by sub-sector
7
0
6
5
6
3
9
11
2
1
2
2
0
16
12
6
68
26
28
2
5
23
0
0 10 20 30 40 50 60 70 80
Other uncategorized climate related technologies
Artificial photosynthesis
Energy harvesting
Low power consumption device
Hybrid renewable energy
Monitoring and restoration of ecosystem
Reduction in forest disaster
Forestry production improvement
Food safety and prevention
Infectious diseases management
Coastal disaster management
Fishery resources
Ocean ecology
Climate information and early warning system
Climate prediction and modelling
Water-related disaster management
Water treatment
Water development and supply
Hydrosphere and aquatic ecosystem
Processing, storage, and distribution
Livestock disease control
Crop production
Breeding
Cro
ss c
utt
ing
Fore
stry
an
dsu
rfac
eH
ealt
h
Oce
ans,
fish
erie
s, a
nd
coas
ts
Pre
dic
tio
n a
nd
mo
nit
ori
ng
of
clim
ate
chan
ge
Wat
erm
anag
emen
tA
gri
cult
ure
and
lives
tock
Mit
igat
ion
an
dA
dap
tati
on
Ad
apta
tio
n
Source: Combined two charts from GTC (Forthcoming, pp. 19, 20).

ECLAC Technologies for adapting to climate change... 23
When it comes to government-funded institutes, the most predominant sector in adaptation was water similar to private companies, followed by agriculture, prediction and monitoring of climate change, forestry oceans and fisheries, and health. Compared to private companies, government institutes show a higher percentage of patents in water as well as in the prediction and monitoring of climate change. Technologies in prediction and monitoring of climate change are essential to develop sector-specific technologies as well as to support communities to take proper actions to adapt to local climate change. However, these technologies are usually considered less competent in markets since they are mostly public goods. This may be a rationale for governments to invest more in R&D in generating climate-related information, such as the prediction and monitoring of climate change.
Figure 8 Government-funded institutes with patented climate technologies (A)
Institutes by category (Percentage) by sector (Percentage)
Source: Combined two charts from GTC (Forthcoming, pp. 76, 77).

ECLAC Technologies for adapting to climate change... 24
Figure 9 Government-funded institutes with patented climate technologies (B)
Number of institutes with patented adaptation and mitigation & adaptation technologies by sub-sector
Source: Combined two charts from GTC (Forthcoming, pp. 80, 81).
Box 1
Green Technology Center (GTC)
While hosting the Green Climate Fund (GCF) in Songdo and establishing the Global Green Growth Institute (GGGI), the Republic of Korea established the Green Technology Center (GTC, www.gtck.re.kr) in 2012 as a technology arm of climate mechanisms (see Diagram below). The center was initially founded as part of the Korea Institute of Science and Technology (KIST) under the Ministry of Science and ICT and was later converted later into a research center in 2013. The center aims to become a thinktank leading global inclusive and innovative growth by promoting national climate industries and contributing to the global response to climate change. Their primary functions are research on national green and climate technology policies for supporting sustainable societies, and research on strategies for international cooperation in climate technologies.
The center became a member of CTCN of UNFCCC in 2015 and has been leading the Korean CTCN committee since 2016 to boost international and national cooperation in climate technologies. To meet the increased demand for climate information, GTC has launched the Climate Technology Information System (CTis, www.ctis.re.kr) in 2018. This system provides recent information on climate technologies and policies, national climate technology database, international cooperation platform, and a user-friendly data analysis tool.
As for climate technology transfer, GTC supports projects collaborating with international organizations, private companies, and governmental institutions. The center has recently been accredited by the P4G (Partnering for Green Growth and the Global Goals 2030) and developed a project of water management along Mekong river in Vietnam, forming a consortium of three partners: JH Sustain (Korean consulting firm in water management), CLEAN (cleantech cluster based in Denmark), and CRUS (Center for Regional and Urban Studies, based in Ho Chi Minh City).
7
0
6
5
6
3
9
11
2
1
2
2
0
16
12
6
68
26
28
2
5
23
0
0 10 20 30 40 50 60 70 80
Other uncategorized climate related technologies
Artificial photosynthesis
Energy harvesting
Low power consumption device
Hybrid renewable energy
Monitoring and restoration of ecosystem
Reduction in forest disaster
Forestry production improvement
Food safety and prevention
Infectious diseases management
Coastal disaster management
Fishery resources
Ocean ecology
Climate information and early warning system
Climate prediction and modelling
Water-related disaster management
Water treatment
Water development and supply
Hydrosphere and aquatic ecosystem
Processing, storage, and distribution
Livestock disease control
Crop production
Breeding
Cro
ss c
utt
ing
Fore
stry
an
dsu
rfac
eH
ealt
h
Oce
ans,
fish
erie
s, a
nd
coas
ts
Pre
dic
tio
n a
nd
mo
nit
ori
ng
of
clim
ate
chan
geW
ate
rm
anag
emen
tA
gric
ult
ure
an
dliv
esto
ck
Mit
igat
ion
an
dA
dap
tati
on
Ad
apta
tio
n

ECLAC Technologies for adapting to climate change... 25
This project consists of three components: flooding simulation adopting real-time sensor technologies for the
Internet of Things (IoT); development of local strategies for the industrialization of solutions for Mekong Delta; and building global and local partnerships in water management. In Latin America and the Caribbean, GTC held Knowledge Sharing Joint Workshops in Santo Domingo in 2014 and Seoul in 2015, in collaboration with the Dominican Republic governments and IDB. The five agendas were discussed in the workshop: policy trend of R&D in green technologies; smart grid; waste-to-energy; international development cooperation between Korea and Dominican Republic; and IDB’s financing strategy. Particularly, Dominican Republic expressed interest in collaboration with Korea for projects of solid waste treatment and environmentally friendly agriculture technologies.
Diagram
Korea’s global-level institutional cooperation strategy for green growth
Source: Elaborated by author.
Source: Author, on the basis of GTC (www.gtck.re.kr) and CTis (www.ctis.re.kr)


ECLAC Technologies for adapting to climate change... 27
III. Case study Korean cities practices on adaptation technologies
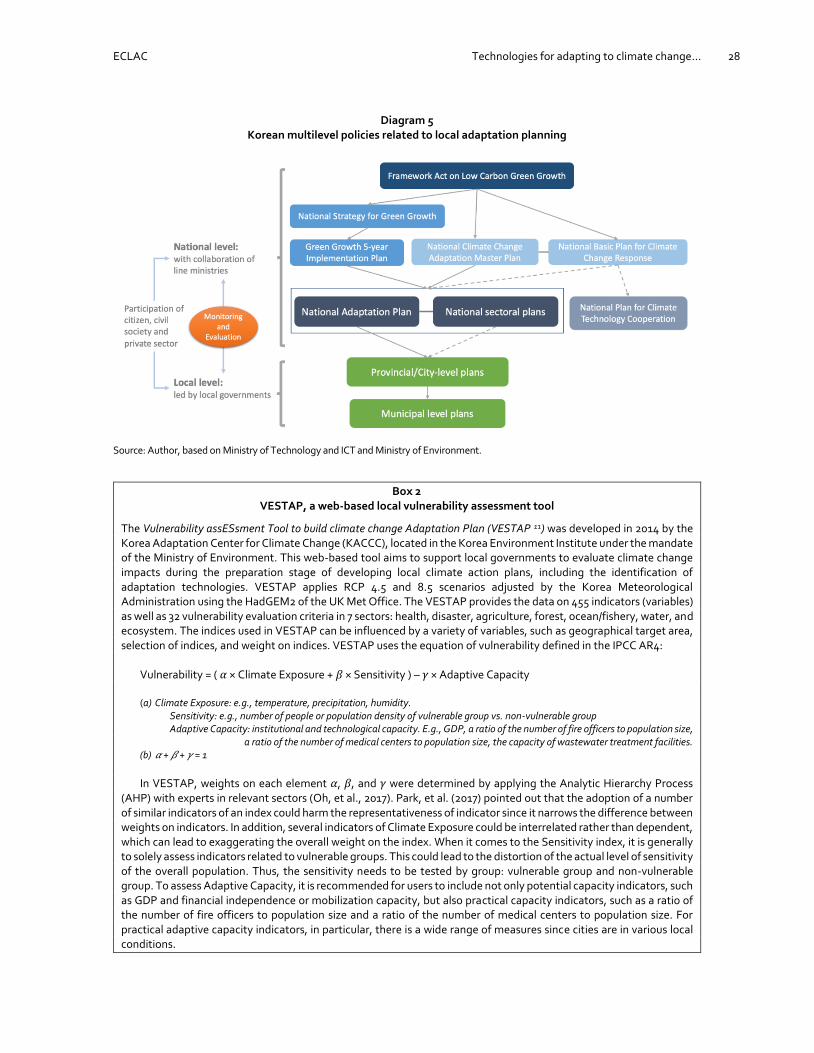
Korean adaptation policies have been developed on the basis of the Framework Act on Low Carbon Green Growth. In addition, since 2015, the green growth framework stipulates that local governments develop climate adaptation action plans every five years. As a result, these local adaptation action plans are expected to be aligned with the National Green Growth Implementation Plan, National Adaptation Plan, and national sectoral plans (see Diagram 5). In 2017, the Ministry of Environment established the 2nd Guideline for Developing Local Climate Change Adaptation Action Plans to support local governments to improve local regulatory basis and its coherency with national-level policies. For local vulnerability studies, a web-based supporting tool, the Vulnerability assESsment Tool to build climate change Adaptation Plan (VESTAP, see Box 2)9 was developed to assist local governments in assessing local climate change impacts. Its results are expected to be used as an essential reference for identifying possible solutions, including adaptation technolog ies.
The recently developed Mid- and Long-term Plan for Climate Technology Cooperation 2018-2020 does not address local level strategies. However, the deployment of technologies on the ground level is crucial for adaptation efforts since each city faces different climatic issues and can be a niche for experimenting with new adaptation technologies in its context. Locally proven technologies and policies can be replicated in other cities experiencing similar climate issues. This replication through multilevel and inter-city cooperation can be realized within the country as well as inter-country. In order to encourage cities to develop and transfer climate technologies in a voluntary and active way, it is necessary to enhance the collaboration of GTC and KACCC so that GTC provides cities with consultation on climate technologies and international cooperation. The KACCC can support cities to improve their understanding of climate technologies and to incorporate them into local adaptation policies in a proper way.
9 VESTAP official website. https://vestap.kei.re.kr/.
ECLAC Technologies for adapting to climate change... 28
Diagram 5 Korean multilevel policies related to local adaptation planning
Source: Author, based on Ministry of Technology and ICT and Ministry of Environment.
Box 2 VESTAP, a web-based local vulnerability assessment tool
The Vulnerability assESsment Tool to build climate change Adaptation Plan (VESTAP 11) was developed in 2014 by the Korea Adaptation Center for Climate Change (KACCC), located in the Korea Environment Institute under the mandate of the Ministry of Environment. This web-based tool aims to support local governments to evaluate climate change impacts during the preparation stage of developing local climate action plans, including the identification of adaptation technologies. VESTAP applies RCP 4.5 and 8.5 scenarios adjusted by the Korea Meteorological Administration using the HadGEM2 of the UK Met Office. The VESTAP provides the data on 455 indicators (variables) as well as 32 vulnerability evaluation criteria in 7 sectors: health, disaster, agriculture, forest, ocean/fishery, water, and ecosystem. The indices used in VESTAP can be influenced by a variety of variables, such as geographical target area, selection of indices, and weight on indices. VESTAP uses the equation of vulnerability defined in the IPCC AR4:
Vulnerability = ( 𝛼 × Climate Exposure + 𝛽 × Sensitivity ) – 𝛾 × Adaptive Capacity (a) Climate Exposure: e.g., temperature, precipitation, humidity. Sensitivity: e.g., number of people or population density of vulnerable group vs. non-vulnerable group Adaptive Capacity: institutional and technological capacity. E.g., GDP, a ratio of the number of fire officers to population size, a ratio of the number of medical centers to population size, the capacity of wastewater treatment facilities. (b) 𝛼 + 𝛽 + 𝛾 = 1
In VESTAP, weights on each element 𝛼, 𝛽, and 𝛾 were determined by applying the Analytic Hierarchy Process
(AHP) with experts in relevant sectors (Oh, et al., 2017). Park, et al. (2017) pointed out that the adoption of a number of similar indicators of an index could harm the representativeness of indicator since it narrows the difference between weights on indicators. In addition, several indicators of Climate Exposure could be interrelated rather than dependent, which can lead to exaggerating the overall weight on the index. When it comes to the Sensitivity index, it is generally to solely assess indicators related to vulnerable groups. This could lead to the distortion of the actual level of sensitivity of the overall population. Thus, the sensitivity needs to be tested by group: vulnerable group and non-vulnerable group. To assess Adaptive Capacity, it is recommended for users to include not only potential capacity indicators, such as GDP and financial independence or mobilization capacity, but also practical capacity indicators, such as a ratio of the number of fire officers to population size and a ratio of the number of medical centers to population size. For practical adaptive capacity indicators, in particular, there is a wide range of measures since cities are in various local conditions.
ECLAC Technologies for adapting to climate change... 29
It is necessary to define standard indicators both at national level and at local level, which can be adjusted to reflect local conditions. On the other hand, there could be indicators related to both sensitivity and adaptive capacity since these two indices commonly include socioeconomic indicators. In this case, a possible way to classify those indicators is that the indicators negatively influencing vulnerability may be included in variables for adaptive capacity, and the indicators influencing the other way around could be considered as sensitivity variables.
Park, et al. (2017) also addressed several limitations of this tool. First, users should apply climate prediction data from multiple climate models since the uncertainty of climate change is significant. Second, VESTAP is a simple assessment tool, and is not appropriate for causal analysis. To overcome this limitation, the integrative assessment model is being developed and expected to launch within 2020. Third, VESTAP does not provide the outlook of indicators related to sensitivity and adaptive capacity.
Despite these limitations, the number of users has continuously increased, including academic institutes, since
the system is recognized as a useful tool in practice.
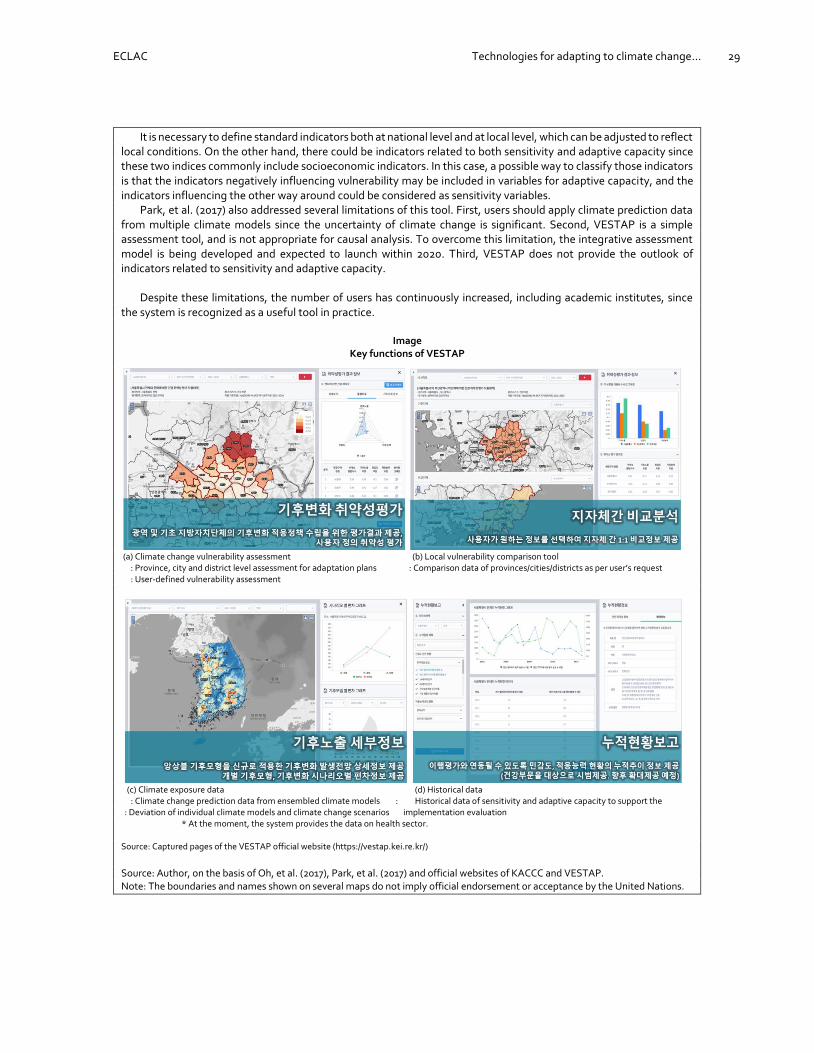
Image Key functions of VESTAP
(a) Climate change vulnerability assessment (b) Local vulnerability comparison tool : Province, city and district level assessment for adaptation plans : Comparison data of provinces/cities/districts as per user’s request : User-defined vulnerability assessment
(c) Climate exposure data (d) Historical data : Climate change prediction data from ensembled climate models : Historical data of sensitivity and adaptive capacity to support the : Deviation of individual climate models and climate change scenarios implementation evaluation * At the moment, the system provides the data on health sector. Source: Captured pages of the VESTAP official website (https://vestap.kei.re.kr/)
Source: Author, on the basis of Oh, et al. (2017), Park, et al. (2017) and official websites of KACCC and VESTAP. Note: The boundaries and names shown on several maps do not imply official endorsement or acceptance by the United Nations.

ECLAC Technologies for adapting to climate change... 30
Local governments’ needs for enhancing institutional basis and financial resources have increased to align with national policies with the adjusted targets under the new international climate regime. Before the development of local adaptation action plans became mandatory, the Korean Ministry of Environment launched a capacity building program for local governments through the Korea Adaptation Center for Climate Change (KACCC) in 2011. The Program for Strengthening Adaptive Capacity of Local Governments and Supporting Localized Adaptation Models has assisted local governments in developing adaptation action plans considering local conditions as well as national policies10. This program is still ongoing and focusing on more practical measures.
Recently, the KACCC published the Guidelines for Climate Change Adaptation Projects, presenting examples of adaptation strategies in seven sectors (health, disaster, agriculture, forestry, ecosystem, water, and ocean/fishery), including adaptation technologies and projects (see Table 4). This guideline is planned to be updated on a regular basis, biannually.
Table 4 Adaptation technologies presented in the Guidelines for Climate Change Adaptation Projects
Category (GTC Classification)
Sub-category (No. of GTC Classification, if applicable)
Type of Technology
Agriculture Crop cultivation and production (24) Improving agricultural facilities (greenhouse, irrigation, etc.)
Livestock disease management (25) Management of livestock and cattle shed
Health Heatwaves Blue roof
Cool roof
Cool pavement
Cool and clean road
Cooling shelter
Green-blue roof
Urban wind paths
Heatwaves / Air quality Facilities for reducing heatwaves and particulate matters: e.g., green bus stations
Air quality Mobile air quality monitoring system
Water Water resources securement and supply (28) Rainwater harvesting
Water disaster management (30) / Coastal disaster management (35)
Porous pavement
Agriculture / Forestry / Health
Crop cultivation and production (24) / Forest production promotion (38) / Forest damage reduction (39) / Heatwaves
Adaptive planting
Health / Forestry Heatwaves / Ecology · monitoring · restoration (40) Green curtain
Green wall
Water / Forestry Water disaster management (30) / Coastal disaster management (35) / Ecology · monitoring · restoration (40)
Bio-retention garden
Rain garden and infiltration planter box
Health / Multidisciplinary Heatwaves / Low-power consumption equipment (42)
Passive house
Heatwaves / Renewable energy hybrid (41) Green building
Heatwaves Green building (reconstruction)
Source: GTC (2018) and KACCC (2020).
10 Korea Adaptation Center for Climate Change (KACCC). https://kaccc.kei.re.kr/portal/main/update/update_view.do?bseq=9217#. Accessed on May 4, 2020.

ECLAC Technologies for adapting to climate change... 31
A. Selection of cities for case study
A special report of the UNFCCC (2006) addressed adaptation technologies in five sectors: coastal zones, water resources, agriculture, public health, and infrastructure. In particular, human health and coastal zones were the two sectors given more emphasis relating to adaptation, while other sectors were addressed in association with both mitigation and adaptation. In terms of human health, heatwaves took a considerable number of lives in 2018, concentrated in Germany, Japan, and India. It is notable that the probability of extreme heat has increased up to 100 times compared to a century ago (Eckstein, et al., 2019). Korea is not the exception, and heatwave has been identified as the meteorological factor most affecting health issues in the country according to the Korea Meteorological Administration (2012). Moreover, the frequency of heatwave is expected to increase 2 to 6 times by 2050 due to climate change.
Cities in Korea are diverse and distinctive in terms of geographic, demographic, and socioeconomic features since Korea is peninsular surrounded by sea and also have several mountain chains penetrating through the territory. Considering these conditions, five cities were selected for analyzing local governments’ practices on adaptation technology: Seoul-inland/mega city, Busan and Incheon-coastal cities, Daegu-intermontane basin city, and Sejong-planned administrative city. Busan and Incheon, the second and third largest cities in Korea, are located in coastal areas facing climatic challenges like coastal floods. Similarly, a significant proportion of the population of Latin America lives along the coast and has experienced climatic issues on livelihoods, including fisheries, along with economic and social losses due to coastal hazards. On the other hand, inland cities like Seoul and Daegu are surrounded by mountains and full of built environments. Inhabitants in these cities struggle with heavy rainfall and extreme heatwaves during summer as well as extreme cold weather during winter. Similar issues can be also observed in the intermontane Latin American cities. Finally, Sejong was established in 2012 as a planned administrative city. As a new-born city, it has become a place for diverse experiments in city development, including climate-related smart technologies.
Map 1 Population distribution map of the Republic of Korea
Source: GWP v4 Population Count, v4.11_2020. https://sedac.ciesin.columbia.edu/data/collection/gpw-v4. Accessed on March 24, 2020. Note: The boundaries and names shown on this map do not imply official endorsement or acceptance by the United Nations.
Seoul Incheo
n
Busan
Daegu
Sejong

ECLAC Technologies for adapting to climate change... 32
The recent 30-year average temperature of Korea (1988-2017) was 1.4℃ higher than that of the beginning of the 20th century (1912-1941). The temperature increase rate is high in the megacity Seoul and the intermontane basin city Daegu. Along with this temperature rise, the number of summer days increased by 19 days, while winter days decreased by 18 days over the last 106 years (1912-2017). When it comes to the extreme cold weather events, it has shown an upward trend over the previous ten years, which is different from the downward 30-year trend. The extent that urbanization has contributed to temperature rise was around 3~11 % over the last 103 years (1912~2014), and it became higher up to 30~45% during 1973~2014 (Park, et al., 2017). Heatwave affects Particulate Matter (PM) concentrations in the air, which can cause adverse effects on public health. Thus, it is necessary to look into statistics related to PM2.5. The number of premature deaths in Korea due to PM2.5 increased by 21 %, from 15,100 in 1990 to 18,200 in 2015, while the average of other OECD countries decreased by 9 %. Considering the number of premature deaths per 100,000 inhabitants, the number in Korea decreased from 68 deaths in 1990 to 27 deaths in 2015, but this level is still higher than that of the USA, Japan, and Germany. OECD warned in their report in 2016 that Korea could become the most vulnerable OECD member to PM2.5 and O3 if the country would not adequately tackle the issue (Kim, et al., 2018). When it comes to precipitation, a noticeable point is that its variation has increased significantly. In addition, the 30-year average precipitation (1988-2017) increased by 124 mm, compared to the period of 1912-1941 (NIMS, 2018).
Table 5 Key features of the five target cities
Source: Author, on the basis of data from Korean Statistical Information System (KOSIS) and Korea Meteorological Administration (KMA). a), b) 2018, c) 2018, KOSIS data updated on December 23, 2019, d), e) 1981-2010. KMA. data.kma.go.kr, f) Sejong City was established in 2007, so the data is not available since the city has a limited climatic data of a relatively short period of time.
The recent document of KACCC (2020) highlighted that over 90 % of the natural disasters in Korea has been caused by meteorological factor, including heavy rainfalls and typhoons accounting for over 80%. On the other hand, there were also severe droughts from 2000 to 2010, and around 400,000 inhabitants from 109 municipalities were provided intermittent water services. The level of extreme hot and cold weather events is expected to become more severe as global warming continues.
In 2020, the unprecedentedly long period of monsoon drenched all around the country. Average length of monsoon season in Korea is around 32 days, however it lasted for over 50 days in 2020. Moreover, the Typhoon Jangmi followed right after this season and contributed to increasing risks in flooding and landslide. The duration of the monsoon was not the main issue but the severity of the rainfall. The severe heavy rainfall rapidly went beyond the capacity of national water management facilities. According to the Ministry of Environment, it is estimated to hold the record ever in the last 500 years. Through this event, the needs for strengthening the water management of small rivers in addition to main rivers have received more attention for a better adaptation to climatic change.
City Category Population: Number of inhabitants (National Rank)a
Urban density (thousand inhab./km2)b
GDP per capita (USD)c
30-year average no. of days above 33℃ (days)d/ year 2018 (days)
30-year average annual/ summer/winter precipitation (mm)e
Seoul Capital/inland/ megacity
9 673 936 (1) 16 034 43 525 6.6 / 35 1 450.5 / 892.1 / 67.3
Busan Coastal city 3 395 278 (2) 4 416 26 390 2.7 / 18 1 519.1 / 778.6 / 106.9
Incheon Coastal city 2 936 117 (3) 2 764 30 076 3.4 / 20 1 234.4 / 717.4 / 60.7
Daegu City in a mountain basin
2 444 412 (4) 2 773 23 132 23.2 / 40 1 064.4 / 602.5 / 63.7
Sejong Planned administrative city
312 374 (34) 653 36 592 N/Af) 1 239.1 / 711.9 / 80.8
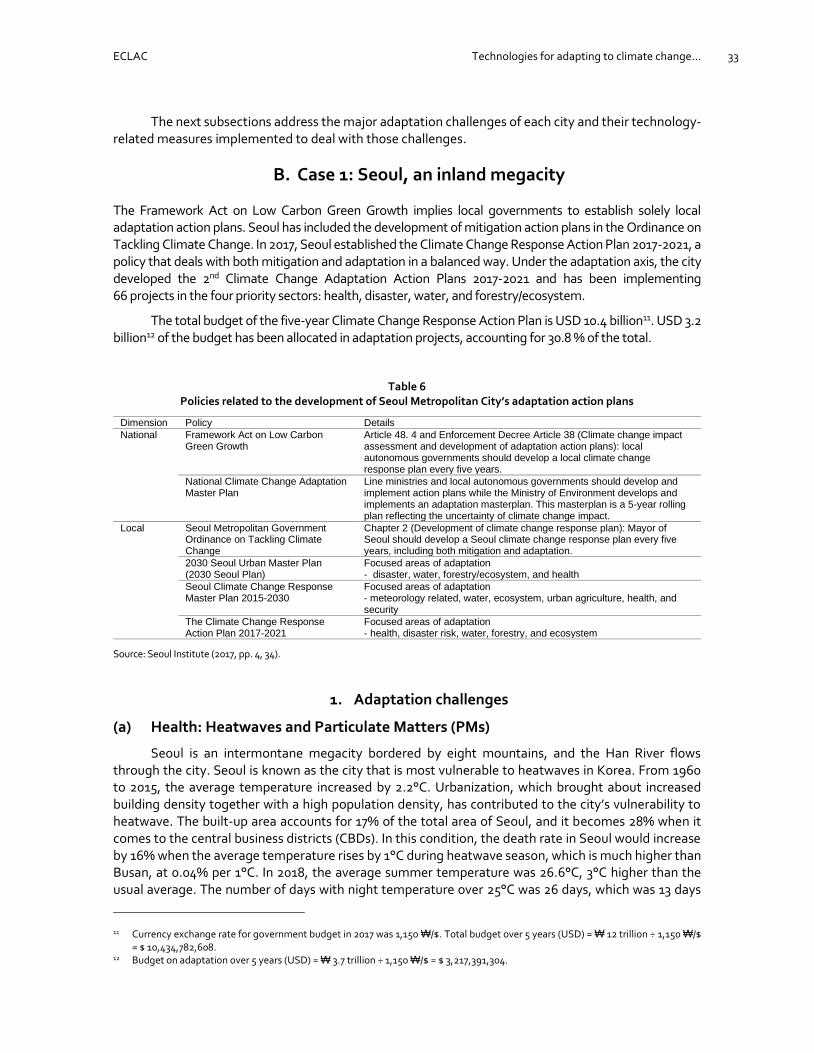
ECLAC Technologies for adapting to climate change... 33
The next subsections address the major adaptation challenges of each city and their technology-related measures implemented to deal with those challenges.
B. Case 1: Seoul, an inland megacity
The Framework Act on Low Carbon Green Growth implies local governments to establish solely local adaptation action plans. Seoul has included the development of mitigation action plans in the Ordinance on Tackling Climate Change. In 2017, Seoul established the Climate Change Response Action Plan 2017-2021, a policy that deals with both mitigation and adaptation in a balanced way. Under the adaptation axis, the city developed the 2nd Climate Change Adaptation Action Plans 2017-2021 and has been implementing 66 projects in the four priority sectors: health, disaster, water, and forestry/ecosystem.
The total budget of the five-year Climate Change Response Action Plan is USD 10.4 billion11. USD 3.2 billion12 of the budget has been allocated in adaptation projects, accounting for 30.8 % of the total.
Table 6 Policies related to the development of Seoul Metropolitan City’s adaptation action plans
Dimension Policy Details
National Framework Act on Low Carbon Green Growth
Article 48. 4 and Enforcement Decree Article 38 (Climate change impact assessment and development of adaptation action plans): local autonomous governments should develop a local climate change response plan every five years.
National Climate Change Adaptation Master Plan
Line ministries and local autonomous governments should develop and implement action plans while the Ministry of Environment develops and implements an adaptation masterplan. This masterplan is a 5-year rolling plan reflecting the uncertainty of climate change impact.
Local Seoul Metropolitan Government Ordinance on Tackling Climate Change
Chapter 2 (Development of climate change response plan): Mayor of Seoul should develop a Seoul climate change response plan every five years, including both mitigation and adaptation.
2030 Seoul Urban Master Plan (2030 Seoul Plan)
Focused areas of adaptation - disaster, water, forestry/ecosystem, and health
Seoul Climate Change Response Master Plan 2015-2030
Focused areas of adaptation - meteorology related, water, ecosystem, urban agriculture, health, and security
The Climate Change Response Action Plan 2017-2021
Focused areas of adaptation - health, disaster risk, water, forestry, and ecosystem
Source: Seoul Institute (2017, pp. 4, 34).
1. Adaptation challenges
(a) Health: Heatwaves and Particulate Matters (PMs)
Seoul is an intermontane megacity bordered by eight mountains, and the Han River flows through the city. Seoul is known as the city that is most vulnerable to heatwaves in Korea. From 1960 to 2015, the average temperature increased by 2.2°C. Urbanization, which brought about increased building density together with a high population density, has contributed to the city’s vulnerability to heatwave. The built-up area accounts for 17% of the total area of Seoul, and it becomes 28% when it comes to the central business districts (CBDs). In this condition, the death rate in Seoul would increase by 16% when the average temperature rises by 1°C during heatwave season, which is much higher than Busan, at 0.04% per 1°C. In 2018, the average summer temperature was 26.6°C, 3°C higher than the usual average. The number of days with night temperature over 25°C was 26 days, which was 13 days
11 Currency exchange rate for government budget in 2017 was 1,150 ₩/$. Total budget over 5 years (USD) = ₩ 12 trillion ÷ 1,150 ₩/$ = $ 10,434,782,608.
12 Budget on adaptation over 5 years (USD) = ₩ 3.7 trillion ÷ 1,150 ₩/$ = $ 3,217,391,304.

ECLAC Technologies for adapting to climate change... 34
longer than the previous year. Moreover, the summer temperature rose to 39.6°C, which figure renewed the record of the highest temperature of Seoul. Due to this severe heatwave in 2018, the number of excess death was 19.8 people per 10 million inhabitants, which was the second-highest number following Incheon and 2.9 times as many as Daegu (Cho & Lee, 2018). A recent study by Shim (2018) discovered that the Seoul bus transit center next to the Seoul station showed the highest heatwave risk index, followed by the Gangnam metro station (see Map 2).
Map 2 Heatwave risk map: Seoul
Source: Adapted from Shim (2018, p. 15). Shim (2018) calculated the heatwave risk index adopting environmental factors (the highest temperature, rivers/streams, and green areas), and efficiency factors (user density of respective bus station and metro), and social equality factors (welfare centers for old or disabled people). This map was made based on the data as of August 5, 2017 when the temperature reached a pick in its history. Note: The boundaries and names shown on this map do not imply official endorsement or acceptance by the United Nations.
Apart from the aforementioned impact on health, it has recently been proven that heatwave is correlated with air quality, especially Particulate Matter (PM) concentrations and O3, which eventually leads to a higher risk of public health. The higher temperature and more blocking highs/stagnation, the higher PMs along with biogenic Volatile Organic Compounds (VOCs) and O3 and the more pollution are built-up in the air. The increased PM in the air influences respiratory diseases, diabetes, and possibly cognitive aging, thus WHO has defined PM as a carcinogen. Like other climatic impacts, infants and aged people are vulnerable to them (Doherty, et al., 2017; Dean & Green, 2018; Yang, 2019). This is also the case in Seoul. The absolute amounts of PM2.5 and PM10 in Seoul slightly decreased from 2016 to 2018, however, the ratio of PM2.5 to PM10 increased. In 2017, the level of PM2.5 in Seoul was higher than the WHO recommendation for 139 days. Looking at the number of premature deaths due to PM2.5, Seoul showed the highest number out of eight major cities in Korea, which registered 1,763 deaths in 2015, followed by Busan, Daegu, and Gwangju (Kim, et al., 2018).
(b) Urban Disaster: Flooding
Since the Han River has ample curves of meandering rivers, with a length that is relatively short considering its width, the city is susceptible to floods. Looking at the meteorological trend (see Figure 10), besides the geographical and topographical conditions, the variation of precipitation has increased noticeably, and it became more unpredictable. Moreover, when it comes to the number of days of heavy rainfall (30mm/hour or more), the numbers in recent years have increased significantly, up to trifold,
Heatwave Risk Index
Seoul bus transit center
Gangnam metro station
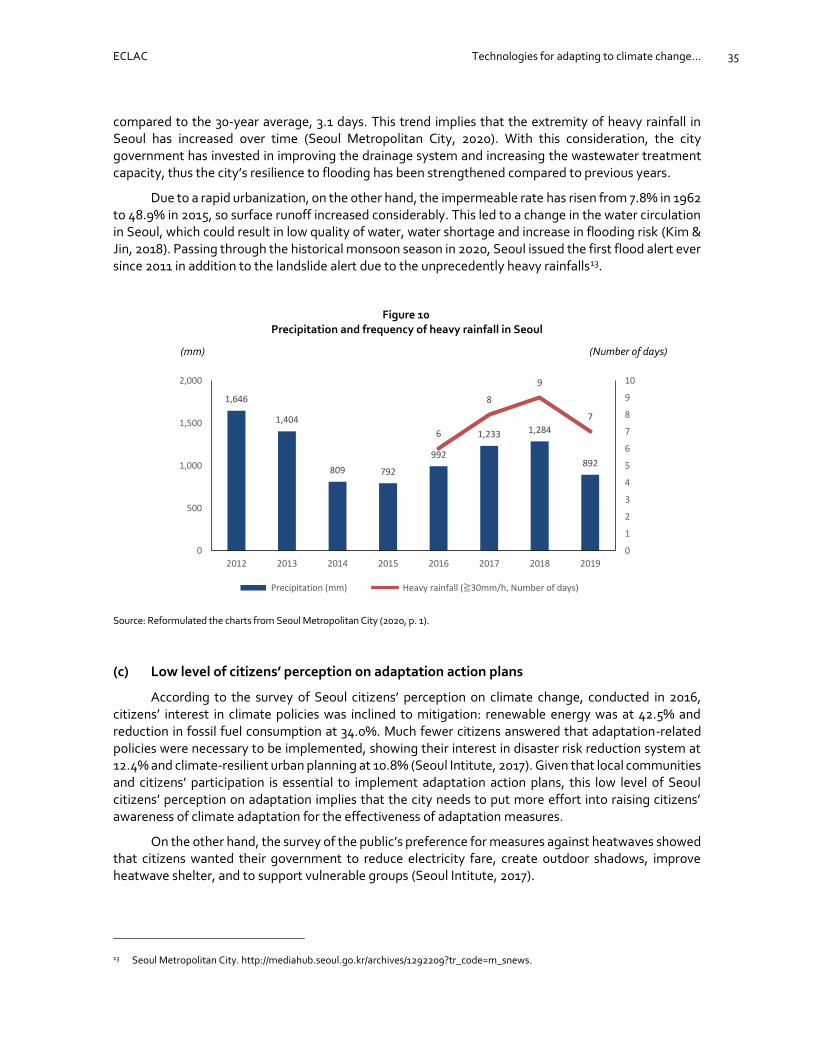
ECLAC Technologies for adapting to climate change... 35
compared to the 30-year average, 3.1 days. This trend implies that the extremity of heavy rainfall in Seoul has increased over time (Seoul Metropolitan City, 2020). With this consideration, the city government has invested in improving the drainage system and increasing the wastewater treatment capacity, thus the city’s resilience to flooding has been strengthened compared to previous years.
Due to a rapid urbanization, on the other hand, the impermeable rate has risen from 7.8% in 1962 to 48.9% in 2015, so surface runoff increased considerably. This led to a change in the water circulation in Seoul, which could result in low quality of water, water shortage and increase in flooding risk (Kim & Jin, 2018). Passing through the historical monsoon season in 2020, Seoul issued the first flood alert ever since 2011 in addition to the landslide alert due to the unprecedently heavy rainfalls13.
Figure 10 Precipitation and frequency of heavy rainfall in Seoul
(mm) (Number of days)
Source: Reformulated the charts from Seoul Metropolitan City (2020, p. 1).
(c) Low level of citizens’ perception on adaptation action plans
According to the survey of Seoul citizens’ perception on climate change, conducted in 2016, citizens’ interest in climate policies was inclined to mitigation: renewable energy was at 42.5% and reduction in fossil fuel consumption at 34.0%. Much fewer citizens answered that adaptation-related policies were necessary to be implemented, showing their interest in disaster risk reduction system at 12.4% and climate-resilient urban planning at 10.8% (Seoul Intitute, 2017). Given that local communities and citizens’ participation is essential to implement adaptation action plans, this low level of Seoul citizens’ perception on adaptation implies that the city needs to put more effort into raising citizens’ awareness of climate adaptation for the effectiveness of adaptation measures.
On the other hand, the survey of the public’s preference for measures against heatwaves showed that citizens wanted their government to reduce electricity fare, create outdoor shadows, improve heatwave shelter, and to support vulnerable groups (Seoul Intitute, 2017).
13 Seoul Metropolitan City. http://mediahub.seoul.go.kr/archives/1292209?tr_code=m_snews.
1,646
1,404
809 792
992
1,233 1,284
892
6
8
9
7
0
1
2
3
4
5
6
7
8
9
10
0
500
1,000
1,500
2,000
2012 2013 2014 2015 2016 2017 2018 2019
Precipitation (mm) Heavy rainfall (≧30mm/h, Number of days)

ECLAC Technologies for adapting to climate change... 36
2. Adaptation technologies in practice
In 2018, the city government implemented 62 projects in four focused sectors aiming to adapt to climate change: health (15 projects), disasters (18), water (9), and forestry/ecosystem (20). A full list of projects, including both mitigation and adaptation, is presented in Annex 2, and technological adaptation projects are listed in Table 7. One of the common features of newly adopted adaptation technologies is the utilization of Information and Communications Technology (ICT), which is similarly observed in mitigation technologies.
Table 7 Technological adaptation projects of Seoul in 2018
Sector Adaptation Challenge
Project Category by GTC
Health Heatwave Enhancement of heatwave reduction and information system
- (10) Climate prediction and monitoring: 32. Climate information and early warning system - (12) Health
Pilot project of cooling fog system - (12) Health
Air pollution
Air quality forecast and early warning system
- (10) Climate prediction and monitoring: 32. Climate information and early warning system
Air pollution monitoring network
- (10) Climate prediction and monitoring: 32. Climate information and early warning system
Legalization of the use of the eco-friendly construction equipment
- (14) Interdisciplinary: 45. Others
Cleaning roads using dust vacuum/water spray
- (14) Interdisciplinary: 45. Others
Disaster Heavy snow
Auto snow/ice removal liquid spray - (14) Interdisciplinary: 45. Others
Flood Flood forecasting and EWS - (9) Water: 30. Water disaster management
Disaster information map - (9) Water: 30. Water disaster management - (10) Climate prediction and monitoring: 32. Climate information and early warning system
Improvement of drainage system - (9) Water: 29. Water treatment, and 30. Water disaster management
Management of Flood Safety Index of flood-prone areas
- (9) Water: 30. Water disaster management
Water Water security
Expansion of water reuse facilities - (9) Water: 28. Water resources, and 29. Water treatment
Minimizing the leakage from pipelines - (9) Water: 28. Water resources, and 29. Water treatment
Expansion of Combined Sewer Overflows (CSOs) retention facilities
- (9) Water: 29. Water treatment, and 30. Water disaster management
Expansion of CSO/WWF treatment facilities at water recycling centers
- (9) Water: 28. Water resources, and 29. Water treatment
Forestry/ Ecosystem
Flood Heatwave Ecosystem
Urban green street to prevent from heat islands and impacts of heavy rainfall
- (9) Water: 30. Water disaster management - (12) Health - (13) Forestry: 40. Ecosystem, monitoring, restoration
Urban garden and green roof - (8) Agriculture: 24. Cultivation and production - (12) Health - (13) Forestry: 40. Ecosystem, monitoring, restoration
Greening the building’s concrete surfaces - (12) Health - (13) Forestry: 40. Ecosystem, monitoring, restoration
Piloting green curtain plants projects to reduce energy consumption
- (6) Energy demand: 20. Building efficiency - (12) Health - (13) Forestry: 40. Ecosystem, monitoring, restoration
Agriculture Development and deployment of urban plant factory model
- (8) Agriculture: 24. Cultivation and production, 26. Processing, conservation, logistics
Source: Author, on the basis of Seoul Metropolitan City (2019).
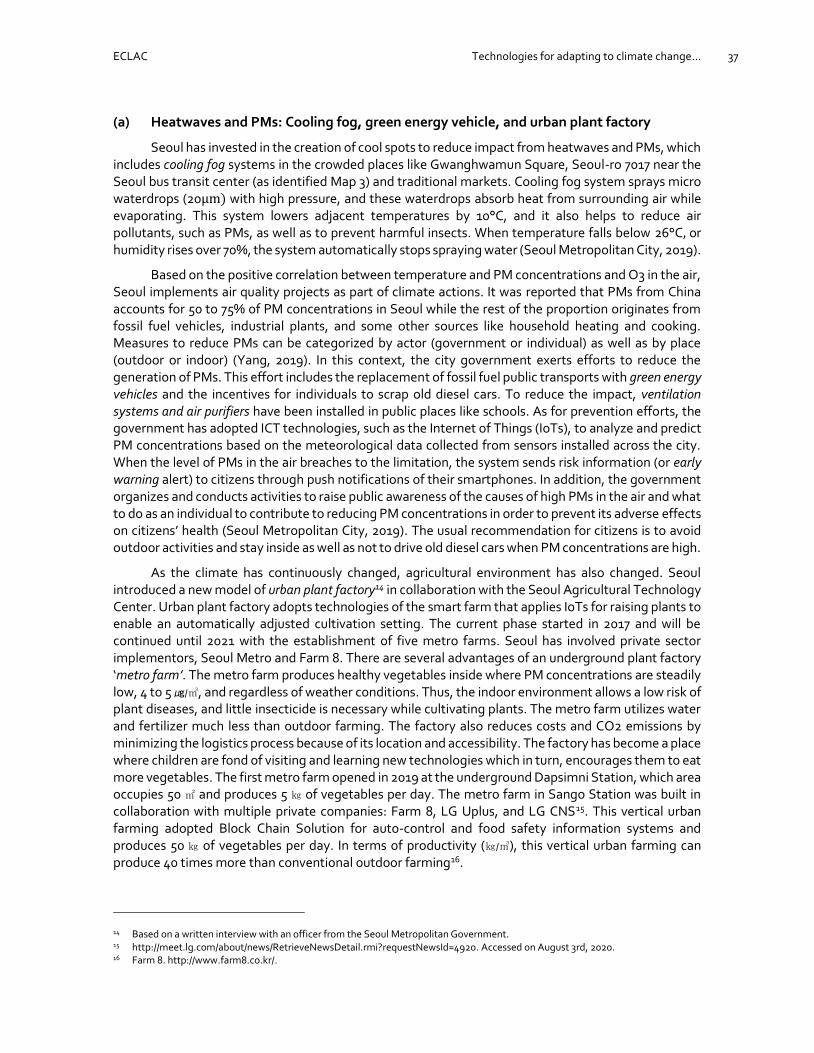
ECLAC Technologies for adapting to climate change... 37
(a) Heatwaves and PMs: Cooling fog, green energy vehicle, and urban plant factory
Seoul has invested in the creation of cool spots to reduce impact from heatwaves and PMs, which includes cooling fog systems in the crowded places like Gwanghwamun Square, Seoul-ro 7017 near the Seoul bus transit center (as identified Map 3) and traditional markets. Cooling fog system sprays micro waterdrops (20µm) with high pressure, and these waterdrops absorb heat from surrounding air while evaporating. This system lowers adjacent temperatures by 10°C, and it also helps to reduce air pollutants, such as PMs, as well as to prevent harmful insects. When temperature falls below 26°C, or humidity rises over 70%, the system automatically stops spraying water (Seoul Metropolitan City, 2019).
Based on the positive correlation between temperature and PM concentrations and O3 in the air, Seoul implements air quality projects as part of climate actions. It was reported that PMs from China accounts for 50 to 75% of PM concentrations in Seoul while the rest of the proportion originates from fossil fuel vehicles, industrial plants, and some other sources like household heating and cooking. Measures to reduce PMs can be categorized by actor (government or individual) as well as by place (outdoor or indoor) (Yang, 2019). In this context, the city government exerts efforts to reduce the generation of PMs. This effort includes the replacement of fossil fuel public transports with green energy vehicles and the incentives for individuals to scrap old diesel cars. To reduce the impact, ventilation systems and air purifiers have been installed in public places like schools. As for prevention efforts, the government has adopted ICT technologies, such as the Internet of Things (IoTs), to analyze and predict PM concentrations based on the meteorological data collected from sensors installed across the city. When the level of PMs in the air breaches to the limitation, the system sends risk information (or early warning alert) to citizens through push notifications of their smartphones. In addition, the government organizes and conducts activities to raise public awareness of the causes of high PMs in the air and what to do as an individual to contribute to reducing PM concentrations in order to prevent its adverse effects on citizens’ health (Seoul Metropolitan City, 2019). The usual recommendation for citizens is to avoid outdoor activities and stay inside as well as not to drive old diesel cars when PM concentrations are high.
As the climate has continuously changed, agricultural environment has also changed. Seoul introduced a new model of urban plant factory14 in collaboration with the Seoul Agricultural Technology Center. Urban plant factory adopts technologies of the smart farm that applies IoTs for raising plants to enable an automatically adjusted cultivation setting. The current phase started in 2017 and will be continued until 2021 with the establishment of five metro farms. Seoul has involved private sector implementors, Seoul Metro and Farm 8. There are several advantages of an underground plant factory ‘metro farm’. The metro farm produces healthy vegetables inside where PM concentrations are steadily low, 4 to 5 ㎍/㎥, and regardless of weather conditions. Thus, the indoor environment allows a low risk of plant diseases, and little insecticide is necessary while cultivating plants. The metro farm utilizes water and fertilizer much less than outdoor farming. The factory also reduces costs and CO2 emissions by minimizing the logistics process because of its location and accessibility. The factory has become a place where children are fond of visiting and learning new technologies which in turn, encourages them to eat more vegetables. The first metro farm opened in 2019 at the underground Dapsimni Station, which area occupies 50 ㎡ and produces 5 ㎏ of vegetables per day. The metro farm in Sango Station was built in collaboration with multiple private companies: Farm 8, LG Uplus, and LG CNS15. This vertical urban farming adopted Block Chain Solution for auto-control and food safety information systems and produces 50 ㎏ of vegetables per day. In terms of productivity (㎏/㎥), this vertical urban farming can produce 40 times more than conventional outdoor farming16.
14 Based on a written interview with an officer from the Seoul Metropolitan Government. 15 http://meet.lg.com/about/news/RetrieveNewsDetail.rmi?requestNewsId=4920. Accessed on August 3rd, 2020. 16 Farm 8. http://www.farm8.co.kr/.
ECLAC Technologies for adapting to climate change... 38
Image 1 Metro farms in Seoul
Dapsimni Station Sangdo Station Metro Farm Academy in Sangdo Station
Source: Adapted from the Farm 8 official website. http://www.farm8.co.kr/. Accessed on July 8, 2020.
In the 10-year Future Maps of Seoul (Seoul Metropolitan Government, 2020), one of major
programs is the improvement of public transportation system and the development of multi -level road system, which aims to resolve traffic congestions by extending green infra for public transportation as well as to transform roads into green spaces by developing underground roadways. Though this program, the city expects to promote the use of green public transportation and have more green spaces enhancing the city’s adaptive capacity to climate change.
(b) Flooding: Low Impact Development (LID), disaster information map, and early warning system
(i) Technologies for Low Impact Development (LID)
The Seoul city government established the Water Cycle Master Plan in 2004 and the Rainwater Management Master Plan in 2007. To address the criticism on the approach inclined to rainwater management, the Low Impact Development (LID), aiming to minimize the negative impact on urban and environmental aspects, has been incorporated into the Comprehensive Planning for Creating Healthy Water Circulation City. The city has operated 42 projects aiming to reduce run-offs, reuse rainwater, and further restore a natural water cycle. Permeable retention facilities were given the largest investment, followed by permeable pavements. The policy has promoted rainwater retention garden, permeable drainage system, rainwater retention roof (or green roof), ecological retention pond, invention of rain barrel ‘Seoul Chomhang’, water reuse system in Magok district, and development of rainwater villages. Previous projects were still related to the rainwater management technologies although a water cycle that involves cross-cutting issues such as built environments, green areas, and flooding risks, which are basically local-focused sectors. In the next phase, projects are to be reframed considering district-level conditions. For instance, the retention facility quota was previously only applied to new constructions, and has recently been extended to the existing infrastructure (Kim & Jin, 2018; Seoul Solution, 2018).
(ii) Disaster information map and early warning system
As for sharing information with citizens, the city formulates and updates a disaster information map using a GIS technology. This map contains the information necessary for citizens in a water-related emergency, including locations of emergency shelters, hospitals and municipal offices as well as the previously flooded and expected flooding areas (see Image 2). An example of county-level comprehensive disaster information map is presented in Annex 3. Seoul also operates flooding forecast

ECLAC Technologies for adapting to climate change... 39
and early warning systems to help citizens prepare against the forecasted flash rainfalls and evacuate on time17. A ‘Seoul Safety App’ was created to ease the access to information.
In 2020, Seoul has planned to improve the precision of the flooding early warning system for better preparedness for flash rainfalls. The city government operates an independent unit for analyzing weather data to compliment the information from KMA. The program includes installing CCTVs, automated warning devices, electronic letter signs, turn-lights (usually red) and automated access control systems in the passages near rivers and construction sites. In addition, the city government is investing in extending rivers and sewage pipes as well as installing additional rainwater retention facilities and rainwater pump stations (Seoul Metropolitan City, 2020).
Image 2 Disaster information map: national portal and Seoul portal
A. National portal: province to district levels
B. Seoul portal: district to county levels
Source: A. Seoul’s city-level map was retrieved from the National Disaster Safety Portal http://www.safekorea.go.kr/idsiSFK/neo/sfk/cs/sfc/ map/disasterMapMain.jsp?menuSeq=714; B. County-level map was retrieved from the Seoul Safety Nuri Portal. http://safecity.seoul.go.kr: 8070/scmyn_cf/map/cfMap.do?type=ds_area#.
17 Seoul Safety Nuri (in Korean 서울안전누리, https://safecity.seoul.go.kr/ ) provides a variety of safety information on disasters and
accidents. A real-time traffic information reflecting disasters and accidents can be found in TOPIS (https://topis.seoul.go.kr/).

ECLAC Technologies for adapting to climate change... 40
(c) Raising public awareness of adaptation
To assist citizens in enhancing their knowledge and preparedness of climate issues, Seoul’s city government developed the guidelines including instructions for responding to heatwaves, PMs, and flooding as well as climate-related health management information, along with the manuals by vulnerable groups and areas considering their distinctive conditions. In the course of assisting citizens, communications technologies are essential for the city government to send warnings through media, Social Network Service (SNS), and mobile services.
In 2018, the city government executed public relations activities through the use of electric bulletin boards (81,467 ads), newspapers (151), broadcasting (827), SNS (1,514), and mobile texts (4,132), making up 88,091 in total. Some of these activities aimed for providing citizens with appropriate information on PMs to promote green actions as well as to keep themselves healthy by taking proper actions when the PM warning system signals red. Additionally, the city distributed leaflets of the manual of how to respond to heatwaves (10,000 copies) (Seoul Metropolitan City, 2019).
C. Case 2: Busan and Incheon, coastal cities (port cities)
1. Adaptation challenges
(a) Flooding
KACCC (2020) reported that the sea level of the Korean peninsula rose by 8 cm from 1964 to 2006. In particular, Jeju Island showed a rise of 22cm over the same period, which surpassed the global average rate of sea level rise. Due to this trend, there are increased risks in flooding as well as loss of wetlands and fisheries resources. In addition, the sea surface temperature increased 1.3 ℃ from 1964 to 2006, which was also a faster rate than the global trend, about trifold. The increase rate was the highest in the western coasts near Incheon and Seoul since the ocean depth near Incheon is shallower than other coastal areas (See Map 3.B.). The climate change vulnerability assessment of Incheon showed that flooding risk was high in Incheon, so the city has implemented flooding prevention projects in lowlands as well as promoted the Storm and Flood Insurance. On the other hand, the water shortage is expected in the islands of Incheon due to a prolonged drought (Incheon Metropolitan City, 2017).
In the climate change vulnerability assessment of Busan, a high score was observed in the Exposure to sea-level rise and flooding while their adaptive capacity was low. The assessment result implied that ‘disaster’ was the most vulnerable sector, followed by health. The tendency of heavy rainfall has become more unpredictable and intense; thus, the flooding risk has also increased. In detail, the number of rainy days decreased from 101.4 days (average 1951-1960) to 95.0 days (2018) while the
amount of precipitation rose from 1,413.8 ㎜ (average 1951-1960) to 1,778.6 ㎜ (2018) (Busan Metropolitan City, 2019). Conversely, the shortened rainy days and intensive rainfall imply a longer period of no rain, which leads to a higher risk of drought. In reality, the productivity of agriculture and aquaculture have reduced, and water provision is projected to be unstable in the near future.
As Map 3.C. illustrates, the geographic conditions of Busan are diverse: shallow to deep sea, mountains, and the Nakdong River. When heavy rainfall strikes the city, water flows from the mountains and joins the streams in the city adding more flooding risks in addition to coastal floods. Historically, some parts of Busan were built with informal houses during the Korean War since this city was once the only one safe place and was full of refugees during that period. Some of those areas still remain with deteriorated buildings and poor sewage systems. Even a newly formed luxurious residential area ‘Marine City’ has been affected by flooding every year. Skyscrapers stand right along the coastline, and breakwaters were built lower than the recommended height since residents opposed to the construction of taller breakwaters for an aesthetic reason.

ECLAC Technologies for adapting to climate change... 41
Map 3 Ocean depth and topographic map
A. Korean peninsula and surrounding countries
B. Incheon C. Busan
Source: Retrieved from NOAAa) Bathymetric Data Viewerb). https://maps.ngdc.noaa.gov/viewers/bathymetry/. a) NOAA: National Centers for Environmental Information (NOAA), National Oceanic and Atmospheric Administration of the USA. b) Applied the Basemap-GEPCO_2019 (NOAA NCEI Visualization) and the Digital Elevation Models (DEM)-Color Shaded Relief-All DEMs. Note: The boundaries and names shown on several maps do not imply official endorsement or acceptance by the United Nations.
(b) Heatwave and PMs
Heatwave is one of the main climatic issues for Busan and Incheon. In Busan, particularly, some areas were uncontrollably developed during the Korean War, and some of those areas have not improved enough since then and remained with high densities of population and aged buildings. Residents in these areas are mostly old people who are recognized as the most vulnerable to heatwaves, and they are in a higher risk of heat-related diseases under these poor housing conditions.
In the meteorological aspect, annual average temperature of Busan had risen from 13.9℃ (average
1951-1960) to 15.1℃ (2018), and the number of heatwaves had increased from 0.8 days (average 1951-1960)
to 18 days (2018). With this change, the number of patients of heat-related diseases also showed a significant increase, from 34 people in 2015 to 208 in 2018 (Busan Metropolitan City, 2019).
With regard to PMs in Incheon, the most influential contributor to PM10 during 2006-2013 was the mobile sources accounting for 48.2% of the total, which were mainly heavy transport vehicles from the Incheon Port, landfill site, and industrial complex (Yoo, et al., 2017).
Russia
China Japan South Korea
North Korea
ECLAC Technologies for adapting to climate change... 42
2. Adaptation technologies in practice
(a) Flooding
(i) Smart Technologies for Disaster Information System
As for specific policy efforts related to heavy rainfall, Busan established the Master Plan for Reducing Flood and Storm-related Disasters. To enhance the disaster response system, Busan formed a consortium consisting of 24 public, private and academic entities and implemented a project of Establishing a Smart Big-Board (2014-2018, USD 6.1 million18). A newly created smart big-board provides disaster-related information, such as weather forecast, real-time videos from CCTVs. In order to enable this system to work, the city installed additional CCTVs to capture disaster scenes on time and improved the Ubiquitous Early Warning System. In addition, the city government established the Information Sharing System for relevant institutions, and the system adopted a mobile application (KACCC, 2020).
Busan was selected by the central government to experiment with smart technologies during the incumbent President Jae-in Moon’s administration until late 2021 with an aim to boost the Fourth Industrial Revolution (4IR) technologies. The Korean government has made a regulatory revision to build an environment favorable to companies in the relevant industries. Thus, the Eco-Delta City (EDC) along the Nakdong River is under construction to be a smart city. In this project, a public corporation K-Water works for clean energy and industrial complexes in addition to their main job in water management. Besides, digitalization can also enhance the city’s water management system in responding to natural disasters by automating the data collection and reporting systems collaborating with some municipalities across the country. Busan also has a plan to establishing a marine big data center working with the Korea Institute of Ocean Science and Technology (KIOST), the Korea Maritime Institute (KMI), and local universities (Intralink Limited, 2019; MLIT, 2019). Since the center is expected to share marine information with private companies, including SMEs, it will support companies to develop and experiment technologies for adaptation in coastal and marine zones.
(ii) Rainwater retention facilities and coastal disaster prevention forests
Busan implemented a project of the Urban Flooding Prevention (2012-2016). Through this project, the city investigated the flood prone areas and installed rainwater retention facilities to prevent flooding of villages in lowlands as well as to reuse rainwater (KACCC, 2020). Additionally, Busan has created the Coastal Disaster Prevention Forests in Myungji, Noksan and Dadaepo (see Image 3), which was the first in Korea and has brought noticeable effects in reducing risks of and loss from storm surge and tsunami (Busan Metropolitan City, 2019). As a secondary benefit, these forests provide citizens with recreational green places contributing to the quality of life.
18 Currency exchange rate for government budget in 2017 was 1,120 ₩/$. Total budget over 5 years (USD) = ₩ 6,830 million ÷ 1,120 ₩/$ = $ 6,098,214.
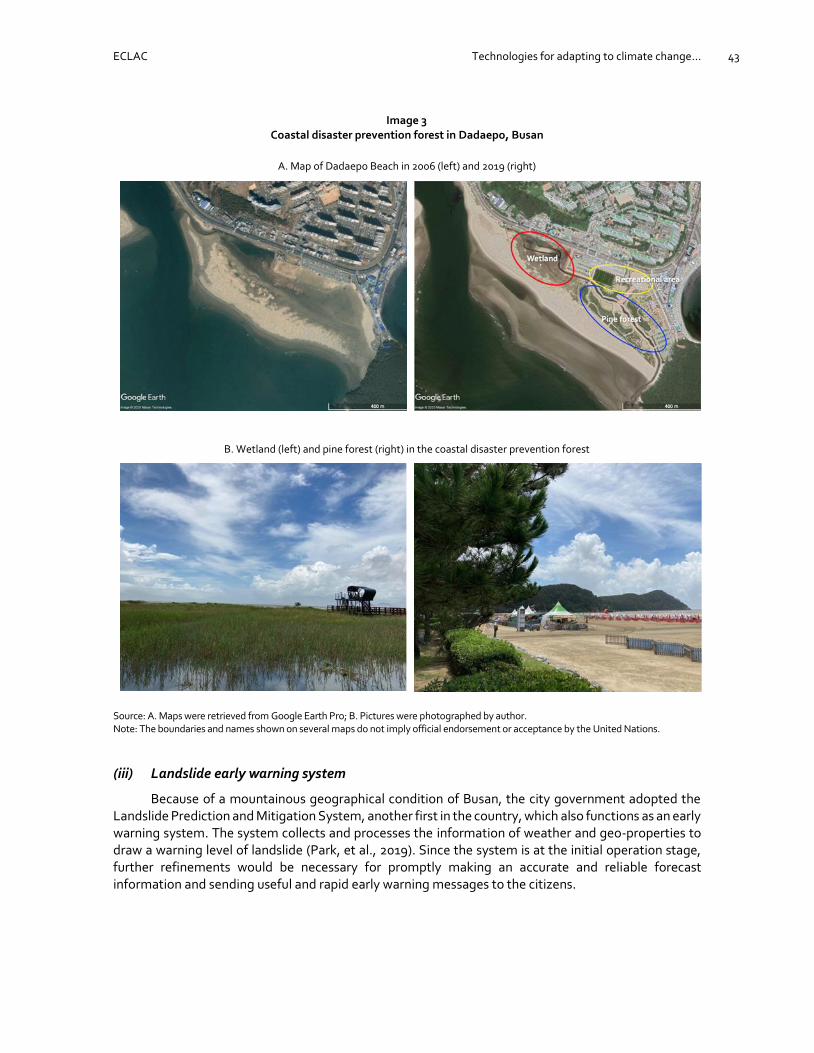
ECLAC Technologies for adapting to climate change... 43
Image 3 Coastal disaster prevention forest in Dadaepo, Busan
A. Map of Dadaepo Beach in 2006 (left) and 2019 (right)
B. Wetland (left) and pine forest (right) in the coastal disaster prevention forest
Source: A. Maps were retrieved from Google Earth Pro; B. Pictures were photographed by author. Note: The boundaries and names shown on several maps do not imply official endorsement or acceptance by the United Nations.
(iii) Landslide early warning system
Because of a mountainous geographical condition of Busan, the city government adopted the Landslide Prediction and Mitigation System, another first in the country, which also functions as an early warning system. The system collects and processes the information of weather and geo-properties to draw a warning level of landslide (Park, et al., 2019). Since the system is at the initial operation stage, further refinements would be necessary for promptly making an accurate and reliable forecast information and sending useful and rapid early warning messages to the citizens.

ECLAC Technologies for adapting to climate change... 44
(b) Heatwaves
(i) Integrated Heatwave Management System
The existing Automatic Weather Stations (AWS) are located in the places where they are not affected by urban elements. To collect more realistic and scientific data on heatwaves, the Busan Metropolitan City Government is working with the Korea Meteorological Administration (KMA) to install additional AWS in the places of similar urban environment which citizens are exposed to. The collected data goes to the Integrated Heatwave Management System and is processed reflecting district-level urban conditions. This system allows the city government to identify the most vulnerable areas at a micro-level and implement locally appropriate measures.
(ii) Cool roof
Busan has replicated cool roof projects in multiple locations. The most well-known cool roof project in Hocheon village was implemented in 2018, collaborating with the Ministry of Environment and the Korea Climate and Environment Network with support from the Samhwa Paint Industrial Co Ltd. The building density is high in Hocheon, and older adults account for over 20% of the total village population. This project chose the right target to benefit the people who are the most vulnerable to heatwaves. Because of mountainous lands and historical background (uncontrolled development during the Korean War), there are some more villages under the same conditions as Hocheon where more cool roofs are needed.
Image 4 Cool roof: Hocheon village (A)
Source: Retrieved from Naver Map on August 13, 2020, https://map.naver.com/v5/search?c=14365632.4236872,4183397.9608834,16, 0,0,2,dh. Note: The boundaries and names shown on this map do not imply official endorsement or acceptance by the United Nations.
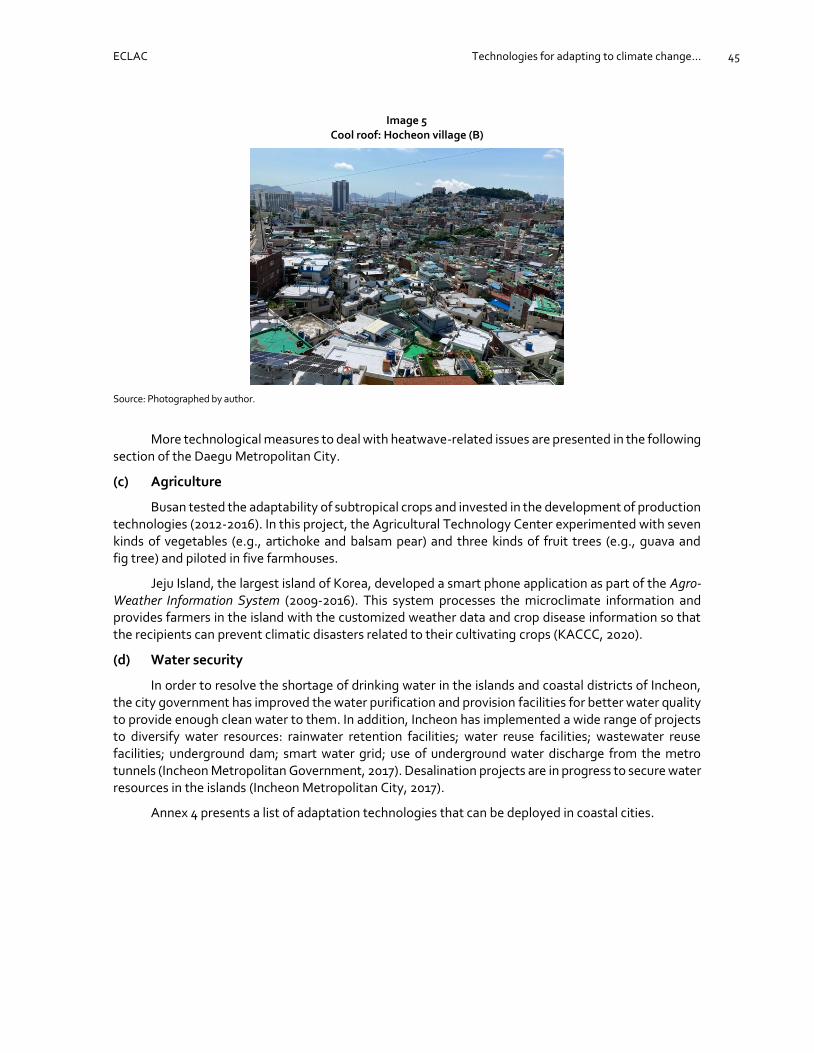
ECLAC Technologies for adapting to climate change... 45
Image 5 Cool roof: Hocheon village (B)
Source: Photographed by author.
More technological measures to deal with heatwave-related issues are presented in the following section of the Daegu Metropolitan City.
(c) Agriculture
Busan tested the adaptability of subtropical crops and invested in the development of production technologies (2012-2016). In this project, the Agricultural Technology Center experimented with seven kinds of vegetables (e.g., artichoke and balsam pear) and three kinds of fruit trees (e.g., guava and fig tree) and piloted in five farmhouses.
Jeju Island, the largest island of Korea, developed a smart phone application as part of the Agro-Weather Information System (2009-2016). This system processes the microclimate information and provides farmers in the island with the customized weather data and crop disease information so that the recipients can prevent climatic disasters related to their cultivating crops (KACCC, 2020).
(d) Water security
In order to resolve the shortage of drinking water in the islands and coastal districts of Incheon, the city government has improved the water purification and provision facilities for better water quality to provide enough clean water to them. In addition, Incheon has implemented a wide range of projects to diversify water resources: rainwater retention facilities; water reuse facilities; wastewater reuse facilities; underground dam; smart water grid; use of underground water discharge from the metro tunnels (Incheon Metropolitan Government, 2017). Desalination projects are in progress to secure water resources in the islands (Incheon Metropolitan City, 2017).
Annex 4 presents a list of adaptation technologies that can be deployed in coastal cities.

ECLAC Technologies for adapting to climate change... 46
D. Case 3: Daegu, city in a mountain basin
1. Adaptation challenges
(a) Heatwaves
Daegu is an intermontane basin city located in the eastern part of South Korea. As a city’s nickname “DaeFrica”, a compound word of Daegu and Africa, implies, Daegu citizens have a long history of the struggle against heatwaves, mainly due to its geographical condition. Urban plans to deal with heatwaves are given priority by the city government. Oh, et al. (2017) applied the vulnerability assessment tool-VESTAP to several Korean cities and found that Daegu was the city most vulnerable to heatwave out of the tested cities. KACCC (2020) re-addressed Daegu as the city most susceptible to heatwave.
As Map 4 shows, the inland areas of Gyeongsang Province and Daegu tend to have long-lasting heatwaves during summer due to meteorological and geographical conditions. The seasonal southwest wind gets warmer and drier being locked in an intermontane basin under Sobaek Mountains, so Hapcheon and Uiryong that border Daegu recorded the highest number of heat-related deaths per 10,000 inhabitants throughout 1997-2011, 1.56 and 1.25 deaths/10,000 inhabitants, respectively. Besides, of the seven metropolitan cities in Korea, Daegu showed the highest number of heat-related deaths per 100,000 inhabitants, accounting for 0.7 deaths/100,000 inhabitants (Kim, et al., 2014).
Map 4 Map of mean heatwave days, 1997-2011
Source: Adapted from Kim, et al. (2014, p. 231). Note: The boundaries and names shown on this map do not imply official endorsement or acceptance by the United Nations.

ECLAC Technologies for adapting to climate change... 47
2. Adaptation technologies in practice
(a) Technologies against heatwaves and PMs
(i) Cool & clean road systems
The nationwide project of cool & clean road system initially started in Daegu and Seoul. Daegu is especially known for the most extensive length of cool & clean road in the country, over 9 km. This system sprays water three times per day, at 4:30, 10:00, and 14:00. Under the heatwave warning, it additionally runs at 19:00. The sources of water used in this system are sustainable, such as underground water flow through metro facilities, rainwater, sewage, and industrial water.
From 2011 to 2013, Daegu used underground water from ten metro stations to run 3,600 nozzles of cool & clean road system. As a result, it contributed to reducing PMs by 18% compared to previous years in addition to lowering the temperature of adjacent areas. It was also proved as a cost-efficient way.
Image 6 Cool and clean road system in Daegu
Source: (left) Photographed by author; and (right) adapted from Daegu Environment Story Blog (http://blog.naver.com/PostView. nhn?blogId=ecocitydaegu&logNo=221564859820&parentCategoryNo=&categoryNo=6&viewDate=&isShowPopularPosts=false&from=postList).
In addition, the Daegu city government has additionally created fountains and playful areas using water spray technologies and started planting trees earlier than other cities.
(ii) Urban greening
It has been widely proven that the restoration of rivers and the expansion of green areas are effective in reducing the temperature of adjacent areas. The Daegu Metropolitan City has consistently operated an urban greening program that created several green pockets in the city center and simultaneously maintained the existing green areas while other cities let central business districts (CBDs) be filled with grey infrastructure. As a result, even as a significant urban development of the city happened, green pockets also increased as seen in Image 7. This was a crucial decision considering the soaring price of lands in CBDs in South Korea. In practice, this program has given the city government a financial burden since the city also needs to buy private green areas.
(iii) Act on technologies against heatwave for new buildings
Since 2018, Daegu had exerted efforts to establish an act that mandates embedding or using technologies for reducing the impact of heatwave impact in new buildings. The act has come into effect in 2020, and the city has started applying heatwave reduction technologies in public buildings. Examples of corresponding technologies are heat blocking building materials, roof garden, and green wall. For
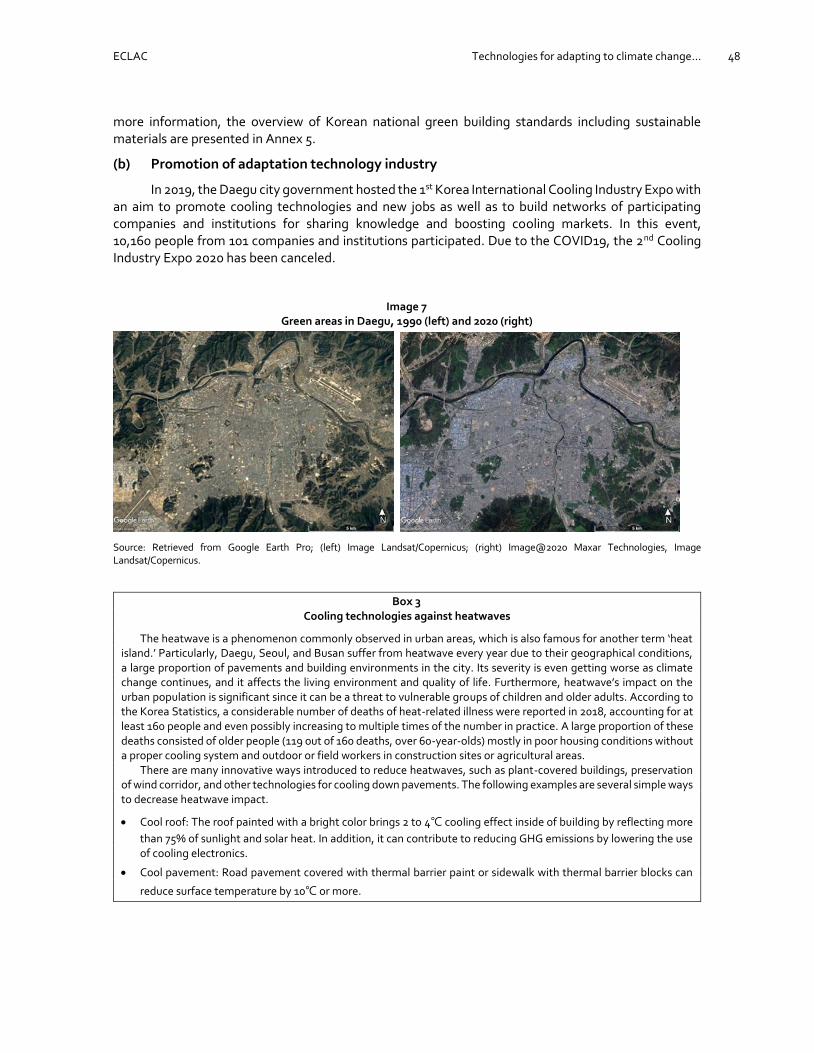
ECLAC Technologies for adapting to climate change... 48
more information, the overview of Korean national green building standards including sustainable materials are presented in Annex 5.
(b) Promotion of adaptation technology industry
In 2019, the Daegu city government hosted the 1st Korea International Cooling Industry Expo with an aim to promote cooling technologies and new jobs as well as to build networks of participating companies and institutions for sharing knowledge and boosting cooling markets. In this event, 10,160 people from 101 companies and institutions participated. Due to the COVID19, the 2nd Cooling Industry Expo 2020 has been canceled.
Image 7 Green areas in Daegu, 1990 (left) and 2020 (right)
Source: Retrieved from Google Earth Pro; (left) Image Landsat/Copernicus; (right) Image@2020 Maxar Technologies, Image Landsat/Copernicus.
Box 3 Cooling technologies against heatwaves
The heatwave is a phenomenon commonly observed in urban areas, which is also famous for another term ‘heat island.’ Particularly, Daegu, Seoul, and Busan suffer from heatwave every year due to their geographical conditions, a large proportion of pavements and building environments in the city. Its severity is even getting worse as climate change continues, and it affects the living environment and quality of life. Furthermore, heatwave’s impact on the urban population is significant since it can be a threat to vulnerable groups of children and older adults. According to the Korea Statistics, a considerable number of deaths of heat-related illness were reported in 2018, accounting for at least 160 people and even possibly increasing to multiple times of the number in practice. A large proportion of these deaths consisted of older people (119 out of 160 deaths, over 60-year-olds) mostly in poor housing conditions without a proper cooling system and outdoor or field workers in construction sites or agricultural areas.
There are many innovative ways introduced to reduce heatwaves, such as plant-covered buildings, preservation of wind corridor, and other technologies for cooling down pavements. The following examples are several simple ways to decrease heatwave impact.
• Cool roof: The roof painted with a bright color brings 2 to 4℃ cooling effect inside of building by reflecting more
than 75% of sunlight and solar heat. In addition, it can contribute to reducing GHG emissions by lowering the use of cooling electronics.
• Cool pavement: Road pavement covered with thermal barrier paint or sidewalk with thermal barrier blocks can
reduce surface temperature by 10℃ or more.
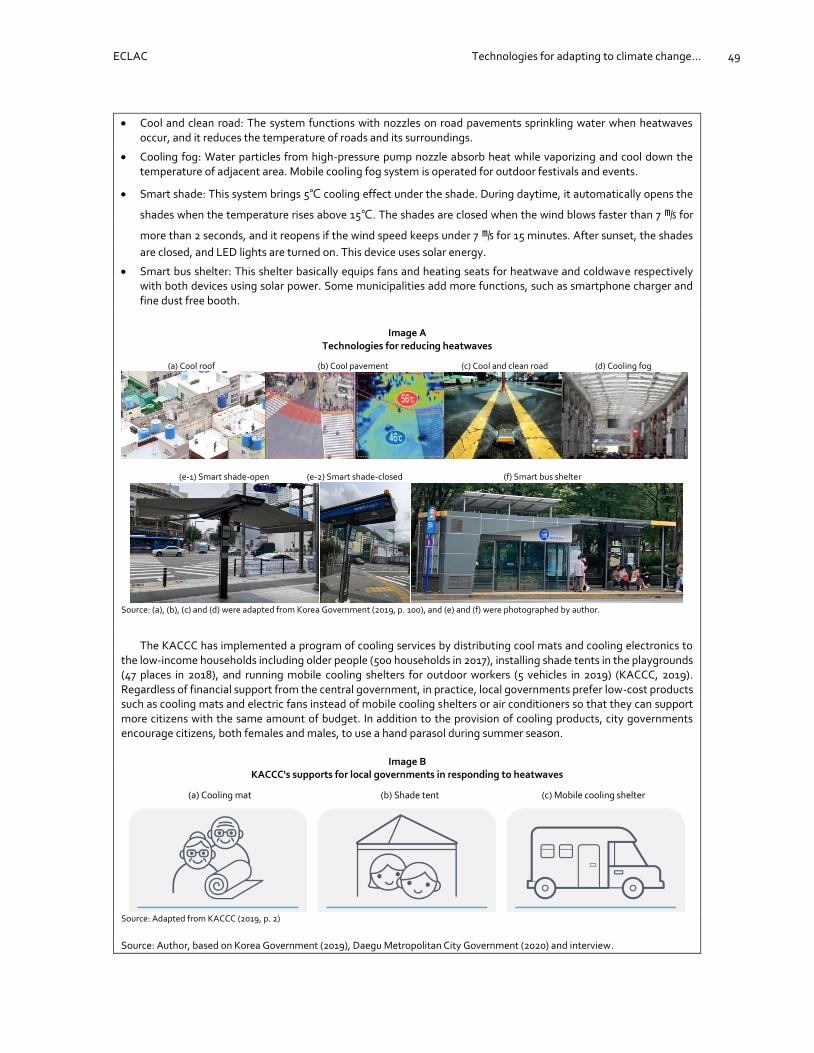
ECLAC Technologies for adapting to climate change... 49
• Cool and clean road: The system functions with nozzles on road pavements sprinkling water when heatwaves occur, and it reduces the temperature of roads and its surroundings.
• Cooling fog: Water particles from high-pressure pump nozzle absorb heat while vaporizing and cool down the temperature of adjacent area. Mobile cooling fog system is operated for outdoor festivals and events.
• Smart shade: This system brings 5℃ cooling effect under the shade. During daytime, it automatically opens the
shades when the temperature rises above 15℃. The shades are closed when the wind blows faster than 7 ㎧ for
more than 2 seconds, and it reopens if the wind speed keeps under 7 ㎧ for 15 minutes. After sunset, the shades
are closed, and LED lights are turned on. This device uses solar energy.
• Smart bus shelter: This shelter basically equips fans and heating seats for heatwave and coldwave respectively with both devices using solar power. Some municipalities add more functions, such as smartphone charger and fine dust free booth.
Image A
Technologies for reducing heatwaves
(a) Cool roof (b) Cool pavement (c) Cool and clean road (d) Cooling fog
(e-1) Smart shade-open (e-2) Smart shade-closed (f) Smart bus shelter
Source: (a), (b), (c) and (d) were adapted from Korea Government (2019, p. 100), and (e) and (f) were photographed by author.
The KACCC has implemented a program of cooling services by distributing cool mats and cooling electronics to the low-income households including older people (500 households in 2017), installing shade tents in the playgrounds (47 places in 2018), and running mobile cooling shelters for outdoor workers (5 vehicles in 2019) (KACCC, 2019). Regardless of financial support from the central government, in practice, local governments prefer low-cost products such as cooling mats and electric fans instead of mobile cooling shelters or air conditioners so that they can support more citizens with the same amount of budget. In addition to the provision of cooling products, city governments encourage citizens, both females and males, to use a hand parasol during summer season.
Image B
KACCC's supports for local governments in responding to heatwaves
(a) Cooling mat (b) Shade tent (c) Mobile cooling shelter
Source: Adapted from KACCC (2019, p. 2)
Source: Author, based on Korea Government (2019), Daegu Metropolitan City Government (2020) and interview.

ECLAC Technologies for adapting to climate change... 50
E. Case 4: Sejong, a planned administrative city
1. Adaptation challenges
Sejong Special Autonomous City was founded in 2007 as a planned administrative city with an aim to alleviate the congestion of the megacity Seoul. Since 2012, several ministries and governmental institutions have been relocated from Seoul to Sejong. Sejong is the youngest city in South Korea in terms of the age of inhabitants, showing the lowest median age, 36.6 years old, in 2017 (Statistics Korea, 2019). In Sejong, thus, there are relatively fewer elderly population that are known as the most vulnerable group to climatic hazards. On the other hand, the city is still in the process of establishing new institutional environment as a new administrative city. Hence, they have not yet installed a team specifically responsible for climatic issues of the city, but the environmental policy unit takes responsibilities for the coordination related to climate policies. Under this condition, the lack of experts in either mitigation or adaptation restrains the city from dealing with climate adaptation issues proactively. Sejong is known for being less vulnerable to climate disasters than other cities, thus the city government currently focuses on stand-alone mitigation action plans due to the limited resources. In this context, the city shows a noticeable performance in mitigation, exemplified by autonomous driving vehicle19 and smart traffic light system, reinforcing the elements of the smart city. On the contrary, efforts in adaptation actions are relatively slow.
Geographically, Sejong is located in low and flat land with a significant proportion of agricultural area. Like other major cities, Sejong also has PM-related issues. There are three generally known causes of fine dust in Sejong: construction sites in a new city; nearby thermal power stations in Choongnam Province; and fine dust from China (see Map 5). As heatwaves strike the city every year, the air stagnation with PMs affect citizens’ daily lives. New buildings constructed in the city can also affect air quality because it makes the change of wind path.
Map 5
Locations of thermal plants and wind path affecting Sejong
Source: Reformulated Figure 4-13 of Lee (2017, p. 94) with adding the locations of thermal plants affecting the air quality of Sejong City. Note: The boundaries and names shown on this map do not imply official endorsement or acceptance by the United Nations.
19 Sejong city government is expecting to launch autonomous driving vehicles in the 2nd semester 2020. During the 1st phase, these vehicles are to be used for a touristic purpose only, and later, the service will be expanded to the public gradually.

ECLAC Technologies for adapting to climate change... 51
The city’s urban park area is 76.2 ㎡/capita, which is the largest figure in the country20. On the
other hand, there are heavy rainfalls in summer and severe droughts in winter. However, the city lacks functional green land that regulates the storage of water. Thus, the government needs to develop integrative measures that consider both forestry and water management, such as a disaster-prevention green space.
2. Adaptation technologies in practice
During the 1st Climate Change Adaptation Action Plan 2015-2019, five sectors were prioritized: health, disaster, agriculture, water, and forest & ecosystem. In this phase, Sejong was at the initial stage of the development of a new city administration, so the city government was understaffed. Considering this circumstance, their action plans were too ambitious for them to implement and achieve all of their goals. Recently, the city government has finished a research for developing the 2nd Climate Change Adaptation Action Plan 2020-2024, and it is under revision.
(a) Digitalization for climate adaptation in the smart zone
As an evolving city, Sejong has been designated with diverse experimental missions. One of them is as a smart city project. In 2018, Sejong obtained ISO3710621 certification for the first time in the world, corresponding to one of the latest ISO standards for sustainable smart cities. For a smart pilot project in Sejong 5-1 Zone (see Map 6), the city concentrates on public housing and land development in addition to basic infrastructures of mobility, health, energy, environment, education, and safety (Intralink Limited, 2019; MLIT, 2019). A significant proportion of investment is assigned to the digitalization with building an Artificial Intelligence (AI) Data Center in addition to the networks for Internet of Things (IoTs) (MLIT, 2019). It is expected that the city will be able to develop a climate-related database and to use interactive digital infrastructure for a better adaptation to climate change.
Map 6 Mitigation and adaptation components of the smart zone Sejong 5-1
Source: Ministry of Land, Infrastructure and Transport. This map was retrieved from the Government 24 on August 31, 2020. https://www.gov.kr/portal/ntnadmNews/1333894?hideurl=N. Note: The boundaries and names shown on this map do not imply official endorsement or acceptance by the United Nations.
20 National average urban park area is 10.1 ㎡/capita and Seoul shows 8.3 ㎡/capita in 2018. Source: Statistics Korea. http://kosis.kr/
statHtml/statHtml.do?orgId=101&tblId=DT_1YL21281&vw_cd=MT_GTITLE01&list_id=108&seqNo=&lang_mode=ko&language=kor&obj_var_id=&itm_id=&conn_path=MT_GTITLE01.
21 ISO 37106:2018. Sustainable cities and communities — Guidance on establishing smart city operating models for sustainable communities. https://www.iso.org/obp/ui/#iso:std:iso:37106:ed-1:v1:en:sec:A.

ECLAC Technologies for adapting to climate change... 52
(b) Air quality: PMs
To reduce the PM concentrations in the air, a joint research was conducted by Sejong and Daejeon city governments in cooperation with Choongnam provincial government. One of its main focuses is the identification of the residents most affected by PMs in Sejong and the development of strategies for them. Technology options were also presented in the report: increase in EV charging station to promote citizens to replace current vehicles with EVs; application of photocatalysis in road constructions (see image 7); introduction of smart clean road system; installation of PM reduction and removal devices in tunnels; formation of green area in PM-risky zones; installation of real-time air monitoring system; smart clean bus shelter; and air purifier devices in crossroads. In addition, the study found that there is insufficient PM-related data of Sejong, so the city needs to improve the PM-related data gathering and analyzing system (Lee, 2020). This study was the initial product of a continuous joint project,so it is necessary to keep an eye on the next steps.
Image 8
Photocatalysis in road construction
Source: Adapted from the Art-chem official website. http://art-chem.co.kr/xe/Water_Purification_Block/23784. Accessed on September 5, 2020.

ECLAC Technologies for adapting to climate change... 53
IV. Analytical framework: assessing local practices on adaptation technologies
A. A framework for analyzing practices on adaptation technologies
The Technology Framework was developed by UNFCCC to guide multidimensional and multisectoral stakeholders to take actions for achieving targets under the Paris Agreement. The key themes from this framework were applied as primary elements in the analytical framework introduced in this study in order to analyze local practices on technological measures for adapting to climate change with consideration of the coherency and alignment with national and international arrangements under the Agreement. The adapted five themes from the Technology Framework are innovation, implementation, enabling environment and capacity-building, collaboration and stakeholder engagement, and support. These themes are interrelated, passing through the technology cycle. Additional pieces of literature relevant to local adaptation measures, including adaptation technologies, were also reviewed, and then several factors from the literature were applied to the analytical framework (see Table 8).
The first element of the Framework ‘innovation’ is defined as a stimulus to efficient, effective, and long-term response to climate change, which is a cross-thematic concept and applicable to all stages of planning and implementing adaptation actions. The second element ‘implementation’ is the main stage of adopting technologies, so multiple concepts and stakeholders need to be considered in local contexts (IPCC, 2000; UNFCCC, 2006). The government’s intervention and transnational trade and assistance can transform the ‘enabling environment’ of technology development and transfer. Thus, the local government’s intervention can influence enabling and constraining conditions of adaptation technology transfer since transfer pathways are determined based on local contexts. For more effective adoption of climate technologies, ‘capacity-building’ of stakeholders is essential since new technologies lead to changes in social and economic structures (IPCC, 2000). Particularly for technologies in vulnerable environments, institutional capacity, and local technical expertise are essential in addition to the quality of technology (iied, 2019).

ECLAC Technologies for adapting to climate change... 54
Technology transformation alone cannot enable the societal transformation for adapting to climate change (Few, et al., 2017). The recent case study identified that efforts for climate knowledge and technology transfer were challenged by the lack of information and the social gap between national and local acceptability (Huh & Kim, 2018). Across all elements of the framework, ‘building partnerships and networks’ of multidimensional and multisectoral stakeholders, particularly from private sector, was commonly addressed as a significant enabler of developing and transferring climate technology (IPCC, 2014; Flagg & Kirchhoff, 2018). In addition, young people can play critical roles for awareness-raising of communities, and women need to be considered significant stakeholders in terms of gender equality to alleviate risks for the vulnerable and politically neglected groups (iied, 2019). Technologies identified through innovative and collaborative knowledge development and planning undergo the selection process, which considers economic and financial cost-benefit, equity, and social and legal acceptability (UNFCCC, 2006).
When it comes to putting the investment opportunities in adaptation into practice, GCA (2019) stated that new partnerships and business models are one of the key factors to create and scale-up investments for a longer-term resilience in food production, water and ecosystem, urban services, infrastructure, and disaster risk management.

CE
PA
L
Tech
no
log
ies for ad
aptin
g to
climate ch
ang
e... 55
Table 8 Factors in developing and transferring climate technologies identified in the literature review
Technology framework (UNFCCC, 2019)
Elements for enhancing adaptation technology transfer (UNFCCC, 2006)
Conceptual framework of adaptation technologies (UNFCCC, 2006)
Details Literatures
1. Innovation Understanding the range of adaptation technologies
- Traditional/modern/high/future; hard/soft UNFCCC (2006), Bellamy (2019)
Criteria of the selection of technologies
Costs and benefits (efficiency) UNFCCC (2006), UNEP and UNFCCC (2016)
Equity (distributional effects) UNFCCC (2006)
Social and legal acceptability UNFCCC (2006), UNEP and UNFCCC (2016), Bellamy (2019)
Identification of the appropriate role of technology
Information development and awareness-raising: identifying needs and priorities
Data collection: e.g., use of relevant technologies, scope of technological projects
UNFCCC (2006), UNEP and UNFCCC (2016) Bellamy (2019)
Impact assessment
Public awareness-raising UNFCCC (2006; 2019) UNEP and UNFCCC (2016)
Planning and design
Cost-effectiveness UNFCCC (2006), UNEP and UNFCCC (2016)
Assessment in a developmental context UNDP (2004), UNEP and UNFCCC (2016)
Environmental sustainability UNFCCC (2006)
Explicit description of short-term climate events linking to long-term
UNDP (2004)
Cultural compatibility UNFCCC (2006), UNEP and UNFCCC (2016)
Social acceptability: e.g., trust in the control of technology
IPCC (2000), UNFCCC (2006), UNEP and UNFCCC (2016), Huh & Kim (2018), Bellamy (2019)
Stakeholder engagement; engagement of the private sector
UNDP (2004), Huh & Kim (2018), UNFCCC (2019)
Multilevel adaptation UNDP (2004)
Planning including both strategy and process
UNDP (2004), CTCN (n.d.)
Collaborative approaches to research, development, and demonstration (RD&D)
Huh & Kim (2018), UNFCCC (2019)
Policy to incentivize and nurture a supportive environment
2. Implementation Implementation Presence of appropriate and effective institutions (formal/informal)
UNFCCC (2006), IIED (2019)
Collaborative technology development and transfer UNFCCC (2019)
Building on the past and ongoing work of the Technology Mechanism
UNFCCC (2019)
Collaboration with other regions/countries UNFCCC (2019)
Technology integrated into adaptation policies
UNFCCC (2019)
Monitoring and evaluation
UNFCCC (2006; 2019)

CE
PA
L
Tech
no
log
ies for ad
aptin
g to
climate ch
ang
e... 56
3. Enabling environment and capacity-building
Flow of technology in specific sectors
Improving access to technology information; public awareness-raising; information-sharing and networking; informational contacts
UNFCCC (2006), CTCN (n.d.) UNFCCC (2019), Flagg & Kirchhoff (2018)
Creating enabling environments incl. removal of barriers; institutional arrangements for investment-friendly environment; incentivize the private and public sector
UNFCCC (2006), UNEP and UNFCCC (2016) IPCC (2000), UNFCCC (2019)
Strengthening local capacity; promoting endogenous, indigenous and gender-responsive technologies
UNFCCC (2006) UNFCCC (2019)
Capacity-building activities at different stages of the technology cycle
IPCC (2000), Huh & Kim (2018), UNFCCC (2019), CTCN (n.d.)
4. Collaboration and stakeholder engagement
Engagement of stakeholders at the local, regional, national, and global level
UNFCCC (2019)
Engagement between NDEs and relevant stakeholders
Collaboration with international organizations and other institutions, and participation in initiatives
Engagement of private sector and civil society
IPCC (2014), UNEP and UNFCCC (2016), UNFCCC (2019)
5. Support Balancing between mitigation and adaptation UNFCCC (2019)
Consideration of gender perspective and endogenous and indigenous aspects
UNFCCC (2019)
Consideration of UNFCCC mechanisms UNFCCC (2019)
Enhancing the mobilization of various types of support; innovative finance and investment at different stages of the technology cycle
IPCC (2000), UNEP and UNFCCC (2016), UNFCCC (2019), CTCN (n.d.)
Source: Elaborated by author.
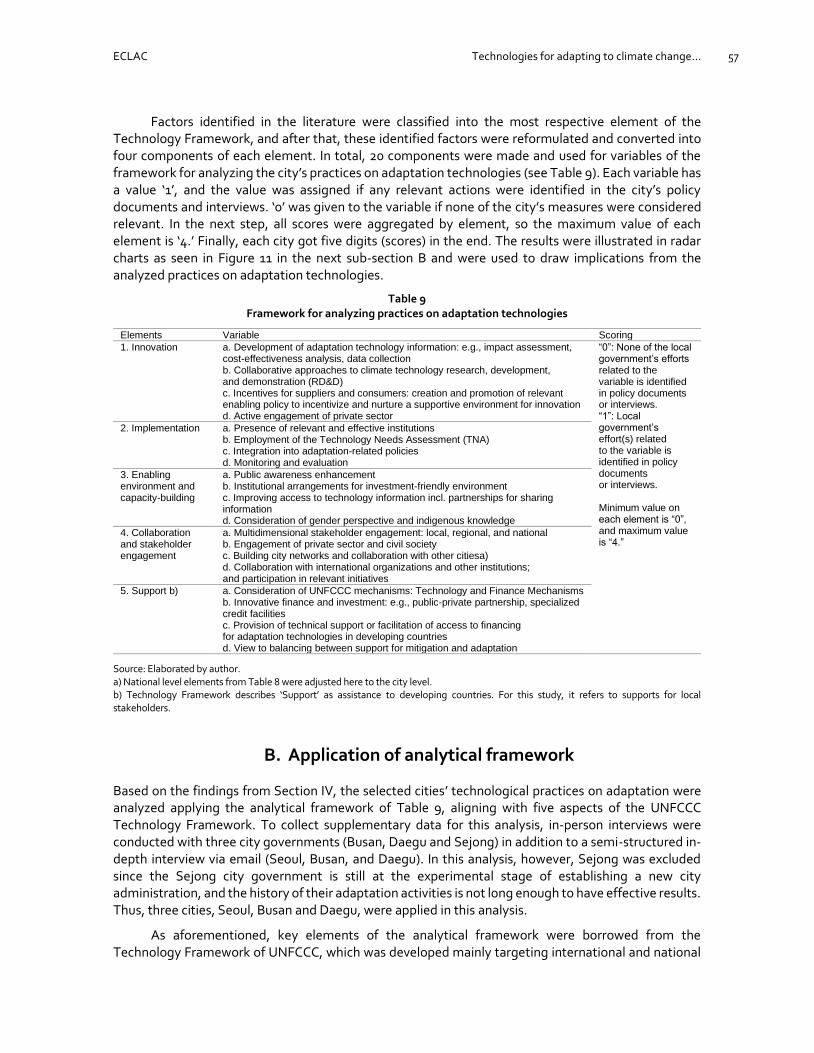
ECLAC Technologies for adapting to climate change... 57
Factors identified in the literature were classified into the most respective element of the Technology Framework, and after that, these identified factors were reformulated and converted into four components of each element. In total, 20 components were made and used for variables of the framework for analyzing the city’s practices on adaptation technologies (see Table 9). Each variable has a value ‘1’, and the value was assigned if any relevant actions were identified in the city’s policy documents and interviews. ‘0’ was given to the variable if none of the city’s measures were considered relevant. In the next step, all scores were aggregated by element, so the maximum value of each element is ‘4.’ Finally, each city got five digits (scores) in the end. The results were illustrated in radar charts as seen in Figure 11 in the next sub-section B and were used to draw implications from the analyzed practices on adaptation technologies.
Table 9 Framework for analyzing practices on adaptation technologies
Elements Variable Scoring
1. Innovation a. Development of adaptation technology information: e.g., impact assessment, cost-effectiveness analysis, data collection b. Collaborative approaches to climate technology research, development, and demonstration (RD&D) c. Incentives for suppliers and consumers: creation and promotion of relevant enabling policy to incentivize and nurture a supportive environment for innovation d. Active engagement of private sector
“0”: None of the local government’s efforts related to the variable is identified in policy documents or interviews. “1”: Local government’s effort(s) related to the variable is identified in policy documents or interviews. Minimum value on each element is “0”, and maximum value is “4.”
2. Implementation a. Presence of relevant and effective institutions b. Employment of the Technology Needs Assessment (TNA) c. Integration into adaptation-related policies d. Monitoring and evaluation
3. Enabling environment and capacity-building
a. Public awareness enhancement b. Institutional arrangements for investment-friendly environment c. Improving access to technology information incl. partnerships for sharing information d. Consideration of gender perspective and indigenous knowledge
4. Collaboration and stakeholder engagement
a. Multidimensional stakeholder engagement: local, regional, and national b. Engagement of private sector and civil society c. Building city networks and collaboration with other citiesa) d. Collaboration with international organizations and other institutions; and participation in relevant initiatives
5. Support b) a. Consideration of UNFCCC mechanisms: Technology and Finance Mechanisms b. Innovative finance and investment: e.g., public-private partnership, specialized credit facilities c. Provision of technical support or facilitation of access to financing for adaptation technologies in developing countries d. View to balancing between support for mitigation and adaptation
Source: Elaborated by author. a) National level elements from Table 8 were adjusted here to the city level. b) Technology Framework describes ‘Support’ as assistance to developing countries. For this study, it refers to supports for local stakeholders.
B. Application of analytical framework
Based on the findings from Section IV, the selected cities’ technological practices on adaptation were analyzed applying the analytical framework of Table 9, aligning with five aspects of the UNFCCC Technology Framework. To collect supplementary data for this analysis, in-person interviews were conducted with three city governments (Busan, Daegu and Sejong) in addition to a semi-structured in-depth interview via email (Seoul, Busan, and Daegu). In this analysis, however, Sejong was excluded since the Sejong city government is still at the experimental stage of establishing a new city administration, and the history of their adaptation activities is not long enough to have effective results. Thus, three cities, Seoul, Busan and Daegu, were applied in this analysis.
As aforementioned, key elements of the analytical framework were borrowed from the Technology Framework of UNFCCC, which was developed mainly targeting international and national

ECLAC Technologies for adapting to climate change... 58
level policies and actions. National-level policies and practices were assessed here in addition to the three selected cities’ cases. A score table and more details can be found in Annex 6, and the results are illustrated in the following Figure 11.
Figure 11 Analysis result of national and local governments’ practices on adaptation technologies
Source: Elaborated by author. a: Innovation, b: Implementation, c: Enabling environment and capacity-building, d: Collaboration and stakeholder engagement, e: Support.
As Figure 11 shows, national-level and city-level policies and projects have had different focuses in terms of the five aspects considered in this analysis. National-level policies and actions related to adaptation technologies seem inclined to international initiatives and cooperation while cities have mainly focused on local activities. This may be the main reason why all three cities got score 0 to 1 on Support. Considering the fact that local actors take a key role in adaptation actions, the city governments also need to be actively engaged in support for other cities in developing countries and to integrate international initiatives into their climate actions.
National-level efforts for developing and transferring adaptation technologies got an overall score of 16 out of the total 20. The strongest aspects were Implementation and Collaboration and Stakeholder Engagement, which were attributable to the establishment of GTC. GTC has taken over climate technology-related tasks since its establishment in 2012, and they have conducted a range of studies on TNA and international cooperation. On the contrary, the lowest score was observed in Enabling Environment and Capacity-Building aspect. There were hardly any measures with a purpose of
0
1
2
3
4a
b
cd
e
A. All
National level Seoul Busan Daegu
0
1
2
3
4a
b
cd
e
B. National level
0
1
2
3
4a
b
cd
e
C. Seoul
0
1
2
3
4a
b
cd
e
D. Busan
0
1
2
3
4a
b
cd
e
E. Daegu
ECLAC Technologies for adapting to climate change... 59
enabling investments in adaptation technologies while there have been considerable efforts to diversify investments in the mitigation technology market. This trend was similar in the cases of Busan and Daegu. In addition, all tested targets, except for Seoul, could not get any score on the Consideration of gender perspective and indigenous knowledge, a sub-element of Enabling environment and capacity-building. This might be because the Korean central and city governments have recently started giving attention to support for vulnerable groups in climate policies, but without taking a specific gender perspective. Through the interview with city governments, however, a novel perspective was found that male citizens were more exposed to climate change impact than female, especially when it comes to heatwaves. One of main reasons for this is that the outdoor workers are mostly men, and males usually do not use any sun light protection on the street. Thus, cities have operated mobile shelters in outdoor construction sites and spontaneously, have promoted the use of hand parasols for men. As for the adoption of indigenous knowledge, Seoul tried to make a new model of rainwater collecting barrel ‘Seoul Chomhang.’ ‘Chomhang’ is a traditional barrel used for collecting rainwater in Jeju Island to resolve the freshwater shortage issue. In 2013, a design contest for ‘Seoul Chomhang’ was held and after that, there was no noticeable advancement in this project. During the initial meeting with private companies, they found that potential companies were not interested in developing and commercializing a small-sized rainwater barrel and most investment would depend on the government’s budget22.
Seoul showed higher scores on Innovation and Enabling Environment and Capacity Building than other cities, even higher than the national level. In the Innovation aspect, the Seoul Metropolitan Government works with the Seoul Research Institute for conducting studies to explore and apply new policies and technologies in the city. Seoul has relatively more financial and human resources than other cities, and this may enable the city to experiment with innovative measures. As for Enabling Environment aspect, Seoul has established the Seoul Green Industry Center in collaboration with GTC to support start-ups. Moreover, some of Seoul’s adaptation technology-related projects, such as metro farm, urban greening23 and green building/housing, encourage citizens and private companies to participate and invest in those projects.
22 http://opengov.seoul.go.kr/sanction/365737. 23 Seoul Forest Park Conservancy (https://seoulforest.or.kr/) is one of the examples that citizens and private companies contribute to
the operation of parks.


ECLAC Technologies for adapting to climate change... 61
V. Latin American cities’ needs for adaptation technologies
A. Climate adaptation challenges in LAC cities
It has become an unwritten law that vulnerability to climate change should be addressed in local context. Thus, city environment needs to be addressed importantly as much as regional- and national- level conditions are. Most population in Latin America and the Caribbean live in coastal and mountainous areas (see Map 7 and Map 8). Megacities24 are not the exception. The LAC region not only takes a significant role as a global carbon sink in a mitigation aspect, but also their adaptation issues are noticeable, particularly related to informal housing due to rapid urbanization, socioeconomic disparity, high economic dependency on nature, and increased environmental and socioeconomic loss attributing to natural hazards. Although both mitigation and adaptation have to be addressed together considering local conditions, Latin American cities’ climate policies have been slightly inclined towards mitigation (Aylett, 2015). Out of 67 cities with 1 million inhabitants or more, there were 44 cities in 2018 that had climate-related action plans in any type of urban policies. Of these 44 cities, 32 cities had both mitigation and adaptation action plans; 9 cities had only mitigation; and the remaining 3 cities had adaptation action plans (Kim & Grafakos, 2019). When it comes to the intermediary and small cities, less cases would be found.
The LAC region has faced a variety of adaptation-related challenges, such as water security, drought, flooding, and threats to ecological diversity. Particularly, water-related disasters (flooding and storm) are predominant in the region. Although the frequency of extreme weather events and disasters have decreased over the last decades, the number of affected people increased significantly (ECLAC, 2020). This implies that the intensity of disasters has become stronger, and people are not well-prepared for them.
24 Bogotá, Buenos Aires, Mexico City, Rio de Janeiro, São Paulo, Lima and Santiago.

ECLAC Technologies for adapting to climate change... 62
Map 7 Population distribution map of LAC region
Source: GWP v4 Population Count, v4.11. https://sedac.ciesin.columbia.edu/data/collection/gpw-v4. Accessed on March 24, 2020. Note: The boundaries and names shown on this map do not imply official endorsement or acceptance by the United Nations.
Map 8
Ocean depth & topographic map and coastal impacts of LAC
A. Ocean depth and topographic map B. Coastal impacts
Source: Map A. was retrieved from NOAAa) Bathymetric Data Viewerb). https://maps.ngdc.noaa.gov/viewers/bathymetry/ ; Map B. was adapted from IPCC (2014, p. 1525). a) National Centers for Environmental Information (NOAA), National Oceanic and Atmospheric Administration of the USA b) Applied map and layers: the Basemap-GEPCO_2019 (NOAA NCEI Visualization), Bathymetric Surveys-Multibeam Bathymetry Mosaic and the Digital Elevation Models (DEM)-Color Shaded Relief-All DEMs. Note: The boundaries and names shown on several maps do not imply official endorsement or acceptance by the United Nations.
ECLAC Technologies for adapting to climate change... 63
Cities in the highlands like Bogota, Mexico City and Santiago have several adaptation issues in common. One of them is heatwaves and air quality (PMs). In particular, low-income urban dwellers living in informal houses in poor conditions are susceptible to heatwaves, and they even have less access to health services. In addition, poor people in informal settlements on the slopes of mountains are exposed to risks for landslide, particularly during and after heavy rainfalls. In 2015, a major landslide caused hundreds of deaths in a mountain village El Cambray Dos near Guatemala City. Some other low-income group lives along the river streams, which area is usually prone to flooding, without proper flooding protection as well as drainage systems.
Coastal cities are susceptible to hazards associated with sea level rise, such as coastal flooding (see Map 8). The island countries in the Caribbean and some of Central American countries are affected by tropical cyclones as well as high risk for freshwater stress and increasing loss of coral reefs. Haiti and Dominica were ranked in the top 10 countries most vulnerable to climate change over the period of 1999 to 2018. The most affecting events were tropical cyclones like hurricanes. Poorer countries are affected more than richer countries, and the same applies to loss of life and personal hardship (Eckstein, et al., 2019).
As the most urbanized region in the world (81.2 % in 2020) (ECLAC, 2020), the next evolution trend of LAC cities and their strategies for adapting to climate change are significant in terms of strengthening the overall regional resilience (IFC, 2016).
B. Climate adaptation technology needs in the LAC region
As of August 2019, five countries in the Caribbean-Antigua and Barbuda, Dominica, Jamaica, Surinam and Trinidad and Tobago- are at the Phase III of TNA, implemented by UNEP with support from GEF. The focused adaptation areas in this program are water, infrastructure and buildings, agriculture, coastal zone, and policy integration (Salinas, 2019). As for GCF funding, CTCN Concept Programme has assisted Guyana to build capacity for preparing GCF concept notes on climate technologies, and five concept notes were developed as a result. Later, Guatemala expressed interest in the participation (Villatico, 2019).
Apart from above examples, there is an increasing effort for seeking ways to transform current linear industrial systems into circular economy. Brazil, Chile, Mexico and Uruguay are participating in this program (CTCN, 2020). Overall, the requests from LAC countries to CTCN are mostly aiming for TNA assistance and circular economy, while Asian countries request for support in green transportation, vulnerability modelling and climate smart cities (UNFCCC, 2019). As of September 2020, around 20% of the assistance requests from developing countries to CTCN have come from the LAC region (see Figure 12.A.). As for Technical Assistance (TA), the LAC countries have been engaged in 36 projects from 2014 to 2019 (Figure 12.B.). Looking into the components of these TA projects, agriculture sector is the most predominant over other sectors, followed by forestry and ecosystem, infrastructure and urban planning, circular economy, water, coastal zone, policy-related assistance and others. IFC (2016) stated that agriculture sector in LAC is a huge potential area for further climate investment, particularly climate-smart agriculture that would attract private sector. On the other hand, the interested areas have been diversified in that ‘other’ sectors of TA requests include EWS, climate technology information system, and technology incubation in SMEs. In this regard, the digitalization can take a significant role since the information and communication technologies (ICT) can contribute to making EWS more effective as well as improving overall adaptation processes. In addition, ICT enriches the data on current and future climate change and its impact and makes it easier for citizens to be engaged in the adaptation policy development and implementation (Eakin, et al., 2014).
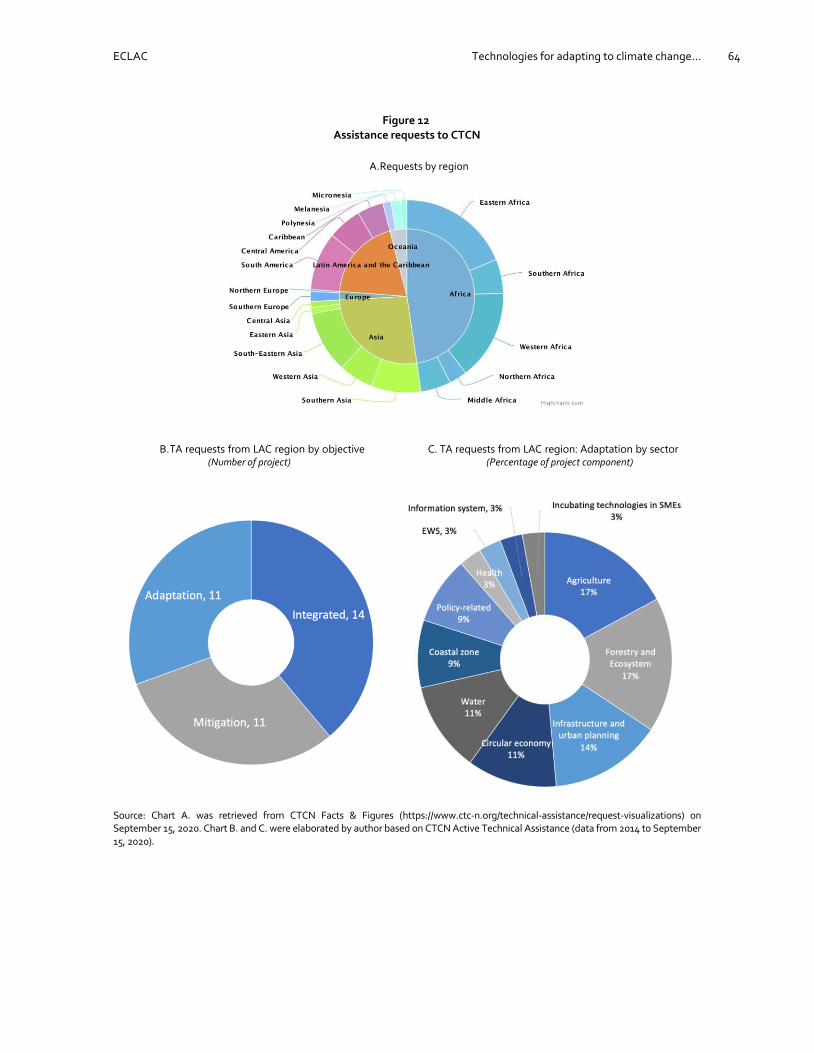
ECLAC Technologies for adapting to climate change... 64
Figure 12 Assistance requests to CTCN
A. Requests by region
B. TA requests from LAC region by objective C. TA requests from LAC region: Adaptation by sector (Number of project) (Percentage of project component)
Source: Chart A. was retrieved from CTCN Facts & Figures (https://www.ctc-n.org/technical-assistance/request-visualizations) on September 15, 2020. Chart B. and C. were elaborated by author based on CTCN Active Technical Assistance (data from 2014 to September 15, 2020).
ECLAC Technologies for adapting to climate change... 65
VI. Conclusion: Implications for developing and transferring adaptation technologies in LAC cities
Cities are key players contributing to reducing GHG emissions and preventing climate-induced losses and damages by strengthening local resilience. Cities are also incubation areas on the ground that climate technologies, especially adaptation technologies, are experimented and applied. In this regard, international society has underlined the importance of city-level efforts in responding to climate change. As presented in previous chapters, the Korean cities’ technological efforts to adapt to climate change have proven that adaptation technologies can be relatively simpler and require fewer financial resources than mitigation technologies. Thus, some of those technologies can be applied in LAC cities considering local conditions, including the limited financial capacities of local governments. The following paragraphs are the implication from the Korean cities’ cases analyzed in this study, which may be useful for Latin American cities when they consider the deployment of adaptation technologies. Potential adaptation technologies for Latin American cities are listed in Table 10.
As the Korean cases showed, it is essential that the city government reforms the institutional environment in line with international climate agreements and national programs, which include giving an emphasis on climatic technologies. There are co-benefits and trade-offs between mitigation and adaptation, so these interrelationships need to be considered when developing and transferring climatic policies and technologies. In Korea, from a legal aspect, the National Green Growth Act mandates cities to develop a 5-year adaptation action plans, however city-level mitigation actions are not mentioned in the same act. Seoul established a city ordinance that mandates to incorporate mitigation and adaptation together into the 5-year climate action plans, while other cities only have adaptation policies following the National Green Growth Act. From an institutional structure perspective, there is no unit specifically responsible for climate affairs in Sejong City, which could drag the city behind in responding to climatic challenges in time. Cities need to form a unit that effectively work on local climate issues. Furthermore, as local governments usually face financial challenges when seeking for assistance from experts in certain climatic issues, the establishment of a regional/provincial-level institute for multiple adjacent cities could be effective.

ECLAC Technologies for adapting to climate change... 66
Latin American cities and Korean cities have some climatic issues in common. Among them, heatwave and flooding are ones of the most noticeable and emergent problems to be resolved. There are some cost-efficient technologies of Korean cities that could help populations in LAC cities avoid heatwave-induced health issues, such as cool roof in informal settlements and water sprays in recreational areas. As the Seoul case implies, the water cycle policy involves multiple sectors, and relevant sectoral regulations need to be considered in an integrative way to maximize the effectiveness of projects. This also applies to other urban policies since climatic agenda is interdisciplinary.
Digitalization is an essential element of adaptation technologies as the application of ICT is commonly observed across all sectors in the Korean cities’ cases, especially for multifunctional EWS. In addition, the smart city project in Busan shows that the digitalization can also enhance the city’s water management system in responding to natural disasters by automating the data collection and reporting systems and collaborating with the cities connected by rivers. Considering the huge potential of agriculture in the LAC region, smart-climate agriculture like a metro farm in Seoul could be one of the “affordable, co-created, and long-term adaptation solutions that work within local and commercial market systems (iied, 2018)” in LAC cities.
Since the largest proportion of R&D investment usually comes from private sector, the government needs to exert more efforts to attract private sector by making the investment environment favorable to companies so that they can develop more climate technologies and conduct relevant businesses. New regulatory settings will be necessary, particularly for new technologies such as drones and digital healthcare. These technologies respectively contribute to gathering geographic data and dealing with climate-related health issues in remote and far-flung communities.
There are several ways for Latin American cities to raise funds through international cooperation to implement climate technology projects. As illustrated in the Diagram 2, cities can request to CTCN for technical assistance and to GCF for a bigger project through their national NDEs of CTCN, NDAs and focal points of GCF. For the ODA projects of Korea, the Economic Development Cooperation Fund (EDCF) by the KEXIM Bank operates reimbursable projects, and the Korea International Cooperation Agency (KOICA) works for non-reimbursable projects (see Diagram 4).
Table 10 List of potential adaptation technologies for LAC cities
Sector Adaptation challenges Technologies
Agriculture Extreme/unpredictable weather
Agro-weather information system Smart farm (e.g., metro farm)
Disaster Flooding
EWS Retention facilities Urban greening
Water Freshwater shortage Desalination (coastal area) Rainwater collecting Underground dam (coastal area) Water reuse
Health Heatwave
Cool roof Cool and clean road system EWS Urban greening Water sprays in recreational area
PMs Cool and clean road system EWS Urban greening
Infrastructure Heatwave Green buildings (e.g., green wall, green roof)
Fishery Water temperature rise Diversifying aquaculture
Coastal zone Beach erosion Coastal flooding
Coastal forest EWS
Source: Elaborated by author.
ECLAC Technologies for adapting to climate change... 67
Sharing knowledge and raising awareness of climate adaptation technologies is one of the significant drivers of transferring climate technologies. The Seoul case showed a low level of citizens’ perception on climate adaptation actions, which could lead to the inclination to mitigation actions and constrain the implementation of adaptation action plans. Huh & Kim (2018) addressed the acceptability gap between multidimensional stakeholders as potential barriers to climate actions. For a better adoption of climate adaptation technology, it is necessary to narrow the acceptability gap and to raise the public’s awareness of adaptation technologies.
The Korean national climate technology cooperation strategy lacks the participation of city governments. It was not considered that cities have accumulated adaptation knowledge and experience. To maximize the performance of the deployment of climate adaptation technologies, it is important to facilitate to transfer adaptation technologies and share knowledge between cities in addition to between countries. Since there is a stronger community-based culture in the LAC region, LAC cities could use those existing community/city networks to identify common adaptation issues and share knowledge for further developing and transferring adaptation technologies.

ECLAC Technologies for adapting to climate change... 69
Bibliography
Agrawala, S. et al., 2011. Adapting to Climate Change: Costs, Benefits, and Modelling Approaches. International Review of Environmental and Resource Economics, Volume 5, p. 245–284.
Ayers, J. & Dodman, D., 2010. Climate change adaptation and development I: the state of the debate. Progress in Development Studies, 10(2), p. 161–68.
Aylett, A., 2015. Institutionalizing the urban governance of climate change adaptation: Results of an international survey. Urban Climate, Volume 14, pp. 4-16.
Bedsworth, L. W. & Hanak, E., 2010. Adaptation to climate change: a review of challenges and tradeoffs in six areas. Journal of the American Planning Association, 76(4), pp. 477-495.
Bellamy, R., 2019. Social readiness of adaptation technologies. WIREs Climate Change, 10(6), pp. 1-15.
Busan Metropolitan City, 2019. 부산광역시 기후변화적응대책 성과 발표자료. [Online] Available at:
https://kaccc.kei.re.kr/portal/policy/education/guidance/guidancegov_view.do?bseq=9222#[Accessed 9 2020].
Chapagain, D., Baarsch, F., Schaeffer, M. & D'haen, S., 2020. Climate change adaptation costs in developing countries: insights from existing estimates. Climate and Development, pp. 1-9.
Cho, H. & Lee, Y., 2018. 서울시 폭염 대응력 향상 방안, Seoul: The Seoul Institute.
Chu, E., Anguelovski, I. & Roberts, D., 2017. Climate adaptation as strategic urbanism: assessing opportunities and uncertainties for equity and inclusive development in cities. Cities, Volume 60, p. 378–387.
Cornell University, INSEAD, and WIPO, 2019. The Global Innovation Index 2019, Ithaca, Fontainebleau, and Geneva: s.n.
CPI, 2019. Global Landscape of Climate Finance 2019, London: Climate Policy Initiative.
CTCN, 2016. CTCN: Technical Assistance Process and Success Factors, s.l.: s.n.
ECLAC Technologies for adapting to climate change... 70
CTCN, n.d. Technology Sectors. [Online] Available at: https://www.ctc-n.org/technology-sectors [Accessed 22 April 2020].
CTCN, 2020. Progress Report 2019, Copenhagen: CTCN.
Daegu Metropolitan City Government, 2020. Best practices on climate adaptation in Daegu. 3-3-7-다.
기후변화 적응과 관련하여 광역지자체가 노력한 우수사례. Daegu: Daegu Metropolitan City
Government.
Dean, A. & Green, D., 2018. Climate change, air pollution and human health in Sydney, Australia: A review of the literature. Environmental Research Letters, 13(5).
Dilling, L. et al., 2019. Drought in urban water systems: Learning lessons for climate adaptive capacity. Climate Risk Management, Volume 23, pp. 32-42.
Dodman, D., Ayers, J. & Huq, S., 2009. Building resilience. In: State of the world into a global world. s.l.:The worldwatch institute, pp. 151-168.
Doherty, R. M., Heal, M. R. & O’Connor, F. M., 2017. Climate change impacts on human health over Europe through its effect on air quality. Environmental Health, 16 (Suppl 1)(118), pp. 33-44.
Eakin, H. et al., 2014. Information and communication technologies and climate change adaptation in Latin America and the Caribbean: a framework for action. Climate and Development.
Eckstein, D., Künzel, V., Schäfer, L. & Winges , M., 2019. GLOBAL CLIMATE RISK INDEX 2020: Who Suffers Most from Extreme Weather Events? Weather-Related Loss Events in 2018 and 1999 to 2018, Bonn and Berlin: Germanwatch e.V..
ECLAC, 2020. Statistical Yearbook for Latin America and the Caribbean, Santiago: Economic Commission for Latin America and the Caribbean.
ECOSOC, 2015. Strengthening technology facilitation and capacity building in a post-2015 setting: Understanding the issues. New York, United Nations Department of Economic and Social Affairs, pp. 1-7.
Eckstein, D., Künzel, V., Schäfer, L. & Winges , M., 2019. GLOBAL CLIMATE RISK INDEX 2020: Who Suffers Most from Extreme Weather Events? Weather-Related Loss Events in 2018 and 1999 to 2018, Bonn and Berlin: Germanwatch e.V..
Few, R. et al., 2017. Transformation, adaptation and development: relating concepts to practice. Palgrave communications, Volume 3.
Flagg, J. A. & Kirchhoff, C. J., 2018. Context matters: Context-related drivers of and barriers to climate information use. Climate Risk Management, Volume 20, pp. 1-10.
GCA, 2019. Adapt Now: A Global Call for Leadership on Climate Resilience, s.l.: Global Commission on Adaptation.
GCF, 2018. GCF in Brief: Support for Technology, Incheon: Green Climate Fund. Grubb, M., 2004. Technology Innovation and Climate Change Policy: an overview of issues and options. Keio
economic studies , pp. 1-37. GTC, 2017. A study on promising climate technology and project in response to demand from developing countries,
and interrelationship analysis of technology demand and supply, Seoul: Green Technology Center. GTC, 2018. Climate Technology Classification and Industry Statistics in Korea, Seoul: Green Technology Center. GTC, Forthcoming. A Study on Climate Technological Competencies of Government-funded Research Institutes
and Companies, Seoul: Green Technology Center. Huh, T. & Kim, H.-J., 2018. Korean experimentation of knowledge and technology transfer to address climate
change in developing countries. Sustainability, 10(1263), pp. 1-15. IFC, 2016. Climate-Smart Investment Potential in Latin America: A Trillion Dollar Opportunity, Washington DC:
International Finance Corporation.
ECLAC Technologies for adapting to climate change... 71
IIED, 2018. CBA12: Key messages. [Online] Available at: https://www.iied.org/cba12-key-messages#adaptation%20tech[Accessed 15 April 2020].
IIED, 2019. Knowledge and experiences from the 13th International Conference on Community-Based Adaptation to Climate Change. London, International Institute for Environment and Development (IIED).
Incheon Metropolitan City, 2017. 제 2 차 인천 기후변화 적응대책 세부시행계획 (2017-2021), Incheon:
Incheon Metropolitan City. Incheon Metropolitan Government, 2017. Underground Water Management Plan: Incheon Metropolitan Ciy.
인천광역시 지하수 관리계획 2017-2026. [Online].
Intralink Limited, 2019. Smart Cities South Korea: Market Intelligence Report: Department for International Trade, UK.
IPCC, 2000. Methodological and technological issues in technology transfer, s.l.: Cambridge university press. IPCC, 2006. Application of environmentally sound technologies for adaptation to climate change, s.l.: IPCC. IPCC, 2014. WGII Contribution to the IPCC Fifth Assessment Report (AR5): Part A. Global and Sectoral
Aspects, s.l.: IPCC. IPCC, 2015. Climate Change 2014: AR5 Synthesis Report, Geneva: IPCC. IPCC, 2019. Global warming of 1.5°C: Intergovernmental Panel on Climate Change, s.l.: Intergovernmental
Panel on Climate Change.
KEITI, 2019. 2020 Green Construction Materials. 2020 친환경건설자재정보. Seoul: Korea Environmental
Industry and Technology Institute. Kim, D.-W., Chung, J.-H., Lee, J.-S. & Lee, J.-S., 2014. Characteristics of Heatwave Mortality in Korea.
우리나라 폭염 인명피해 발생특징. Atmosphere. Korean Meteorological Society, 24(2), pp. 225-234.
Kim, H. & Grafakos, S., 2019. Which are the factors influencing the integration of mitigation and adaptation in climate change plans in Latin American cities?. Environmental Research Letters, 14(10).
Kim, K. & Kim, N., 2020. 녹색건축인증 과거, 현재, 미래. Past, present and future of environmentally friendly
certification.. Journal of the KGBC Vol.21, No.1, pp. 33-41. Kim, W., Shin, S. & Kim, J.-A., 2018. A study for developing an integrated air quality (Ozone and PM2.5)
management framework in Seoul, Seoul: The Seoul Institute.
Kim, Y. & Jin, J., 2018. Diagnosis and improvement of Water-Cycle Policy in Seoul. 서울시 물순환정책
진단과 개선방안., Seoul: Seoul Institute.
KACCC, 2019. Project performance leaflet: local level supports for vulnerable groups' adaptation to climate change (Korean ver.). Sejong: Korea Adaptation Center for Climate Change.
KACCC, 2020. Guidelines for Climate Change Adaptation Projects, Sejong: KACCC.
KMA, 2012. Press Release: 인명피해가 가장 많은 기상재해는 '폭염'. Seoul: Korea Meteorological
Administration. Korea Government, 2016. The 2nd national climate change adaptation plan, s.l.: s.n. Korea Government, 2019. The 2nd Basic Plan for Climate Change Response 2020-2040, s.l.: Korea
Government. Kuhl, L., 2019. Technology transfer and adoption for smallholder climate change adaptation: opportunities
and challenges. Climate and Development. Leal Filho, W. & Mannke, F., 2014. Managing the Impacts of Climate Change in Latin America: The Need for
Technology Transfer. pp. 95-106.
Lee, H., Kang, Y. & Kim, Y., 2019. Analysis of economic impact of the introduction of CCU. CCU 기술 도입의
경제적 파급효과 분석. Korean Energy Economic Review 에너지경제연구. Vol. 18, No. 1, pp. 113-136.
Lee, S., 2005. Recycled construction material - with a special focus on aggregate and concrete. 재활용
건축재료-골재 및 콘크리트를 중심으로. Construction 대한건축학회지. v.49 n.10, pp. 61-63.
Lee, S., 2011. Futuristic Environment Friendly Construction Material -Regarding Carbon Reducing
Construction Material Planning-. 대한건축학회지 v.55 n.4, pp. 38-41.

ECLAC Technologies for adapting to climate change... 72
Lee, Y., 2017. 세종시와 인근지역 상호영향 분석을 통한 대기질 관리방안 연구, Daejeon: Daejeon Sejong
Research Institute.
Lee, Y., 2020. 세종시 미세먼지 집중관리구역 지정 및 운영방안, Daejeon: Daejeon Sejong Research Institute.
Lybecker, K. M. & Lohse, S., 2015. Global Challenges Report: Innovation and Diffusion of Green Technologies: The Role of Intellectual Property and Other Enabling Factors, Geneva: World Intellectual Property Organization (WIPO).
Mazzotti, M. et al., 2005. Chapter 7: Mineral carbonation and industrial uses of carbon dioxide. In: IPCC Special Report on Carbon dioxide Capture and Storage. Cambridge and New York: Cambridge University Press, pp. 321-335.
MLIT, 2019. The 3rd Smart City Masterplan 2019-2023. 제 3 차 스마트도시 종합계획 2019-2023. Sejong:
Ministry of Land, Infrastructure and Transport. NIMS, 2018. 100 years of climate change in Korea, Jeju: National Institute of Meteorological Sciences. Oh, K.-Y., Lee, M.-J. & Jeon, S.-W., 2017. Development of the Korean Climate Change Vulnerability
Assessment Tool (VESTAP)—Centered on Health Vulnerability to Heat Waves. Sustainability, 9(1103), pp. 1-15.
Park, B. et al., 2017. Long-Term Warming Trends in Korea and Contribution of Urbanization: An Updated Assessment. JGR Atmospheres, 122(20), pp. 10,637-10,654.
Park, D.-S., Park, B. & Jung, E., 2017. Guidelines for the VESTAP-based Climate Change Vulnerability Assessment. Journal of Climate Change Research, 8(4), pp. 339-346.
Park, J.-Y.et al., 2019. A regional-scale landslide early warning methodology applying statistical and physically based approaches in sequence. Engineering Geology, 260(105193).
Park, Y., 2016. Carbon storage and utilization by mineral carbonation. 광물 탄산화를 통한 이산화탄소 저장
및 활용. News & Information for Chemical Engineers (NICE) Vol. 34. Issue. 3, pp. 282-286.
Salinas, R., 2019. TNA and linkages with CTCN technical assistance in the region. [Online] Available at: https://www.ctc-n.org/sites/www.ctc-n.org/files/s.2.1_tna_and_linkages_with_ctcn_technical_ assistance_in_the_region_mr._ramiro_salinas.pdf
Seoul Intitute, 2017. 2017-2021 서울시 기후변화대응 종합계획 수립연구-세부시행계획, Seoul: Seoul
Metropolitan Government. Seoul Metropolitan City, 2019. Seoul Climate White Paper 2018, Seoul: Seoul Metropolitan City. Seoul Metropolitan City, 2019. 2019 Summer operation plan of cooling fog systems to respond heatwaves.
[Online] Available at: https://opengov.seoul.go.kr/sanction/17690993 [Accessed 8 July 2020]. Seoul Metropolitan City, 2020. 2020 Plan for responding to water-related disasters, Seoul: Seoul Metropolitan City.
Seoul Metropolitan Government, 2020. Future Maps of Seoul 서울미래지도. Seoul: Seoul Metropolitan
Government. Seoul Solution, 2018. Water Cycle Policy 04. [Online] Available at: https://seoulsolution.kr/en/content/7856
[Accessed 16 8 2020].
Shim, H., 2018. 효율성, 형평성 고려한 폭염위험도 구성과 폭염저감시설 쿨링포그 최적입지 도출, Seoul:
The Seoul Institute. Smit, B. & Wandel, J., 2006. Adaptation, adaptive capacity and vulnerability. Global Environmental Change,
Volume 16, p. 282–292. Smithers, J. & Blay-Palmer, A., 2001. Technology innovation as a strategy for climate adaptation in
agriculture. Applied Geography, 21(2), pp. 175-197.
Statistics Korea, 2019. 장래인구특별추계(시도편): 2017~2047 년, Sejong: Statistics Korea.
UN DESA, 2019. World Urbanization Prospects: The 2018 Revision, New York: s.n. UNDP, 2004. Adaptation policy frameworks for climate change: developing strategies, policies and measures,
s.l.: Cambridge. UNEP, 2014. The Adaptation Gap Report 2014, Nairobi: United Nations Environment Programme. UNEP, 2016. The Adaptation Finance Gap Report 2016, Nairobi: United Nations Environment Programme.

ECLAC Technologies for adapting to climate change... 73
UNEP and UNFCCC, 2016. Enhancing implementation of technology needs assessments, Bonn and Copenhagen: UNFCCC.
UNFCCC, 2006. Application of environmentally sound technologies for adaptation to climate change, s.l.: UNFCCC.
UNFCCC, 2008. Report of the Conference of the Parties on its thirteenth session, held in Bali from 3 to 15 December 2007_Addendum. Part Two: Action taken by the Conference of the Parties at its thirteenth session, s.l.: UNFCCC.
UNFCCC, 2015. Technology Mechanism: Enhancing climate technology development and transfer, s.l.: UNFCCC.
UNFCCC, 2016. Technology and the UNFCCC: Building the foundation for sustainable development, s.l.: UNFCCC.
UNFCCC, 2017. Review of the functions of the Standing Committee on Finance, s.l.: UNFCCC. UNFCCC, 2018. Linkages between the Technology Mechanism and the Financial Mechanism of the Convention,
s.l.: UNFCCC. UNFCCC, 2019. Joint annual report of the Technology Executive Committee and the Climate Technology Centre
and Network for 2019, s.l.: UNFCCC. UNFCCC, 2019. Report of the Conference of the Parties serving as the meeting of the Parties to the Paris
Agreement on the third part of its first session, held in Katowice from 2 to 15 December 2018. Addendum. Part two., s.l.: UNFCCC.
UNFCCC, 2016. Mapping climate technology development and transfer activities and initiatives under and outside the Convention relevant to the implementation of the Paris Agreement, s.l.: UNFCCC.
UN Inter-agency Task on Financing for Development, 2019. Financing for sustainable development report 2019, New York: United Nations.
Villatico, F., 2019. Linkages between the Technology and Financial Mechanism of the UNFCCC: collaboration between NDEs and NDAs. [Online] Available at: https://www.ctc-n.org/sites/www.ctc-n.org/files/s.6.1_ctcn-gcf_pipeline_mr._federico_villatico.pdf
Wang, S., Tae, S. & Kim, R., 2019. Development of a Green Building Materials Integrated Platform Based on Materials and Resources in G-SEED in South Korea. Sustainability 2019. 11, 6532, pp. 1-19.
Wheeler, S. M., 2008. State and Municipal Climate Change Plans: The First Generation. Journal of the American Planning Association, Volume 74 (4), pp. 481-496.
Yang, W., 2019. Changes in air pollutant concentrations due to climate change and the health effect of
exposure to particulate matter. 보건복지포럼, 269(3), pp. 20-31.
Yoo, H. et al., 2017. Health Vulnerability Assessment for PM10 due to Climate Change in Incheon. 인천지역
기후변화에 따른 미세먼지의 건강 취약성 평가. J Environ Health Sci. 한국환경보건학회지, 43(3),
pp. 240-246.


ECLAC Technologies for adapting to climate change... 75
Annexes
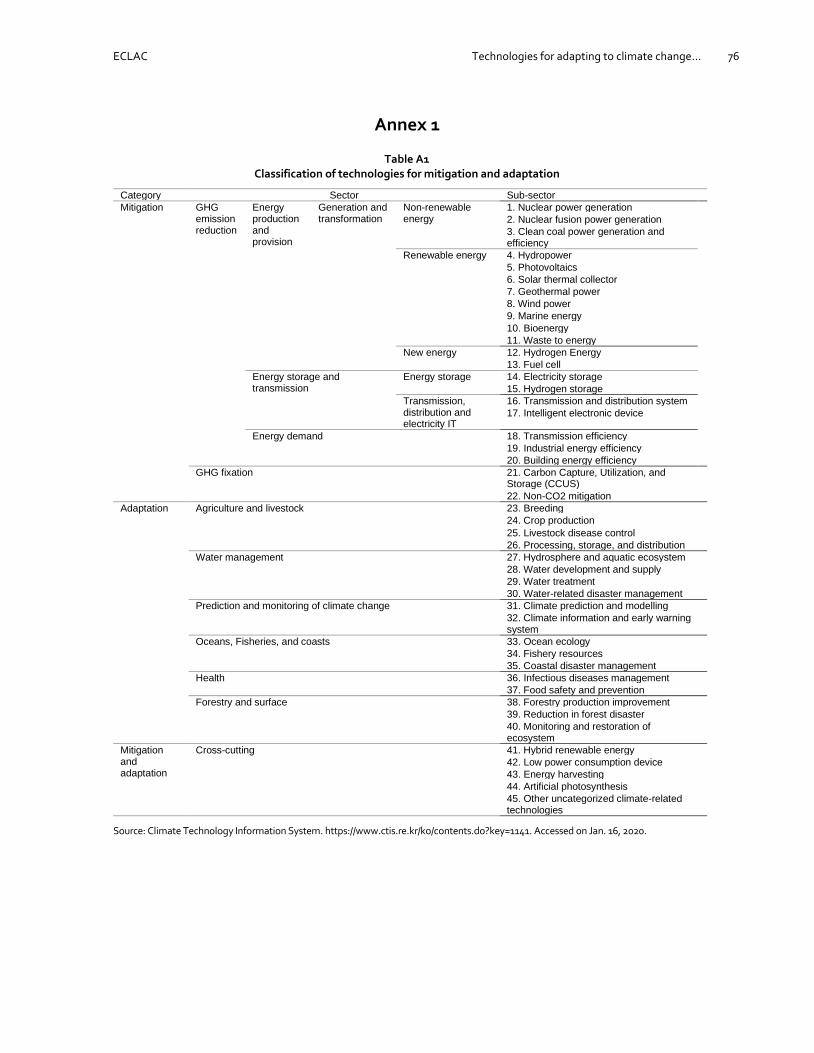
ECLAC Technologies for adapting to climate change... 76
Annex 1
Table A1 Classification of technologies for mitigation and adaptation
Category Sector Sub-sector
Mitigation GHG emission reduction
Energy production and provision
Generation and transformation
Non-renewable energy
1. Nuclear power generation
2. Nuclear fusion power generation
3. Clean coal power generation and efficiency
Renewable energy 4. Hydropower
5. Photovoltaics
6. Solar thermal collector
7. Geothermal power
8. Wind power
9. Marine energy
10. Bioenergy
11. Waste to energy
New energy 12. Hydrogen Energy
13. Fuel cell
Energy storage and transmission
Energy storage 14. Electricity storage
15. Hydrogen storage
Transmission, distribution and electricity IT
16. Transmission and distribution system
17. Intelligent electronic device
Energy demand 18. Transmission efficiency
19. Industrial energy efficiency
20. Building energy efficiency
GHG fixation 21. Carbon Capture, Utilization, and Storage (CCUS)
22. Non-CO2 mitigation
Adaptation Agriculture and livestock 23. Breeding
24. Crop production
25. Livestock disease control
26. Processing, storage, and distribution
Water management 27. Hydrosphere and aquatic ecosystem
28. Water development and supply
29. Water treatment
30. Water-related disaster management
Prediction and monitoring of climate change 31. Climate prediction and modelling
32. Climate information and early warning system
Oceans, Fisheries, and coasts 33. Ocean ecology
34. Fishery resources
35. Coastal disaster management
Health 36. Infectious diseases management
37. Food safety and prevention
Forestry and surface 38. Forestry production improvement
39. Reduction in forest disaster
40. Monitoring and restoration of ecosystem
Mitigation and adaptation
Cross-cutting 41. Hybrid renewable energy
42. Low power consumption device
43. Energy harvesting
44. Artificial photosynthesis
45. Other uncategorized climate-related technologies
Source: Climate Technology Information System. https://www.ctis.re.kr/ko/contents.do?key=1141. Accessed on Jan. 16, 2020.

ECLAC Technologies for adapting to climate change... 77
Annex 2
Table A2
List of adaptation measures by Seoul Metropolitan Government, 2018
Category Sector Measures (in Korean) (in English)
Mitigation Energy consumption - 자동차 공회전 제한 및 배출가스 점검
- 승용차마일리지 제도 운영
- 에코마일리지제도 운영
- 철도 중심 녹색교통망 확충
- 녹색교통진흥구역 운영
- 에너지자립마을·에너지공동체 조성
- 에너지 복지기금(플랫폼) 구축
- 노후 운행 경유차 조기폐차 등
- 친환경자동차 보급 지원 확대(전기차)
- 중앙버스 전용차로 확충
- 미세먼지 비상저감조치시 공해차량
운행제한
- 수소전기차 보급 및 충전소 확대
- 교통유발부담금 제도개선 통한 감축량 확대
- 공공자전거 운영
- 나눔카 사업
- Restriction of car engine idles and inspection of gas emissions - Driving-mileage program - Eco-mileage program - Train-centered green transport network - Green Transport Promotion Zone - Creation of energy autonomous village and energy community - Creation of Energy Welfare Fund (Platform) - Early scrapping old diesel vehicles - Promotion of eco-friendly vehicles - Expansion of Bus Rapid Transit - Restriction of polluting vehicles during the fine dust emergency reduction measure - Promotion of Fuel Cell Electric Vehicle (FCEV) and expansion of stations - Transportation impact fee - Bicycle sharing - Car sharing
Energy efficiency - 친환경 고효율 보일러 보급
- 주택 BRP 활성화
- 에너지 다소비 건물 효율화 추진
- 공공건축물 에너지 제로화
- 민간부문 LED조명 설치 확대
- 공공부문 LED조명 보급 확대
- 에너지절약형 LED간판 교체
- 주택가 친환경 LED보안등 개선
- 공원 가로등을 고효율 LED 등으로 교체
- 저전력 고효율의 그린 데이터센터 구현
- 서울교통공사 시설개선 등 효율화 사업추진
- 마곡 스마트시티 조성
- 신축 대형건물 에너지관리시스템 도입 및
자립 확대
- 에너지취약계층 LED 무상교체 지원사업
- 녹색건축물 설계기준 연차별 강화
- 공공임대주택 에너지 효율화 사업
- 저소득층 주택 에너지 효율화 사업
- 서울 외곽지역 유휴에너지 활용한 건물
냉난방
- 도•소매업 고효율 LED간판 교체지원사업
- 서울가꿈주택사업 집수리 및 보조 지원 확대
- Provision of eco-friendly and high-efficient boiler - Activation of Building Retrofit Program (BRP) for residential buildings - Energy efficiency of multi-consuming buildings - Net zero in public buildings - Installation of LED lights in private sector - Installation of LED lights in public sector - Replacement with energy-saving LED signs - Replacement with LED security lights in residential area - Replacement with LED lights in parks - Creation of energy-efficient green data center - Improvement of facilities in Seoul Metro - Building a smart city in Magok - Introduction of energy management system in new and large buildings - Provision of LEDs for households vulnerable to energy - Strengthening green building regulations by annual program - Energy efficiency in social housing - Energy efficiency in low-income households - Cooling and heating buildings using idle energy from peri-urban area - Replacement with LED signs in wholesale and small businesses - Seoul Gakkum House Project
Energy generation - 시민펀드 조성으로 신재생에너지 생산 확대
- 태양광 랜드마크 조성
- 집단에너지(지역냉난방) 공급 확대
- Increase in renewable energy generation by citizen fund - Building a solar energy landmark - Extension of Combined Heat and Power (CHP)

ECLAC Technologies for adapting to climate change... 78
Category Sector Measures (in Korean) (in English)
- 미활용에너지 및 잠재에너지원 발굴
- 태양광 100만 가구 확산
(공동주택 베란다형 및 주택형 보급)
- 태양광 100만 가구 확산(민간건물,
임대주택 등)
- 연료전지 발전시설 보급 확대
- 건물형 열병합발전시설 보급 확대
- 시 공공건물 태양광 설치
- 구 공공건물 태양광 설치
- 국가 공공건물 태양광 설치
- 소수력 발전시설 설치
- 공영차고지 등 태양광 설치
- Finding idle energy and potential energy source - Promotion of solar panels with a goal of 1 million households (residential buildings) - Promotion of solar panels with a goal of 1 million households (social housing and private buildings) - Expansion of fuel cell generation facilities - Expansion of Combined Heat and Power (CHP) for buildings - Installation of solar panels in city government’s buildings - Installation of solar panels in municipality buildings - Installation of solar panels in central government’s buildings - Installation of small hydro power facilities - Installation of solar panels in public parking lots
Resource circulation - 배출권거래제 선도를 통한 온실가스 감축
- 시민이 참여하는 폐기물 재활용
- 나눔장터 운영
- 주택가 재활용정거장 운영
- 전자폐기물 재활용률 향상
- 음식물쓰레기 원천 감량화
- 음식물쓰레기 감량 기반 조성
- 3천만 그루 나무심기
- 재생수(재처리수) 공급 확대
- 1회용 플라스틱 없는 서울
- 재활용 으뜸도시 서울
- 정수장 유효율 향상
- 기후변화대응 냉매 관리 강화
- Leading in emission trading system - Waste recycling with citizens’ participation - Operation of flea and sharing market - Installation of recycling stations in residential area - Increase in recycling rate of electronic waste - Reduction in food waste - Planting 0.3 million trees - Increase in provision of recycled water - Zero plastic in Seoul - The best city of waste recycles - Improvement of effective water ratio of water purification plant - Enhancement of refrigerant management in response to climate change
Adaptation Health - 어르신 무더위쉼터 운영
- 폭염 정보전달 체계 및 저감시스템 운영
강화
- 쪽방촌 거주민과 거리노숙인 보호 및
지원체계 운영
- 취약계층 폭염대비 방문건강 관리
- 건설공사장 근로자 보호대책 강화
- 기후변화 대비 감염병 대응체계 구축
- 어린이 활동 공간 환경안전관리 점검 및
교육•홍보
- 폭염대응 쿨링포그 시스템 시범운영
- 폭염 시민행동요령 홍보
- 감염병 감시 및 관리 강화
- 식중독 발생 신속 대응체계 강화
- 식중독 발생 우려시설 집중 관리
- 대기오염 취약지역을 고려한 아토피•천식
안심학교 사업
- 초미세먼지 저감을 위한 생활습관 개선 홍보
- Cooling center for old people - Enhancement of heatwave reduction and information system - Support for low-income neighborhoods and homeless people - Visiting service for vulnerable people during heatwave - Improvement of protection regulations for outdoor construction workers - Establishment of the strategy for contagious diseases in response to climate change - Inspection, education and promotion of the environment security of children’s play area - Pilot project of cooling fog system responding to heatwaves - Manual for citizens’ response to heatwave - Strengthening the inspection and management of contagious diseases - Strengthening a rapid response system against food poisoning - Strengthening the management system in institutions of high risk in food poisoning - Atopic dermatitis and asthma free school in air pollution prone areas - Change of citizens’ lifestyle to reduce microfine dust

ECLAC Technologies for adapting to climate change... 79
Category Sector Measures (in Korean) (in English)
- 취약계층 보건용 마스크 보급 - Provision of face mask for vulnerable people
Disaster - 대기오염 예•경보제 운영
- 고농도 미세먼지 비상저감조치 이행
- 공공장소의 자동심장충격기 구비 및 관리
강화
- 한파(폭염 등) 거리노숙인 보호대책 추진
- 미세먼지를 재난으로 규정, 미세먼지
취약계층 보호 강화
- 대기오염 측정망 구축 및 운영
- 노후경유차 근절을 위한 운행제한
- 친환경 건설기계 사용 의무화로 다량배출원
감축
- 미세먼지 저감을 위한 도로분진흡입 및
물청소
- 하천 예•경보 체계 구축 및 활용
- 재해지도 작성 및 활용
- 10만 안전파수꾼
- 취약계층 풍수해 보험 도입 및 활성화
- 풍수해 취약지역 유지관리 마련
- 자동액상 살포장치 설치 확대
- 민간제설기동반 구성 및 운영
- 한파 상황관리체계 구축 운영
- 겨울철 수도계량기 동파예방 추진
- Air quality forecast and early warning system - Establishment of the Emergency Fine Dust Reduction Measures - Installation of automated external defibrillator in public places - Care service for homeless people during extreme hot/cold weather - Categorize find dust into disasters and protect vulnerable people - Air pollution monitoring network - Restriction of the operation of old diesel vehicles - Legalization of the use of the eco-friendly construction equipment - Cleaning road using dust vacuum or water spray - Flood forecasting and early warning system - Disaster information map - 100,000 safety watchmen - Promotion of storm and flood damage insurance for vulnerable people - Establishment of the management strategy for storm and flood prone area - Auto snow/ice removal liquid spray - Formation of private task force for snow-removing - Establishment of cold wave monitoring system - Prevention from freezing water meters during winter
Water - 배수시설 체계적 정비 및 확충으로 집중호우
대응 능력 향상
- 상수관로의 누수량 최소화를 통한 유수율
제고
- 한강 및 지천수질의 실효성 있는 대책 마련
- 침수취약지역 침수 안전도 강화
- 물 재이용 시설의 설치 확대
- 지하수자원의 보전 및 체계적 이용
- 합류식하수도월류수(CSOs) 저류시설 설치
확대
- 물재생센터 초기우수처리시설 설치 확대
- 민간단체의 수질보전 감시 및 관리 강화
- Improvement of drainage system - Minimization of water leakage from pipelines - Water quality control of Han River and its streams - Management of Flood Safety Index of flood-prone areas - Expansion of water reuse facilities - Conservation and strategic use of underground water - Expansion of Combined Sewer Overflows (CSOs) retention facilities - Expansion of CSO/WWF treatment facilities at water recycling centers - Enhancement of the inspection and management of water quality with collaboration of Civil and Social Organizations (CSOs)
Forestry /Ecosystem
- 산불방지 대책
- 생물다양성 전략 계획 수립
- 취약생태계의 관리 강화
- 열섬화 현상 및 호우대비 가로수 띠녹지
조성
- 옥상녹화 및 텃밭 조성
- 공원돌보미, 나무돌보미 사업 추진
- 산림재해 예방활동 강화 및 통합관리
- 사면관리 통합시스템 구축
- 산림생태계 환경 개선
- 산림병해충 방제 강화
- 근교산 등산로 정비
- Wildfire Prevention - Establishment of strategic plan for diversity - Strengthening vulnerable ecosystem - Urban green street to prevent from heat islands and impacts of heavy rainfall - Urban garden and green roof - Projects of Park Care and Tree Care - Preventive activities against forestry disasters and integrative management - Building a slope integrative management system - Improvement of forest ecosystem environment - Strengthening the prevention of forestry insects - Improvement of mountain paths

ECLAC Technologies for adapting to climate change... 80
Category Sector Measures (in Korean) (in English)
- 생물지표종 지정 및 모니터링
- 에코스쿨 조성
- 사회공헌형 탄소상쇄 숲 조성
- 도시 구조물 콘크리트면 녹화
- 에너지절감을 위한 녹색커튼 시범사업
- 도심형 식물공장 모델 개발 및 보급
- 도심 자투리 공간 텃밭 조성
- 학교 텃밭 조성 및 교육 프로그램 운영
- 도시농부학교 확대 운영
- Establishment and monitoring of Climate-sensitive Biological Indicator Species - Creation of the Eco School - Formation of a carbon-sink forest by Corporate Social Responsibility (CSR) - Making building’s concrete surfaces green - Piloting green curtain plants projects to reduce energy consumption - Development and deployment of urban plant factory model - Making family gardens in empty plots of the city - Making vegetable gardens in school and operation of educative programs - Expansion of urban farmer school
Public awareness and cooperation - 기후변화 교육과 홍보
- 기후변화 거버넌스
- 기후변화 국제협력
- Climate change education and public relations - Climate change governance - Climate change international cooperation
Source: Seoul Metropolitan City (2019).
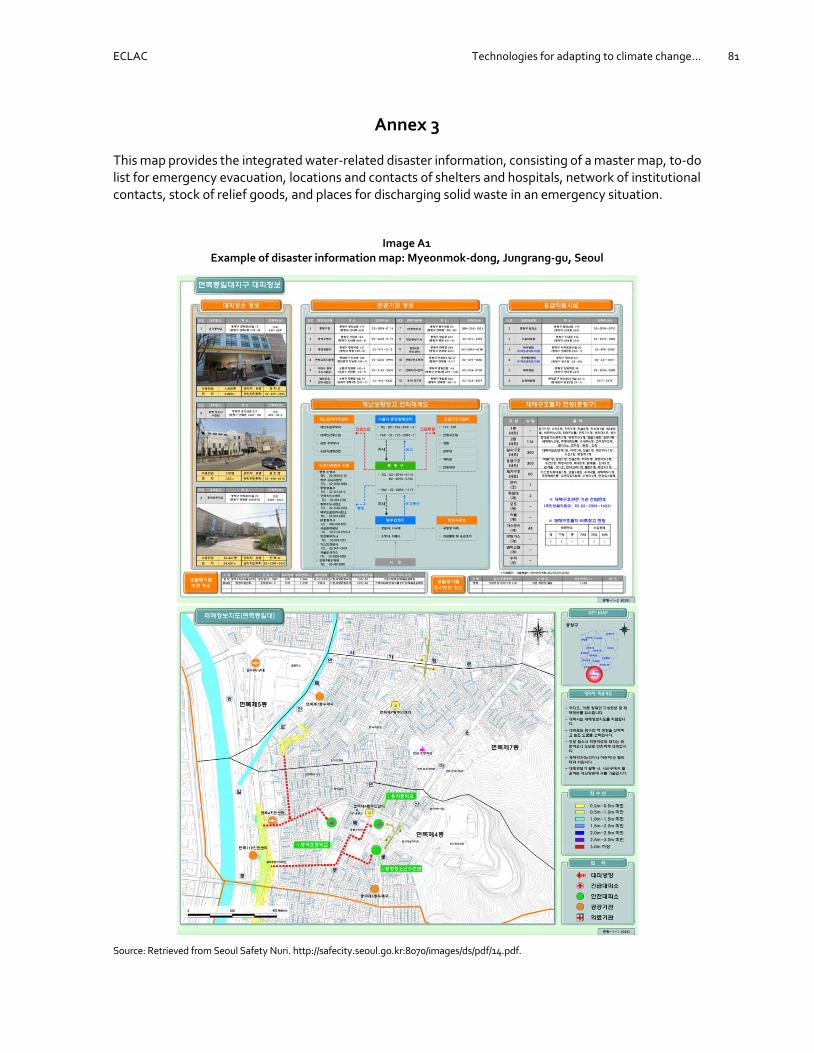
ECLAC Technologies for adapting to climate change... 81
Annex 3
This map provides the integrated water-related disaster information, consisting of a master map, to-do list for emergency evacuation, locations and contacts of shelters and hospitals, network of institutional contacts, stock of relief goods, and places for discharging solid waste in an emergency situation.
Image A1 Example of disaster information map: Myeonmok-dong, Jungrang-gu, Seoul
Source: Retrieved from Seoul Safety Nuri. http://safecity.seoul.go.kr:8070/images/ds/pdf/14.pdf.

ECLAC Technologies for adapting to climate change... 82
Annex 4
Table A3 Technologies for coastal adaptation
Stage Purpose Application Technology/Measure
Information development and awareness-raising
Coastal system description
Coastal topography and bathymetry
- Mapping and surveying - Videography - Airborne laser scanning (lidar) - Satellite remote sensing
Wind and wave regime - Wave rider buoys - Satellite remote sensing
Tidal and surge regime - Tide gauges
Relative sea level - Tide gauges
Absolute sea level - Historical and geological methods - Satellite remote sensing - Tide gauges, satellite altimetry, global positioning systems
Past shoreline positions - Historical and geological methods
Land use - Airborne and satellite remote sensing
Natural values - Resource surveys
Socio-economic aspects - Mapping and surveying
Legal and institutional arrangements - Interviews, questionnaires
Socio-cultural factors - Interviews, questionnaires
Climate impact assessment
Index-based methods - Coastal vulnerability index - Sustainable capacity index
(Semi-) quantitative methods - IPCC common methodology - Aerial-videotape assisted vulnerability assessment - UNEP impact and adaptation assessment
Integrated assessment - Coupled models
Awareness-raising
Printed information - Brochures, leaflets, newsletters
Audio-visual media - Newspapers, radio, television, cinema
Interactive tools - Board-games - Internet - Computerized simulation models
Implementation Protect against sea-level rise
Hard structural options - Dikes, levees, floodwalls - Seawalls, revetments, bulkheads - Detached breakwaters - Floodgates, tidal barriers - Saltwater intrusion barriers
Soft structural options - Periodic beach nourishment - Dune restoration and creation - Wetland restoration and creation
Indigenous options - Afforestation - Coconut leaf walls - Coconut fiber stone units - Wooden walls - Stone walls
(Managed) retreat from sea-level rise
Increasing or establishing set-back zones
- Limited technology required
Relocating threatened buildings - Various technologies
Phased-out or no development in exposed areas
- Limited technology required
Presumed mobility, rolling easements - Limited technology required
Managed realignment - Various technologies, depending on location
Creating upland buffers - Limited technology required
Accommodate sea-level rise
Emergency planning - Early warning systems - Evacuation systems
Hazard insurance - Limited technology required
Modification of land use and agricultural practices
- Various technologies (e.g., aquaculture, salt-resistant crops), depending on location and purpose
Modification of building styles and codes
- Various technologies
Strict regulation of hazard zones - Limited technology required
Improved drainage - Increased diameter of pipes - Increased pump capacity
Desalination - Desalination plants
Monitoring Similar to technologies/measures for ‘coastal system description’ presented above
Source: Combined Table 2 and 3 from UNFCCC (2006, pp. 27, 30).

ECLAC Technologies for adapting to climate change... 83
Annex 5
Green building policies and materials
As part of efforts to achieve national green growth goals, the Korean government promotes the use of environmentally friendly materials of construction. As for regulatory measures, there are three laws and policies in general: Green Building Construction Support Act, Green Building Certification Criteria (GBCC), and Green Standard for Energy and Environmental Design (G-SEED). The Green Building Certification Criteria was established in 2002, led by the collaboration of the Ministry of Environment and the Ministry of Land, Infrastructure, and Transport. The Korea Environmental Industry and Technology Institute (KEITI) is authorized to operate the certification system. The criteria reflect seven aspects of the building: land use and transport, energy and environmental pollution, materials and resources, water management, maintenance, ecosystem, indoor environment. In addition, applicants can get an additional score on their innovative design. The certification is valid for five years. It is mandatory to get the certification if the building’s floor area is 3,000 m2 or more and constructed by governments. To promote the certification, several incentives have been introduced, such as the reduction in acquisition tax, support for certification cost, and ease of floor area ratio and building height. To facilitate commercialization, the KEITI operates the Green Construction Materials Information System (http://gmc.greenproduct.go.kr/main.do), which website functions as a platform for providing information on green building materials, sharing best practices, and bridging providers and consumers.
Diagram A1 Governance for green buildings
Source: Author, based on G-SEED https://www.gbc.re.kr/app/info/outline.do.

ECLAC Technologies for adapting to climate change... 84
Table A4 Milestones of green building policies
Stage Year Details
Pilot 1999 Pilot certification of green buildings, by Ministry of Environment
Establishment of certification
2002 Green Building Certification Criteria (GBCC): public housing First selection of accreditation entities: Korea Land and Housing Corporation, Korea Institute of Energy Research, and CreBizQm Co.
Diversification 2003 GBCC: office building and mixed-use residential building
2005 GBCC: education buildings
2006 Establishment of Article 65. Green building certification of the Building Act Additional accreditation entity: Korea Institute of Sustainable Design and Educational Environment GBCC: sales facilities and accommodation facilities
2008 Seoul: Ordinance of establishment and operation of climate change fund, including building energy efficiency project loan Establishment of Green Building Certification Decree
Materialization 2009 Establishment of Green Home Evaluation
2010 Establishment of building code of Clean and Healthy Home
2011 Establishment of Intelligent Building Certification
Specialization 2013 Establishment of Green Buildings Construction Support Act Transition from Green Building Certification Criteria (GBCC) to Green Standard for Energy and Environmental Design (G-SEED) Establishment of Health-Friendly Housing Construction Standards
2014 Establishment of Long-Life Housing Certification Criteria
2015 Establishment of Crime Prevention through Environmental Design (CPTED)
2020 Establishment of Zero Energy Building Certification
Source: Kim and Kim (2020, p. 34)25 and G-SEED by KEITI. https://www.gbc.re.kr/app/info/outline.do. Accessed on June 1, 2020.
Out of the seven (7) green building certification criteria, building materials and resources are evaluated based on the following standards, considering the purpose of building (see Table A5). For new buildings, the use of products with EPD label (Environmental Product Declaration) and the ratio of green building materials are given the highest weight.
Table A5 Standards of materials and resources in G-SEED
(unit: score on each element)
(New) Housing: general/public Non-housing: General/office/schools/accommodations
(New) Single-detached house
(Old) Housing: general/public Non-housing: General/office/schools/accommodations
Use of products with EPD
4 4 -
Guideline for purchasing green product
- - 3
Use of low carbon materials
2 2 -
Use of recycled materials
2 2 -
Use of materials reducing hazardous substances
2 - -
Ratio of green building materials
4 - -
Recyclable resources management - - 2
Installation of recyclable resources storage
1 - 2
Source: G-SEED. https://gseed.greentogether.go.kr/sys/cis/actionDetlEstmStd2016.do. Accessed on June 3, 2020.
25 Kim, K. & Kim, N., 2020. 녹색건축인증 과거, 현재, 미래. Past, present and future of environmentally friendly certification. Journal
of the KGBC Vol.21, No.1, pp. 33-41.

ECLAC Technologies for adapting to climate change... 85
The development of green building materials is in transition to considering issues related to CO2 emissions from production process and the shortage of natural resources, in addition to a direct impact on the living environment. Thus, low-carbon materials and recycled materials are having more attention and substituting for traditional construction materials, such as cement and concrete (see Diagram below).
Diagram A2 Paradigm shift in technology for future building materials
Source: Lee (2011, p. 41)26.
As illustrated in the figure above, a variety of environmentally friendly materials have been introduced in the market by applying technologies related to low carbon and/or resource recycling. The investment in the development of these materials is actively led by private companies, while the government focuses on regulatory and institutional measures. Notably, the conglomerates, such as POSCO, Daewoo, and Lotte, operate their own institutes dedicating to research on construction technologies, including sustainable green buildings and materials.
Table A6 shows a list of green materials in the construction market. The KEITI provides a full list of green material products registered in their system, and the latest version was updated in December 2019. Companies can apply for the verification of their green building material products to get environmental labels, such as Environmental Product Declaration (EPD) Materials, Low-Carbon Materials, Carbon-Footprint Materials, Good Recycled Materials, and Korea Eco-Label Materials (Wang, et al., 2019).27
Table A6 Examples of green building materials
Category Sustainable materials Benefit (Climate change)
Outdoor material
Concrete Environmentally friendly mass concrete: cork, recycled construction waste (e.g., recycled aggregates)
Insulation / noise reduction / CO2 emission reduction
Mitigation
Indoor material
Insulating material
EcoStone, made of natural building stone, corallite, and loesstone
Humidity regulation / odor removal / prevention of dew condensation
Adaptation
Carbonized board, diatomite board, charcoal board
Humidity regulation, eight times more effective than plasterboard / heat conduction / prevention of atopic dermatitis / prevention of mold
Adaptation
Soil: yellow soil board Humidity regulation / prevention of atopic dermatitis / odor removal / air purification / preservation from decay / temperature regulation (by preventing heat from outside and keeping indoor temperature) / smokeless / antibiosis / ventilation
Adaptation
26 Lee, S., 2011. Futuristic Environment Friendly Construction Material -Regarding Carbon Reducing Construction Material Planning-.
대한건축학회지 v.55 n.4, pp. 38-41. 27 Wang, S., Tae, S. & Kim, R., 2019. Development of a Green Building Materials Integrated Platform Based on Materials and Resources
in G-SEED in South Korea. Sustainability 2019. 11, 6532, pp. 1-19.
Present Future
CO2 emission
CO2 emission reduction target
Natural resources
Resource limit
CO2 emission reduction technology Integration of resource recycling and CO2 emission reduction technologies
Resource recycling technology
CO2 capture (absorption-transmission) CO2 emission reduction
Measuring CO2 emission Technologies for CO2 capture (absorption-transmission) and recycling industrial by-product and waste
Recycling industrial by-product and waste

ECLAC Technologies for adapting to climate change... 86
Category Sustainable materials Benefit (Climate change)
Ecocart, made of ‘allophane’ extracted from natural volcanic ash clay
Humidity regulation / prevention of dew condensation
Adaptation
Wallpaper Corn Indoor air quality improvement / prevention of atopic dermatitis / prevention of poisonous gas emission on fire
Floor material
Bio-plasticizer, from beans or palm trees Noise reduction / heavy metal-free / CO2 emission reduction by replacing with cement
Mitigation
Ceiling material
Plaster Tex Prevention of atopic dermatitis / non-inflammable
Source: Author, based on KEITI (2019).28
Concrete, as a primary construction material in general, has had significant environmental issues: limited treatment capacity while concrete waste increasing; extraction of natural resources; CO2 emission from the production process; and increase in industrial waste such as blast furnace slag and fly ash. Examples of construction materials from waste recycling are listed in Table A7.
Table A7 Construction materials from waste recycling
Category Waste for recycling Use of recycled materials
Organic waste Rice bran Aggregate, used for lightweight concrete
Rice husk ash Substitute for cement. Enhancer of high-strength concrete
Sawdust Used for door and window frame
Urban waste Waste concrete Aggregate used for secondary material for making concrete. Remarkable item in the market.
Waste bricks Aggregate. Mainly, clay bricks can be used for lightweight and high-strength concrete.
Incinerated ashes Used for concrete bricks, concrete pedestrian blocks, cinder blocks for garden beds, and tiles
Waste Styrofoam Aggregated with sand and cement for making semi-non-flammable lightweight concrete products
Waste FRP (Fiber-reinforced plastic)
Lightweight aggregate for concrete
Waste coal briquette ashes
Aggregated with cement and fly ash for making cement bricks
Composite garbage Aggregated with cement and specialized blending chemicals for making concrete pedestrian blocks and tiles
Industrial waste Blast Furnace Slag from iron mill
Used for making cement or slag cement. Powdered slags are used for producing high-quality construction materials.
Fly ash from coal-fired power plant
Used for making cement or blending concrete
Silica fume from ferrosilicon and silicon metal
Used for blending ultra-high-strength concrete. A remarkable item in the market and widely used for building skyscrapers.
Waste plastics from factories and farms
Used for making plastic concrete and blocks
Waste plaster Secondary material for cement or primary material for drywall
Powdered limestone Ground granulated supplementary cementitious materials
waste foundry sand Material for cement and blocks, and aggregate of concrete
Sludge from wastewater treatment
Used for making lightweight aggregate and boards
Waste glass Mixed with cementitious materials for making artificial limestone
Source: Lee (2005, p. 62).29
28 KEITI, 2019. 2020 Green Construction Materials. 2020 친환경건설자재정보. Seoul: Korea Environmental Industry and Technology
Institute. 29 Lee, S., 2005. Recycled construction material - with a special focus on aggregate and concrete. 재활용 건축재료-골재 및
콘크리트를 중심으로. Construction 대한건축학회지. v.49 n.10, pp. 61-63.
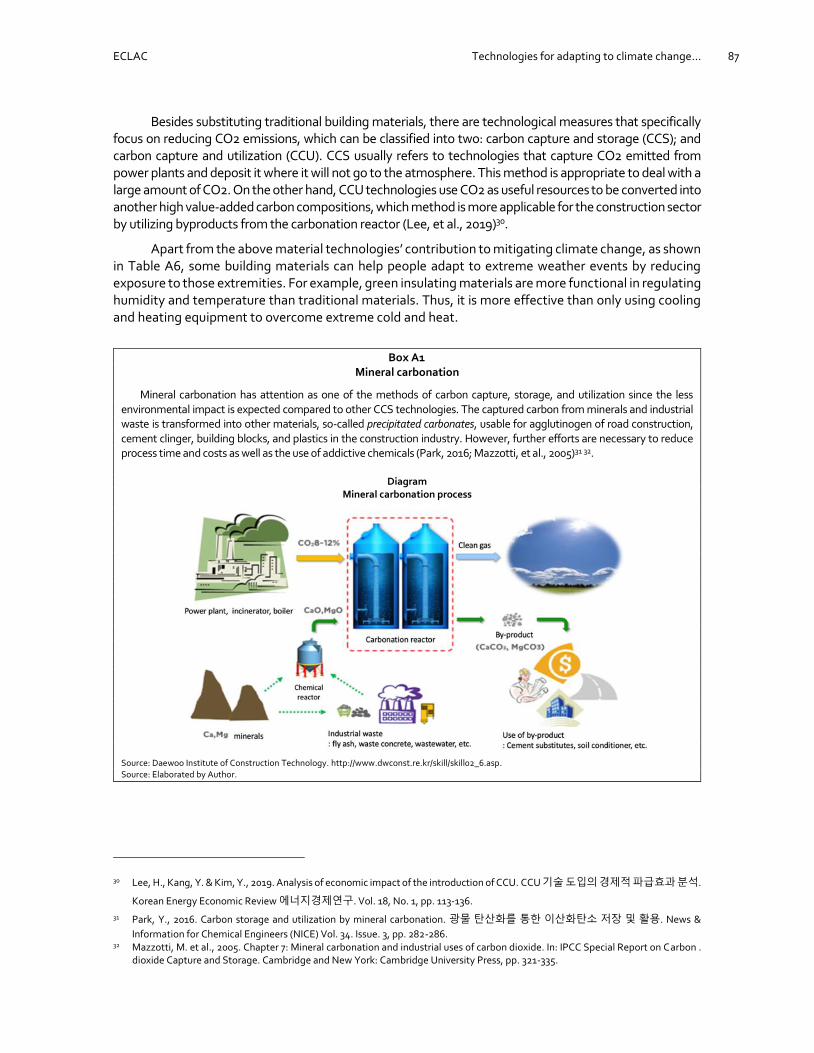
ECLAC Technologies for adapting to climate change... 87
Besides substituting traditional building materials, there are technological measures that specifically focus on reducing CO2 emissions, which can be classified into two: carbon capture and storage (CCS); and carbon capture and utilization (CCU). CCS usually refers to technologies that capture CO2 emitted from power plants and deposit it where it will not go to the atmosphere. This method is appropriate to deal with a large amount of CO2. On the other hand, CCU technologies use CO2 as useful resources to be converted into another high value-added carbon compositions, which method is more applicable for the construction sector by utilizing byproducts from the carbonation reactor (Lee, et al., 2019)30.
Apart from the above material technologies’ contribution to mitigating climate change, as shown in Table A6, some building materials can help people adapt to extreme weather events by reducing exposure to those extremities. For example, green insulating materials are more functional in regulating humidity and temperature than traditional materials. Thus, it is more effective than only using cooling and heating equipment to overcome extreme cold and heat.
Box A1 Mineral carbonation
Mineral carbonation has attention as one of the methods of carbon capture, storage, and utilization since the less environmental impact is expected compared to other CCS technologies. The captured carbon from minerals and industrial waste is transformed into other materials, so-called precipitated carbonates, usable for agglutinogen of road construction, cement clinger, building blocks, and plastics in the construction industry. However, further efforts are necessary to reduce process time and costs as well as the use of addictive chemicals (Park, 2016; Mazzotti, et al., 2005)31 32.
Diagram
Mineral carbonation process
Source: Daewoo Institute of Construction Technology. http://www.dwconst.re.kr/skill/skill02_6.asp. Source: Elaborated by Author.
30 Lee, H., Kang, Y. & Kim, Y., 2019. Analysis of economic impact of the introduction of CCU. CCU 기술 도입의 경제적 파급효과 분석.
Korean Energy Economic Review 에너지경제연구. Vol. 18, No. 1, pp. 113-136.
31 Park, Y., 2016. Carbon storage and utilization by mineral carbonation. 광물 탄산화를 통한 이산화탄소 저장 및 활용. News &
Information for Chemical Engineers (NICE) Vol. 34. Issue. 3, pp. 282-286. 32 Mazzotti, M. et al., 2005. Chapter 7: Mineral carbonation and industrial uses of carbon dioxide. In: IPCC Special Report on Carbon .
dioxide Capture and Storage. Cambridge and New York: Cambridge University Press, pp. 321-335.

ECLAC Technologies for adapting to climate change... 88
Annex 6
Table A8 Analysis result on Korean national and local governments’ technological practices in adapting to climate change
National Seoul Busan Daegu (Source)
1. Innovation 1.1. Development of adaptation technology information
Yes Yes Yes Yes Climate policy documents / interview
1.2. Collaborative approaches to climate technology (RD&D)
Yes Yes33 Yes34 Yes35 Climate policy documents / interview
1.3. Incentives for suppliers and consumers
No Yes36 No No Climate policy documents / list of projects (if available), interview
1.4. Active engagement of private sector
Yes Yes No Yes37 Climate policy documents / list of projects (if available), interview
Sub-score 3 4 2 3
2. Implementation 2.1. Presence of appropriate and effective institutions
Yes38 No No No Climate policy documents / interview
2.2. Employment of the Technology Needs Assessment (TNA)
Yes39 No No No Climate policy documents / interview
2.3. Integration into adaptation-related policies
Yes40 Yes Yes Yes Climate policy documents
2.4. Monitoring and evaluation
Yes Yes Yes Yes Climate policy documents / interview
Sub-score 4 2 2 2
3. Enabling environment and capacity-building
3.1. Public awareness enhancement
Yes Yes Yes Yes Climate policy documents / interview
3.2. Institutional arrangements for investment-friendly environment
No Yes41 No No Climate policy documents / interview
3.3. Improving access to technology information
Yes42 Yes43 No No Climate policy documents / interview
3.4. Consideration of gender perspective and indigenous knowledge
No Yes No No Climate policy documents / interview
Sub-score 2 4 1 1
4. Collaboration and stakeholder engagement
4.1. Multidimensional stakeholder engagement
Yes Yes Yes Yes Climate policy documents / interview
4.2. Engagement of private sector and civil society
Yes Yes Yes Yes Climate policy documents / interview
33 A private company that participated in the Seoul Metro Farm project has replicated the project in other areas involving other private companies.
34 Cool roof project was partially supported by a private company. 35 Daegu hosted the international cooling industry expo in 2019. 36 Seoul Green Industry Center (in Korean 서울시 녹색산업지원센터) supports start-ups and SMEs. 37 Daegu hosted the international cooling industry expo in 2019. 38 Green Technology Center (in Korean 녹색기술센터). 39 GTC (2017). A study on promising climate technology and project in response to demand from developing countries, and
interrelationship analysis of technology demand and supply. 40 The 2nd National Climate Change Adaptation Plan 2016-2020. 41 Diverse investment opportunities for citizens and private sector in public services were included in Seoul’s adaptation action plans. 42 Climate Technology Information System (CTis). https://ctis.re.kr/en/index.do. 43 Seoul Safety Nuri. https://safecity.seoul.go.kr/index.do.

ECLAC Technologies for adapting to climate change... 89
National Seoul Busan Daegu (Source)
4.3. Building city networks and collaboration with other cities44
Yes45 Yes46 No No Climate policy documents / interview
4.4. Collaboration with international organizations and other institutions; and participation in relevant initiatives
Yes47 Yes48 Yes49 Yes50 Climate policy documents / interview / websites of international networks
Sub-score 4 4 3 3
5. Support 5.1. Consideration of UNFCCC mechanisms: Technology and Finance Mechanisms
Yes No No No
Climate policy documents / interview
5.2. Innovative finance and investment
No Yes51 No No Climate policy documents / interview
5.3. Technical support or facilitation of access to financing for adaptation technologies in developing countries
Yes No No No Climate policy documents / list of projects (if available) / interview
5.4. View to balancing between support for mitigation and adaptation
Yes Yes52 No No53 Climate policy documents / interview
Sub-score 3 2 0 0
Total (Max. 20) 16 16 8 9
Source: Elaborated by author.
44 For assessing the national policies and practices, the scope of criterion was adjusted from city-level to country-level. 45 KACCC hosts periodical meetings of best practices on local adaptation with participation of city governments. Korea Climate &
Environment Network invites city governments to knowledge sharing and network building events. 46 Seoul has been active in hosting a variety of international events for city climate networks, which involve climate technologies. 47 Member of CTCN. 48 Member of Global Covenant of Mayors, ICLEI and C40. 49 Member of ICLEI. 50 Member of Global Covenant of Mayors and ICLEI. 51 Seoul Green Industry Center to support start-ups. Diversification of the types of investment in adaptation projects for attracting
more personal and private investors. 52 Seoul established a city act to ensure the development of action plans for both mitigation of and adaptation to climate change. 53 Periodical meetings with multi-stakeholders are programmed in the 2nd Daegu adaptation action plan to further develop both
mitigation and adaptation policies together.
This document presents the climate adaptation technologies applied in cities in the Republic of Korea and their implications for Latin American cities.
Considering demographic and geographical conditions of the Republic of Korea and Latin America, five Korean cities were selected: Seoul, Busan, Incheon, Daegu and Sejong. After exploring their practices, three cities —Seoul, Busan and Daegu— were evaluated by applying an analytical framework, which adapted the key themes of the United Nations Framework Convention on Climate Change (UNFCCC) technology framework: innovation, implementation, enabling environment and capacity-building, collaboration and stakeholder engagement, and support.
This case study sets forth the implications to be considered when Latin American cities use technologies as part of efforts to adapt to climate change. Firstly, national and local institutional environments need to be reformed by aligning them with national and regional climate-related policies as well as international initiatives. Secondly, since cities are where adaptation challenges must be faced, support for local governments needs to be enhanced by encouraging them to experiment with new adaptation technologies and transfer them to other cities. Finally, digitalization is one of the essential conditions for enabling adaptation technologies to work effectively.