Embed Size (px)
Citation preview

Pierre Pautré MS Biotechnology 2014/2015
Advisor: Chanel Mark
TechnologicalTransferOffice’sOrganizationandEfficiency:TheCaseof
theFrenchSystem.
Picture credit: www.fredhutch.org

2
TableofContentsListofFigures.....................................................................................................................4
ListofTables......................................................................................................................5
1. Introduction................................................................................................................6
1.1. Interest of the subject ..................................................................................................................... 6
2. Researchpresentation.................................................................................................8
2.1. Why technological transfer is important? ...................................................................................... 82.2. Research questions ......................................................................................................................... 8
First objective: What is the efficiency of the French TTO’s comparing to UK and US. ..................... 8Second objective: How can we improve it? ....................................................................................... 10
3. Literaturereview.......................................................................................................11
3.1. Knowledge production in France ................................................................................................. 113.1.1. An Historical review: the Colbertist State ............................................................................ 113.1.2. The first revolution 1980-2000: changes in Innovation and Research policy ...................... 133.1.3. The second revolution 2000-2015 ........................................................................................ 143.1.4. Challenges and new Theories ............................................................................................... 16
3.2. Technological Transfer Office’s .................................................................................................. 173.2.1. Why do we need them? ......................................................................................................... 173.2.2. Role and Business Model ...................................................................................................... 193.2.3. Organization ......................................................................................................................... 213.2.4. Why comparing France, USA and UK? ............................................................................... 23
4. ComparativestudyoftheefficiencyofthedifferentTTO’sorganizations..................25
4.1. The Metrics .................................................................................................................................. 254.2. Method ......................................................................................................................................... 264.3. Comparison .................................................................................................................................. 284.4. Discussion and Conclusion .......................................................................................................... 28
5. HowcanweimprovetheefficiencyoftheFrenchTTO?.............................................30
5.1. Financial structure and Business Model ...................................................................................... 305.1.1. Business Model ........................................................................................................................ 305.1.2. Financial structure ................................................................................................................... 32
5.2. Building one Project ..................................................................................................................... 335.2.1. Market Analysis ........................................................................................................................ 35

TechnologicalTransferOffice’sorganization:ThecaseoftheFrenchSystem.
3
5.2.2. Financial Model ....................................................................................................................... 375.3. RETURN ON INVESTMENT .................................................................................................... 415.4. Choosing one project regarding only its financial assets ............................................................. 425.5. Milestones and Royalties ............................................................................................................. 465.6. Impact on global Research. .......................................................................................................... 48
5.6.1. Classical model vs. Company .................................................................................................. 495.6.2. Return for the Public Research Organization .......................................................................... 515.6.3 Return for the company ............................................................................................................. 52
6. Conclusion.................................................................................................................54
ATTACHMENT1:MATHEMATICALMODELFORTHEDATAENVELOPMENTANALYSIS.......56
Bibliography.....................................................................................................................57

4
ListofFigures
Figure 1: From Research expenditure to Value creation (Fraser 2009) ................................... 16
Figure 2: Intermediary role of TTO’s ....................................................................................... 18
Figure 3: From basic research to marketing (Fraser 2009) ...................................................... 18
Figure 4: Knowledge transfer from PROs (European Commission 2009) .............................. 19
Figure 5: the three sub stages of the exploitation of knowledge (Landry et al. 2013) ............. 21
Figure 6: Thursby and Thursby three stages DEA model (Anderson et al. 2007) ................... 27
Figure 7: DEA outputs oriented model (Anderson et al. 2007) ............................................... 27
Figure 8: Business Canvas ....................................................................................................... 31
Figure 9: Financial organization of the company ..................................................................... 32
Figure 10: Investment in the company or in project regarding investors ................................. 33
Figure 11: Action of an ADC ................................................................................................... 34
Figure 12: Evolution of the number of patient ......................................................................... 36
Figure 13: Income from the three different market scenarios .................................................. 36
Figure 14: Average Cash Flow ................................................................................................. 37
Figure 15: FDA approval of the decision tree .......................................................................... 38
Figure 16: Phase III of the decision tree ................................................................................... 38
Figure 17: Phase II of the decision tree .................................................................................... 39
Figure 18: Phase I of the decision tree ..................................................................................... 40
Figure 19: Preclinical stage of the decision tree ....................................................................... 40
Figure 20: Evolution of the eNPV ............................................................................................ 41
Figure 21: Score of each project ............................................................................................... 45
Figure 22: Score based on the success rate .............................................................................. 45
Figure 23: Score based on the ROI .......................................................................................... 46
Figure 24: Evolution of milestones per investors ..................................................................... 47
Figure 25: ROI per investors from phase II to five years on the market .................................. 48
Figure 26: Evolution of the ROI with the classical model ....................................................... 50
Figure 27: Comparison of ROI between Classical model and Company ................................. 50
Figure 28: Evolution of the ROI taking into account the percentage perceived by the TTO .. 51
Figure 29: Company gain on one project ................................................................................. 52
Figure 30: Cumulative gain from initial deal to five years on the market ............................... 53
Figure 31: Cumulative benefices with one or two success ...................................................... 53

TechnologicalTransferOffice’sorganization:ThecaseoftheFrenchSystem.
5
ListofTables
Table 1: Average metrics of TTO’s from 2005 to 2011 ........................................................... 26
Table 2: Ratio of metrics .......................................................................................................... 26
Table 3: DEA analysis maximizing USA output ..................................................................... 28
Table 4: DEA analysis maximizing French output .................................................................. 28
Table 5: Parameters for the market analysis ............................................................................ 35
Table 6: Market penetration and market growth ...................................................................... 35
Table 7: Value and investment of the project from preclinical stage to FDA approval ........... 41
Table 8: ROI per Investors in the Phase I ................................................................................ 42
Table 9: ROI per investors in the Phase II ............................................................................... 42
Table 10: ROI per investors in the Phase III ............................................................................ 42
Table 11: Result of the financial analysis for the second project ............................................. 43
Table 12: ROI per investors in the Phase II (second project) .................................................. 43
Table 13: Financial analysis for five projects .......................................................................... 44
Table 14: Scoring each metrics ................................................................................................ 44
Table 15: Score of each project ................................................................................................ 44
Table 16: Value of each milestone ........................................................................................... 46
Table 17: Milestones per investors ........................................................................................... 47
Table 18: Estimation of Royalties for five years after the FDA approval ............................... 47
Table 19: Royalties per investors ............................................................................................. 48
Table 20: Milestones and royalties for the PRO with the classical model ............................... 49
Table 21: Evolution of the ROI taking into account the percentage perceived by the TTO .... 52
Table 22: DEA analysis with an increase of 150% of French licenses income ....................... 55

6
1. Introduction
1.1. Context
The French knowledge production ecosystem was really built after the Second World War. It
is based on a Colbertist model characterized by a big involvement of the state.
The international scientific performance in France is quite average, the transfer of the
production and the return on investment stayed weak (OECD 2014).
Since the 1980’s this ecosystem has changed a lot. New laws were implemented in order that
France stayed competitive regarding innovation and industrial application. One important
question during this period was how we can transfer new knowledge from public research to
the industry.
According to different studies and reports, France stayed weak in this domain comparing to
other countries as USA and UK (Curi et al. 2012; Curi et al. 2014; Conti & Gaule 2011;
Kiskiene 2014; Jackson et al. 2012). We will try to understand how this sector was built and
designed. To this end, we will study the history of the organization of the French knowledge
production. Then, we will focus on other countries in order to understand why we are not as
competitive in transferring technology as these countries.
Based on that study, we will suggest a solution to enhance this sector and to allow the office
in charge of the knowledge transfer (Technological transfer office) to be more independent
and more attractive for private investment. The final goal will be to develop new drugs at late
stage.
1.2. Interestofthesubject
French Technological Transfer Offices (TTO’s) are mostly support by public institutions. A
few ones are outside of Public Research Organizations (PRO’s). Most of them are only
departments of PRO’s without financial resources and the right knowledge that would make
them profitable. Even if some structures are more independent and have built business around
the Technological Transfer, they are still dependent of the institution behind them.
The only TTO’s that are “independent” are the SATT (Société d’Accélération du Transfert de
Technologies). They were developed after the “grand emprunt” made by french government.
They were created to develop the technological transfer and at the end of the “grand emprunt”
they will have to be sustainable.

TechnologicalTransferOffice’sorganization:ThecaseoftheFrenchSystem.
7
In order to answer the first question: how the French TTO’s are organized? We will review
the historical set-up of the knowledge production in order to understand the particular French
ecosystem. After, we will review the TTO’s organization and we will try to explain why we
need them.
Based on this first part, we will compare the performance of the French TTO’s to another
European country, the United Kingdom and to the USA in order to understand what are the
differences between those models. We will then answer the second question:
What is the performance of the French TTO’s compare to the UK and USA models? How can
we improve it?
One problem in the sustainability of TTO’s is the lack of financial asset. Some experts think
that a business based on the management of the IP (Intellectual Property) needs 10 years in
average to be financially sustainable (Thomas 2007; Carboni & Esteve 2015). In the actual
economic context, Universities have to face and deal with the lack of fund to ensure the
education. They also have to find money to run the laboratories (Vavakova 2006). That is
why they cannot afford to wait for royalties or milestones. They need to find other ways to
develop and push their best projects in late development stages (at least phase IIa/IIb). This
would ensure a better Return On Investment (ROI) and the sustainability of TTO’s.
But in order to make it possible, TTO’s have to find a way to attract private investors while
they stay the owner of the product they want to license or to sell after its development.
To involve more private funding in the Technological Transfer you have to make it more
attractive. Why a VC (Venture Capital) will invest in an early project when it will be later
licensed (if it is) to a biotech company or big pharma?
The idea is to build a biotech like company with private/public equity. Investors would not
put money in the company but in one or more projects the company will support.
In this part, we will demonstrate how huge can be the return on investment. And also how
TTO’s will became sustainable by building this kind of company. We will build a business
model that can be used to benchmark select projects based on the preclinical results.

8
2. Researchpresentation
2.1. Whytechnologicaltransferisimportant?
We need to study and set metrics to compare the different TTO’s and their respective
efficiency. The questions will be: what is the efficiency of the French TTO’s in an
international context? Can we improve it?
The main challenge of this project is to transform an inefficient system in something that
allows more financial liberties to TTO’s.
The main problem in public research is the lack of fund. TTO’s are here to transform
knowledge into money in order to support further research. This system is not as successful as
wanted by French institutions. Increasing the ability of TTO’s to push new drugs candidates
into late stage will have two main effects:
- More private fund involvement in public research. This will help and accelerate the
development of new drugs. At the end it will enhance the performance of international
scientific production in France.
- More help to public institutions and TTO’s. They will then become more sustainable.
Sales of product licenses in last development stage will increase the fees.
The objective is to develop a model that allows TTO’s to benchmark a project in order to
attract private investors.
2.2. Researchquestions
Firstobjective:WhatistheefficiencyofFrenchTTO’scomparedtoUKandUS.
To study and compare TTO’s we will try to answer those questions:
- What is the national organization of TTO’s?
Through an historical review, we will try to understand the organization of the knowledge
production in France. That will lead us to understand the need or TTO’s.
Then we will review the organization in two other countries: UK and USA.

TechnologicalTransferOffice’sorganization:ThecaseoftheFrenchSystem.
9
- What kind of metrics are we using and why?
We will use different databases:
• AUTM (Association of University Technology Managers),
• OECD (http://stats.oecd.org/),
• European community
(http://ec.europa.eu/eurostat/web/science-technology-innovation/data/database)
Those databases are built to follow different indicators as:
• Number of patent,
• Number of people involved in the research,
• Financial involvement of different institutions/states,
• Age of TTO’s.
We will also use some surveys (Piccaluga et al. 2011; Réseau C.U.R.I.E 2014; Conti & Gaule
2011). We will use those that already exist for different reasons:
• It is quite hard to make French people talk about money (in order to know more on the
deals made with the industry). The survey used for the French part of the analysis
came out in 2014. It is the first one with clear results.
• Those surveys are based on questions about metrics that are comparable between
countries. With those, we had enough results.
- How can we compare them?
We will use two different models. The first one is based on ratios between TTO’s production
of the amount of money spent in it. The second one is a Data Envelopment Analysis to assess
the relative efficiency of the TTO’s. We will built those models regarding the literature and
adapt it to the available data.
- What are the differences?
This last question will be the conclusion and the discussion of the first part. With the result of
this analysis, we will choose at least one point that can be improved.

10
Secondobjective:Howcanweimproveit?
At the end of this study we will try to explain what we can do to improve the efficiency of the
TTO’s. The idea is to modify at least one metric that is really important to explain the
differences between the different organizations.
One possibility will be to build a biotech like company that can push the project in late stage.
We will develop why it can be a solution regarding the market and the financial points of
view.
It will be developed in 4 questions:
- What will be the business plan of this company?
Through a business canvas, a SWOT analysis and a Porter analysis, we will explain the
positioning of the company. We will also explain the differences between this new company
and what already exists. In the end we will show why this kind of business plan can become
the add value of the company.
- What will be the financial structure?
As the business positioning will be in what is called the “valley of the death”, we will build a
particular financial structure to allow private and public investors to fund public research.
- How projects are chosen?
In this study we will explain how we can select a project based on a financial analysis. We
will assume that the project is already selected on scientific bases. So we will evaluate what
we have, what we need and what can be the market.
- What will be the NPV (Net Present Value) of the project regarding the different
stages?
With the financial analysis and regarding the investment of each partners of the project we
will set-up the expected return on investment (ROI). The NPV will be calculated taking into
account the investment in each clinical phases and the expected market.

TechnologicalTransferOffice’sorganization:ThecaseoftheFrenchSystem.
11
3. Literaturereview
3.1. KnowledgeproductioninFrance
France is traditionally a country of science and technology. Even today, France is at a
significant place in this domain. Since the 17th century, France participates actively to
scientific and industrial revolution. After the Second World War, the French system of
research and innovation is built to become what we know today (OECD 2014).
3.1.1. AnHistoricalreview:theColbertistState
It is commonly accepted that the French science and technology system has been developed
following a so called “Colbertist model” (Papon 1998; Papon 1973).
This model can be described by state intervention in the economy through publicly owned
companies (Papon 1998).
Historically, this model was set during the 17th century with two main objectives. The first
was the production of knowledge through the support of academic science and the second was
the implementation of national missions or public oriented policies through “mission-
oriented” institutions (Papon 1998; Ergas 1986).
This model can be described by three principal characteristics:
(1) Some institutions as the CNRS, INSERM, INRA… manage the organization and the
funding of the largest part of the fundamental research and are distinct from Universities.
(2) A dual higher education sector producing at least one type senior technical person little
known elsewhere, namely the “Grandes Ecoles” technical experts elite of engineers cum
industrial managers, cum high level political and administrative personnel.
(3) A pervasive involvement of the State in the production of general scientific and technical
knowledge, and in the production of patentable and/or immediately usable products (Mustar
& Larédo 2002; Ergas 1986).
One of these characteristics began with the creation of the CNRS just before the Second
World War in 1939. It is one of the only public fundamental research institutions in Europe
with this size and central role. At that time, University research was weak and this creation
developed the model of full time professional researcher. It was created to reinforce the

12
University research but does the exact opposite: accentuate its weaknesses. In the 1960’s was
took the decision to create units known today as Joint Units (“unites mixtes”). These Joint
Units set-up in University were able to host CNRS personnel, but it took around 20 years for
have, in full-time equivalent, as researcher between CNRS and Universities (Picard 1999;
Mustar & Larédo 2002).
We can also point out that the clear division between the research and Universities is
reinforcing by the creation of own governmental research structures after the WWII.
INSERM, INRA, INRIA and other were built. Comparing to other countries this kind of
structure became more autonomous; in France it stayed under the authority of the State
(Mustar & Larédo 2002). More of that, each of them are place under the guardianship of
different ministries: CNRS under the “Ministère de l’éducation”, CEA under the “Ministère
du développement et de l’industrie”… At the end the State played a great role in the national
economy by investing in the research (Papon 1973). In 1983 the percentage of share of
government-financed R&D carried out within the government sector was 47% (26% in the
USA) (Ergas 1986).
Another major trait is the major contribution of public funding in the research. Between the
end of the WWII and the 1970’s, the French public authorities concerted their efforts and
budgets on large program. Those kind of program existed in other countries but it was quite
systematically implemented in France. It led to the creation of the General Delegation for
Scientific and Technology Research (DGRST, that regrouped all civil R&D budgets from the
State), to the creation of the CEA (Atomic Energy Commission), the creation of INRIA
(“Plan Calcul”), etc… (Mustar & Larédo 2002).
And finally at the other end of knowledge production there is Industrial Research.
In this area the literature statue on three specific characteristics:
(1) The large amount of share financed and performed by the public sector relative to that of
industry.
(2) The importance of State subsidies and order for firm and the fact that SMEs (Small and
Medium Enterprise) are not involved in it (Mustar & Larédo 2002).
(3) “The instinctive over cautiousness of our manufacturers, their fear of risk, their ignorance
of how to take advantage of university research, in sum the ignorance of the benefits and
process of innovation…” (Salomon 1986). Looking at number comparing other countries, the
share of French enterprises in national R&D was only at 40% as compared to 60% in

TechnologicalTransferOffice’sorganization:ThecaseoftheFrenchSystem.
13
Germany and 63% in Japan. The firms in France were employing about 41% of all researcher
while the in the USA it was 56% (OECD 1982, 1985, 1991).
3.1.2. Thefirstrevolution1980-2000:changesinInnovationandResearchpolicy
“In the course of the 1980’s and 1990’s, the French research system – in both public and
private dimensions – has, in effect, experienced profound transformation” (Mustar & Larédo
2002).
The gap between research and Universities no longer exists. For example at the end of the
1990’s, ten new positions were created in the University for only one for the CNRS. That led
to a proportion of teacher researcher highly superior to the number of professional researcher.
Even in the “Grandes Ecoles” this number increased and for every five thesis produced in
France one came out research centers of those school (Papon 1998).
In 1982 a law for science and technology (The Law on programming of research and
technological development) was voted giving to scientific agencies (CNRS, INRA, Inserm)
both general and specialized tasks. Those agencies were entrusted new tasked and
responsibilities as the transfer and application of science and technology in the economy. In
each institution a service of valorization was created. The CNRS was allowed to engage in
industrial ventures (Papon 1998). There was a clear trend to build interdisciplinary approach
made by the CNRS to fight against the weakness established by the elitist attitude of the
French scientific community.
It was nearly the end of the large program as the laboratories have now a large degree of
freedom for choosing scientific issues (Papon 1998; Mustar & Larédo 2002). New entities
were created to enhance the collaboration between industry and governmental laboratory
(Grouping for public interest: “les GIP”).
Another major change of the system was the cooperation between France and Europe and the
launching in 1985 of the EUREKA program (it is still running today). It is an
intergovernmental organization focused on mobilizing funds and fostering collaboration. It
has been responsible for bringing together SMEs, large company, research institutes and
University (Anon 2015). Similarly new kind of joint unit were created between University,
CNRS and mission-oriented institutes like CEA, INSERM…

14
Region had a growing role following the Decentralization Act (1982). It allowed them to
support SMEs R&D and built their own new projects and policies (Mustar & Larédo 2002). In
addition of the right of the CNRS to build spin-off, between 1982 and 1992 more than 200
SMEs were created (Vavakova 2006; Mustar 1994).
“…Relation between public research and the enterprise sector…is one area where the change
were the deepest over the last years, thus rendering the critique of academic research as
unrelated to the enterprise sector, no longer pertinent today” (Mustar 1994: 352). The
cooperation between research and industry was confirmed by looking at the growing number
of contract and the growing number of patent application (Vavakova 2006).
Those changes led to decrease of the State sovereignty. The privatization of most state-owned
industrial company, bank, Assurance Company… has deprived the state of an essential tool to
influence national technological development. The support of industrial research by the State
is now limited to two major interventions. The first is through the ANVAR (Agence
Nationale de Valorisation de la Recherche) that allowed to SME’s reimbursable form of aid.
The second are taxes credit to promote the research. But the management of those
intervention is largely decentralized to the regional level (Mustar & Larédo 2002).
Nevertheless, at the end of the 1990’s, two reports, one from the Revenue court (Cours des
Comptes 1997) and another commissioned by the government (Guillaume 1998), made a
negative appraisal of the valorization practices of publicly funded institutions. The income of
the collaboration only account for 5 to 11% of their total budget, it appears that neither the
research laboratory nor the central administration benefit from contract with industry. An
anarchic situation is pointed out; only 60% of collaborations are reported to central
administration. Worst of that, the CNRS estimated that up to 2000 patent were given to
industry without any fees (Vavakova 2006).
3.1.3. Thesecondrevolution2000-2015
In 1999, a law was voted (the July 1999 Innovation Law) followed by a reform in 2001 (New
Public Management Oriented Reform). The first impact was to increase the number of TTO’s
(Curi et al. 2014). This increase is explained by the fact that before the law, not all
Universities had their own internal TTO. The Innovation law imposes to all universities to

TechnologicalTransferOffice’sorganization:ThecaseoftheFrenchSystem.
15
develop an explicit policy for commercializing their result and some private accounting rules
were introduced for technology transfer activities.
With this new policy, academic researchers must be more involved in the valorization of their
research. It became legally possible to develop their academic result with an industrial
approach. They are helped to build spin-off. In fact they can directly exploit it under some
conditions (Vavakova 2006).
2001 reform was introduced to accelerate and improve the quality of technology transfer
process by defining the funding scheme of technological transfer, identifying the key driver of
TTO’s performances and also defining the metrics aimed at monitoring the efficiency of
public spending. Even if an increase in the metrics was observed after the introduction of the
reform, the evidence of substantial growth in productivity of French TTO’s cannot be assured
(Curi et al. 2014). The French technological transfer process is a complex process
characterized by different kind of TTO’s. Their productivity is strongly dependent of their
environment (presence of hospital, age…). Nevertheless, the two laws provided a stimulus for
some TTO’s to push upward the frontier.
In 2005, the National Research Agency (ANR) was launch, and with it the fund directly
allocated to the CNRS and Inserm were reduce. In contrast with them, ANR doesn’t have any
scientist on its governed board and it grants fund to project based on a new system: call for
proposal. The research proposal have to be in line with particular field of research (Dente
2009). This new organization change the way research was funded. A major role of
Technological transfer offices appeared: sourcing and helping researcher to construct projects
in line with the call for proposal. In the other hand, with this evolution of funding, TTO’s
became a major actor in finding collaborations with industrials for projects that were not in
line with the policy of the ANR. The creation of the ANR was the result of the Pacte pour la
Recherche. The Research Pact project is based on three axes (i) a balanced development of
the three basic components of the research, (ii) the development of interfaces and cooperation
between actors and (iii) introduction of global and long-term strategy to increase confidence
between research and society (Muller et al. 2009). Some TTO’s were built in this period,
enjoying the policy of the government (SATT). PRO’s also need to have specific affiliates
that build expertise in the area of technological transfer and built strong relationship with the
private sector.

16
3.1.4. ChallengesandnewTheories
One problem is the high number of patents that are not licensed and the few number of
licenses that turn into significant earners. Based on the AUTM report (Figure 1), only 50% of
patents were licensed and only 0.5% of it had royalties (Fraser 2009) .
Figure 1: From Research expenditure to Value creation (Fraser 2009)
Part of the challenge of managing a technological transfer activity is the tension between the
reality that economic success is largely driven through a small proportion of the inventing
individuals, and the egalitarian nature of a university (Thomas 2007). For the Public Research
Organizations all research is important so all inventions have to be patented. One new theory
is not to play on the number of patent but on the maturation of a project (e.g a Patent and its
application) before its licensing. The other shift that occurs comparing to old theories is to
move more on start-up companies (Huggett 2014)
These two theories are really linked to the point of view of the investors on the technology
and on the institution they have to deal with. Looking at the technology, one main complaint
is that owners of new technology over-evaluate it. That is maybe an explanation on the very
small number of license deals.
Looking at the institution, investors prone to work with all institutions, they just want to avoid
a process that take time and delay the process of spinning out.
To enhance the technological transfer in France, Public research institutions have to enhance
their abilities to analyze and to market their patents. This is the main role of TTO’s and of the
SATT in particular.

TechnologicalTransferOffice’sorganization:ThecaseoftheFrenchSystem.
17
3.2. TechnologicalTransferOffice’s
3.2.1. Whydoweneedthem?
Worldwide, Technological Transfer Offices (TTOs) are at the interface between academic
research and industrial exploitation.
They play a critical role in the diffusion of innovation and the development of new
technology (Siegel et al 2007).
They have a large scale of activity:
- Sourcing: they have to manage different researcher,
- Portfolio management: they manage patents, study if an invention is patentable,
license it, sell it,
- Project management: they select different projects to invest in,
- Institutional relation.
In the biotechnological environment, this activity is highly important looking at the fact that
industries put less money in their R&D department. More of that it help start-up to build a
project and developed their business.
In fact they help to bridge the gap between research and innovation.
To build this bridge across the “Valley of death” (Landry et al. 2013) TTO’s emerge as
intermediation organizations. On one side of this valley we find producers of knowledge.
Universities and government laboratory respond to the need to maximize measurable research
unit. On the other side we find the users of this knowledge. This User, industry, acts to
maximize their commercial and financial assets (Landry et al. 2013).
In 2007, Macho argues that good industry-science relations have a positive impact on the
innovation performance. They conclude by explaining how TTO’s can play a specific role in
this relation (Macho Stadler et al. 2007). TTO’s have to build a reputation for laboratories
/institutions that they represent because their activities are not large enough. They point
another critical role: to reduce the asymmetric information between industry and science.
Industry can have some trouble to evaluate the quality of an invention when researcher have
problem to estimate the commercial value.
18
Figure 2: Intermediary role of TTO’s
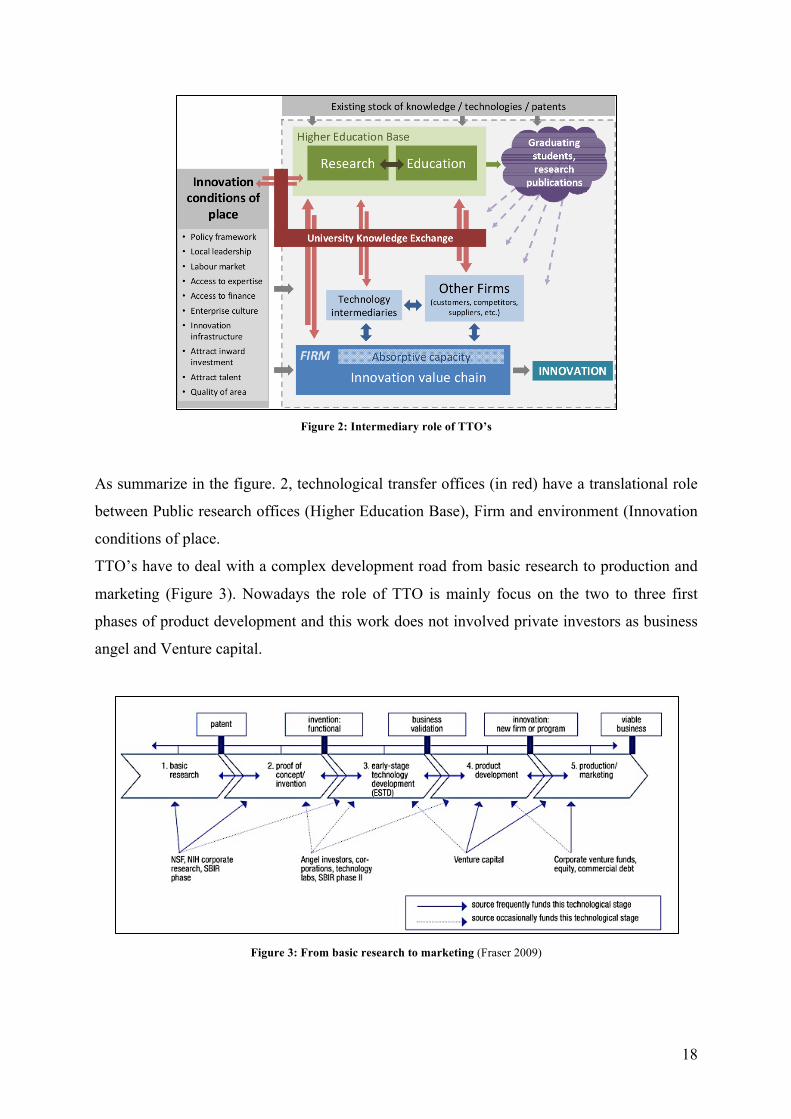
As summarize in the figure. 2, technological transfer offices (in red) have a translational role
between Public research offices (Higher Education Base), Firm and environment (Innovation
conditions of place.
TTO’s have to deal with a complex development road from basic research to production and
marketing (Figure 3). Nowadays the role of TTO is mainly focus on the two to three first
phases of product development and this work does not involved private investors as business
angel and Venture capital.
Figure 3: From basic research to marketing (Fraser 2009)
TechnologicalTransferOffice’sorganization:ThecaseoftheFrenchSystem.
19
3.2.2. RoleandBusinessModel
“Knowledge extremely important economic resource if exploited efficiently”.
(Jackson et al. 2012).
According to OECD and to the ENTENTE Consortium, TTO’s have different role. These two
reports identified the same main role that is to establish relationships with firm and
community actor through research collaborations. Theoretical and empirical work in
innovation economics suggests that setting up and maintaining good industry-science
relations positively affects innovation performance. The link with scientific knowledge is
especially important in fast growing technologies like biotechnology (Macho Stadler et al.
2007).
Collaborations can be defined by the provision of infrastructure and research expertise to
address a research need of an industrial partner (ENTENTE White Paper). Research
collaborations are the first step to other kind of activities. To build this partnership, TTO’s
developed different activities as sourcing and identifying technology opportunities. They have
to identify research that has potential commercial interests and strategies to exploit it.
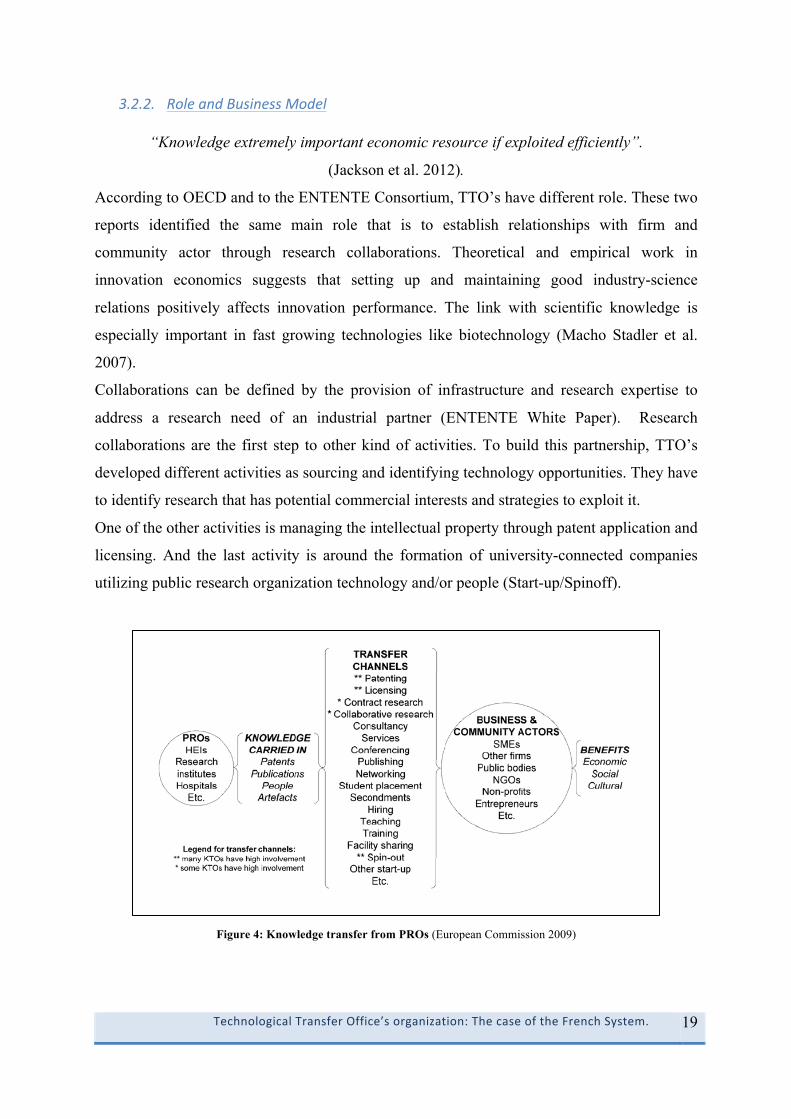
One of the other activities is managing the intellectual property through patent application and
licensing. And the last activity is around the formation of university-connected companies
utilizing public research organization technology and/or people (Start-up/Spinoff).
Figure 4: Knowledge transfer from PROs (European Commission 2009)

20
Technological transfer offices offer development and management services and are
instrumental in bridging between knowledge providers and knowledge users. The focus on
open innovation and the complexity of models of innovation (multiple and/or geographically
spatial partners), leads on a real need for intermediation. This role is also amplified by the fact
that in one hand large companies develop “knowledge gatekeepers” who search opportunities
and develop knowledge transfer while smaller company doesn’t have resources. The other
point is that Universities are encouraged to work with SMEs that cannot fund knowledge
gatekeepers (Alexander & Martin 2013). So for the public research institution, the most
important role of TTO’s is to build legitimacy for new technology.
Summarizing technological transfer process with only one business model is difficult, as it
exist different kind of TTO’s. Nevertheless, TTO’s general business model is built around the
following building blocks: they offer mixed and customized solutions to their clients, target
very small firms, do not primarily depend on revenues from scale of services, develop strong
ties with their partners and clients, formulate differentiated strategies for the different stages
of the value chain and dispose of differentiated types of human resources for different stages
of the value chain. We can also add that four different types of business model emerge by
positioning the different types of TTO’s on the different building blocks (Landry et al. 2013).
- The validation-centered business model: providing customized solution for single
client firms with a well-defined market segment. The generation of revenue from sales
of services and the implementation of a well-defined market strategy are the first goal.
It is support by a strong attention to the validation of knowledge-based opportunities.
- The exploitation-centered business model: this business model is more involved than
the previous in the provision of services at the three sub-stages of the exploitation of
knowledge-based opportunities: solving legal issue, facilitating access to capital and
fostering the commercialization of innovation. This business model is strongly
dependent of the government innovation policies.
- The PRO’s government dependent exploration-centered business model: more based
on technical resources and human resources. Implementation of well-defined strategy
regarding the promotion of their services but less involved in the provision of services
at the three stages of the knowledge value chain.
- The undifferentiated exploration-centered business model: more involved regarding
services linked to legal issues at the exploitation stages of the value chain (figure 5),
and more involved in the provision of services linked to issues of access to capital at

TechnologicalTransferOffice’sorganization:ThecaseoftheFrenchSystem.
21
the exploitation stage. This model can be describe as an undifferentiated knowledge
and technology transfer business model.
Figure 5: the three sub stages of the exploitation of knowledge (Landry et al. 2013)
3.2.3. Organization
There are different types of organizations regarding the type of Technological transfer offices.
In this part, we will see that the government policy play a role in the organization of the
Research and Development in the different countries we will study. This organization has a
big impact on the organization of the technological transfer across the world.
Even if the TTO’s play the same role their organization and implementation will change
regarding the country.
3.2.3.1.InFrance
As we saw before, the French research environment is quite complicated. Since 2001,
Universities and Schools have to transfer their knowledge. The number of TTO’s increase and
you can find a lot of different organizations, about 352 (Réseau C.U.R.I.E 2014). With the
introduction of the SATT the environment change one more time. Now Universities and some
PRO’s (like the CNRS) don’t valorize their result and patent, this role is played by the SATT.
Nevertheless, we are in a tri-parties system. Most of the researches are still paid by the state.
This funding is done through different way: ANR, Europe, region… And when a project is
founded, you will find at least different PRO’s (they managed the UMR). So when the project
is not about fundamental research but about a future product there will be some industrial
involved.
This triple helix organization (Etzkowitz 2003) is really regulated. A commercial project
cannot be funded with public fund if there is no return. So one of the roles of TTO’s will be to
secure this collaboration. Their other role is to find and fund project (sourcing). Those two

22
roles are mainly done by the valorization service in universities, school and PRO’s. When it
comes to licensing or selling patent, SATT play a big role. Even if some PRO’s still have an
office that play this role (Inserm Transfert, Inra Transfert), all the Universities, school and
other PRO’s give right on their patent to the SATT. Those offices will evaluate patent and
find industrial that will exploit it. Their business model is based on in licensing out licensing;
they will keep a percentage on each transaction. They really just transfer the technology
without any amelioration. No TTO’s will invest directly in one project to improve it. The
second role of such offices is to provide services: managing intellectual property, set-up
projects and set-up international collaborations.
3.2.3.2.IntheUSA
In 1980, Congress enacted the Bayh-Dole Act1 and allowed U.S. universities, teaching
hospitals, and research institutes to have the automatic right to take title to inventions
developed with federal funding. In response, these institutions have established offices to seek
patent protection on these inventions and license them to existing and new businesses for
development and commercialization. Since 1991, the Association of University Technology
Managers (AUTM) has published an annual survey that has quantified the magnitude of this
enterprise(Abrams et al. 2009; Tseng & Raudensky 2014).
Commercial institutions pay royalties for the right to put inventions and discoveries from
universities to commercial use in products such as computer-imaging technology, medical
diagnostic testing, and treatment of disease. Institutions of higher education, in turn, can use
the revenue to increase investments in research and development. This technology transfer
also leads to sponsored research agreements between firms and universities, often to
undertake additional research needed to commercialize technologies. Universities now receive
approximately 7 percent of all research funding from industry, compared to about 3 percent in
the 1970s. Institutions of higher education also reported spinning off nearly 350 companies
and receiving 3,450 U.S. patents for new technologies and inventions. Since fiscal year 1998
when the question was first asked, 178 U.S. survey respondents have reported a total of 2,230
new products introduced to the market place
(http://www.referenceforbusiness.com/management/Str-Ti/Technology-
Transfer.html#ixzz3sJepTvzi).
In the U.S. Fewer than 15% of TTOs are organized as independent corporations. An
independent corporation can develop a culture that is quite distinct from that of the parent

TechnologicalTransferOffice’sorganization:ThecaseoftheFrenchSystem.
23
institution, whereas if the TTO is an integral part of the institution, it will inevitably share its
culture (Abrams et al. 2009).
3.2.3.3.IntheU.K
Each university in the UK is independent and develops its own strategic goals, emphases,
brand and approach to intellectual property management and the commercial development of
research outputs. UK universities are almost all charitable bodies, required to comply with
charity law. Their charitable objectives are research, teaching and scholarship and the
application of new knowledge arising from these activities. Everything that universities do
must be directly in line with these objectives. This applies to their business transactions,
including the commercial development of their research outputs (Brady et al. 2015)
3.2.4. WhycomparingFrance,USAandUK?
When we talk about technological transfer we firstly think about the United State of America.
Historically it is the first state to allow its university to manage their patents. As the right on
patent are allocated automatically, PRO’s constructed structures to manage this Intellectual
property. That is why it can be taken as a model for the technological transfer.
We also have to take into account one major difference between USA and Europe: it is the
lack of venture capitalist. That induces a gap in research productivity between Europe and the
US due, in part, to a lack of financial resources made available for universities and research in
Europe (Conti & Gaule 2011).
In Europe, knowledge transfer between industry and higher education underachieves when
compared directly with the United States. Europe is usually considered among the best world
performers in terms of research capacity, but this potential often fails to transform into
innovative products and services and the potential contribution to economic growth is lost
(Jackson et al. 2012; Alexander & Martin 2013). French and UK governments’ have
wholeheartedly subscribed to the knowledge-based view of society. The authors agree that
knowledge is an extremely important economic resource, if exploited effectively (Jackson et
al. 2012)
In the UK and in France, there traditionally has been a strong focus on publication of papers
rather than patenting. This is encouraged strongly by the allocation of government research

24
funding through the Research Assessment Exercise (RAE), which rates University
Departments in terms of publications, research students and studentships, and amounts and
sources of external research in the UK. In France it is quietly different, PRO’s rate the
research unit and allocate resources to them. This appears to contrast with the USA
perspective outlined above in that the UK/French focus has been on information, whilst the
USA focus has been more on invention (Decter et al. 2007) .
Nevertheless, we saw by looking at the different organization of the technological transfer
offices, that those three country tend to have the same model. Technological transfer offices
are either internal or external to Universities. TTO’s in those three countries are organized
around two business models:
- The validation-centered business model
- PRO’s government dependent exploration-centered business model
The other reason to compare France with UK and USA is that worldwide, technological
transfer process is considered to be the best in the USA and in Europe, UK is consider to be
the most advanced country (Commission 2009; OECD 2014; OECD n.d.).

TechnologicalTransferOffice’sorganization:ThecaseoftheFrenchSystem.
25
4. Comparative study of the efficiency of the different TTO’s
organizations
The efficiency of university TTOs can be measured in numerous ways. The simplest method
would be to rank universities purely based on licensing income. (Anderson et al. 2007).
Numerous study access the efficiency of TTO’s around the world. In the USA, Association of
University Technology Managers (AUTM) makes each year a licensing survey for more than
20 years. In Europe, this role is support by the Organization for Economic Co-operation and
Development (OECD).
4.1. TheMetrics
We will use the main metrics that are recommended by the European commission.
Those metrics are:
- Invention disclosure
- Patent application
- Patent grants
- Licenses executed
- Licenses income earned
- Spin-off/Start-up established.
As it is explain in this report measuring the amount of knowledge transferred is quite
impossible. So we will focus on the transfer himself. Number of contract research, number of
patent… can be measured.
Nevertheless, we have to remember that metrics are just number. The number of patent for
example is not as important as the value it creates. Increasing the number of patent or the
number of spin-off can be a bad policy. Non-viable spin-off, patent with no final value will
cost more than the revenue generated for the PRO’s. We will try to find out how the value is
created.
The comparative study will help us to understand what TTO’s have to improve to become
sustainable.
The main data we will use cam from different survey and databases:

26
- USA’s data came from association of technology managers and business (AUTM:
http://www.autm.net). We also use data from Timothy R. Anderson et al. (Anderson et
al. 2007) and data from the Proton survey (Piccaluga et al. 2011).
- UK’s data came from the Proton survey, Chapple et al. (Chapple et al. 2005),
European commission (Commission 2009).
- France’s data mainly come from the CURIE survey (Curi et al. 2014).
We made an average of the number from those different sources per year for the period from
2005 to 2011.
We found the following metrics:
Location Researchspending
NumberofTTO
Inventiondisclosure
Patentapplication
Licensesexecuted
Licensesincome
Spin-off-start-up
USA 40360065600 186 21856 13271 6051 1800000000 671UK 2658334000 163 4222 2256 5074 119000000 266France 4314000000 163 3392 1711 724 161000000 262
Table 1: Average metrics of TTO’s from 2005 to 2011
4.2. Method
To compare efficiency of TTO’s in different countries, we will firstly made a simple ratio of
each output compare to investment.
Location ID/RS PA/RS LE/RS LI/RS SO/RSUSA 5,41525E-07 3,28815E-07 1,49925E-07 0,04459854 1,66253E-08UK 1,58821E-06 8,48652E-07 1,90871E-06 0,044764879 1,00063E-07France 7,86277E-07 3,96616E-07 1,67826E-07 0,037320352 6,07325E-08
Table 2: Ratio of metrics
When we look at those ratio, the first thing that we see is that UK TTO’s have the best one in
each metrics. But what is the effectiveness of TTO’s and what is their relative efficiency?
This issue has been explored by using different methods.
Thursby and Thursby (Thursby & Thursby 2002) describe a three-stage process to calculate
the total factor productivity. This approach is based on Data Envelopment Analysis (DAE).
This method was firstly developed by Charnes, Cooper and Rhodes in the early 1970’s to
assess the relative efficiency between different Decision making units (DMU). This model
was built on the earlier work of Farrell in 1957.
We can represent the mathematical model by this schema.
TechnologicalTransferOffice’sorganization:ThecaseoftheFrenchSystem.
27
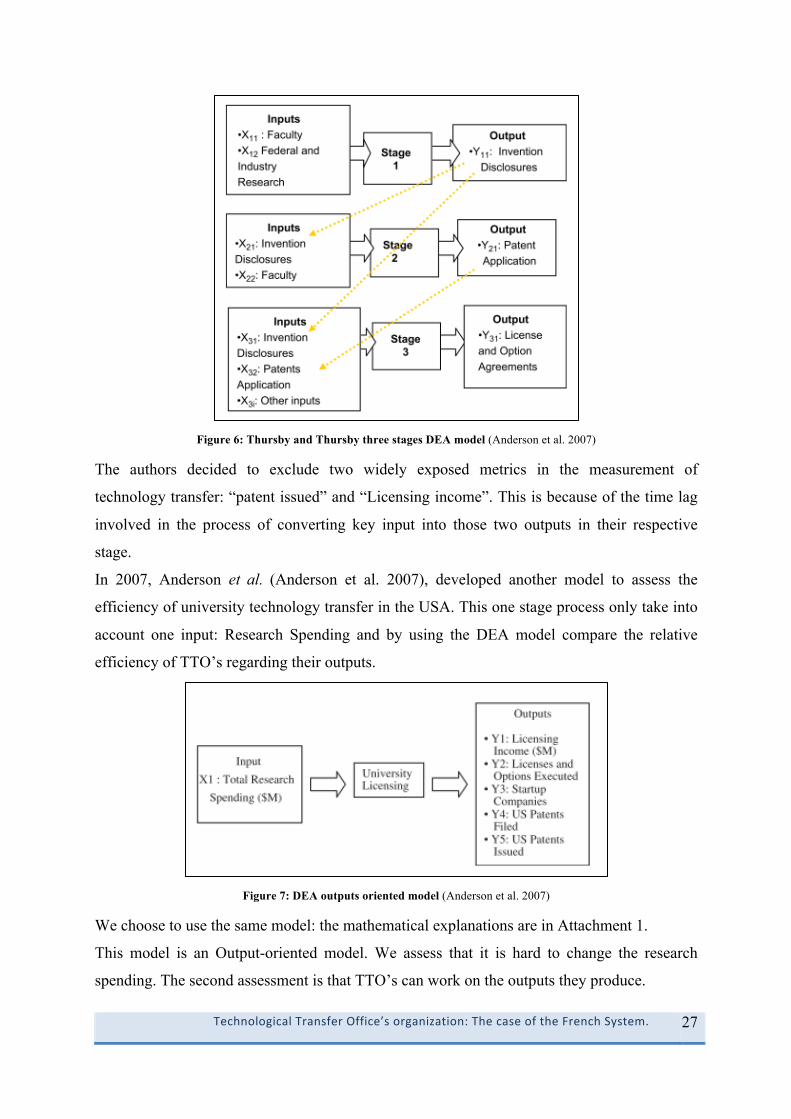
Figure 6: Thursby and Thursby three stages DEA model (Anderson et al. 2007)
The authors decided to exclude two widely exposed metrics in the measurement of
technology transfer: “patent issued” and “Licensing income”. This is because of the time lag
involved in the process of converting key input into those two outputs in their respective
stage.
In 2007, Anderson et al. (Anderson et al. 2007), developed another model to assess the
efficiency of university technology transfer in the USA. This one stage process only take into
account one input: Research Spending and by using the DEA model compare the relative
efficiency of TTO’s regarding their outputs.
Figure 7: DEA outputs oriented model (Anderson et al. 2007)
We choose to use the same model: the mathematical explanations are in Attachment 1.
This model is an Output-oriented model. We assess that it is hard to change the research
spending. The second assessment is that TTO’s can work on the outputs they produce.

28
4.3. Comparison
When we look at the ratio we found earlier, it seems that United Kingdom’s technological
transfer offices are the best one, so we will run the DEA outputs-oriented model in order to
know how we can improve output from USA and France.
We used the average Inputs and outputs per TTO. Location Research
spendingInventiondisclosure
Patentapplication
Licensesexecuted
Licensesincome
Spin-off
Output Input
Efficiency
USA 216989600 117,5 71,3 32,5 9677419 3,6 1 1 1,00UK 16308797 25,9 13,8 31,1 730061 1,6 0,08 0,0
751,00
France 26466257 20,8 10,5 4,4 987730 1,6 0,10 0,122
0,84
Table 3: DEA analysis maximizing USA output
By applying the model on the USA we found that its relative efficiency is 100% as the UK.
France has a relative efficiency of 84%. That means that by increasing its output, French
TTO’s can became relatively more efficient. Location Research
spendingInventiondisclosure
Patentapplication
Licensesexecuted
Licensesincome
Spin-off
Output
Input
Efficiency
USA 216989600 117,5 71,3 32,5 9677419 3,6 8,2 8,2 1,00UK 16308797 25,9 13,8 31,1 730061 1,6 0,6 0,6 1,00France 26466257 20,8 10,5 4,4 987730 1,6 0,8 1,0 0,83
Weight 3,78E-08 0 0 0 8,44E-07 0 Table 4: DEA analysis maximizing French output
By running the model to maximize the French output, we also find a relative efficiency of
83%. The model shows us that the only output that is important regarding the efficiency is
licenses income.
4.4. DiscussionandConclusion
With a ratio approach, we saw that regarding all the output one by one, the UK seems to have
the best efficiency and it is harder to compare France and USA. By implementing the Data
envelopment analysis output-oriented model, we saw that the USA and the UK have the same
relative efficiency and the efficiency of French technological transfer offices is lower.
The model also showed us that in order to improve their efficiency, French TTO’s have to
increase their licenses income.
Nevertheless, we have to take this result with caution. This is only a relative efficiency
between TTO’s in France, UK and USA. For example in 2009, Abrams et al. (Abrams et al.
2009) assume that only 16% of the US TTO’s were self-sustaining, bringing in enough

TechnologicalTransferOffice’sorganization:ThecaseoftheFrenchSystem.
29
income that, after distributions to inventors and for research, there are sufficient funds to
cover the operating costs of the program. They also argue that sustainable TTO’s have a
blockbuster in their executed licenses.
The model show us that working on the licenses income will help French TTO’s to became
more efficient, but it doesn’t show us if that will be enough made TTO’s self-sustainable.
In the next part we will develop a model to sell at higher price a license without other fund
from government or from Institution.

30
5. HowcanweimprovetheefficiencyoftheFrenchTTO?
In this party we will propose a new type of structure adapted to the French policy and
Knowledge production model.
As we seen before, reforming the French system can be hard and will take time. The
important structures are already present but private investors are quite absent. The problem is
that projects licensed are in their early development. With this kind of project, the return on
investment is not as interesting as projects in late development stage.
The second important thing is that most of the TTO’s are only a department of PRO’s or are
totally owned by them (Inserm transfert and Inra transfert for example). In the first case
private funding or investment directly in the structure is not legally possible. For the second
case, PRO’s wanted to remain the only owner of their TTO. PRO’s want to keep the choice of
the project they want to fund and the main objective of PRO’s is to promote all the research,
not only projects that only have an economical interest.
With this approach, raising fund is quite hard and the main problem to push projects in late
stage is the lack of fund. The idea of this structure is to select, build, raise fund and drive
different project. As this structure will not be own directly by public research organization,
private investors can invest in it. But as we will see in this chapter, the idea is not to involve
investors in the financial structure but directly in projects.
5.1. FinancialstructureandBusinessModel
5.1.1.BusinessModel
The business model of this company will be based on evaluating and building project for the
clinical phases (I and II). The goal is to push the best research projects in late stage
development. Nowadays, this work is mainly done by building spin-off or start-up or by
licensing the potential drug to a big pharma. In the first case researcher who wants to continue
the development of its own invention make the job. The main problem for them is to find
partners and fund. Secondly most of them have no business experiment. In the second case,
as this is the big pharma that takes risk to develop the drug the term of the license are not as
good as it would be for later stage products. Nevertheless, there is a lot of patent that are
dying because researchers as big pharma don’t want to exploit them.
At the end, this is a big lost for the Public Research Organizations. The return on investment
is not as good as it could be.

TechnologicalTransferOffice’sorganization:ThecaseoftheFrenchSystem.
31
The business positioning will be in this “valley of the death”. The company will work closely
with the TTO to select project in their early development. With this approach, the researcher
who works on it will be guided to develop the product with the idea of making a clinical trial
at the end. The company will have all the pre-clinical data to evaluate different projects and
choose the best on scientific and financial bases.
This company will not be a seed fund. Conventionally, a seed fund invests in project or start-
up that brings the project, they don’t own it. The company will build the project and fund it.
Figure 8: Business Canvas
If we take a look at the value chain, the company will have a great role in the organization of
the Inbound logistic through the selection of the project and by working closely with Public
research organization. In our case, we will not create one company per project supported: the
best team in the domain of the project will support each project.
This team will be in charge of the “operation”, in other words, the team will develop the
project regarding its phase.
The next step, looking at the results and taking the decision to go into the next phase or to
license the project will b the next role of the company. Once the decision is taken, the
company will either choose the new team to develop the project in the next phase or market
the product in order to license it.
Those activities will be support by a particular structure (Figure 9) defined in the next part.

32
Due to this organization, the company will be support by human resources of PRO and TTO.
It will have access to Scientifics, business developers, IP manager and legal department.
As the company will mainly develop IP in collaboration with other PRO, it will not directly
have to develop a specific technology to support the value creating activities. The heart of its
activity will be to develop new technology, and by supporting research, creating new IP to
develop.
The procurement will be made directly by the team in charge of the development of the
project: the company will support it.
This value chain will focus on differentiation. By focusing on the improvement of the core
competencies of the TTO (Sourcing, IP Management) and with the support of the best
scientists, the company will be able to select and develop the best projects and license them to
the best firm for the best price.
5.1.2.Financialstructure
The Financial structure of this company will be unusual. The goal of the structure is not to
become public but to stay under the control of the TTO. Investors (public as private) will not
put money in the structure but project by project.
Figure 9: Financial organization of the company
In figure 2, the organization is explained; PRO’s already put money and let their TTO manage
their patents. The company will be owned by the TTO. This company will be specialized in
building project in clinical trials. Until now, TTO’s were licensing before and are not

TechnologicalTransferOffice’sorganization:ThecaseoftheFrenchSystem.
33
specialized in this kind of activities. TTO’s have to find an industrial to achieve this goal,
especially for the phase III. The company will work closely with public structures that already
made clinical trials as AP-HP in France (Partners). By working closely with researchers,
clinician and business expert, the company will built strong project that can achieve clinical
trials.
And as soon as each project will be built, the company will find some investors.
The company can be seen as a holding. Its vocation will be to group different partner and built
projects. Each project will be comparable with a start-up. This kind of structure will enable
private investors to invest directly in the project.
Figure 10: Investment in the company or in project regarding investors
The organization describe in the figure 3 explain how each parties involved in financing each
project will invest. We will found different kind of funding. The partners will more invest
with material, people and infrastructure. The private investors will invest with “smart
money”. They will invest money and bring their business expertise in the project they choose
to fund. And the public investors (as ANR, ANRS, BPI, European commission…) will bring
money. As this last kind of investors are more involved in building an ecosystem, and in
developing research, they will be allowed to invest directly in the company.
We will see in how the different partner will invest and what will be the financial model.
5.2. BuildingoneProject
The project we will choose in example will be in the area of the Immune-Oncology drug.
It will be an armed Antibody-Drug conjugates. This antibody will be specific of a particular
subtype of ovarian cancer.
How it work:

34
Comparatively to the monoclonal antibody, Antibody-Drug conjugates (ADCs) carry a drug
and provide a delivery vehicle to transport the drug inside the cell. Once inside the cell, the
ADC will be degraded and will release the drug. It will lead to the cell death (fig…).
Figure 11: Action of an ADC
The main advantage of this kind of drug is that we can use molecules (drugs) that are
cytotoxic for healthy cells. With a classic chemotherapy, all the cells are targeted, but by
using an antibody to address the drug specifically to the tumor, we will control this cytotoxic
effect. It will be healthier and have fewer side effects. The second advantage is to enhance the
response of the cancer. Some of cancer are resistant against classical chemotherapy, coupling
the drug with an antibody will increase the effect of the drug (by increasing the concentration
of the molecule inside the cell).
There are three important aspects in the design of the ADC:
- The antibody. - The linker. - The drug.
The antibody has to be humanized (to prevent allergic reaction) and must target a receptor or
a membrane protein that is only expressed or over expressed in the tumor. The critical factor
in manufacturing ADC is the linker. The linker must undergo into hydrolysis only in the cell
in order to have the best effect.

TechnologicalTransferOffice’sorganization:ThecaseoftheFrenchSystem.
35
Actually they are 70 ADC’s on clinical trials and 10 of them are in the area of the ovarian
cancer. As the chances of success of the clinical trials of drugs in oncology is around 10%, we
can assume that there is a chance that one product reach the market before us.
5.2.1.MarketAnalysis
Around the world, ovarian cancer has an incidence of 15 per 100.000 people. Our drug will be
able to target around 50% of ovarian cancers.
Incidence 0,000075
Population 331000000
Sellingprice 10000
Productioncost 1000
Lengthofthetreatment 10
Numberofpatient/month 2068,75
Income/patient/month 12000
%Death/month 1%
Table 5: Parameters for the market analysis
The table 5 gives the parameters used for the market analysis. We will mad three scenarios,
the variable will the market penetration and growth. According to the market in oncology,
regarding the evolution of the sale of Roche (who owns the only ADC actually on the
market), and the fact that there is no real treatment against the Ovarian cancer other than the
surgical removal of an ovary or ovaries.
Comparing to the preclinical data and to other similar drug, the length of the treatment will be
10 months.
The selling price is also estimated regarding similar drugs already on the market as the
production cost.
%Marketsharemedian 20% 24% 28% 32% 32%
%Marketsharepessimist 10% 12% 14% 16% 16%
%Marketshareoptimist 20% 27% 34% 41% 41%
Table 6: Market penetration and market growth
The evolution of the number of patient is given by this equation:
(Number of new patients) + (Number of patients from the previous month) – (Number of
patient who have reach the end of the treatment) – (Number of death).
36
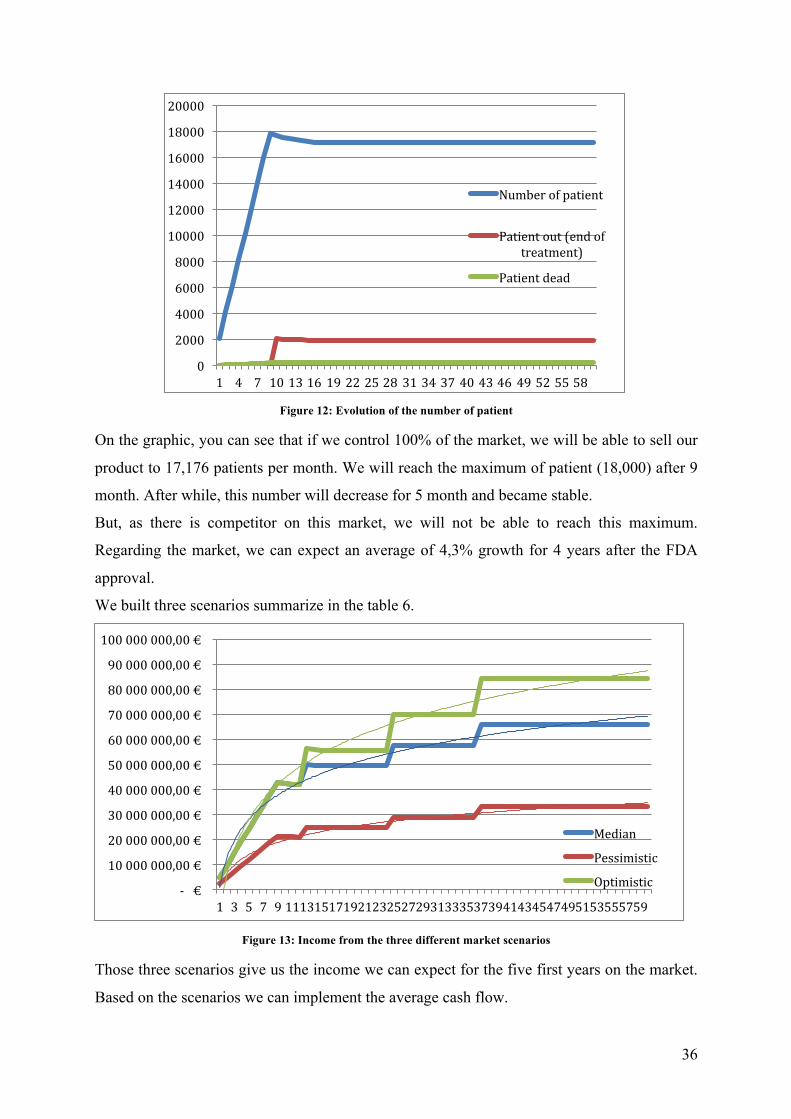
Figure 12: Evolution of the number of patient
On the graphic, you can see that if we control 100% of the market, we will be able to sell our
product to 17,176 patients per month. We will reach the maximum of patient (18,000) after 9
month. After while, this number will decrease for 5 month and became stable.
But, as there is competitor on this market, we will not be able to reach this maximum.
Regarding the market, we can expect an average of 4,3% growth for 4 years after the FDA
approval.
We built three scenarios summarize in the table 6.
Figure 13: Income from the three different market scenarios
Those three scenarios give us the income we can expect for the five first years on the market.
Based on the scenarios we can implement the average cash flow.
0
2000
4000
6000
8000
10000
12000
14000
16000
18000
20000
1 4 7 101316 19222528 313437404346 49525558
Numberofpatient
Patientout(endoftreatment)
Patientdead
-€
10000000,00€
20000000,00€
30000000,00€
40000000,00€
50000000,00€
60000000,00€
70000000,00€
80000000,00€
90000000,00€
100000000,00€
1 3 5 7 911131517192123252729313335373941434547495153555759
Median
Pessimistic
Optimistic

TechnologicalTransferOffice’sorganization:ThecaseoftheFrenchSystem.
37
Figure 14: Average Cash Flow
We can now, based on those assumptions, calculate the expected NPV of our product after the
FDA approval.
5.2.2.FinancialModel
Now we have estimated the NPV of our product. We can estimate the expected NPV of it at
each stage of its development. We will make a regressive approach from the FDA approval to
the present point.
We will use the decision tree. To estimate the investment at each stage we will take into
account:
- The production cost of our ADC (including cost of the license of the linker).
- The cost per patient of a hospitalization during the clinical trial (infrastructure,
insurance, cost of the health professional, price of the international board review).
- The cost of data analysis.
The total investment estimated is 49,8 Million Euros.
-10000000,00€
-€
10000000,00€
20000000,00€
30000000,00€
40000000,00€
50000000,00€
60000000,00€
70000000,00€
1 4 7 10 1316 19 22 2528 31 34 37 40 4346 49 52 5558

38
FDAapproval:
For this stage that take around 1 year, the only investment to take into account is the
administrative price of the FDA approval. Nowadays this price is 2 Million Euros.
Figure 15: FDA approval of the decision tree
The estimation of success of this approval is 90%. We can estimate the expected NPV before
to the approval at 2,354,737,098 Euros.
This result is given by the following equation:
𝐹𝑖𝑛𝑎𝑙𝑒 𝑣𝑎𝑙𝑢𝑒 ∗ 90%1,1 ! − 𝐼𝑝ℎ𝑎𝑠𝑒 + (𝐼𝑡𝑜𝑡𝑎𝑙 ∗ 10%)
PhaseIII:
Figure 16: Phase III of the decision tree
In this phase, we have to make a multi-center, multi-parametric. The investment is estimated
at 22,100,000 Euros. The number of patient we have to recruit explains this investment. The
TechnologicalTransferOffice’sorganization:ThecaseoftheFrenchSystem.
39
Investment is based on the production of our drug and on the cost per patient of the
hospitalization.
Similarly to the precedent step the equation that will give us the expected NPV of our product
is:
𝐹𝑖𝑛𝑎𝑙𝑒 𝑣𝑎𝑙𝑢𝑒 ∗ 30%
1,1 ! − 𝐼𝑝ℎ𝑎𝑠𝑒 + (𝐼𝑡𝑜𝑡𝑎𝑙 ∗ 70%)
And the expected NPV of our product in the phase III is 490654650€
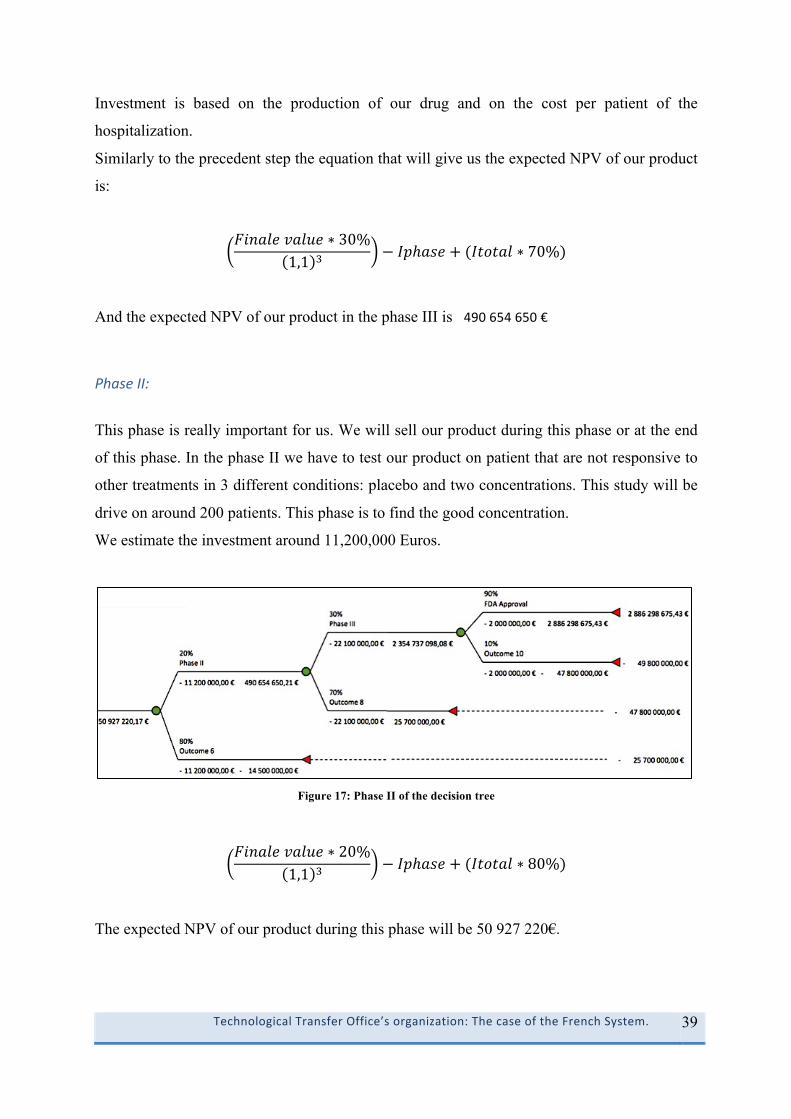
PhaseII:
This phase is really important for us. We will sell our product during this phase or at the end
of this phase. In the phase II we have to test our product on patient that are not responsive to
other treatments in 3 different conditions: placebo and two concentrations. This study will be
drive on around 200 patients. This phase is to find the good concentration.
We estimate the investment around 11,200,000 Euros.
Figure 17: Phase II of the decision tree
𝐹𝑖𝑛𝑎𝑙𝑒 𝑣𝑎𝑙𝑢𝑒 ∗ 20%
1,1 ! − 𝐼𝑝ℎ𝑎𝑠𝑒 + (𝐼𝑡𝑜𝑡𝑎𝑙 ∗ 80%)
The expected NPV of our product during this phase will be 50 927 220€.

40
PhaseI:
In this first phase, we have to test our drug on patients (in oncology we do not test the drug on
healthy patients) to evaluate its toxicology, its future in the organism and the safety of usage.
Usually it is done on 50 patients and the investment is based on the production of the ADC for
the phase I and II and on the cost of the hospitalization of the patient.
Figure 18: Phase I of the decision tree
𝐹𝑖𝑛𝑎𝑙𝑒 𝑣𝑎𝑙𝑢𝑒 ∗ 60%
1,1 ! − 𝐼𝑝ℎ𝑎𝑠𝑒 + (𝐼𝑡𝑜𝑡𝑎𝑙 ∗ 40%)
The expected NPV of our product during this phase will be 14 457 424€.
Preclinicalstage:
We already own the murine antibody. This antibody shown really good result in mice model,
it is able to target 50% of all ovarian cancer. We have to humanize it. Once it is done, we
have to make some additional test to have more data to move to the clinical phase I. As we
already have strong data on it, we estimate the success of this phase around 100%.
Figure 19: Preclinical stage of the decision tree
TechnologicalTransferOffice’sorganization:ThecaseoftheFrenchSystem.
41
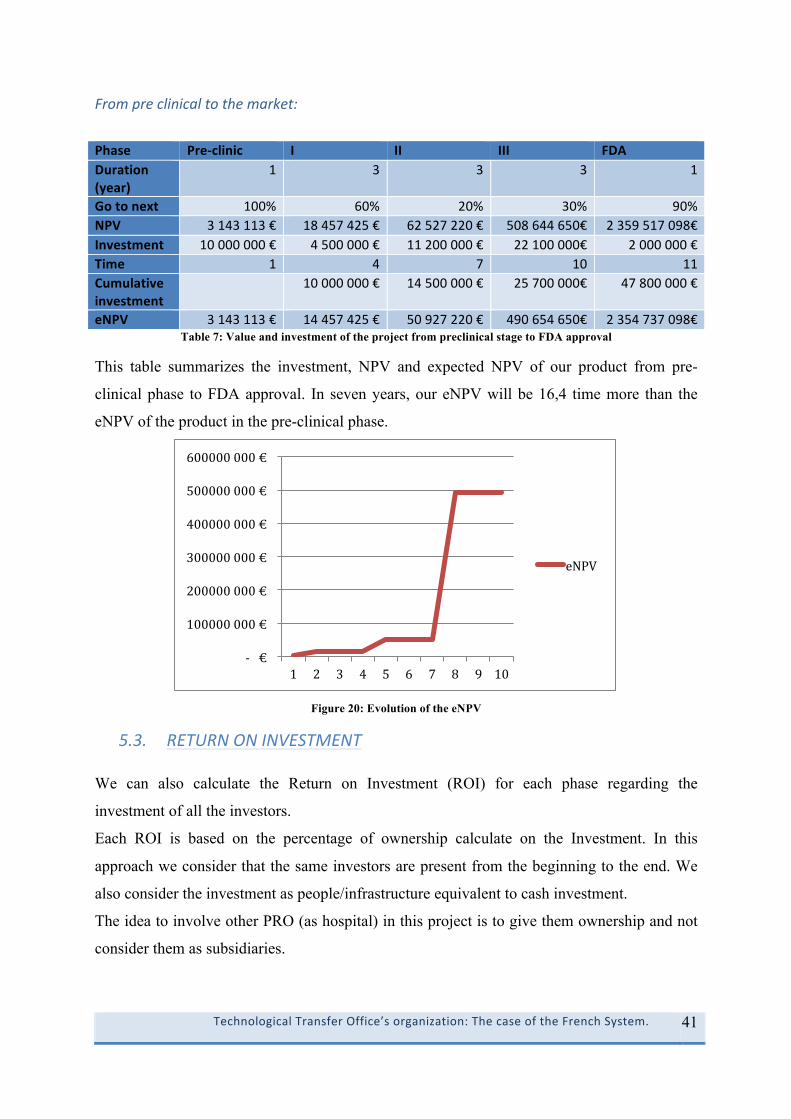
Frompreclinicaltothemarket:
Phase Pre-clinic I II III FDADuration(year)
1 3 3 3 1
Gotonext 100% 60% 20% 30% 90%NPV 3143113€ 18457425€ 62527220€ 508644650€ 2359517098€Investment 10000000€ 4500000€ 11200000€ 22100000€ 2000000€Time 1 4 7 10 11Cumulativeinvestment
10000000€ 14500000€ 25700000€ 47800000€
eNPV 3143113€ 14457425€ 50927220€ 490654650€ 2354737098€Table 7: Value and investment of the project from preclinical stage to FDA approval
This table summarizes the investment, NPV and expected NPV of our product from pre-
clinical phase to FDA approval. In seven years, our eNPV will be 16,4 time more than the
eNPV of the product in the pre-clinical phase.
Figure 20: Evolution of the eNPV
5.3. RETURNONINVESTMENT
We can also calculate the Return on Investment (ROI) for each phase regarding the
investment of all the investors.
Each ROI is based on the percentage of ownership calculate on the Investment. In this
approach we consider that the same investors are present from the beginning to the end. We
also consider the investment as people/infrastructure equivalent to cash investment.
The idea to involve other PRO (as hospital) in this project is to give them ownership and not
consider them as subsidiaries.
-€
100000000€
200000000€
300000000€
400000000€
500000000€
600000000€
1 2 3 4 5 6 7 8 9 10
eNPV
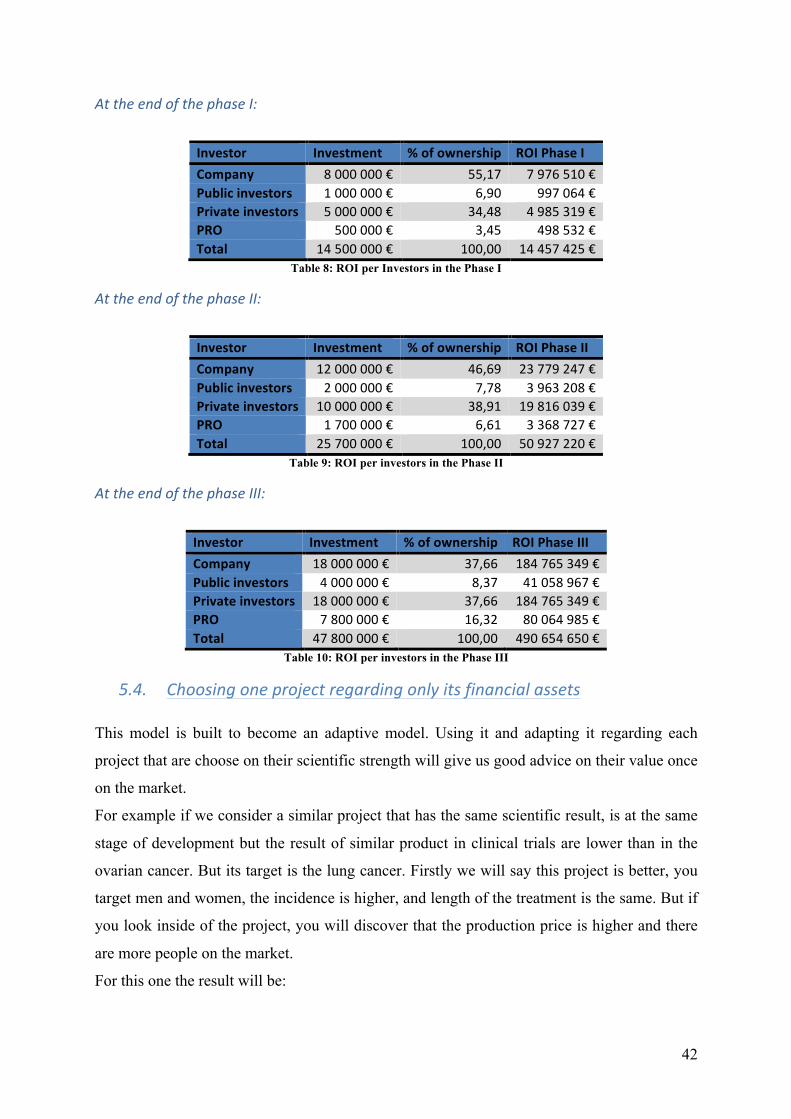
42
AttheendofthephaseI:
Investor Investment %ofownership ROIPhaseICompany 8000000€ 55,17 7976510€Publicinvestors 1000000€ 6,90 997064€Privateinvestors 5000000€ 34,48 4985319€PRO 500000€ 3,45 498532€Total 14500000€ 100,00 14457425€
Table 8: ROI per Investors in the Phase I
AttheendofthephaseII:
Investor Investment %ofownership ROIPhaseIICompany 12000000€ 46,69 23779247€Publicinvestors 2000000€ 7,78 3963208€Privateinvestors 10000000€ 38,91 19816039€PRO 1700000€ 6,61 3368727€Total 25700000€ 100,00 50927220€
Table 9: ROI per investors in the Phase II
AttheendofthephaseIII:
Investor Investment %ofownership ROIPhaseIIICompany 18000000€ 37,66 184765349€Publicinvestors 4000000€ 8,37 41058967€Privateinvestors 18000000€ 37,66 184765349€PRO 7800000€ 16,32 80064985€Total 47800000€ 100,00 490654650€
Table 10: ROI per investors in the Phase III
5.4. Choosingoneprojectregardingonlyitsfinancialassets
This model is built to become an adaptive model. Using it and adapting it regarding each
project that are choose on their scientific strength will give us good advice on their value once
on the market.
For example if we consider a similar project that has the same scientific result, is at the same
stage of development but the result of similar product in clinical trials are lower than in the
ovarian cancer. But its target is the lung cancer. Firstly we will say this project is better, you
target men and women, the incidence is higher, and length of the treatment is the same. But if
you look inside of the project, you will discover that the production price is higher and there
are more people on the market.
For this one the result will be:

TechnologicalTransferOffice’sorganization:ThecaseoftheFrenchSystem.
43
Phase pre-clinic I II III FDA
Duration
(year)
1 3 3 3 1
gotonext 100% 55% 17% 24% 90%
Investment 11000000€ 5500000€ 13200000€ 25100000€ 2000000€
time 1 4 7 10 11
Cumulative
investment
16500000€ 29700000€ 54800000€ 56800000€
Lostiffail -7425000€ -24651000€ -41648000€ -5680000€
eNPV -9759704€ 1364324€ 34580165€ 567093418€ 3515178867€
Table 11: Result of the financial analysis for the second project
As you can see in the table 11 the NPV before the FDA approval and the NPV in the phase
III are higher than the previous but the other are lower. As the business plan of the company
is to sell the product in phase II, and the success rate is lower, the best choice is to develop the
first project.
Summarize of this project at the end of the phase II:
Investor Investment %ofownership ROIPhaseII
Company 13500000,00€ 45,45454545 12725233,64€
Publicinvestors 2500000,00€ 8,417508418 2356524,75€
Privateinvestors 12000000,00€ 40,4040404 11311318,79€
PRO 1700000,00€ 5,723905724 1602436,83€
Total 29700000,00€ 100 27995514,01€
Table 12: ROI per investors in the Phase II (second project)
As the company has to select different projects in different area, you cannot select it only on
scientific bases. This model will allow you to benchmark different project and present it to
different investors. Nevertheless, the NPV or the ROI are not the only metrics investors will
use. Some of them will prefer a project with a good % of success; others will prefer a higher
ROI, etc. The last step to select projects will be to compare them between each of them.
We can use an adaptive model to rank them regarding all the metrics we used to build our
financial analysis. Comparing 2 projects is not so easy. The company will have to compare a
lot of them.
We made the same analysis for five different projects and the majors metrics are summarize
in this table.

44
PhaseII TotalInvestment
Investmentofprivateinvestor
Successrate
eNPV %ofownership
ROI Time
Lung 29700000€ 12000000€ 9,35 27995514€ 40,4 11311319€ 8Ovarian 14500000€ 10000000€ 12 50927220€ 69,0 19816039€ 7Leukemi
a23400000€ 9000000€ 12 29460962€ 38,5 11331139€ 5,5
Melanoma
27200000€ 10500000€ 10,26 9693410€ 38,6 3741941€ 6,5
Breath 23700000€ 9000000€ 10,8 29622030€ 38,0 11248872€ 7Table 13: Financial analysis for five projects
With this table we can rank the different project by scoring the different metrics.
We use this scoring matrix to rank our project.
Rank/Score TotalInvestment Investmentofprivateinvestor Successrate eNPV %ofownership ROI Time
1 0,5 10 8 1 6 8 7
2 0,4 8 11 2 7 11 6
3 0,3 6 14 3 8 14 5
4 0,2 4 17 4 9 17 4
5 0,1 2 20 5 10 20 3
Table 14: Scoring each metrics
For us, the two main metrics that investors look at are the success rate and the ROI. All the
metrics are rank in an increasing order. That is why, for example, less you invest better is the
score and higher is the success right highest will be the score.
PhaseII TotalInvestment
Investmentofprivateinvestor
Successrate
eNPV %ofownership
ROI Time Score
Lung 0,1 2 8 2 9 14 3 38,1Ovarian 0,5 6 17 5 10 20 5 63,5Leukemia
0,4 10 17 3 7 17 7 61,4
Melanoma
0,2 4 11 1 8 8 6 38,2
Breath 0,3 10 14 4 6 11 5 50,3Table 15: Score of each project

TechnologicalTransferOffice’sorganization:ThecaseoftheFrenchSystem.
45
Figure 21: Score of each project
As you can see we already can exclude at least two projects: Lung and Melanoma. They have
the worst grad in all metrics except in the ownership. But, we know that some investors will
give a higher grade to the ROI than the success rate. Even if the success rate is low they will
have the best ROI and sooner is the best. So by adapting the metrics matrix, we can rank our
project regarding what the investors will hear and select the best project, maybe the 2 best to
present them.
Figure 22: Score based on the success rate
010203040506070
Lung
Ovarian
Leukemia
Melanoma
Breast
051015202530354045

46
Figure 23: Score based on the ROI
With this approach the two projects we will choose to present to investors are Ovarian and
Leukemia project. But one thing is to keep in mind; there are more drugs already on the
market for leukemia and more research on it. That is why we choose to build the model on the
Ovarian project.
5.5. MilestonesandRoyalties
Once you have chosen the project and investors give you money to develop it, you have to
calculate the price you will sell the project and implement the milestones and the royalties.
With the eNPV you have the potential price of your product, but as it is not on the market,
you will licensed and implement the milestone. The initial price and the milestone will reflect
the eNPV.
With our example, if we want to license it at the end of the phase II, the eNPV will be 50 927
220€.So before it reaches the market you can expect an initial amount of 15% of the estimate
value of the project and 3 milestones. Each milestone will be a percentage of the eNPV.
milestones
initial accesstophaseIII
accesstoFDAapproval
accesstotheMarket
eNPV
price 7639083€ 10185444€ 12731805€ 20370888€ 50927220€Table 16: Value of each milestones
051015202530354045
LungOvarianLeukemiaMelanomaBreath

TechnologicalTransferOffice’sorganization:ThecaseoftheFrenchSystem.
47
Based on this table we can calculate the ROI regarding the milestones by investors.
Investor initial accesstophaseIII
accesstoFDAapproval
accesstotheMarket
Company 3566887€ 4755849€ 5944812€ 9511699€Publicinvestors 594481€ 792642€ 990802€ 1585283€Privateinvestors
2972406€ 3963208€ 4954010€ 7926416€
PRO 505309€ 673745€ 842182€ 1347491€Total 7639083€ 10185444€ 12731805€ 20370888€
Table 17: Milestones per investors
Figure 24: Evolution of milestones per investors
Once it is on the market we will earn each year the royalties. Usually in the Pharmaceutical
industry it is between 5% and 10%.
Years 1 2 3 4 5royalties5% 14304020,95€ 25928479,27€ 31197233,48€ 36472843,24€ 36412356,83€
royalties6% 17164825,14€ 31114175,13€ 37436680,18€ 43767411,88€ 43694828,19€
royalties7% 20025629,33€ 36299870,98€ 43676126,87€ 51061980,53€ 50977299,56€
royalties8% 22886433,52€ 41485566,84€ 49915573,57€ 58356549,18€ 58259770,93€
royalties9% 25747237,71€ 46671262,69€ 56155020,27€ 65651117,83€ 65542242,29€
royalties10% 28608041,90€ 51856958,55€ 62394466,96€ 72945686,47€ 72824713,66€
Average 21456031,43€ 38892718,91€ 46795850,22€ 54709264,85€ 54618535,24€Table 18: Estimation of Royalties for five years after the FDA approval
As the percentage will depend of the market, the status of the exploiting firm, we will use the
average royalties to calculate what will be the return for each partner.
-€1000000€2000000€3000000€4000000€5000000€6000000€7000000€8000000€9000000€10000000€
intial
accesstophaseIII
accesstoFDAapproval
accesstothMarket

48
Investor %ofownership
Royaltiesyears1
Royaltiesyears2
Royaltiesyears3
Royaltiesyears4
Royaltiesyears5
Company 0,47 10018380€ 18160024€ 21850202€ 25545182€ 25502818€
Publicinvestors
0,08 1669730€ 3026671€ 3641700€ 4257530€ 4250470€
Privateinvestors
0,39 8348650€ 15133354€ 18208502€ 21287652€ 21252348€
PRO 0,07 1419271€ 2572670€ 3095445€ 3618901€ 3612899€
Total 1,00 21456031€ 38892719€ 46795850€ 54709265€ 54618535€Table 19: Royalties per investors
This table summarizes the potential return only based on the royalties. The table show the
values of the royalties after the FDA approval, based on the average cash flow calculate in the
market analysis.
We are now able to calculate a cumulative ROI for each investor regarding their percentage of
ownership.
Figure 25: ROI per investors from phase II to five years on the market
After 5 years on the market, the cumulative return on investment will be 120 000 000€ for the
company and 100 000 000€ for the private investors.
5.6. ImpactonglobalResearch.
The main goal of TTO’s is to licensed project. It is mainly done for projects that are in pre-
clinical phase. That is almost due to the cost of development in next phases. With this
-€
20000000€
40000000€
60000000€
80000000€
100000000€
120000000€
140000000€
Company
Publicinvestors
Privateinvestors
PRO
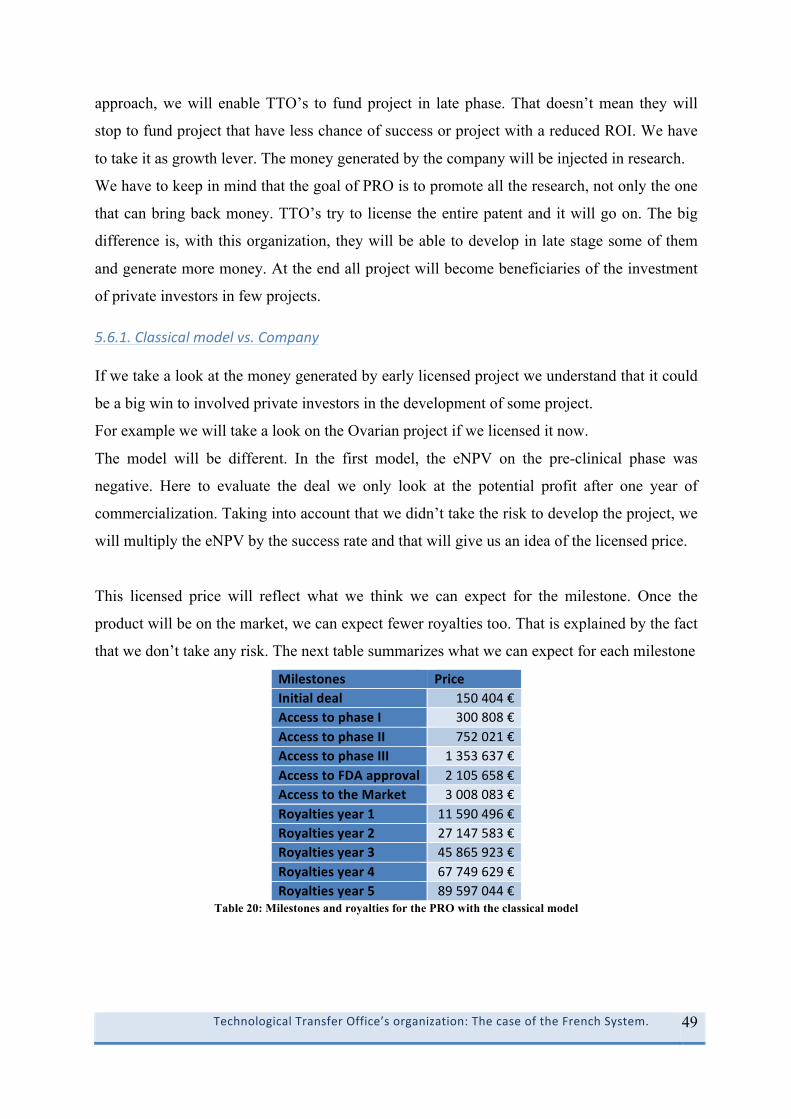
TechnologicalTransferOffice’sorganization:ThecaseoftheFrenchSystem.
49
approach, we will enable TTO’s to fund project in late phase. That doesn’t mean they will
stop to fund project that have less chance of success or project with a reduced ROI. We have
to take it as growth lever. The money generated by the company will be injected in research.
We have to keep in mind that the goal of PRO is to promote all the research, not only the one
that can bring back money. TTO’s try to license the entire patent and it will go on. The big
difference is, with this organization, they will be able to develop in late stage some of them
and generate more money. At the end all project will become beneficiaries of the investment
of private investors in few projects.
5.6.1.Classicalmodelvs.Company
If we take a look at the money generated by early licensed project we understand that it could
be a big win to involved private investors in the development of some project.
For example we will take a look on the Ovarian project if we licensed it now.
The model will be different. In the first model, the eNPV on the pre-clinical phase was
negative. Here to evaluate the deal we only look at the potential profit after one year of
commercialization. Taking into account that we didn’t take the risk to develop the project, we
will multiply the eNPV by the success rate and that will give us an idea of the licensed price.
This licensed price will reflect what we think we can expect for the milestone. Once the
product will be on the market, we can expect fewer royalties too. That is explained by the fact
that we don’t take any risk. The next table summarizes what we can expect for each milestone
Milestones PriceInitialdeal 150404€AccesstophaseI 300808€AccesstophaseII 752021€AccesstophaseIII 1353637€AccesstoFDAapproval 2105658€AccesstotheMarket 3008083€Royaltiesyear1 11590496€Royaltiesyear2 27147583€Royaltiesyear3 45865923€Royaltiesyear4 67749629€Royaltiesyear5 89597044€
Table 20: Milestones and royalties for the PRO with the classical model
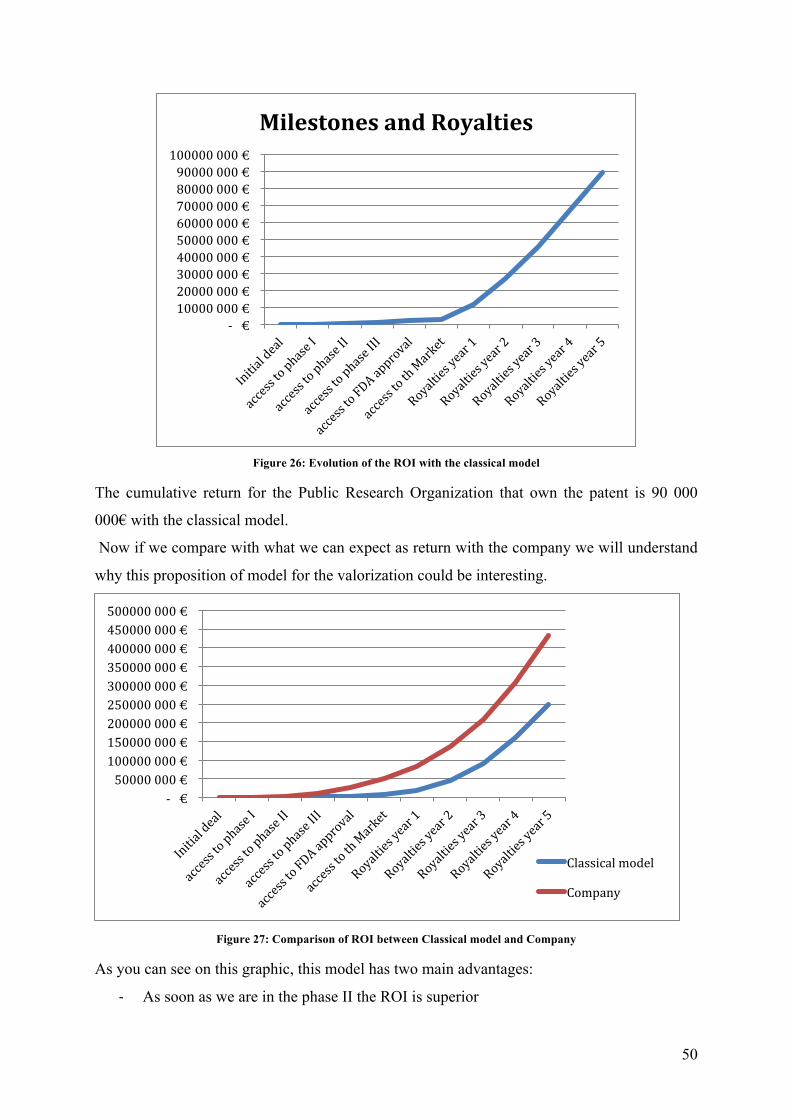
50
Figure 26: Evolution of the ROI with the classical model
The cumulative return for the Public Research Organization that own the patent is 90 000
000€ with the classical model.
Now if we compare with what we can expect as return with the company we will understand
why this proposition of model for the valorization could be interesting.
Figure 27: Comparison of ROI between Classical model and Company
As you can see on this graphic, this model has two main advantages:
- As soon as we are in the phase II the ROI is superior
-€10000000€20000000€30000000€40000000€50000000€60000000€70000000€80000000€90000000€100000000€
MilestonesandRoyalties
-€50000000€100000000€150000000€200000000€250000000€300000000€350000000€400000000€450000000€500000000€
Classicalmodel
Company

TechnologicalTransferOffice’sorganization:ThecaseoftheFrenchSystem.
51
- After 5 years on the market, we will earn 159% more with the company than with the
classical model.
5.6.2.ReturnforthePublicResearchOrganization
Technological Transfer Offices and SATT will take a percentage of the royalties. Even if this
percentage increase with the model presented here, the return for the PRO will be higher at
the end (here we talk about the PRO that own the patent, not the PRO that can take a part of
the development of the product).
Figure 28: Evolution of the ROI taking into account the percentage perceived by the TTO
Milestone Comparisonbyphase Cumulativecomparison
Initialdeal 0% 0%
accesstophaseI 0% 0%
accesstophaseII 449% 281%
accesstophaseIII 582% 441%
accesstoFDAapproval 642% 531%
accesstotheMarket 749% 617%
Royaltiesyear1 276% 412%
Royaltiesyear2 181% 277%
Royaltiesyear3 152% 215%
Royaltiesyear4 139% 183%
Royaltiesyear5 132% 165%
-€
20000000€
40000000€
60000000€
80000000€
100000000€
120000000€
Classicalmodel
Company
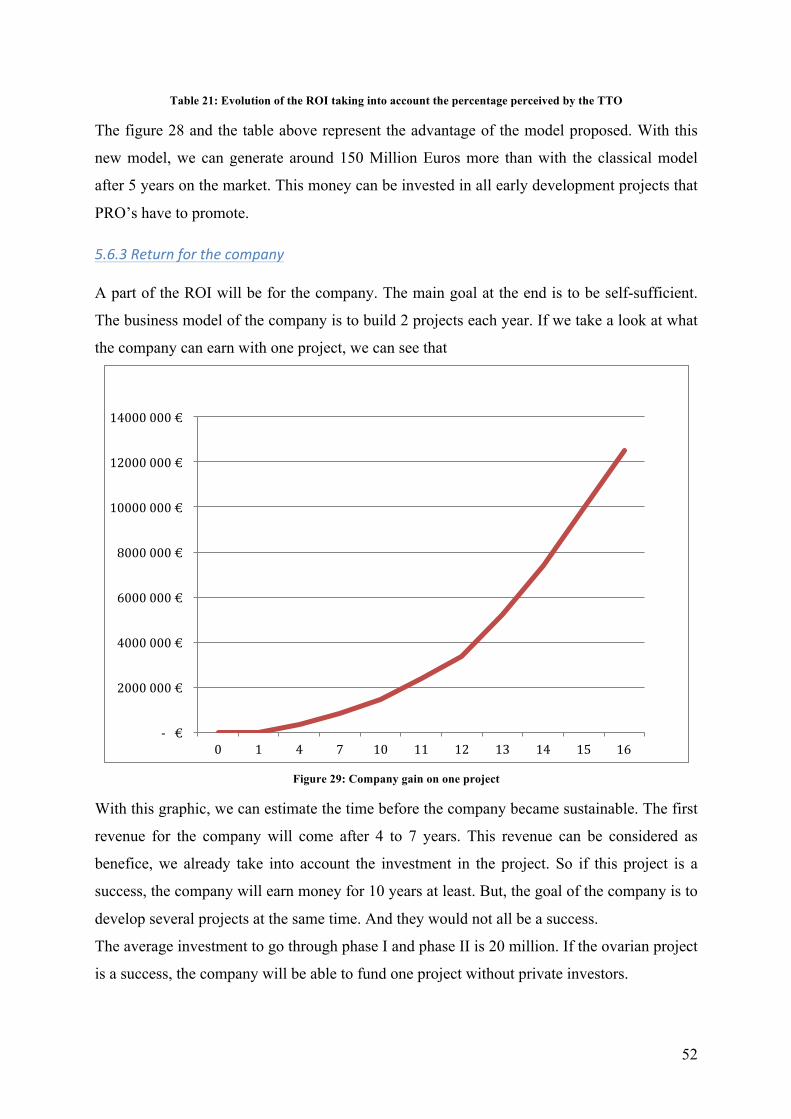
52
Table 21: Evolution of the ROI taking into account the percentage perceived by the TTO
The figure 28 and the table above represent the advantage of the model proposed. With this
new model, we can generate around 150 Million Euros more than with the classical model
after 5 years on the market. This money can be invested in all early development projects that
PRO’s have to promote.
5.6.3Returnforthecompany
A part of the ROI will be for the company. The main goal at the end is to be self-sufficient.
The business model of the company is to build 2 projects each year. If we take a look at what
the company can earn with one project, we can see that
Figure 29: Company gain on one project
With this graphic, we can estimate the time before the company became sustainable. The first
revenue for the company will come after 4 to 7 years. This revenue can be considered as
benefice, we already take into account the investment in the project. So if this project is a
success, the company will earn money for 10 years at least. But, the goal of the company is to
develop several projects at the same time. And they would not all be a success.
The average investment to go through phase I and phase II is 20 million. If the ovarian project
is a success, the company will be able to fund one project without private investors.
-€
2000000€
4000000€
6000000€
8000000€
10000000€
12000000€
14000000€
0 1 4 7 10 11 12 13 14 15 16

TechnologicalTransferOffice’sorganization:ThecaseoftheFrenchSystem.
53
Figure 30: Cumulative gain from initial deal to five years on the market
But we have to take into account that we will support 2 new projects by year. Projects will
not all be a success. The next chart will show us future benefices if one or two projects reach
the market.
Figure 31: Cumulative benefices with one or two success
With the figure 31 we can see that if only one of the ten projects we will develop during the
next 5 years, we will begin to make benefices after 15 years. If two projects reach the market,
it will take 13 years.
Nevertheless, even with this approach, we cannot compress the time to become sustainable. It
will take 13 to 15 years to make some benefit.
0,00€
5000000,00€
10000000,00€
15000000,00€
20000000,00€
25000000,00€
30000000,00€
35000000,00€
40000000,00€
45000000,00€
50000000,00€
1 2 3 4 5 6 7 8 9 10 11
-100000000€
-50000000€
-€
50000000€
100000000€
150000000€
1 2 3 4 5 6 7 8 91011121314151617
CummulativebeneSices1success
CummulativebeneSices2success

54
6. ConclusionValorization and technological transfer, as we consider it now, is a young business. In the
pharmaceutical and biotechnological sector, it is a costly and risky business. Involving private
investors in it can be really hard. If we take a look at the different technological transfer
offices in United Kingdom, United State of America and France, only those that can sell or
license project in advance phase become sustainable.
In France most of the TTO’s are public organizations. This organization does not allow
private investors to put money in it. A lot of licensing deals are made on early-developed
project. The return for the Public Research Organizations is not as important as it can be. The
second important problem that we can point is the fact that it is a young business and the
investment of the PRO in it is not as important as it can be in the other country we study. One
attempt to help PRO to valorize their research was made by the government through the
SATT. But those new entities based their business on support services. They search the best
industry to license the patent; their role is not to develop a project.
We saw by comparing TTO’s from France, UK and USA that French TTO’s are relatively
less efficient than the other. To improve their efficiency, they can work on their licenses
incomes. As the licenses income is mainly based on the development stage of the product, we
propose a model to push projects in late stage development. This model also shows that it can
also increase the return on investment for the public organization offices by 150% after five
years on the market. The other aspect that we can discuss with this model (the company) is
that it will create another kind of value. It will increase the reputation of the reputation of the
Technological transfer offices and through it the reputation of the public research
organization. This model will enhance the virtuous circle between TTO’s, PRO’s and Firm
and improve the relation between private investors and public research.
With the model we propose, the role of the TTO’s will be enhancing. Until now, due to the
lack of money, Technological transfer offices played a role mostly in identifying the best
project for the best industrial. With this model that will involve private, public investors and
different Public research organizations, Technological transfer offices will be able to develop
project. By developing the project, they will take more risk and have more return if the project
work. We saw that with this approach, the return (e.g licenses income) will be increase by
150%. So if we take it into account and increase licenses income by 150%, the relative
efficiency of French technological transfer offices will become higher.

TechnologicalTransferOffice’sorganization:ThecaseoftheFrenchSystem.
55
Location Researchspending
Inventiondisclosure
Patentapplication
Licensesexecuted
Licensesincome
Spin-of
Output
Input
Efficiency
USA 216989600 117,5 71,3 32,5 9677419 3,6 5,52 8,2 0,7UK 16308797 25,9 13,8 31,1 730061 1,6 0,62 0,6 1,0France 26466257 20,8 10,5 4,4 1481595 1,6 1,00 1,0 1,0
Table 22: DEA analysis with an increase of 150% of French licenses income
Nevertheless, even if the relative efficiency increase, we have to take into account that
Licenses income does not all the value creation of the technological transfer offices. The
creation of spin-off, the creation off employment also is a creation off value. But those value
are harder to evaluate in a short term. Those indicators as licenses income have to be evaluate
constantly in order to assess the efficiency of this new business. We also see through the
literature review and through our model that a business based on the management of
intellectual property can take 10 to 15 years to become sustainable and French technological
transfer offices are still young so we will see in the next ten years the ones that success and
what will be their business model. But to become sustainable, TTO’s have to become more
efficient in the way they manage the IP in order to develop the best project and to license
those that they cannot develop to increase the return on investment made by public research
organizations in basic research.
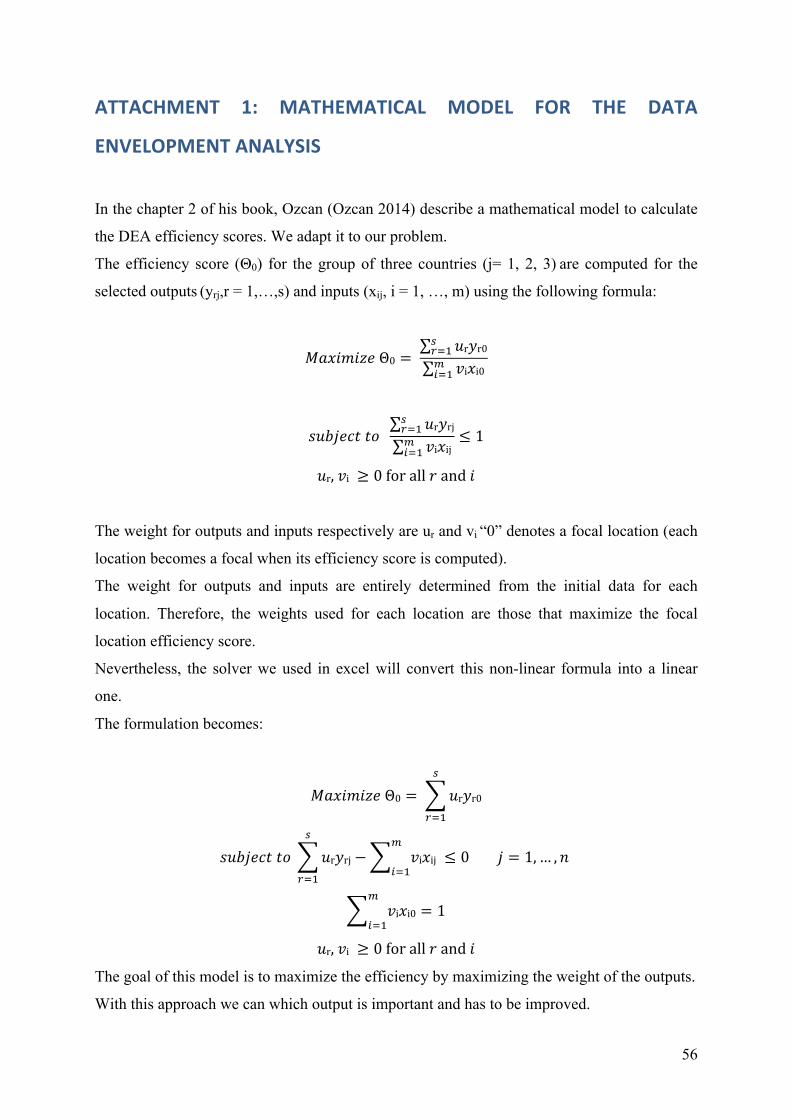
56
ATTACHMENT 1: MATHEMATICAL MODEL FOR THE DATA
ENVELOPMENTANALYSIS
In the chapter 2 of his book, Ozcan (Ozcan 2014) describe a mathematical model to calculate
the DEA efficiency scores. We adapt it to our problem.
The efficiency score (Θ0) for the group of three countries (j= 1, 2, 3) are computed for the
selected outputs (yrj,r = 1,…,s) and inputs (xij, i = 1, …, m) using the following formula:
𝑀𝑎𝑥𝑖𝑚𝑖𝑧𝑒 Θ0 = 𝑢r𝑦r0!
!!!
𝑣i𝑥i0!!!!
𝑠𝑢𝑏𝑗𝑒𝑐𝑡 𝑡𝑜 𝑢r𝑦rj!
!!!
𝑣i𝑥ij!!!!
≤ 1
𝑢r, 𝑣i ≥ 0 for all 𝑟 and 𝑖
The weight for outputs and inputs respectively are ur and vi “0” denotes a focal location (each
location becomes a focal when its efficiency score is computed).
The weight for outputs and inputs are entirely determined from the initial data for each
location. Therefore, the weights used for each location are those that maximize the focal
location efficiency score.
Nevertheless, the solver we used in excel will convert this non-linear formula into a linear
one.
The formulation becomes:
𝑀𝑎𝑥𝑖𝑚𝑖𝑧𝑒 Θ0 = 𝑢r𝑦r0!
!!!
𝑠𝑢𝑏𝑗𝑒𝑐𝑡 𝑡𝑜 𝑢r𝑦rj!
!!!
− 𝑣i𝑥ij!
!!! ≤ 0 𝑗 = 1,… ,𝑛
𝑣i𝑥i0!
!!!= 1
𝑢r, 𝑣i ≥ 0 for all 𝑟 and 𝑖
The goal of this model is to maximize the efficiency by maximizing the weight of the outputs.
With this approach we can which output is important and has to be improved.

TechnologicalTransferOffice’sorganization:ThecaseoftheFrenchSystem.
57
Bibliography
Abrams, I., Leung, G. & Stevens, A.J., 2009. BACKGROUND— TECHNOLOGY TRANSFER IN THE UNITED STATES. Research Management Review, 17(1).
Alexander, A.T. & Martin, D.P., 2013. Intermediaries for open innovation: A competence-based comparison of knowledge transfer offices practices. Technological Forecasting and Social Change.
Anderson, T.R., Daim, T.U. & Lavoie, F.F., 2007. Measuring the efficiency of university technology transfer. Technovation.
Anon, 2015. Making history EUREKA 30th anniversary report, Available at: www.eurekanetwork.org.
Brady, C. et al., 2015. UK University Technology Transfer: behind the headlines. Available at: http://www.isis-innovation.com/wp-content/uploads/2015/04/TT-in-the-UK-Paper.pdf.
Carboni, N. & Esteve, C., 2015. TTO CIRCLE SATT -The new French model for TTO Contribution of V. Lamande, President, SATT Ouest Valorisation, Available at: https://ec.europa.eu/jrc/sites/default/files/events/20130627-tto-circle/jrc-20130627-tto-circle-carboni.pdf.
Chapple, W. et al., 2005. Assessing the relative performance of U.K. university technology transfer offices: Parametric and non-parametric evidence. Research Policy.
Commission, E., 2009. Expert Group on Knowledge Transfer. Directorate-General for Research European Research Area: Knowledge-based economy.
Conti, A. & Gaule, P., 2011. Is the US outperforming Europe in university technology licensing? A new perspective on the European Paradox. Research Policy.
Cours des Comptes, 1997. Valorisation de la recherche dans les établissements publics à caractère scientifique et technologique, Rapports public particulier, Paris.
Curi, C. et al., 2014. The productivity of French Technology Transfer Offices after government reforms.
Curi, C., Daraio, C. & Llerena, P., 2012. University Technology Transfer: How (in-)efficient are French universities?
Decter, M., Bennett, D. & Leseure, M., 2007. University to business technology transfer-UK and USA comparisons. Technovation.
Dente, K., 2009. Overhaul or Overload for French Science? Cell.
Ergas, H., 1986. Does Technology Policy Matter?,
58
Etzkowitz, H., 2003. Innovation in innovation: the Triple Helix of university-industry-government relations. Social Science Information &, 4242(3), pp.293–337.
European Commission, 2009. Metrics for Knowledge Transfer from Public Research Organisations in Europe,
Fraser, J., 2009. Communicating the full value of Academic Technology Transfer: Some lessons learned. Tomorrow’s Technology Transfer, 1(1).
Guillaume, 1998. La technologie et l’innovation. Rapport au ministère de l'Education Nationale, de la Recherche et de la Technologie, des Finances et de l'Industrie et au secrétaire d'Etat à l'industrie. La documentation française.
Huggett, B., 2014. Reinventing tech transfer. Nature Biotechnology, 32.
Jackson, J. et al., 2012. A review and comparative study of innovation policy and knowledge transfer: An Anglo-French perspective. Innovation: Management, Policy & Practice.
Kiskiene, A., 2014. Scientific Knowledge and Technology Transfer Policy in the EU. Economics and Business, 26.
Landry, R. et al., 2013. Technology transfer organizations: Services and business models. Technovation, 33, pp.431–449.
Macho Stadler, I., Perez Castrillo, D. & Veugelers, R., 2007. Licensing of university innovations: The role of a technology transfer office. International journal of industrial organization.
Muller, E., Zenker, A. & Héraud, J.-A., 2009. France: Innovation System and Innovation Policy.
Mustar, 1994. La politique d’innovation en France: le colbertisme entamé Sachwald, ed.,
Mustar, P. & Larédo, P., 2002. Innovation and research policy in France (1980–2000) or the disappearance of the Colbertist state. Research Policy.
OECD, Main Science and Technology Indicators. Available at: https://stats.oecd.org/Index.aspx?DataSetCode=MSTI_PUB.
OECD, 2014. OECD Reviews of Innovation Policy: France 2014, OECD Publishing. Available at: http://dx.doi.org/10.1787/9789264214026-en.
Ozcan, Y.., 2014. Health Care Benchmarking and performance Evaluation,
Papon, P., 1998. Research institutions in France: between the Republic of science and the nation-state in crisis. Research Policy.
Papon, P., 1973. research planning in french science policy. Research Policy, 2(3), pp.226–245.
Picard, J.-F., 1999. La création du CNRS. La revue pour l’histoire du CNRS, 1.

TechnologicalTransferOffice’sorganization:ThecaseoftheFrenchSystem.
59
Piccaluga, A., Balderi, C. & Daniele, C., 2011. The ProTon Europe Ninth Annual Survey Report. Available at: http://www.protoneurope.org.
Réseau C.U.R.I.E, 2014. Enquête nationale sur les indicateurs de la valorisation et des partenariats. Available at: http://www.curie.asso.fr/IMG/pdf/rapport_indicateurs_valorisation_partenariats_2008-2011.pdf.
Salomon, J.-J., 1986. Le gaulois, le cow-boy et le samurai Economica, ed., Paris.
Thomas, A., 2007. Tech Transfer Benchmarking. Extracted from an internal whitepaper. Available at: http://tech.uchicago.edu/docs/techtransfer_benchmarking.pdf.
Thursby, J.G. & Thursby, M.C., 2002. Who Is Selling the Ivory Tower? Sources of Growth in University Licensing. Management Science, 48(1), pp.90–104.
Tseng, A.A. & Raudensky, M., 2014. Performance evaluations of technology transfer offices of major US research universities. Journal of Technology Management and Innovation.
Vavakova, B., 2006. Reconceptualizing innovation policy. The case of France. Technovation.