Embed Size (px)
Citation preview

Technological gap, social gap: an investigation into the relationship between scientific technological production and human development in Brazil
Ana Flávia Machado(*)(**) Mônica Viegas Andrade(**) Eduardo da Motta Albuquerque (**)
(*)Correspondant author: Ana Flávia Machado e-mail: [email protected] address: Rua Curitiba, 832 sala 701 30.330-170 Belo Horizonte Minas Gerais - Brasil (**) CEDEPLAR/UFMG (**) CEDEPLAR/UFMG (**) CEDEPLAR/UFMG

Technological gap, social gap: an investigation into the relationship between scientific technological production and human development in Brazil Ana Flávia Machado(*) Mônica Viegas Andrade(*) Eduardo da Motta Albuquerque(*)
Introduction
This article aims to evaluate the relationship between scientific and municipal
technological production and welfare conditions in Brazil. This evaluation is carried out on
a municipal level, which allows us to take into account both “inter” and “intra” regional
inequalities present in the country.
Our point of departure is the 2001 Human Development Report, which presents a
set of important issues, relating possible contributions of technological innovation to
human development. This report suggests an association between technological capability
and human development in the countries by means of a set of investigating elements. These
elements are responsible for virtuous circuits in the context of both technological and
human development.
The central issue to be investigated in this article concerns the relationship between
technological dimension and human development dimension in the country. To what
extent are the situations of the technological delay and social delay associated? In this paper
we use different data sets, scientific technological production statistics, human development
statistics and welfare statistics, which can contribute to a better understanding of the
Brazilian case and its position in the international setting, as found in the 2001 Human
Development Report.
This article is organized as follows. The first section sums up the most important
results of the 2001 Human Development Report, systematizing the multiple connections
between technology and welfare and identifying Brazil’s position in the international
ranking. The second one presents our data set pointing out their problems and limitations.
(*) CEDEPLAR/UFMG

The third introduces the methodology used in this study. In the fourth section we discuss
the main findings. Finally, the fifth section is the conclusion..
1 - Technology, human development and Brazil’s international position
Abramovitz (1986) emphasizes the importance of the “social capability” concept to
the understanding of catching up process. The concept of social capability points out that
“tenacious society characteristics normally account for a portion, perhaps a substantial
portion, of a country’s past failure to achieve as high a level of productivity as
economically more advanced countries” (p. 387). Such a concept allows the identification
that “ a country’s potential for rapid growth is strong not when it is backward without
qualification, but rather when it is technologically backward but socially advanced” (p.
388). Social capability involves, therefore, such issues as education, financial institutions
and political institutions. “The state of education embodied in a nation’s population and its
existing institutional arrangements constrains it in its choice of technology” (p. 388). The
relationship between science-industry-technology as well as general and technical
education will make up the remaining elements of social capability .
The 2001 Report (UNDP, 2001) synthesizes several studies, pointing out the
multiplicities of channels determining the interactions between technology and human
development. Figure I, extracted from this Report, shows these relations schematically.

Source: The 2001 Human Development Report (UNDP, 2001, p.28).
This scheme suggests a set of interactions among the several components involved
in pointing out the existence of causality relationship in several directions. Figure I shows a
two-way causality between human development and technological development. This
points to the presence of a “virtuous circuit” through an intermediary link, which is
economic growth.
How are these multiple influences processed?
Technological innovations affect human development in two ways. Directly, by
making available goods which directly affect health, nutrition, and population living
conditions. Examples of these goods are drought-resistant plant species, inoculations, clean

energy, Internet, etc (UNDP, 2001, p. 28). And indirectly, through technological
innovations, which affects human development as a result of its impact on economic
growth by means of productivity gains.
One important outlet for the direct influence of technological breakthroughs in
human development occurs through the impacts of scientific technological development on
health. For instance, UNDP affirms that “ medical breakthroughs such as immunizations
and antibiotics resulted in faster gains in Latin America and East Asia in the 20th century
than Europe achieved through better nutrition and sanitation en the 19th century. Human
health and survival began to improve dramatically in both regions in the 1930’s. By the
1970s life expectancy at birth had climbed to more than 60 years, achieving in four decades
an increase that took Europe a century and a half starting in the early 1800s.” (UNDP 2001,
pp. 28-29).
The relationship between technological process and health is well analyzed by
Wang et al (1999) in a study also discussed in the 2001 Human Development Report. This
study evaluates the relative conditions of income, education and technical progress for the
advances in health status. Wang et al (1999, pp 18-19) found that technical progress is
responsible for 45% of the reduction in the mortality rate of infants below five years and
for 45% of the increase in women’s life expectancy.
On the other hand, human development affects technological development by
extending the reach of higher educational levels, which make up important factors in the
creation and diffusion of innovations. The report points out that, along with human
development, there is a greater availability of both scientists undertaking research activities
and workers able to learn and dominate new technologies.
Connecting these causal senses, the report suggests that “human development and
technological advance can be mutually reinforcing, creating a virtuous circle.” (UNDP p.
28). Regarding technological progress, figure I suggests that economic growth has a causal
relationship in both directions. On the one hand, economic growth contributes to
technological progress, making available resources for research activities and for the
constitution of scientific technological infrastructure. On the other hand, technological
innovation contributes to expanding economic productivity.
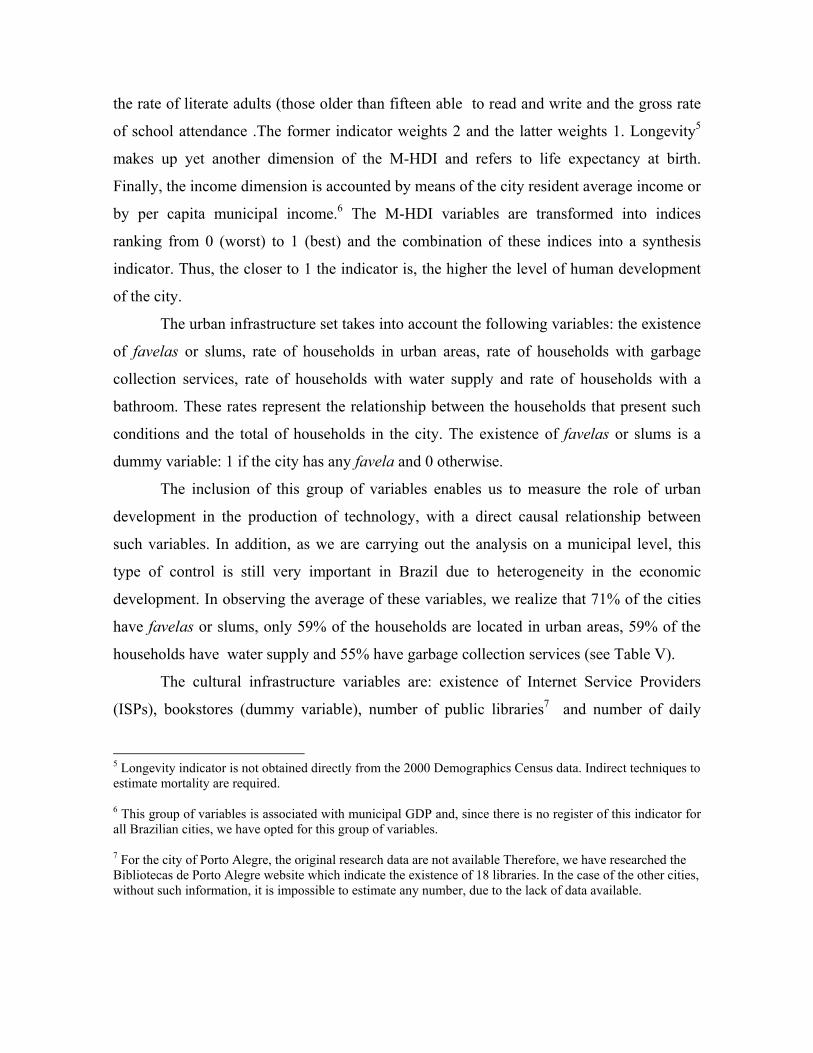
As far as human development is concerned, the Report suggests only one-way
causality: the effect of economic growth on human development. However, other studies
can be used to suggest that in addition to Figure I there is an arrow linking human
development and economic growth.
Fogel (1994), for example, demonstrates the influence of nutrition gains on per
capita income growth. The 1993’s World Bank Report systematizes some aspects in which
advances in health directly influence economic growth. The following points are
highlighted: labor productivity gains; better use of natural resources; benefits that education
can bring in to the future generations; cost-cutting in medical assistance; health investments
effects on poverty reduction. In adding up the effects, we reach the conclusion that
“improvement in health conditions should lead to an improvement in nationwide economic
performance” (p. 23) and that “ the data point out that better health conditions mean faster
growth” (p.25).
To the WHO (1999), advances in health influence economic growth directly by
determining productivity gains and, indirectly, through the improvement of learning
conditions and all of the effects arising from a better educational performance.
It’s important to consider, however, that the international setting is marked by great
inequalities in terms of income (UNDP 2001, pp. 16-20) living conditions and human
development (UNDP, 2001, pp. 141-144), scientific and technology resources. As far as
health is concerned, the world setting described by WHO can be summed up as a dual
challenge: “emerging epidemics and persisting problems” (WHO, 1999,pp. 13-27). This
information is important in order to discuss the reasons for the lack of a virtuous circuit
between technological progress and human development in several regions of the planet.
In light of these discussions, we seek to identify the Brazilian position in the world
ranking . The 2001 Human Development Report contains two indicators worth analyzing:
HDI (Human Development Index) and the TAI (Technology Achievement Index1).
1 This indicator is calculated from such data as “technological creation” (patents and revenues from royalties), “diffusion of recent innovations” (ISPs and high technologies exports), “diffusion of old innovations “(telephones and energy consumption and human skills (years of schooling university matriculations in the scientific and engineering areas”) (UNDP, 2001, pp. 46-47). This indicator is useful, but it has important problems. For the purpose of this paper, it can be used, because it allows a general interpretation which distinguishes the leader countries (TAI>0.5) and the backward countries (TAI<0.2) from a greater set of intermediary countries (identifying as a set of countries with “immature system of innovation”) which include the countries in the Table I (Brazil, India, Mexico and South Africa).

The evaluation of the international data identifies a positive correlation between
leading countries in technology (countries with TAI > 0.5) and countries with a high
Human Development Index (HDI >0.8). In addition, all countries outside of the technology
leading set are groups with HDI lower to that considered “ high Human Development”.
Brazil belongs to the set of countries in an intermediate situation in terms of Human
Development and Technological conditions. Table I presents data from Brazil, India,
Mexico and South Africa. All these countries belong to the same human development level
group (average) and are, therefore, not among the leaders in technology as identified by the
report.
TABLE I Comparison between HDI (human development index) and TAI (technology
achievement index)2
Country Position HDI
Value HDI
Position TAI
Value TAI
Literacy Rate (% more than 15
years old) (1999)
Gini Index
GNP per
capita (PPP US$)
(1999)
Life expectancy at born (years)
(1999)
Brazil 69 0,750 43 0.311 84.9 59.1 7,037 67.5 India 115 0,571 63 0.201 56.5 37.8 2,248 62.9 Mexico 51 0,790 32 0.389 91.1 51.9 8,297 72.4 South Africa 94 0,702 39 0.340 84.9 59.3 8,908 53.9 Source: prepared by the author, based on Human Development Report (2001)
It should be noted that the countries’ order in terms of HDI and TAI are different.
The basic difference between them is the position of Brazil and South Africa; whereas
South Africa is ahead of Brazil for TAI (respectively 39th and 43rd positions) the order for
HDI is inverted (94th and 69th respectively).
Evaluating data regarding income concentration, we can conclude that South
Africa, Brazil and Mexico have Gini Indices above 503. India appears to have a more
2 The difference between the countries’ position about the two indices (HDI and TAI) reflects the use of different set of countries. Some of them is in the HDI classification, but do not be in the TAI.

homogenous poverty distribution: it combines the lowest Gini Index with the lowest per
capita GDP among the four countries.
From the technological viewpoint, there are indications of geographical
concentration of the innovative activities: in all four countries, the leading state or province
holds over 40% of the number of patents in the country (USPTO, 2002). This pattern of
geographical concentration is repeated in scientific activities, except for India (ISI, 2002).
The evidence of inequality both in income distribution (an indicator associated with
welfare) and in distribution of scientific and technological activities foster an in-depth
investigation, into the Brazilian case. This investigation is important because inner
inequality, both in scientific technological activities and in welfare indicators can be a
determining factor of Brazil’s international position (as indicated by the report, according
to Table I).
2 - Descriptions of the variables
Seeking to estimate the relationship between scientific and technology and the level
of human development, we carried out a controlled analysis on a municipal level. Although
such a geographical unit takes on a small-scale productivity structure in most cases in
Brazil, resorting to information in a broader range, e.g. on a state level would reduce
dramatically the number of observations.
We use in our estimation seven groups of information data: the human development
index, urbanization indicators, cultural infrastructure indicators, presence of incentive
policies, level of schooling, health status indicators, and scientific and technological
production.
The Municipal Human Development Index (M-HDI) is set up by means of three
dimensions4 . Firstly, education, considering two different indexes with distinct weights:
3 In the 20001 Human Development Report (UNDP,2002, p. 188), the Gini Index ranges from 0 (perfect equality) to 100 (perfect inequality). 4 This methodology was created by a group of researchers from Fundação João Pinheiro and from the Applied Economics Research Institute (IPEA) and differs somewhat from the HDI of UNDP regarding the definition of income and education variables.
the rate of literate adults (those older than fifteen able to read and write and the gross rate
of school attendance .The former indicator weights 2 and the latter weights 1. Longevity5
makes up yet another dimension of the M-HDI and refers to life expectancy at birth.
Finally, the income dimension is accounted by means of the city resident average income or
by per capita municipal income.6 The M-HDI variables are transformed into indices
ranking from 0 (worst) to 1 (best) and the combination of these indices into a synthesis
indicator. Thus, the closer to 1 the indicator is, the higher the level of human development
of the city.
The urban infrastructure set takes into account the following variables: the existence
of favelas or slums, rate of households in urban areas, rate of households with garbage
collection services, rate of households with water supply and rate of households with a
bathroom. These rates represent the relationship between the households that present such
conditions and the total of households in the city. The existence of favelas or slums is a
dummy variable: 1 if the city has any favela and 0 otherwise.
The inclusion of this group of variables enables us to measure the role of urban
development in the production of technology, with a direct causal relationship between
such variables. In addition, as we are carrying out the analysis on a municipal level, this
type of control is still very important in Brazil due to heterogeneity in the economic
development. In observing the average of these variables, we realize that 71% of the cities
have favelas or slums, only 59% of the households are located in urban areas, 59% of the
households have water supply and 55% have garbage collection services (see Table V).
The cultural infrastructure variables are: existence of Internet Service Providers
(ISPs), bookstores (dummy variable), number of public libraries7 and number of daily
5 Longevity indicator is not obtained directly from the 2000 Demographics Census data. Indirect techniques to estimate mortality are required. 6 This group of variables is associated with municipal GDP and, since there is no register of this indicator for all Brazilian cities, we have opted for this group of variables. 7 For the city of Porto Alegre, the original research data are not available Therefore, we have researched the Bibliotecas de Porto Alegre website which indicate the existence of 18 libraries. In the case of the other cities, without such information, it is impossible to estimate any number, due to the lack of data available.

newspapers. These four variables enable us to measure the level access to the information
within the cities. The higher the number of ISPs, bookstores, daily newspapers and
libraries, the greater the production of patents and papers.
The group of variables related to incentives policies tries to capture the productive
capacity of the city. All indicators are binary variables: presence of employment and
income generation programs, presence of professional capability program and presence of
other type of incentives to economic activities.
The secondary source data is the IBGE´s CD-rom “Municipal Information Profile”
and the information mostly refers to the year of 1999. This research contains administrative
registers related to the city administration, the establishment of a comprehensive profile of
Brazilian cities.
The M-HDI is obtained from IPEA´s website ([email protected]), in the New Atlas for
Human Development in Brazil, created by researchers from Fundação João Pinheiro and
IPEA. The only education variable is the rate of literacy - proportion of the literate
population aged ten or older. In this case, the source of data is the 2000 Demographic
Census with information of the whole population. The level of literacy among the
population reflects the stock of city human capital. In Brazil, although there is a recent
process of universalization of formal education, the level of literacy is still an important
indicator on a municipal level. The average rate of literacy observed is 80.66% of the
population aged 10 or older, along with a minimum of 40.9 and, with a maximum 99.2 (see
Table V).
The health variables are the rate of child mortality and the number of hospitals beds
per capita. The rate of infant mortality is calculated by means of the relationship 0 to 1 year
of age, and the total number of children born alive. In order to correct problems with sub-
registers, of information on both deaths and births, we used the series set up by Simões
(1996). Trying to avoid volatility of the rates due to the small size of the population, the
author calculates the rate of infant8 , this variable is an indicator of well-being which
complements that of access to education.
8 In the city of Cuiabá, the information comes from the DATASUS database.
The data on scientific and technological production come from statistics of patents
filed with the Brazilian patent and Trademark office (INPI) and articles indexed with ISI. In
the literature of Technology Economics, there are innumerous texts highlighting the
advantages and disadvantages of those indices. Certainly not all innovations are patentable
or apt to be patented. Industrial sectors differ from one another in their “propensity to
patenting”. In developing countries the incremental and adaptive character of locally
important innovations may come to mean that they are not patented (see Griliches, 1990).
Articles indexed with ISI do not represent the whole of one country’s scientific products
especially in countries whose mother tongue is not English. Scientific subjects also differ
from one another in that they have different “propensity to publishing”. In Brazil, it is
important to remember that there is a wide range of domestic scientific publications that are
not indexed with the ISI and that scientific subjects vary greatly in terms of the
internationalization of scientific production. Therefore, ISI data can be read as a sort of “tip
of the iceberg” in terms of domestic scientific production.
Despite these problems, statistics for patents and scientific articles contribute
towards understanding and mapping the country’s scientific technological production. The
IBGE’s newly published Research On Technological Innovation (PINTEC) for example,
still does not have disaggregated data on the municipal level, which justifies the use of
patent data in an effort to draw up this map.
The variables to measure technology generation capacity refer to the number of
patents filed with the PTO between 1989 and 1999 and the number of articles indexed with
the ISI in 1999. Although the patent register bears the patent-holder’s address (see
www.inpi.gov.br), the PTO has not transferred these data to its magnetic register. The only
information presented is the patent holder’s state. Such information is important to this
work, for it implies the exclusion in the current analysis of the patents whose patent-holders
are individuals. Individuals play a major role in the country’s total number of patents.
Considering patents filed by Brazilian residents between 1988 and 1996, out of 57,640
patents, 38,820 were filed by individuals and 18,838 were filed by corporations.
The data presented in this sector, therefore, are restricted to corporation-filed
patents. The city is identified by matching the data supplied by the PTO (with the
patent- holder identification) with that of RAIS (Social Information Annual Report) which

associates the patent holder’s with a city. By crossing both PTO’s and RAIS’s information,
we set up the database described in this section.
The PTO data present information on 7,040 different companies, 23,919 patent-
holders and/or technological transfer contracts that, between 1999 and 2000, filed patents
and or executed technological transfers contracts. Matching such information with that in
RAIS allows the identification of the municipal location of 4,201 companies, representing
17,587 patents.
As the patents`database refers to a longer period (1988 to 1999) and RAIS’s to one
year only (1997), some firms that filed patents at the end of the 80’s and beginning of the
90’s may have disappeared (through either bankruptcy or mergers and acquisitions). The
small companies play a major role in the total of patents. Out of all the firms present in the
PTO data, 4,001 (56.83% of the total) filed only one patent.
The number of cities with at least one local patent holder is 512. Ten cities account
for 53.69% of identified patents. It is worth pointing out that four cities alone (Sao Paulo,
Rio de Janeiro, Campinas and Joinville) hold more than 500 patents. As for the indexed
papers, they are based on information taken from the www.webofscience.paper.br website,
supplied by ISI. Using the science citation, which excludes journals of both Human Science
and Arts, the 9,668 papers published with authors affiliated to institutions located in Brazil
in 1999 are saved after an Internet search and indexed as a selection criterion. From then
on, a database is built with the relevant information: authors, institutions, name of journal.
Only the year of 1999 is used in the analysis. But due to the difficulty in setting up the
database and with the scarcity of such detailed information, the data presented as follows
was set up in such a way as to contribute towards mapping the scientific resources available
in the country.
The number of cities with at least one participating author from one local institution
is 226. The ten cities with greater scientific production account for 69% of the domestic
scientific program.

3- Methodology:
3.1. The Negative Binomial Hurdle Model
As already explained this paper aims to evaluate the relationship between scientific
technological production and welfare in Brazil. Although the relationship between these
two variables is a two-way street, as shown in Figure I, we are looking into one way only,
i.e., how social well-being is capable of accounting for scientific technological production
in Brazil. We recognize this limitation but the nature of the sources of data used in this
research make it hard to specify the model that combines both. We have information
available for one year only. We do not count on a time series that can enable us to evaluate
two-way effects.
Therefore, we have resolved to use the Negative Binomial Hurdle Model in order to
estimate the relationship between scientific technological production and the degree of
human development. All variables of these models are organized by cities, according to
1996`s territorial division, which generates a total of 5,507 observations.
Estimating models to determine the number of patents and papers involves taking
into account some important characteristics of this kind of data. The number of patent
registrations and paper publications make up events which may be considered counting data
that take on only nonnegative value and they do not have an upper limit amount. The value
associated with those variables stands for the number of times the events occurred.
Poisson’s model is the simplest representative of the counting data model. However,
this model is not adequate for distribution of patents and papers in Brazilian cities, as most
of the cities do not present any registration. In this case, our distribution does not meet
Poisson’s model basic hypothesis of equidispersion of data, i.e., conditional mean equals
conditional variance9. In the literature, there are two ways of solving the problem regarding
the excess of “zeros”. One is the zero inflated model, which attributes weights for null
9 In the case of the total range of cities, we observe an average 3.47 patents per city with standard deviation of 72.69 and, in the case of the papers, these figures reach an average of 4.34 and standard deviation of 89 – the equidispersion hypothesis states that conditional mean equals conditional variance. Even if these figures do not reflect the conditioned amounts, uncontrolled amounts suggest a violation of the hypothesis.

amounts and nonnegative amounts (Wooldrigde, 2001). The second way treats the
overdispersion as the result of an unobserved heterogeneity. One of the models
contemplating this solution is the Negative Binomial; it includes a random component, with
a Gamma distribution in Poisson’s model.
iii cxy ,/ ~ Poisson (1)
[ ] ( βii xmxyiE =| ) (2)
[ ] ( ) ( )[ 22| βηβ iii xmxmxyV += ]
(3)
In the present study, we estimate a variation of the Negative Binomial Model,
known in the literature as the Hurdle Model. This model enables us to estimate the process
of decision of patent registration and paper publication as two distinct stochastic
processes10.
The first process refers to the decision to produce knowledge and innovation and the
second has to do with the decision of the number of the patents to be registered and articles
to be published. In this case, we can reasonably assume that the agents determining each of
these processes are distinct, The first process deals with the decision to set up a research
facility in the city, the decision on the part of the firm to set up an R&D or the decision by
an entrepreneur to invest either in the development of a new product or the improvement on
an existing one. In the second process, the number of patents registered or papers published
depends on the decision related to the volume of investments and/or the number of
professionals allocated to innovative activities.
In the first step, we used a logit model to determine if the city has produced
scientific technological knowledge and in the second step, we applied the Negative
10 As the data are censored, some authors suggest estimating the model through the Heckit estimator, arguing that information may be missing due to sample selection problem. Estimating models through to the Heckit procedure however, does not regard these data as count data. In addition, in the case of patents and published papers we do not believe that “zero” arises from sample selection. Rather, it should represent a genuine choice. Thus, the Hurdle model is the most suitable for estimating purposes.

Binomial Model truncated to zero expected number of both patents and articles with
positive generation11 (Cameron and Trivedi, 1988).
3.1.2. Interpretation of the coefficients
The estimated coefficients are interpreted separately for the first and second step.
Both the logistical model and the Negative Binomial Model truncated to zero are non linear
models and, therefore, the coefficients cannot be interpreted directly. In general, we are
interested in the marginal effects that show the effect of the variation of one of the regressor
on the dependent variable. The difficulty in interpreting the marginal effects in non linear
models lies in the fact that they depend on the values that the variables take on with the
population.
In the case of a logistic estimation model the easiest way to interpret the coefficient
is to calculate the chance odds. During the second step of the model, the estimation of the
Negative Binomial model truncated to zero, the interpretation of estimated coefficients
depends on the type of variable in use i.e. whether it is a dummy or continuous variable.
The marginal effect can be represented as such:
[ ] )exp(/ββ ij
j
xx
xyE=
∂∂ (4)
This relationship shows that the increase or decrease in the expected number of
patents or published papers is directly proportional to the variation taking place in one of
the regressor. If the variable is continuous, the estimation coefficient can be interpreted
directly as a semi – elasticity, for :
11 The Hurdle Model is estimated by means of the maximum likelihood method, built with two parametrically independent functions. One function for the traditional logit model and another for Negative Binomial truncated to zero model.

[ ]
[ ]
[ ][ ] j
j
jij
ijj
xyExxyE
xxxyE
xx
xyE
β
ββ
ββ
=∂
∂
=∂
∂
=∂
∂
/1/
)exp(1/
)exp(/
(5)
In this case, if the jth estimated coefficient is equal to 0.12, an increase of one unit in
the independent variable entails an increase of 12% in the expected number of registered
patents or published papers. In order to evaluate the effects of a dummy independent
variable, we should consider a regressor that takes on values one and zero. In this case the
effect on the expected number of registered patents can be calculated as:
[ ] ( )2212 exp,/ ββ xddxyE += (6)
Thus:
[ ][ ]
( )( ) ( 1
22
221
2
2 expexp
exp0,/1,/
ββ
ββ=
+=
==
xxd
dxyEdxyE ) (7)
In order to calculate the increase in the dependent variable when the covariate takes
on 1 in percentage terms we apply the following formula: [exp(β)-1]x100.
3.2. Treatment of the variables
Such variables as rate of households in urban areas, rate of households with garbage
collection services, rate of households with water supply, rate of households with a
bathroom, rate of literacy and rate of infant mortality are highly correlated (see correlation
matrix in the appendix)

To bypass this problem, we have chosen to build indices that represent these
variables by means of the Principal Components Analysis. Such a method estimates factors
which are linear combinations of the original variables, which allow us to account for the
variance observed in the sample.
Tables II and III sum up the results found. Factors 1 (f1) and 2 (f2) jointly account
for 85% of the total variance. The f1 contemplates all the variables mentioned above with a
uniform distribution of the weights. This factor can be interpreted as an indicator of urban
development since all the variables show that the higher the index, the greater the
development. In the case of infant mortality, as this variable maintains an inverse
relationship with the development, cities with a high infant mortality rate must therefore
present a lower index. The f2, in turn, attributes a heavier weight to infant mortality, albeit
with a positive signal. Thus, we have interpreted these results as an indication of the
incidence of poverty in the city. Due to the high level, we have chosen to maintain only
these two in the econometric analysis.
Table II - Principal Components Analysis: Variables of Quality Urban Life
Factor Eigenvalue Gap Proportion Accumulateddistribution
1 3,84886 2,56458 0,64150 0,64150
2 1,28428 0,93459 0,21400 0,85550
3 0,34969 0,09602 0,05830 0,91380
4 0,25367 0,11748 0,04230 0,95610
5 0,13619 0,00888 0,02270 0,97880
6 0,12731 0,00000 0,02120 1,00000

Table III – Variable Weights
Variable F1 F2
Infant mortality -0,34428 0,55850
Water supply 0,38952 0,41101
Bathroom 0,43335 -0,23101
Garbage collection 0,45132 0,28748
Literacy 0,42061 -0,42431
Urbanization 0,40167 0,45067
4. Results
Out of a range of 5,507, some cities do not possess any information as to the
registers of some of the variables used. We have therefore disregarded such cities, thus
reducing the database to 4,969 observations12
4.1 - Descriptive Analysis
Out of 4,969 cities, 494 present patents registered and 204 have papers published in
the year of the 1999, whereas 562 have either patents or papers. Dividing the total of cities
into those possessing some kind of scientific technological production (562) and those that
do not (4407), we stress the differences in the frequencies of cities with ISPs and
bookstores.
While 64% of the cities with scientific production have ISPs, only 10% of the cities
without the scientific technological production have them. Regarding bookstores, 80% of
the cities with scientific technological production have at least one bookstore, contrasted
with 32% for cities without production (see tables IV e IV-A).
12 Out of 538 observations excluded, none presents scientific technological production. Observing the distribution of the control variables in this sub-sample, we have found them to be related to cities with a lower level of development. As such, the lack of register seems to he correlated with the degree of development, showing bias in the missing observations.

Table IV – Descriptive Statistics to cities without scientific and technological production (N=4407)
Frequency Percentage
Variable No Yes No Yes
Favelas 3268 1139 74,15 25,85
Incentives to economic activities 1909 2498 43,32 56,68
Employment and income generation programs 2397 2010 54,39 45,61
Professional capability programs 2449 1958 55,57 44,43
Internet Service Providers 3963 444 89,93 10,07
Bookstores 2985 1422 67,73 32,27
Source: IBGE (1999), INPI (2001), ISI (1999).
Table IV-A - Descriptive Statistics to cities with scientific and technological production (N=562)
Frequency Percentage
Variable No Yes No Yes
Favelas 258 304 45,91 54,09
Incentives to economic activities 69 493 12,28 87,72
Employment and income generation programs 164 398 29,18 70,82
Professional capability programs 160 402 28,47 71,53
Internet Service Providers 199 363 35,41 64,59
Bookstores 111 451 19,75 80,25
Source: IBGE (1999), INPI (2001), ISI (1999).
As for such variables as number of public libraries and number of daily newspapers,
we have found that the set of cities, which have neither patents nor papers (4,407), have at
least one public library per city ( 0.92) and 2,43 daily newspapers. In contrast, the cities
with some kind of scientific technological production have two libraries per cities and 6.13
daily newspapers. The average M-HDI of cities without scientific technological production
(0.6926) is lower to that of cities with such kind of production, 0.7937 (see tables IV – B
and IV – C)

Table IV-B – Statistics of Continuous Variables to cities without scientific and technological production ( N=4407)
Variable Mean Standard error Minimum Maximum
Library 0,9253 0,7756 0,0000 16,0000
Daily newspaper 2,4350 9,5983 0,0000 500,0000
Water supply 0,5594 0,2290 0,0000 1,0000
Bathroom 0,8186 0,1970 0,0637 1,0000
Garbage collection 0,5107 0,2450 0,0000 0,9984
Urban area 0,5609 0,2186 0,0000 1,0000
Literacy 79,2386 11,2709 40,9000 99,2000
M-HDI 0,6926 0,0782 0,4668 0,9083
Source: IBGE (1999), INPI (2001), ISI (2000), IPEA (2003)
Table IV-C – Statistics of Continuous Variables to cities with some kind of scientific and technological production (N=562)
Variable Mean Standard error Minimum Maximum
Library 2,0552 5,3370 0,0000 80,0000
Daily newspaper 6,1352 20,4489 0,0000 480,0000
Water supply 0,8232 0,1542 0,1551 0,9995
Bathroom 0,9772 0,0563 0,4242 1,0000
Garbage collection 0,8667 0,1362 0,1598 1,0000
Urban area 0,8608 0,1520 0,1862 1,0000
Literacy 91,7774 5,1177 54,4000 98,2000
M-HDI 0,7937 0,043 0,5212 0,9119
Source: IBGE (1999), INPI (2001), ISI (2000), IPEA (2003)
Comparing the cities that have patents registered with those with published papers,
we have observed that three of the culture infrastructure variables distinguish the set of
cities with patents from the set of cities with papers. The variables are: incidence of ISPs,
number of libraries and number of daily newspapers. In the cities with papers, these three
variables always have a higher frequency: 81% have ISPs, the average number of public
libraries is 3.4% and the average number of daily newspapers is 8 (see tables V, V-A, V-B
and V-C)
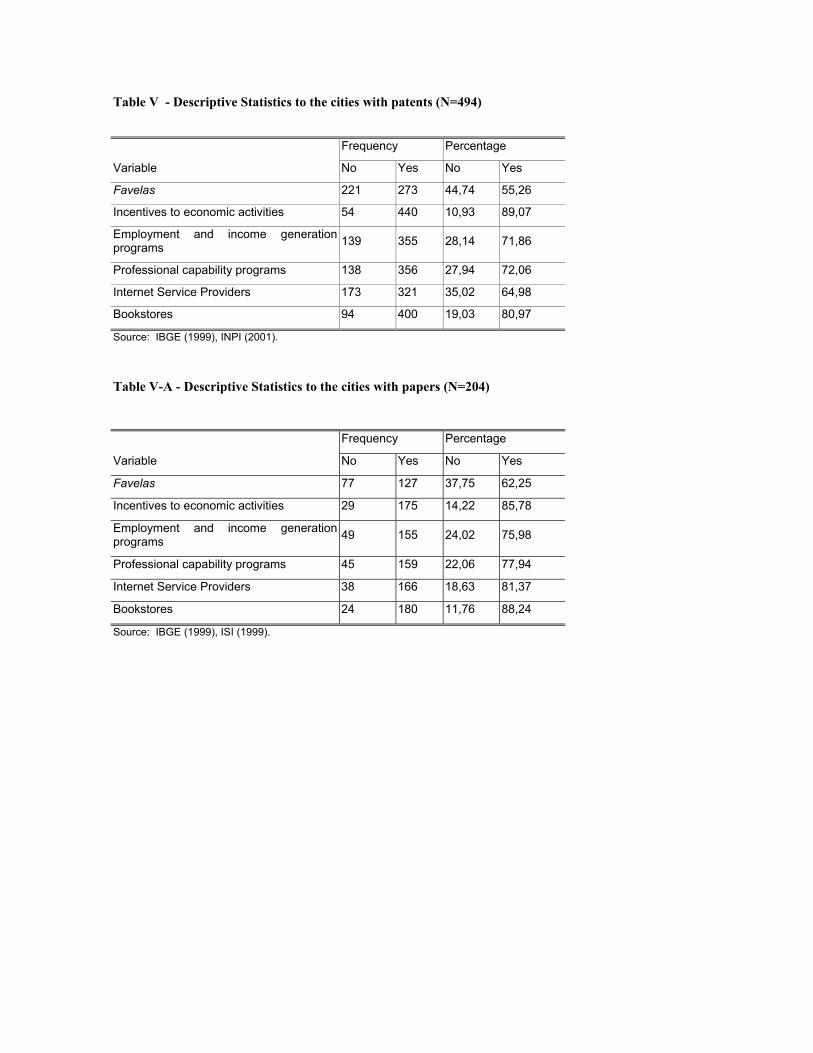
Table V - Descriptive Statistics to the cities with patents (N=494)
Frequency Percentage
Variable No Yes No Yes
Favelas 221 273 44,74 55,26
Incentives to economic activities 54 440 10,93 89,07
Employment and income generation programs 139 355 28,14 71,86
Professional capability programs 138 356 27,94 72,06
Internet Service Providers 173 321 35,02 64,98
Bookstores 94 400 19,03 80,97
Source: IBGE (1999), INPI (2001).
Table V-A - Descriptive Statistics to the cities with papers (N=204)
Frequency Percentage
Variable No Yes No Yes
Favelas 77 127 37,75 62,25
Incentives to economic activities 29 175 14,22 85,78
Employment and income generation programs 49 155 24,02 75,98
Professional capability programs 45 159 22,06 77,94
Internet Service Providers 38 166 18,63 81,37
Bookstores 24 180 11,76 88,24
Source: IBGE (1999), ISI (1999).

Table V-B – Statistics of Continuous Variables to cities with patents
( N=494)
Variable Mean Standard error Minimum Maximum
Library 2,1194 5,6100 0,0000 80,0000
Daily newspaper 5,3462 3,7541 0,0000 27,0000
Water supply 0,8307 0,1493 0,1551 0,9995
Bathroom 0,9826 0,0450 0,4242 1,0000
Garbage collection 0,8776 0,1261 0,2997 1,0000
Urban area 0,8678 0,1470 0,1905 1,0000
Literacy 92,4539 3,9149 54,4000 98,2000
M-HDI 0,7987 0,0374 0,5628 0,9119
Source: IBGE (1999), INPI (2001), ISI (2000), IPEA(2002)
Table V-C – Statistics of Continuous Variables to cities with papers(N=204)
Variable Mean Standard error Minimum Maximum
Library 3,3971 8,5220 0,0000 80,0000
Daily newspaper 8,0637 33,6222 0,0000 480,0000
Water supply 0,8519 0,1447 0,2937 0,9995
Bathroom 0,9696 0,0646 0,4781 0,9995
Garbage collection 0,8862 0,1347 0,1598 1,0000
Urban area 0,8936 0,1352 0,1862 1,0000
Literacy 91,3196 6,3745 56,0000 97,4000
M-HDI 0,794 0,0515 0,5212 0,919
Source: IBGE (1999), INPI (2001), ISI (2000), IPEA(2002)
4.2 - Model Results
The econometric model is estimated in two distinct specifications: In the first one,
we have used the M-HDI index itself as a proxy variable for human development and we
have included the remaining independent variables that aim to describe culture
infrastructure, degree of access to information and existence of programs of economic
incentives in the city. The second one uses that factors estimated through the analysis of
mean components as proxies to the level of human development. It must be kept in mind
that both factors are estimated by means of following variables: rate of urban households,
rate of households with garbage collection services and water supply, infant mortality and

rate of literacy. There are, at least, two advantages to using both estimations: firstly, the
estimations that utilize M-HDI allow a direct interpretation as this indicator corresponds to
a ranking index of the cities in terms of human development.
Thus, through this estimation ,it is possible to measure the impact of change at a
human development level on the possibility of technological production. Besides that, it is a
universal measure. On the other hand, the dimension of health observed in the second
estimation, with the f1 and f2, is measured through the rate of infant mortality and basic
sanitation conditions and urbanization, making up an in indicator that is sensitive to
changes.
In M-HDI, health is portrayed by life expectancy at birth, which presents an element
of inertia and is subject to a lower time variance, as it is an indicator describing health
conditions across all age groups. Thus, as life expectancy at birth is an average for the
whole population’s health, there may be changes averaging each other out and we end up
with cities having a similar value for this indicator under very different health conditions
among the age groups. As such the M-HDI does not accurately reflect reality and,
therefore, the second specification allows us to infer the level of robustness of the estimated
relationships, as we alter the indicators used as proxies for human development.
4.2.1. Model with M-HDI
As mentioned before, M-HDI ranges from zero to one. In the case of Brazilian
cities, this index takes on values between 0.4668 and 0.919 and the distribution among the
cities is asymmetrical to the right (see histogram I). Because of these characteristics and in
order to estimate the logistical model and interpret the coefficients13, we have set up
dummy variables that reflect different degrees of human development among the cities.
Eight dummy variables have been defined in such a way as to obtain a number of relatively
homogenous observations14. So, in the first step of the estimation of the model (logistic
13 As the intervals between the M-HDIs are infinitesimal, when we use the variables in the continuous form, the coefficient will take on too high values for the variation of one unit in our dependent value. 14 The dummy variables are: did1 equals one in cities where M-HDI takes on a value below 0.60 and didh1 equals zero for the rest (663 observations); didh2 equals one in cities where M-HDI takes on a value between 0.60 and 0.65 and didh2 equals zero for the rest (779 observations. ); didh3 equals one in cities where M-HDI

Histogram I Distributions of cities according to M-HDI intervals in 2000
Percentage of cities
Frac
tion
idh_m200.466804 .919049
0
.388609
���������������������������������������������������������������������������������������������������
������������������������������������������������������������������������������������������������������������������������������������������������������������������������������������������������������������������������������������������������������������������������������������������������������������������������������������������������������������������������������������������������
������������������������������������������������������������������������������������������������������������������������������������������������������������������������������������������������������������������������������������������������������������������������������������������������������������������������������������������������������������������������������������������������������������������������������������������������������������������������������
��������������������������������������������������������������������������������������������������������������������������������������������������������������������������������������������������������������������������������������������������������������������������������������������������������������������������������������������������������������������������������������������������������������������������������������������������������������������������������������������������������������������������������������������������������������������������������������������������������������������������������
����������������������������������������������������������������
M-HDI
model), the M-HDI variable is specified through these dummies, with the lowest M-HDI
cities as reference cities, i.e., those with M-HDI level below 0.6.
takes on a value between 0.70 and 0.725 and didh3 equals zero for the rest (779 observations. ); didh4 equals one in cities where M-HDI takes on a value between 0.60 and didh4 equals zero for the rest (441 observations); didh5 equals one in cities where M-HDI takes on a value between 0.725 and 0.750 and didh5 equals zero for the rest (598 observations); didh6 equals one in cities where M-HDI takes on a value between 0.750 and 0.775 and didh6 equals zero for the rest (648 observations); didh7 equals one in cities where M-HDI takes on a value between 0.775 and 0.80 and didh7 equals zero for the rest (585 observations); didh8 equals one in cities where M-HDI takes on a value above 0.80 and didh8 equals zero for the rest (540 observations).

The results found for the first step of the model, which estimates the decision of
registering a patent in the city reveal that there is a positive relationship between economic
development and likelihood of patents registration. The high degree of adjustment of the
model presenting pseudo R2 equal to 0.4669 has come to our attention. The results found
show that only for cities with M-HDI above 0.725 will the probability of registering
patents differ from the cities with a worse degree of development. In this case, the
probability of registering patents in this city increases fivefold. As the degree of
development increases, so does this probability
Table VI –Patents Model – Logistic15
Variable Odds Ratio T
Favelas 2.8524 7.88
Incentives to economic activities 1.9888 3.81
Employment and income generation programs 0.8942 -0.73
Professional capability programs 1.2851 1.68
Internet Service Providers 2,3845 6.18
Bookstores 1.5381 2.84
Libraries 1.046 1.19
Daily newspaper 1.00 0.76
Didh2 0.1918 -1.43
Didh3 0.5220 -0.79
Didh4 0.9219 -0.10
Didh5 6.2698 2.93
Didh6 12.9976 4.23
Didh7 22.6645 5.17
Didh8 78.2168 7.17
Pseudo R2 0.4669
In addition, the presence of economic incentives, ISPs and bookstores contributes to
the creation of patents. In the case of ISPs, the odds increase by 138% compared with cities
15 The reference category is a city with M-HDI inferior than 0,60, without favelas and without bookstores and without professional capability programs and without employment and income generation programs and, also, without Internet service provider. .

that do not have such a resource, whereas the incidence of libraries increases by 50% the
odds of having a registered patent. Although the existence of favelas may be a negative
characteristic of economic development, it also indicates how urbanized the city is. Hence,
the positive correction found can be interpreted, not because the incidence of favelas leads
to the generation of patents, but rather as an indication that the bigger the urban center, the
greater the probability of the existence of patents. On the other hand, lack of statistical
significance of the variable number of public libraries has drawn our attention, because we
had expected it to be an important variable.
Table VII –Papers model – Logistic16
Variable Odds Ratio T
Favelas 2.0928 4.20
Incentives to economic activities 1.1045 0.42
Employment and income generation programs 0.9590 -0.20
Professional capability programs 1,3199 1.37
Internet Service Providers 5.607 8.00
Bookstores 2.1795 3.04
Libraries 1.2088 3.86
Daily newspaper 1.007 1.93
Didh2 0.5612 -0.57
Didh3 1.4524 0.46
Didh4 1.5157 0.49
Didh5 2.5917 1.23
Didh6 3.9690 1.86
Didh7 4.0578 1.88
Didh8 9.8131 3.14
Pseudo R2 0.3807
Concerning the publication of papers (see table VII), the results are quite similar,
except for the variables ‘incidence of incentives to economic activities’, ‘number of public
libraries’ and ‘number of daily newspapers’. In this case, both the number of libraries and
16 The reference category is a city with its M-HDI inferior or equal to 0,35, without favelas, without bookstores, without professional capability programs, without employment and income generation programs and also without Internet service provider.

the number of daily newspapers are statistically significant, suggesting a difference in the
paper writing process in comparison with that of patents. In the case of papers, this result is
probably due to the need for critical mass density, something, to places where there are
research institutes such as universities. Besides that, the magnitude of the coefficient
estimated for the presence of bookstores in the paper publication model is higher than that
estimated in the patent registration model, which can reinforce the interpretation about the
role that research institutions do take. As for the M-HDI variables, we have found that only
from the didh6 dummy will the coefficient be statistically significant17, which suggests that
only in the cities with a development index higher than 0.75 do papers stand a chance of
being published.
In the second step of the patent registration model, estimation of Negative
Binomial truncated to zero, we do not use the dummies that portray the M-HDI scale
among the cities. We do, however, use the index itself 18. This specification of the variable
is due to two reasons: firstly, the M-HDI specification through the dummy variables greatly
increases the number of independent variables; secondly, the continuous variable
specification admits direct interpretation in the case of Negative Binomial model. The
results point to the statistical significance of the variables ‘incidence of favelas’, ‘incidence
of ISPs’, ‘number of libraries’ and also the ‘M-HDI’. In this case, we have reported the
coefficients estimated in Table VIII. For the binary variables, we have calculated antilog19
in percentages and, for the continuous or discrete variables, the coefficient can be
interpreted directly as a semi-elasticity (Cameron and Trivedi, 1988). The results
corroborate those obtained in the first step: for those cities with favelas, the expected
number of registered patents is 345% greater than that of the cities without favelas. As for
Internet, cities with ISPs present an expected number of patents 206% higher than that
obtained in cities without ISPs. The result obtained for the variable ‘number of libraries’
has drawn our attention, for in the first step, decision of registering patents, it is not
17 The coefficients are significant at 6% level. 18 We have also run the model using the M-HDI specifications, but the coefficients are not significant. This result is probably due to the intervals chosen. As the number of cities with positive registration of papers and patents is very low, we have chosen to present only the continuous, M-HDI specification. 19 The anti log is calculated by (expβ-1)*100.

significant and it becomes significant when defining the number of patents. The presence of
an additional library implies that the expected number of patents will increase by 20%.
Furthermore, an improvement in the M-HDI in one unit tends to increase the expected
number of patents20 by 1000%.
Table VIII - Patents model: Negative Binomial truncated to zero21
Variable Coefficients T
Favelas 1.4939 6.62
Incentives to economic activities -0,1583 -0,45
Employment and income generation programs -0,0505 -0.02
Professional capability programs 0,4964 1,85
Internet Service Providers 1.1199 4.15
Bookstores 0,2450 0.81
Library 0,2092 2,68
Daily newspaper 0,0263 0,92
M-HDI 10,3461 3,81
Constant -17,2315 -1.30
Pseudo R2 0,0697
In the Negative Binomial model for papers (see Table IX), only the variables
‘number of public libraries’, ‘presence of bookstores’ and ‘M-HDI’ are significant at 5%
level. Although the level of significance is not the same as in the logit model (first step), the
variables of culture infrastructure remain as determinants of the expected number of
published papers. The presence of more than one library in the city generates an expected
16% increase in the number of papers.
20 The M-HDI ranges from 0.4668 to 0.9190, with an average of 0.7 and standard error of 0.081. There is no direct interpretation for the meaning of the variation of one unit in the M-HDI. In the dummy model human development is not statistically significant in the second steps of the models. 21 The model converge after 14 interactions, however, the log likelihood function is not concave and so we can not conclude that the function converge at a point of worldwide maximum.

Table IX - Papers Model: Negative Binomial truncated to zero22
Variable Coefficients T
Favelas 0,3641 0,81
Incentives to economic activities -0,6424 -0,85
Employment and income generation programs 0,4626 0,55
Professional capability programs 0,5747 0,65
Internet Service Providers -1,2550 -0,82
Bookstores 1,6398 2,05
Library 0,1646 2,82
Daily newspaper -0,0104 -1,29
M-HDI 12.7316 2,87
Constant -16.1470 -6,56
Pseudo R2 0,0496
4.2.2 Model with urban development indicator (f1) and poverty incidence indicator
(f2)
In the second specification, in which we have included the f1 and f2 factors as the
covariates in substitution for M-HDI, the results found for the first step of the model (logit)
are surprising in terms of the robustness of the set of variables, as out of the 11 covariates,
only four are not statistically significant and, above all, the signals are as expected.
The urban development indicator(f1), as a result from the Principal Components
Analysis, indicates greater probability for the most developed cities, whereas the poverty
incidence indicator (f2) demonstrates that cities with a higher incidence of poverty stand
less chance of registering patents, as the odds ratio estimated is lower than 1.23 As for the
remaining independent variables, the results are similar to that in the M-HDI specification
(see table X). 22 The model converge after 24 interactions, however, the log likelihood function is not concave and so we can not conclude that the function converge at a point of worldwide maximum. 23 As the f1 and f2 are continuous variables, the interpretation of the odds ratio is not the same as that of dummy variables. Nevertheless, an odds ratio lower than one can be interpreted as a reduction in probability.

Table X -Patents Model – Logistic24
Variable Odds Ratio T
Favelas 2,366886 6,66
Incentives to economic activities 2,014382 3,92
Employment and income generation programs 1,000166 0,00
Professional capability programs 1,304687 1,80
Internet Service Providers 1,908577 4,57
Bookstores 1,697474 3,54
Libraries 1,069584 1,35
Daily newspaper 0,9976649 -0,73
F1 5,481485 10,35
F2 0,5647159 -3,32
Pseudo R2 0,4869
In table XI, we present the results for the logit model concerning the publication of
papers. The results are also quite similar, except for such variables as presence of incentives
to economic activities, number of public libraries and number of daily newspapers when
compared with that of the registration of patents in the second specification and except for
the number of daily newspapers, when compared with that of the publication of papers in
the first specification. We were surprised to discover that the magnitude of the odds ratio
estimated for the f2 indicator is higher than one, which can be interpreted as the greater the
incidence of poverty in the city, the greater the chance of having papers published. As the
f2 indicator describes the incidence of poverty, it attributes positive values for both
homogeneously poor cities and cities with high levels of inequality (such as the great urban
centers in the country). Cities like São Paulo, Campinas e Belo Horizonte, which present f2
higher than one, illustrate regions with expressive scientific production and with poverty
pockets.
24 The reference category is a city without favelas, without bookstores, without professional capability programs, without employment and income generation programs and without Internet service provider

Table XI – Papers Model – Logistic
Variable description Odds Ratio T
Favelas 1,701835 3,09
Incentives to economic activities 1,16937 0,66
Employment and income generation programs 0,9918078 -0,04
Professional capability programs 1,221111 1,00
Internet Service Providers 4,26396 6,92
Bookstores 2,028063 2,75
Library 1,211695 3,78
Daily newspaper 1,006608 2,65
f1 2, 147485 6,82
f2 1,723003 4,11
Pseudo R2 0,4043
Tables XII and XIII report the results of the model of patents registrations and paper
publications according to the Negative Binomial estimation. There is no divergence in the
robustness of the variables related to the specification with M-HDI. In this case, both f1 and
f2 are statistically significant.
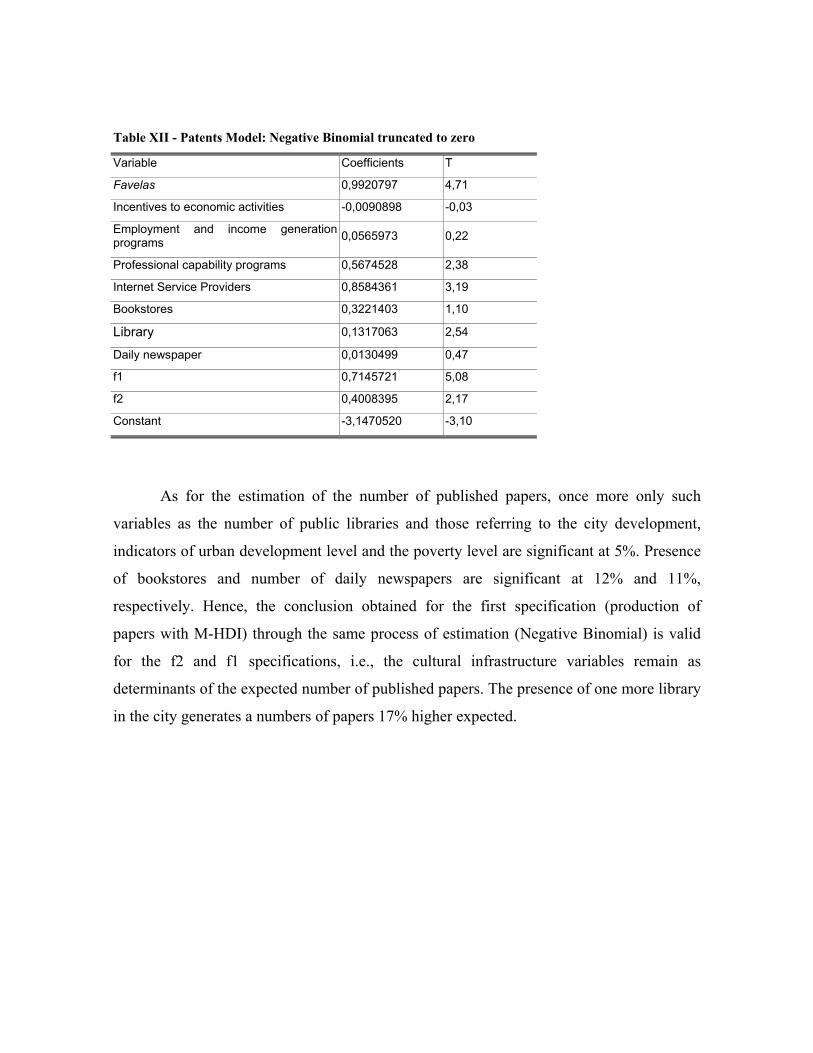
Table XII - Patents Model: Negative Binomial truncated to zero
Variable Coefficients T
Favelas 0,9920797 4,71
Incentives to economic activities -0,0090898 -0,03
Employment and income generation programs 0,0565973 0,22
Professional capability programs 0,5674528 2,38
Internet Service Providers 0,8584361 3,19
Bookstores 0,3221403 1,10
Library 0,1317063 2,54
Daily newspaper 0,0130499 0,47
f1 0,7145721 5,08
f2 0,4008395 2,17
Constant -3,1470520 -3,10
As for the estimation of the number of published papers, once more only such
variables as the number of public libraries and those referring to the city development,
indicators of urban development level and the poverty level are significant at 5%. Presence
of bookstores and number of daily newspapers are significant at 12% and 11%,
respectively. Hence, the conclusion obtained for the first specification (production of
papers with M-HDI) through the same process of estimation (Negative Binomial) is valid
for the f2 and f1 specifications, i.e., the cultural infrastructure variables remain as
determinants of the expected number of published papers. The presence of one more library
in the city generates a numbers of papers 17% higher expected.

Table XIII - Papers Model: Negative Binomial truncated to zero
Variable Coefficients T
Favelas 0,3758748 0,84
Incentives to economic activities -0,5287083 -0,69
Employment and income generation programs 0,6159782 0,92
Professional capability programs -0,1645596 -0,17
Internet Service Providers -1,5433260 -1,15
Bookstores 1,3297150 1,53
Library 0,1741710 3,14
Daily newspaper -0,0115120 -1,58
F1 0,6739465 3,21
F2 1,7192260 3,53
Constant -9,4287250 -7,55
Source: prepared by the authors, based on IBGE (2002), INPI (2001), ISI (2000).
Comparing the two steps of the estimation and the specifications, we observe that
the adjustment of the logit model is better than that of the Negative Binomial, as the pseudo
R2 of the former is quite higher, around 0.4 in both specifications, whereas the latter takes
on values close to 0.06. The reduced number of observations in a Negative Binomial
model (494 cities with patents and 204 cities with papers) is likely to affect estimation of
the same.25 We have carried out the specification test of Hurdle model against Poisson`s
model for the two situations (patents registration and paper production) and in both
specifications. In the four cases, Poisson`s model is rejected, thus ratifying the use of the
Hurdle model.
The results obtained in the Hurdle model can be summed up according to our sets of
variables. The culture infrastructure (presence of ISPs and bookstores, number of libraries
and daily newspapers) accounts for the decision to register patents and publish papers. The
second step in the decision making process, how many patents and papers to produce,
estimated by Negative Binomial model, demonstrates that the culture infrastructure is no
25 In the Negative Binomial model, the maximum likelihood function converges, but it does not appear concave.
longer that important, for only such variables as number of libraries and ISPs are
determinants.
The dummy variables for the M-HDI scale of the cities with greater human
development and the M-HDI itself as well as the sets of variables of urban, health and
education infrastructure redefined, by means of the main components method, as urban
development indicator (f1) and as poverty incidence indicator (f2) are determinants of the
two steps of the decision-making process related to scientific technological production. In
other words, the more developed a city and the greater the incidence of poverty, the greater
the chance of registering patents and publishing papers and the greater the expected number
of both patents and papers.
The variable “incidence of favelas or slums” is also correlated with the decision to
produce patents and papers and the decision about the number of patents to be registered.
And its importance must be explained by the level of urbanization of the city, for the
greater the urban center, the greater the probability of the existence of favelas or slums and
of favorable conditions for cultural infrastructure and urban development.
5 - Preliminary Conclusion
This study is an initial effort for a more comprehensive evaluation of the complex
relationships between scientific technological production and welfare. This article’s
contribution lies in the statistical evaluation carried out on a municipal level using available
data on science, technology and welfare.
Two preliminary conclusions can be distinguished:
• Firstly, there is a strong relationship between cultural infrastructure and
scientific technological production;
• Secondly, there is a complex association between scientific technological
production and welfare data. The results of the tests carried out indicated
that scientific technological production is associated with both human
development indicators and poverty incidence indicators.
How should we understand the above conclusions?

The direct and clear association between cultural infrastructure data (libraries,
newspapers, Internet) and technological development is not a difficult one to understand.
Certainly the availability of that type of resource is a pre-condition for scientific
technological production. On the other hand, the correlationship between scientific
technological production and development and poverty incidence entail a more careful
discussion. At least, four arguments can be taken into account in this explanation.
Firstly, the spatial distribution of science and technology activities somehow
follows the Brazilian map of regional concentration of income and economic activities. So,
obtaining an HDI that corresponds to that of a country with “high human
development”(IDH > 0.8) has such significant effects on the probability of identification of
scientific technological production in a city.
Secondly, this correlationship reflects a structural element of Brazilian
development. That means, although there is an association between technological
development and human development, the latter is concentrated thus, generating poverty
pockets. The inequalities are identifiable not only on a regional level but also within in the
cities. Perhaps this is the greatest contribution of the combination between the f1 and f2
indicators proposed in the text: a big city simultaneously obtains high values in both
indicators, ratifying the combination between development and poverty incidence
(otherwise identified by the association between high M-HDI and incidence of favelas).
The M-HDI itself does not indicate such a combination (São Paulo`s M-HDI equals 0.841;
Campinas`s M-HDI equals 0.852; Rio de Janeiro`s M-HDI equals 0.842; Belo Horizonte`s
M-HDI equals 0.839). The country`s main cities have enormous social inequalities.
One other manner of interpreting these results concerns the impact of scientific
technological infrastructure on living conditions. The association found between scientific
technological infrastructure and living conditions as identified here suggests the existence
of causal relationship of science and technology towards human development. However,
that is not dealt with in this study, and it may be incorporated in future research.
If scientific infrastructure has developed more than technological infrastructure in
the last three decades, why can`t the former generate welfare conditions? Two factors may
be operating at this point: on the one hand, Brazilian scientific production skill has not been
able to accumulate enough critical mass to influence social reality in a noticeable manner;
on the other hand, there may be disconnections between the focus of scientific activities
and the most pressing social needs of the country’s poorest population or maybe a
combination between lack of critical mass and partial disconnection.
These conclusions, preliminary as they may be, can foster discussion of some
suggestions for public policies;
1. Investments in nationwide expansion of scientific technological
infrastructure, so as to mitigate its high regional concentration (only 204
cities published at least one indexed paper in 1999 and only 494 cities have
institutions that filed at least one patent between 1988 and 1996): a less
concentrated distribution can be a way for that infrastructure to handle the
diversity of existing problems in the country reaching far as cities with
lower M-HDI, for example;
2. Strengthening of the cultural infrastructure: an important requirement for
scientific technological production, and which as demonstrated in the study,
influencing scientific technological production;
3. As suggested by the theory and several evidences have been gathered, social
advances do have an impact on scientific technological production, whether
by health improvements (with impacts on learning capabilities) or reduction
in the illiteracy rate and educational improvement;
4. As for the scientific technological infrastructure, two other movements can
be made: first, an expressive increase in the resources available to the sector
(a requirement for the necessary accumulation of critical mass to engage a
positive impact of the scientific technological activities on living
conditions); second, a better application of the existing resources towards
meeting such social priorities as health, housing and living conditions in
great urban centers. With that in mind mission-oriented projects can be
formulated, as suggested by freeman (1996), for environmental conditions.

References ABRAMOVITZ, M. (1989) Thinking about growth. Cambridge: Cambridge University.
CAMARGO, C. F. C.; CARDOSO, F. H.; MAZZUCHELLI, F.; MOISÉS, J. A.; et all (1976) São Paulo 1975: crescimento e pobreza. São Paulo: Edições Loyola.
CAMERON, A. C., TRIVEDI, P. K, MILNE, Frank, PIGGOTT, J. A microeconometric model of the demand for health care and health Insurance in Australia. Review of Economics Studies. vol. 55, págs. 85-106, 1988.
FREEMAN, C. (1996) The greening of technology and models of innovation. Technological Forecast and Social Change, v. 53, pp. 27-39.
FOGEL (1994) Economic growth, population theory, and physiology on the making of economic policy. American Economic Review, v. 84, n. 3, Jun.
GRILICHES, Z. (1990) Patent statistics as economic indicators: a survey. Journal of Economic Literature, v. 28, Dec.
GLOBAL FORUM FOR HEALTH RESEARCH (2002) The 10/90 Report on health research 2001-2002. Geneva: Global Forum for Health Research.
INSTITUTO BRASILEIRO DE GEOGRAFIA E ESTATÍSTICA – IBGE (1999) Cd-rom Perfil de Informações Municipal, Rio de Janeiro, 1999.
MURRAY, C. J. (ed.); LOPEZ, A. (1996) The global burden of disease : a comprehensive assessment of mortality and disability from diseases, injuries, and risk factors in 1990 and projected. Harvard: Harvard School of Public Health.
NORONHA, K. V. M. S. Dois Ensaios sobre a desigualdade social em saúde. Belo Horizonte: CEDEPLAR/UFMG, 105p. Dissertação de mestrado, 2001.
UNITED NATIONS DEVELOPMENT PROGRAM (2001) Human Development Report: making new technologies work for human development. New York: UNDP (www.undp.org)
WANG, J.; JAMISSON, D.; BOS, E.; PREKER, A.; PEABODY, J. (1999) Measuring country performance in health: selected indicators for 115 countries. Washington: World Bank (disponível em www.worldbank.org).
WOOLDRIDGE, J. M. Econometric Analysis of Cross-Section and Panel Data, EMD Press, 2002.
WORLD BANK (1993) World Development Report 1993: Investing in Health. Oxford: Oxford University.
WORLD HEALTH ORGANIZATION (1996) Investing in health research and development. TDR/Gen/96.1 (www.who.org).
WORLD HEALTH ORGANIZATION (1999) World Health Report: making a difference. Genveva: who (www.who.org).
WORLD HEALTH ORGANIZATION (2001) Macroeconomics and health: investing in health for economic development. Report of the Comission on Macroeconomics and Health. Geneva (www.who.org).

Appendix
Correlation Matrix of control variables
Variable
Libr
ary
Book
stor
e
Dai
ly
New
spap
er
Infa
nt
mor
talit
y
Wat
er s
uppl
y*
Bath
room
*
Gar
bage
co
llect
ion*
Lite
racy
Empl
oym
ent
and
inco
me
prog
ram
s
Fave
la
Inte
rnet
Urb
an a
rea*
Prof
essi
onal
ca
pabi
lity
Library 1,0000
Bookstore 0,1264 1,0000
Daily newspaper 0,0387 0,0684 1,0000
Infant mortality -0,0733 -0,1845 -0,0657 1,0000
Water supply * 0,1452 0,2698 0,0892 -0,2761 1,0000
Bathroom* 0,1026 0,2739 0,0859 -0,6194 0,4790 1,0000
Garbage collection* 0,1628 0,3468 0,1261 -0,3749 0,7451 0,6690 1,0000
Literacy 0,1190 0,3179 0,0960 -0,8098 0,4025 0,7886 0,5662 1,0000 Employment and income programs 0,0892 0,2287 0,0517 -0,0536 0,1157 0,0978 0,1553 0,1279 1,0000
Favela 0,0940 0,1948 0,0491 0,0446 0,0892 0,0597 0,1182 0,0288 0,1779 1,0000
Internet 0,1713 0,4107 0,1025 -0,1866 0,3396 0,2578 0,4075 0,3166 0,2117 0,2111 1,0000
Urban area* 0,1618 0,3290 0,1054 -0,2366 0,7507 0,5007 0,8424 0,4119 0,1244 0,1544 0,4082 1,0000
Professional capability 0,0982 0,2189 0,0639 -0,0098 0,1087 0,0724 0,1494 0,0890 0,4687 0,1692 0,2138 0,1453 1,0000 The variable refers to a households percentage attended (or situated in the case of the urban area)
Correlation Matrix of control variables- dummy intellectual production = 1
Variable
Libr
ary
Book
stor
e
Dai
ly
New
spap
er
Infa
nt
mor
talit
y
Wat
er s
uppl
y *
Bath
room
*
Gar
bage
co
llect
ion*
Lite
racy
Empl
oym
ent
and
inco
me
prog
ram
s
Fave
la
Inte
rnet
Urb
an a
rea*
Prof
essi
onal
ca
pabi
lity
Library 1,0000
Bookstore 0,0915 1,0000
Daily newspaper 0,0168 -0,0728 1,0000
Rate of infant mortality -0,0605 -0,1030 -0,0268 1,0000
Water supply by general net* 0,1297 0,1778 0,0710 -0,1605 1,0000
Bathroom* 0,0327 0,1314 0,0028 -0,6193 0,3937 1,0000
Garbage collection* 0,1305 0,1930 0,0454 -0,3368 0,6820 0,5719 1,0000
Literacy 0,1062 0,2152 -0,0072 -0,7171 0,3322 0,8102 0,5309 1,0000 Employment and income programs 0,1013 0,1928 -0,0444 -0,0225 0,0570 0,0383 0,0809 0,1269 1,0000
Favela 0,1274 0,1439 0,0652 0,0960 0,0951 0,0075 0,1408 0,0680 0,1941 1,0000
Internet 0,1333 0,3616 -0,0140 -0,0783 0,3618 0,1954 0,3645 0,2275 0,2040 0,1467 1,0000
Urban area* 0,1314 0,2359 0,0571 -0,1320 0,6950 0,3850 0,8384 0,3541 0,1076 0,2189 0,3911 1,0000
Professional capability 0,1123 0,1822 0,0468 0,0041 0,0971 0,0791 0,1324 0,1460 0,4797 0,1309 0,2584 0,1570 1,0000
Source: IBGE (2002), INPI (2001), ISI (2000), due elaboration The variable refers to a households percentage attended (or situated in the case of the urban area)