Embed Size (px)
Citation preview

Page 1 of 41
TECHNO FEASIBILITY REPORT
FOR
Production Capacity Enhancement in Blast Furnaces 1&2 from 2, 92,000 TPA to 3, 50,000 TPA by Process Optimization along with Production Capacity Enhancement in Blast Furnaces 3 , from 5,40,000 TPA to 6,50,000 TPA through technology Up-Gradation and setting up additional Oxygen Plant. Putting additional four oven in Met Coke battery-1 to increase production efficiency.
With Introduction of Ductile Iron Pipe Plant Project with Capacity 3,00,000 TPA and
Fe-Si Plant with 5,000 TPA
At
Village:Amona/ Navelim Taluka: Bicholim Dist: North Goa
By
Vedanta Limited (Formerly Sesa Goa Limited)
(Formerly Sesa Industries Limited)
GOA December 2018

Page 2 of 41
CONTENTS
Title Page
1. Executive Summary 3
2. Introduction of the project/ Background information 6
3 Project Description. 17
4. Rehabilitation and Resettlement (R & R) Plan. 37
5. Water & Power requirement 37
6. Land requirement 37
7. Project Schedule 39

Page 3 of 41
A. Executive Summary:
Vedanta Limited (formerly known as Sesa Sterlite Ltd) is India’s only diversified Natural Resources Company. The company’s main businesses focus on zinc, lead, silver, Aluminum, copper, iron ore, oil & gas and commercial power, while its operations span across India, South Africa, Namibia, the Republic of Ireland, Australia, and Liberia. Vedanta Ltd has a portfolio of world-class, low-cost, scaleable assets that consistently generate strong profitability and have robust cash flows. The company holds industry-leading market shares across its core divisions Our Plant is located in village Amona/Navelim, Taluka Bicholim, District North Goa, state Goa, India. It is approximately 25 kms to the east of Panaji city and the nearest domestic airport is Dabolim, Goa about 40 kms from our Plant. A double lane road taking off from Amona to Navelim is running adjacent to the site. The National Highway is approximately 10Kms from the site. We have the following facilities at our Plant;
• Three Blast Furnaces BF#1, BF#2 & BF#3 altogether having Pig Iron production capacity of 832 KTPA
• Battery-I and II having Met Coke Production Capacity of 622 KTPA
• Two number of Waste Heat Recovery Power Plant having generation capacity of 60 MW (2 x 30MW)
1. Identification of Project and Project proponent. Name of Project:
Production Capacity Enhancement in Blast Furnaces 1&2 from 2, 92,000 TPA to 3, 50,000 TPA by Process Optimization along with Production Capacity Enhancement in Blast Furnaces 3 , from 5,40,000 TPA to 6,50,000 TPA through technology Up-Gradation of Existing Furnace and setting up Oxygen Plant, Putting additional four oven in Met Coke battery-1 to increase production efficiency .With Introduction of Ductile Iron Pipe Plant Project with Capacity 3,00,000 TPA and Fe-Si Plant with 5,000 TPA
Category of Project: “A” Category. Project Proponent: Vedanta Limited (Formerly Sesa Industries Ltd / Sesa Goa Limited)
2. Brief description of nature of the project:
a) Production Capacity Enhancement Blast Furnaces 1&2
Mini Blast Furnaces (MBFs), 2 nos. X 173m3 Working Volume were installed and commissioned prior to1994. Provisional No Objection Certificate (NOC) was granted by Goa State Pollution Control Board (GSPCB) vide No.7/63/89-PCB/44 dated 17/04/1989 and final NOC vide No.7/63/89-PCB/878 dated 15/01/1991. GSPCB granted Consent to Operate Pig iron Plant vide No.6/19/92-PCB/617 dated 01/12/1992 under Air (Prevention & Control of Pollution) Act,1981 and Consent to Operate vide No.5/223/91-PCB/768 dated 02/01/1992 under Water(Prevention & Control of Pollution) Act, 1974.Through Process optimization the hot

Page 4 of 41
metal production from BF 1&2 can be increased by additional 58000 TPA, i.e. from 292000 TPA to 350000 TPA . The 173 *2 m3 Blast Furnaces was designed for foundry grade production having around 2% Si, primarily catering to auto industry for different castings manufacturing. Also Ferro silicon prices got affected due to fall in steel market. To reduce cost of production many of the manufacturers have started using semi-foundry or basic grade pig iron having lesser Si% and explored addition of ferro silicon to metal after melting of pig iron in cupola or induction furnaces. Since there was over all shortage of demand and China has started dumping steel in India which was cheaper option for different consumers in India. This resulted in pushing primary steel producers to produce pig iron as there was stiff competition in steel production cost and Indian. Steel producers were not competitive against the imported steel from other countries. This resulted in heavy inventories of pig iron in India. Looking in to the scenario and taking advantage of strategic location where in sea transport is viable option, management has taken decision of exporting basic grade pig iron in big way. Although there was competition from primary steel producers, Goa being very close located to sea and good water bound logistic infrastructure in place was an advantage there by making Sesa / Vedanta compete with big steel manufacturers. Max. around Rs. 40 to 45 Cr. will be required, especially for setting up of Oxygen Plant at BF3 location which will cater the oxygen enrichment of all three furnace for increase in production capacity . The existing twin Blast Furnaces of 173 m3 volume each having Consent to Operate capacity2,92,000 TPA are operating. The production capacity enhancement to 3,50,000 TPA through process optimization could be done without stopping the BF. It will be completed within 6 month of getting EC. This production increase can be achieved through increased injection of wind volume, oxygen enriched blast, charging sinter feed upto 50%, better process control in operations, etc. without any change in Blast Furnace or change of product mix.
Blast Furnace 1 & 2 Production UOM Increase in Production
Increasing wind volume from current level of 30000 Nm3/h to 32000Nm3/h MT
21677
Increasing Fe percentage in burden (iron ore/pellets/sinter) from 56.89% to 58.48% MT 6953
Improving plant OEE from current 90.97 % to 91.97 % MT 3210
Increasing basic grade production MT 10965
Increased by Oxygen enrichment from current level of 0 % to 2 %. MT 6696
Increased by Increase in sinter from 35% to 50%. MT 8701
Total Increase in Production MT 58202
The site is situated within the geographical coordinates BF-1&2
Points Latitude Longitude
A 15° 31’ 37’’ N 73° 59’ 12’’ E
B 15° 31’ 35’’ N 73° 59’ 12’’ E
C 15° 31’ 34’’ N 73° 59’ 10’’ E
D 15° 31’ 37’’ N 73° 59’ 10’’ E
Points Latitude Longitude
A 15° 31’ 40’’ N 73° 59’ 11’’ E
B 15° 31’ 38’’ N 73° 59’ 12’’ E
C 15° 31’ 37’’ N 73° 59’ 09’’ E
D 15° 31’ 40’’ N 73° 59’ 09’’ E

Page 5 of 41
a) 450m3 Blast Furnace-3 Up-gradation
Since commissioning of BF#3 (450 m3) in 2012, Vedanta Limited is operating it successfully and have achieved best average production of around 1400 t per day (monthly average). Off late, due to failure of stave coolers of BF proper, problem in stoves and Sinter plant, production level has come down and repair works has become imperative. To tackle all maintenance concern Vedanta will take shut down of blast furnace and carry out capital repair of BF proper, Stoves and Sinter Plant in 2019. During repair work, Vedanta is also contemplating to increase the hot metal production by capacity enhancement and up gradation of the BF# 3.
Vedanta Limited has also conducted Technical Feasibility study by MECON for capacity enhancement and up gradation of the existing 450 m3 Blast Furnace (BF # 3), providing solution for problem in Stoves and possible modification/ up-gradation of existing Sinter Plant to enhance its current production level .The Feasibility report is attached for reference as Annexure.
The production capacity enhancement to 6,50,000TPA through capacity enhancement of existing facility could be done parallely during BF-3 capital repair. It will be completed within 3 months of getting EC amendment. The site is situated within the geographical coordinates.
Point Latitude Longitude
1 15° 30’ 58’’ N 74° 00’ 08’’ E
2 15° 31’ 02’’ N 74° 00’ 08’’ E
3 15° 31’ 02’’ N 74° 00’ 12’’ E
4 15° 30’ 58’’ N 74° 00’ 12’’ E
This production increase can be achieved by
i) Replacement of old cast iron staves in bosh, belly and lower stack region & fixing of copper staves for better heat utilization. This will increase the working volume, where the major reactions take place in blast furnace.
ii) Increasing wind volume from 80 KNm3/hr to 90 KNm3/hr by replacing all existing tuyere’s with new tuyere’s of 120 mm diameter.
iii) Increasing oxygen enrichment to 8 to 10% from the existing level of 3.1% . iv) Maintaining Hot Blast Temperature to 1100 Degree C by replacing Alumina checker
bricks with silica checker bricks for 6-7 mts height in Hot Blast stoves.
v) Improving Fe% in Iron bearing material, currently Iron bearing material feed in blast furnace is having Fe % ~57-58% which will be increased to 61 %.
Blast Furnace Up-gradation UOM Increase in Production
Replacement of cast Iron staves with copper staves due to volume increase MT 19000
By Increasing wind volume from 80 K to 90 KNm3/hr MT 55000
Increasing oxygen enrichment by 8-10% MT 56000
Increasing Fe% in Iron Ore from 58% to 61 % MT 20000
Total Increase in Production MT 150000
By implementing above mentioned initiatives Production will increase from current production level of 500000 MT to 650000 MT.
Page 6 of 41
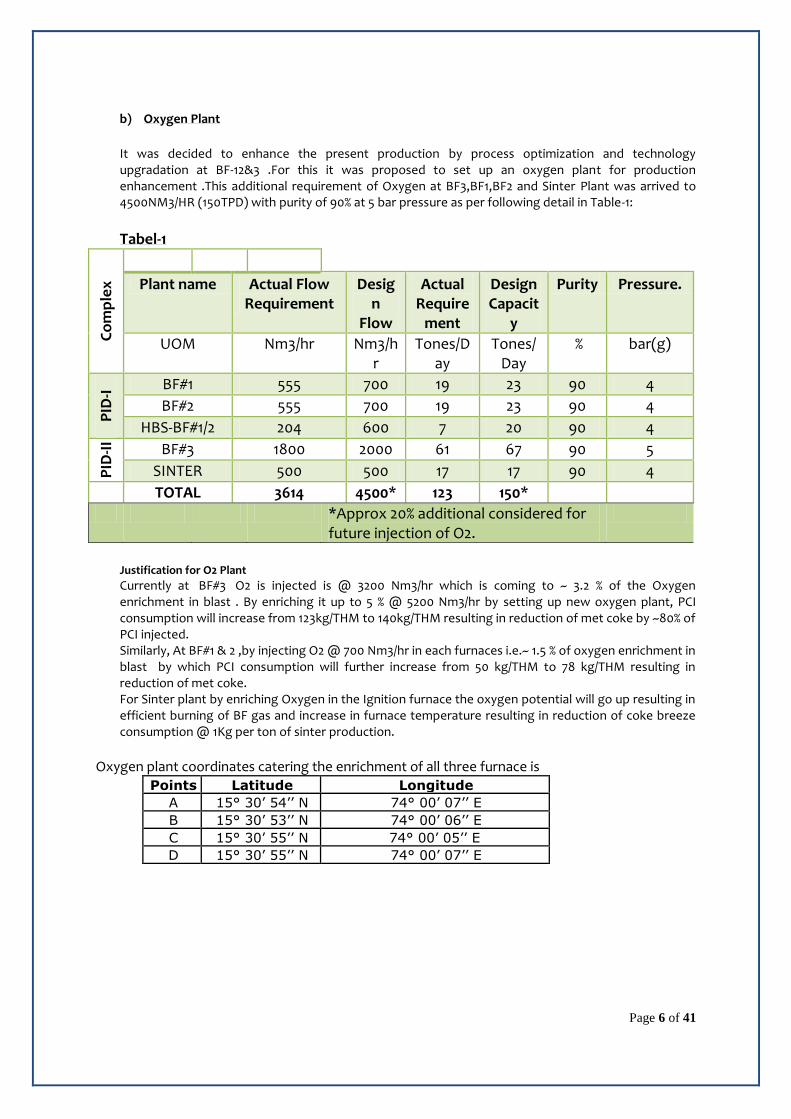
b) Oxygen Plant
It was decided to enhance the present production by process optimization and technology upgradation at BF-12&3 .For this it was proposed to set up an oxygen plant for production enhancement .This additional requirement of Oxygen at BF3,BF1,BF2 and Sinter Plant was arrived to 4500NM3/HR (150TPD) with purity of 90% at 5 bar pressure as per following detail in Table-1:
Tabel-1
Co
mp
lex
Plant name Actual Flow Requirement
Design
Flow
Actual Require
ment
Design Capacit
y
Purity Pressure.
UOM Nm3/hr Nm3/hr
Tones/Day
Tones/Day
% bar(g)
PID
-I BF#1 555 700 19 23 90 4
BF#2 555 700 19 23 90 4
HBS-BF#1/2 204 600 7 20 90 4
PID
-II
BF#3 1800 2000 61 67 90 5
SINTER 500 500 17 17 90 4
TOTAL 3614 4500* 123 150*
*Approx 20% additional considered for future injection of O2.
Justification for O2 Plant
Currently at BF#3 O2 is injected is @ 3200 Nm3/hr which is coming to ~ 3.2 % of the Oxygen enrichment in blast . By enriching it up to 5 % @ 5200 Nm3/hr by setting up new oxygen plant, PCI consumption will increase from 123kg/THM to 140kg/THM resulting in reduction of met coke by ~80% of PCI injected. Similarly, At BF#1 & 2 ,by injecting O2 @ 700 Nm3/hr in each furnaces i.e.~ 1.5 % of oxygen enrichment in blast by which PCI consumption will further increase from 50 kg/THM to 78 kg/THM resulting in reduction of met coke. For Sinter plant by enriching Oxygen in the Ignition furnace the oxygen potential will go up resulting in efficient burning of BF gas and increase in furnace temperature resulting in reduction of coke breeze consumption @ 1Kg per ton of sinter production.
Oxygen plant coordinates catering the enrichment of all three furnace is
Points Latitude Longitude
A 15° 30’ 54’’ N 74° 00’ 07’’ E
B 15° 30’ 53’’ N 74° 00’ 06’’ E
C 15° 30’ 55’’ N 74° 00’ 05’’ E
D 15° 30’ 55’’ N 74° 00’ 07’’ E

Page 7 of 41
C) Ductile Iron Pipe Plant
We proposed to set up DI Pipe Plant of capacity 0.30MTPA in 18months time. The location of Plant is very adjacent to BF#3 in Pig Iron Plant-II premises, having area 200 x400M (19.76acres) including area for storage of finished products.
The site is situated within the geographical coordinates.
Points Latitude Longitude
A 15° 30’ 52.89’’ N 74° 00’ 09.47’’ E
B 15° 30’ 55.70’’ N 74° 00’ 15.40’’ E
C 15° 30’ 44.75’’ N 74° 00’ 22.70’’ E
D 15° 30’ 42.10’’ N 74° 00’ 16.87’’ E
It is in the terrain which is having a slope from 40m to 10m and proposed to put the plant at FGL of 25 m to optimise the cutting and filling of rocks. Total water requirement will be 1200m3/day and the source of water is from Bandara which is about 10km away from the Plant and connected with the pipeline. Make-up water will be drawn from Bandara & stored in raw water sump. The permission to draw the water upto 6000m3/day from Bandara has already been granted by GWRD-Goa government. DI Pipe Plant will require about 16 MW of power to operate the Electric/induction furnaces, casting machines and other equipment. Required power will be sourced internally from our 2*30MW heat recovery Power Plant.Pig iron received from BF#3 will be re-melted into electric arc furnace/induction furnace/cupola or hot metal will be directly used and proceed further for desulphurisation, scrap charging etc, rail track will be laid from BF#3 to DI pipe plant for hot metal transportation for better realisation and power saving. Manufacturing of DI pipe is a continuous sequential process involving several sub-processes. The process starts with receipt of Pig Iron/hot metal/scrap, melting into induction/electric arc furnace, desulphurisation, scrap charging and super heating of molten metal in induction furnace. The process flow chart for production of DI Pipe is given below.
D) Fe-Si Plant Fe-Si is used for production of few grades of Pig Iron, for which annually~4900T of Fe-Si is consumed. Since power cost constituent is around 50 % of the total cost of production of Fe-Si, it is economical to produce Ferro Silicon if the in-house power generated from the waste heat can be utilized. Fe – Si, for captive consumption definitely reduce COP of pig Iron on account of own power availability. Considering above advantages it is intend to set up a ~4950 TPA Ferro Silicon Plant existing premises of Pig Iron unit 2 .The site is situated within the geographical coordinates
Point Latitude Longitude
1 15° 31’ 00’’ N 74° 00’ 19’’ E
2 15° 31’ 00’’ N 74° 00’ 17’’ E
3 15° 31’ 04’’ N 74° 00’ 17’’ E
4 15° 31’ 04’’ N 74° 00’ 19’’ E
E) MCD Battery-1
Met coke unit of Vedanta comprises of 2 Coke oven batteries i.e. Battery #1 with 84 Ovens & Battery#2 with 72 Ovens, commissioned/reconstructed in the year 1998 & 2012 respectively. Theoretical rated production capacity is 261’000 x 2 = 522’000 MTPA @ 98% Plant availability( Best achieved 500’000 MTPA 2015). The normal useful life of these ovens/refractory as per industry experts is 20 years, including oven foundation repair. MCD B1 Ovens are 18 years old & every 5-6 years we have started encountering major repairs, resulting in production loss due to

Page 8 of 41
lower oven availability . Due to aging effect in Battery 1, in last 3-5 years frequency of oven repairs has increased to almost 15-18 ovens per year. Consequently B#1 gross coke production is at 95% of rated production levels i.e. @ 250000 MTPA in last 5 years. With the various debottlenecking projects carried out and in pipeline in PID , Pig Iron production is ramping up Y-O-Y. We have already procured BF coke to the tune of 8000 MT & 10000 MT and with proposed increase in Pig iron production coke requirement will further increase. Looking at aging of ovens, ramping up of Pig Iron production capacity & market demand, propose to put up additional 4 ovens at battery-1 by keeping production within the approved limit.
(i) Need of Project and Importance to the Country or Region:
a) Production Capacity Enhancement of Blast furnace (1&2) The existing BF1/2 produces foundry grade pig iron for automobile sector. Hot metal is tapped into ladle and poured in the Pig Casting Machine. Productivity rate of foundry grade pig iron using BF is low as compared to productivity of basic grade pig iron using the same blast furnace. This is mainly because of strict process control requirement in making foundry grade pig iron. Enhancing Energy Efficiency in Industries, is one of the key agenda of India’s Intended Nationally Determined Contribution during United Nations Climate Change Conference, at Paris, 2015. In line with same, we are proposing to have energy efficient blower system, which will increase wind volume injection to the Blast Furnaces at the existing power consumption. Due to increase wind volume injection there will be default increase in production from Blast Furnaces. Charging good quality iron ore will lead to increase in production but at the same time coke consumption and slag generation will come down, which is a positive impact on the environment. b) Blast furnace-3 Up-gradation
The existing BF-3 produces foundry grade pig iron for automobile sector. Hot metal is tapped into ladle and poured in the Pig Casting Machine. Productivity rate of foundry grade pig iron using BF is low as compared to productivity of basic grade pig iron using the same blast furnace. This is mainly because of strict process control requirement in making foundry grade pig iron. The automobile sector is experiencing slowdown in India as well as in other countries. Therefore the sale price of foundry grade pig iron is low thereby affecting the sustainability / economic viability of the project. Presently China started dumping low cost foundry grade pig iron in India and other international market. The cost of production of foundry grade pig iron by Chinese suppliers is lower than Indian Producers. In order to remain competitive in the domestic as well as international market, Vedanta Limited decided to increase the volume of production by technological up gradation in the existing blast furnace.This will make the project sustainable, profitable and socially viable. The general product will meet the demand of India as well as international market. c) Ductile Iron Pipe
Economic Growth
Indian economy is likely to grow in the range of 6.3 to 6.9 per cent in 2017-18 and the outlook is very positive. The average consumer spending has increased significantly

Page 9 of 41
which has fuelled demand for quality infrastructure services like roads, electric power, transportation, water supply, sanitation, communication, etc.
Demand for pipes for supplying Water Water is a precious resource in India because the country accounts for 16% of the world population as against just 4% of global water resources. The water use efficiency is low in the country compared to international standards. As in the previous years, agriculture will continue to be the major demand segment for water in India. However, the demand from industries is expected to grow faster than the demand from agriculture and domestic sectors. It is understood that the use of water in Indian industries is high due to a combination of factors such as obsolete process technology, poor recycling and reuse practices, and poor wastewater treatment. Use of water in industries is closely linked to the economy of a country. The major water guzzling industries are pulp and paper units, thermal power plants, fertilizer units, iron and steel plants, sugar plants, and textile units. Estimates vary with respect to the requirement of water for industries. According to the MoWR, the requirement will increase from 30 billion cubic metre in 2000 to 120 billion cubic metre by 2025. According to the World Bank, the water demand for industrial uses and energy production will touch 228 billion cubic meter by 2025. As per the Tenth Plan, the stipulated norms are 40 litres per capita per day (lpcd) of safe drinking water within a walking distance of 1.6 km and at least 1 hand pump for every 250 persons. The norm will be relaxed to 55 lpcd in states where the 40-lpcd norm has been achieved already. The above-mentioned norms are quite reasonable because it is reported that in many large cities, water withdrawal amounts to 300 to 600 lpcd. In contrast, the consumption in the developed countries of Europe and North America had already touched 500-1000 lpcd by the turn of the last century. Water demand projection varies from agency to agency. Consumption of water by 2020 in different sectors as projected by Water Resources Division, Planning Commission is given below.
Projected Water Consumption in 2020 (Billion cubic metres)
End Use Normal Pessimistic
Irrigation 640 602
Manufacturing 56 51
Domestic 57 57
Power 28 27
Total 781 737
According to a WHO-UNICEF Sponsored Study (India Assessment 2002-Water Supply & Sanitation), the total water requirement by 2050 will be 1,422 billion cubic metre. Tata Energy Research Institute (TERI) has estimated that the overall water demand will virtually double from 564 billion cubic metres in 1997 to 1,048 billion cubic metre in 2047. MoWR has assessed the water requirement at 694 cubic km in 2010, 784 cubic km in 2025, and 973 cubic km in 2050. As against the projected demand, the availability of water in 2050 is estimated at 996 cubic km. At the national level, it will be a difficult to increase the availability to the projected levels as most of the water resources are concentrated in a few river basins. Transporting huge

Page 10 of 41
quantity of water from like rivers, lakes, wells, and treatment plants to millions of homes would require a reliable pipeline system that will serve for years without leaks and contamination. The increase in demand for water will call for enormous efforts to capture, preserve, and distribute available water equitably. Urbanization It is estimated that by the end of the 12th Plan in 2017, approximately 40% of the country’s population will live in cities and towns. This fast pace of urbanization will increase the demand for piped water supply. Thus, the increase in population accompanied by the fast pace of urbanization will together contribute for the growth in demand for pipes. Improvement in Water and Sanitation Coverage of Government to provide drinking water & sanitation to100% of the population: Thrust of government to provide drinking water & sanitation to100% of the population. Government’s focus to improve the urban infrastructure has increased significantly during the last 10 years. The investment allocation to water supply & sanitation during five year plan is INR 423 Bn.
• The year wise fund allocation growth rate in this five year plan is 21% which is higher than the year wise growth rate of 15% during last five year plan • The JNNURM scheme commenced during the five year plan is the main driver for urban infrastructure development. JNNURM scheme is focused towards strengthen the infrastructure in 63 cities, the other schemes UIDSSMT & AUWSP focuses on other cities/towns • Water PPP’s have emerged during the last 10 years & are fairly successful in India;
the central Government has planned to increase the number of PPP projects in-order to support state water authorities in improving the system efficiency
• The depletion of fresh water sources is driving the need of desalination projects & these projects are expected to drive the growth of urban water infrastructure in the coming years. The desalination projects are being planned & ongoing in certain coastal cities
Source: JNNURM Website & Frost & Sullivan Primary Research & Analysis Demand Analysis for DI Pipes The demand drivers for pipes in general and DI pipes in particular are:
Economic growth
Demand for water
Urbanization
Improvement in water supply and sanitation coverage
Awareness on safety and hygiene
Investment by the Central and State Governments in Water and Sanitation schemes
Assistance from external agencies
Page 11 of 41
Inter-linking of rivers
Export potential
Investment in Water Projects and Role of Government Bodies The central government had given thrust to improve the urban infrastructure during the last 10 years and have been implementing various programs & schemes in the WSS sector. Apart from the state governments also funds & undertake various schemes. The funds for certain WSS projects are pooled from international banks & financial institutions (World Bank, JICA, ADB etc. Key WSS Programs in India JNNURM (Jawaharlal Nehru National Urban Renewal Mission) UIDSSMT (Urban Infrastructure Development Scheme for Small and Medium Towns) AUWSP (Accelerated Urban Water Supply Programme) Program Description
Flagship program for improving urban infrastructure
Focuses on 63 mission cities
Program covers the cities & towns which are not covered under JNNURM
Focuses on improvement on urban infrastructure facilities & PPP projects
Aimed at extending WSS services in smaller cities & towns
Partly funded by central government & partly by state government/municipal bodies Government/municipal bodies: It is estimated that at the current rate of growth, in about two decades, water demand in India and China together will be thrice the world’s current consumption. Budgetary outlay for Indian government’s 12th 5-yr plan 2012-17 for water supply and sanitation is more than Rs. 255,310 crores which is significantly higher than previous plan. Increasing investment of government in water and sanitation projects, the main driver for DI pipe demand is evident from the figure below. External Aid Water resources projects in India are supported by multilateral or bilateral aid, grants, loans, and commodity aid from foreign countries as well as donor agencies such as the International Bank of Reconstruction and Development (IBRD) commonly known as the World Bank. During 2013, the Sian Development Bank has sanctioned projects worth Rs 8800 crores for projects to improve drinking water and sanitation in major cities like Delhi and Kolkata along with projects in Rajasthan. The National Ganga River Basin Authority (NGBRA) has received one Billion USD financing from the World Bank. The Ministry of Water Resources, Government of India assists the state governments in tying up external assistance from different funding agencies to fill up the resource gaps. Water resources projects have also been funded through bilateral support of France, Australia, Canada, Germany, and the Netherlands Industry Analysis While the purchase of pipes in general has increased, the share of DI pipes in the total purchase of pipes has increased significantly from 33% to 52%. The share of other pipes has been either declining or stagnant. The plastic pipes used are predominantly PVC pipes

Page 12 of 41
and recent increase in use of HDPE pipes in competition for PVC pipes. The other pipes include GRP, BWSCC pipes, Hume pipes, stoneware pipes, etc. GRP pipes, RCC pipes, and stoneware pipes are used predominantly in sewerage applications. The increasing share of DI pipes obviously indicates its rising acceptance by customers and its growing popularity. The increasing share of DI pipes indicates that DI pipes are gradually replacing all other pipes, especially steel pipes. The government bodies have virtually stopped purchase of CI pipes for potable water supply and the existing CI pipelines are increasingly being replaced by DI pipes. Plastic pipes and cement pipes (AC/RCC/PSC) are also being replaced in urban and semi-urban areas; however, in rural water supply schemes they still exist due to the low initial investment. Preference of Pipe Materials The choice of the pipe material, on technical grounds, is governed by two major factors: the pipe diameter and the area of application, i.e., transmission or distribution. The general preference of pipe materials for water supply projects are available in three different diameter ranges and used in urban, semi-urban, and rural areas. DI pipes are widely preferred in urban and semi-urban areas. In urban and semi-urban areas, uncovered water is considered unsafe and it is mandatory to provide piped water supply to prevent pollution and contamination of drinking water. Moreover, in the urban and semi-urban areas, DI pipes are preferred because they are the best suited in places where heavy traffic loads, digging for cable laying and bridges/flyover, etc. are quite common. In diameter sizes above 600 mm, MS pipes are preferred because the initial investment is less as compared to that of DI pipes. DI pipes are preferred in the lower diameter sizes, for both high-pressure transmission and low-pressure distribution system. However, the users are increasingly considering the life cycle cost (LCC) rather than just the initial investment because this factor is being focused in tender evaluation as well. The government departments and organizations are well aware of the long-term economic benefits of using DI pipes in water supply and sanitation projects. Inter Linking of Rivers (ILR) Project Inter Linking of Rivers (ILR) project is Government of India’s proposal to link 37 rivers through 30 links, dozens of large dams and thousands of miles of canals, making it the largest water project in the world. Once this project is set in motion, there will be an unprecedented demand for not only DI pipes and fittings, but also services for design, implementation, project management, and maintenance. Export Potential Total global DI pipe production is about 5.4 million TPA, out of which dependence on import by various countries is about 500,000 TPA. Export ratio is 10 – 40%. Middle East and Asia is everybody’s target. Low domestic capacity and production has been the major constraint that inhibited exports of DI pipes from India. India has the competitive advantage of being strategically located to cater to Asian, South Asian, and Middle East countries. The Middle East is a very prospective region for DI pipes because being water scarce, as the countries in the Middle East give special focus on water supply and sanitation. During the last four years, India exported DI pipes to as many as 37 countries of which the regular destinations have been Algeria, Brunei, Hong Kong, Qatar, Singapore, Spain, Sri Lanka, Sultanate of Oman, and UK. Thus, DI pipes will continue to be in good demand in these countries in the forthcoming years as well.
Page 13 of 41
Domestic Manufacturers of DI pipe There are three major units engaged in the manufacture of DI pipes in India
I Electrosteel Castings Ltd. (ECL);
ii Electrosteel Steels Lts (ESL)
iii Jindal Saw Ltd. (JSL).
iv Tata Metalliks DI Pipes Ltd (TMDIPL)
v Lanco (Srikalahasthi Pipe Ltd) SPL
vi Electrotherm (ET)
vii Jai Balaji Group (JB Group)
viii Rashmi Metaliks (RML)
Electrosteel and Jindal Saw are the market leaders in the domestic market. The total installed capacity (as on June 2015) is around 1.72 MT (Million Tonne). However due to non operation of plants of M/s Electrotherm & M/s Rashmi Metaliks, the actual capacity was 1.42 MT only. There is an addition of capacity in the current FY 2014-15 by year of 0.3 MT The average capacity utilization is around 60%, which may go up to 70% during 2016-17 and he production is likely to go up to 1.70 MT during 2016-17
d) Fe-Si Plant
Fe-Si is used for production of few grades of Pig Iron , for which annually~4900T of Fe-Si is consumed. At present Fe-Si is procured from plants located in Andhra Pradesh involving high transportation cost. They are facing challenge of timely delivery of material in plant affecting production run of desired grade as per plan. Also the cost of Ferro silicon is rising day by day.The manufacture of Ferro Silicon is highly power-intensive and therefore the cost of power is critical to the competitiveness of the producers. On an average 50 per cent of the total cost per tonne of Ferro Silicon is accounted for by power. Around 9000 to 9500 kWh are required to produce one tonne of Ferro Silicon of 72-75 % Si grade. This works out to around 45%- 50% as power cost for the cost of production of Fe – Si.Since power cost constituent is around 50 % of the total cost of production, it is economical to produce Ferro Silicon if the in-house power generated from the waste heat can be utilized. Vedanta presently have a 60 MW WHRB power plant, currently generating @ of 56- 57 MW. Around 50% of this generated power is consumed for captive purpose & balance is sold to grid. As per the contractual obligation they do not have permission to sell in open access but can consume as much as required for captive consumption. Hence there exist a synergy for setting up power intensive plant of Fe – Si, for captive consumption which will eliminate market dependency & definitely reduce COP of pig Iron on account of own power availability. Also the cost of procurement of Ferro Silicon from the open market will be reduced considerably due to in house production of Ferro Silicon.

Page 14 of 41
Considering above multifarious advantages ,intend to set up a ~4950 TPA Ferro Silicon Plant at Amona within existing premises of Pig Iron unit 2 in state of Goa, India.
e) Pig Iron production is ramping up Year on year and presently we are procuring the met coke from outside even after having technology and facility . With increasing price and growing demand for met coke it is proposed to put up additional 4 ovens at battery-1 and 20 ovens at battery-2.
(ii) Demand – Supply Gap:
a) Production Capacity Enhancement of Blast furnace (1&2)
Incremental maximum 58000 Tonnes/year pig iron produced will be either sold in the local market or exported through Marmugoa Port Trust.
b) Blast furnace-3 Up-gradation
The automobile sector is experiencing slowdown in India as well as in other countries. Therefore the demand of foundry grade pig iron for use in automobile sector has reduced. Presently China started dumping low cost foundry grade pig iron in India and other international market. In order to remain sustainable, profitable and socially viable, the company to increase volume of pig iron production by technological advancement in existing Facility. The demand of general grade pig iron at competitive cost exists in the domestic and international market.
c) Ductile Iron Pipe
Based on past records, the demand for DI pipes used in a large way for the transportation of water is expected to grow by 15 to 20 % year on year. The various demand projections studies made by different national and international institutions/organizations have estimated the demand of DI Pipes to increasing rapidly. Considering the present producers of Ductile Iron pipe plants in India, their current production trends and known capacity expansion being planned, the demand supply gap of DI pipes for next 11 years is shown below in Table-1.
Table-1 Demand of Ductile Iron Pipes in India (At 14 % CAGR)
Year
Demand
in million
tonnes
Capacity**
Production
at Present
Trend
Gap (MT) vis-à-
vis present
production
trend
Gap w.r.t 100
% production
at Rated
Capacity
Remarks
2014 1.20 1.115 0.7 0.50 0.09
2015 1.37 1.315 0.9 0.47 0.05 JS Cap Addition
2016 1.56 1.505 1.06 0.50 0.05 TMDIP Cap Add
2017 1.78 1.505 1.36 0.42 0.27

Page 15 of 41
Year
Demand
in million
tonnes
Capacity**
Production
at Present
Trend
Gap (MT) vis-à-
vis present
production
trend
Gap w.r.t 100
% production
at Rated
Capacity
Remarks
2018 2.03 1.505 1.66 0.37 0.52
2019 2.31 1.505 1.96 0.35 0.81
2020 2.63 1.505 2.26 0.37 1.13
2021 3.03 1.505 2.56 0.47 1.52
2022 3.48 1.505 2.86 0.62 1.98
2023 4.01 1.505 3.16 0.85 2.50
2024 4.61 1.505 3.46 1.15 3.10
2025 5.30 1.505 3.76 1.54 3.79
(iii) Imports Vs Indigenous production: a) Production Capacity Enhancement of Blast furnace (1&2)
With Make in India concept, Goan iron ore is charged in Mini Blast
Furnaces, to the tune of 85-90%. This pig iron produced is generally
sold in Indian Foundry or steel market.
b) Blast Furnace-3 Up-gradation
The cost of production of foundry grade pig iron by Indian Producers is more than its counterparts in China. The Indian Government is not considering any additional import duty to be levied on steel/scrap imported into India. c) Ductile Iron Pipe
With Make in India concept and accelerated growth potential of Indian economy, utilising existing natural resources to produce hot metal and convert into Value Added Products such as Ductile Iron Pipes is better option than spending Foreign Exchange on import of Ductile Iron pipes.
(iv) Export Possibility:
The project is located close to Major Port. This will enhance the export chance by remaining cost competitive. There is a big potential for export of D.I. spun pipe especially to the Eastern Europe. South America, Africa, Africa, South East Asia and other ASEAN & SARC countries apart from traditional exporting countries of Middle East & Western Europe
(v) Domestic / Export Markets: Railway line exists till Madgaon in Goa. This will make the product competitive in domestic market like Maharashtra and Karnataka.

Page 16 of 41
The project is located close to Major Port. This will enhance the export chance by remaining cost competitive. Based on past records, the demand for DI pipes used in a large way for the transportation of water is expected to grow by 15 to 20 % year on year. The various demand projections studies made by different national and international institutions/organizations have estimated the demand .of DI Pipes to increasing rapidly. The demand of Ductile Iron pipe is directly proportional to the investment made in Water, Sanitation, Irrigation and waste water treatment by all the concerned agencies of Central Government, State Government, Municipal Corporations, Local Bodies, Private bodies, and international banks & agencies.
2 Project Description With Process Details:
Process Description Blast Furnace: There are three Blast furnace of which BF1 and BF2 one being the mirror image of other with 173m3 capacity and BF3 WITH 450M3 capacity. Transportation of raw material from storage yard to the stock house is done by closed belt conveyors. The raw materials are distributed into the respective bunkers through shuttle conveyors located at the top of the stock house bunkers. All materials, stored in different weigh hoppers is charged sequentially into collecting conveyors which is discharged into common charging conveyor which in turn feed the material to the blast furnace top charging equipment. The hot blast stoves are designed for a blast temperature of 1150°C. Combustion air is pre-heated by heat recovery system using exhaust gas from the stoves.
A blast furnace (BF) is an enclosed vertical furnace into which the raw materials enter at the top, while the products (molten iron and slag) are tapped from the bottom (the hearth).The raw material mixture of iron bearing materials (iron ore lump and sinter) and additives (slag former, such as limestone) is called the “burden”. The burden and coke are fed into the top of the furnace via a sealed charging system to prevent furnace gases from escaping. Coke reduces iron ore to iron and also supplies heat. Iron ore gets converted to iron and impurities are converted to slag. The solid burden moves downwards, counter current of a rising stream of hot reducing gas. The hot reducing gas is provided by hot stoves and is needed to transfer heat to the solid burden in order to raise the temperature for reaction. The BF gas with residual calorific value is collected from the top of the furnace for treatment and use.
The blast furnace is periodically tapped to remove the hot metal iron and slag from the hearth. For this purpose a tap-hole is opened in the side wall of the hearth. The tapped metal has a temperature of approximately 1440-1500 °C. The slag and hot metal from the furnace flows along the refractory or low cement covered runners and they are subsequently separated at the skimmer in the cast house, after which each continues in a separate runner. Liquid Hot metal is poured into ladles cars. Slag flows in runners to a granulation plant. At the end of casting cycle, the tap hole is closed by injecting a heat resistant tap hole clay mixture, using a so-called “mudgun”. Blast furnace gas is reused as fuel in the blast furnace stoves. The molten iron is converted to pigs in Pig Casting Machine.

Page 17 of 41
Process Flow Chart of Blast Furnace:
Production Capacity Enhancement Detail
a) Capacity Enhancement of Blast furnace (1&2)
With in-house experience in operating the blast furnace and experience gathered from similar blast furnaces (Uttam Galva, Jindal Steel, etc), it has been confirmed that the hot metal production can go upto 3,50,000 TPA.This production increase can be achieved through increased injection of wind volume, oxygen enriched blast, charging high Fe sinter feed upto 50% and better process control in operations (without any change in Blast Furnace – physical expansion or change of product mix). Only Oxygen Plant will be additional installation.
It is possible to enhance the productivity of existing blast furnace in six steps, described below:
Production enhancement from 2,92,000 TPA to 313677 TPA can be increased after increasing wind volume from current level of 30000 Nm3/h to 32000Nm3/h.
Production enhancement from 313677 TPA to 320630 TPA can be increased after increasing Fe percentage in burden (iron ore/pellets/sinter) from 56.89% to 58.48%.
Production from 320630 TPA to 323840 TPA can be increased after improving plant OEE from current 90.97 % to 91.97 % (OEE can be increased upto 97%)
Production from 323840 TPA to 334805 TPA can be increased by producing basic grade. (from 230000 TPA to 240965 TPA).
Production from 334805 TPA to 341501 TPA can be increased by Oxygen enrichment from current level of 0 % to 2 %.
Production from 341501 TPA to 350202 TPA can be increased by Increase in sinter from 35% to 50%.
Pollution control devices are capable enough to handle this additional production level and there will be no impact on environment on this account.Blower which is main equipment decisive for augmenting the production level will be made energy efficient by change of impeller without changing the motor.
The Fe balance of the existing blast furnace (production: 2,92,000 TPA) and that of blast furnace producing 3,50,000 TPA metal is shown in two different figure below.

Page 18 of 41
b) Blast Furnace-3 Up-Gradation
Existing BF was commissioned in 2012 and since then it is under operation. However the performance of the BF has deteriorated because of failed stave coolers in MBF and lower HBT.
The relining of the BF is scheduled in April 2019. During relining Vedanta Ltd. contemplates to
upgrade Blast Furnace # 3 with capacity enhancement to achieve target production of ≈1850tpd
hot metal with maximum utilization of existing equipment’s & facilities. In order to ascertain technical feasibility and required repair schedule for blast furnace capacity augmentation and technology up-gradation, MECON has done a feasibility study.
Following assumptions were taken in to account.
i. Enhancement of BF volume and strengthening of BF cooling system is planned keeping existing BF shell intact.
ii. Improving stove performance without altering basic original design features.
iii. Cooling system is proposed soft water based in closed circuit for trouble free operation.
Blast Furnace Proper:-The technological up gradation of BF3 by changing refractory lining and using a mixture of copper plate coolers/ copper staves and SG iron staves as per the expected heat load of BF will increase the working volume , where the major reactions take place in blast furnace. By carrying out the following modification there will
be increase in Pig iron production to ≈ 1850tpd.
Blast Furnace Design Parameters:-
Cooling Members:-
Hot Blast Stove:- Maintaining Hot Blast Temperature to 1100 Degree C by replacing Alumina checker bricks with silica checker bricks for 6-7 mts height in Hot Blast stoves.
Wind Volume:-Increasing wind volume from 80 KNm3/hr to 90 KNm3/hr by replacing all existing tuyere’s with new tuyere’s of 120 mm diameter will enhance the reaction rate resulting increase in production.
Gas Cleaning Plant:-To meet the increased generation of blast furnace gas theoretically one additional GCP silo is required. However, for better reliability of the GCP system and to provide sufficient time for maintenance of the bags in any eventualities, two additional silos have been envisaged to be installed. Modification & rerouting of raw BF gas duct from dust catcher to GCP has been envisaged.

Page 19 of 41
Water Systems:-It is proposed to set-up a soft water close loop water circuit for cooling members of BF. Current Open loop industrial water circuit is to be demolished. However pumps and cooling tower can be utilized.
Oxygen Enrichment in BF:- Increasing oxygen enrichment to 8-10% from the existing level of 3.1%.
No modification will be implemented in cast house & we are having a robust de-dusting system in cast
house which is well sufficient to take care of Increase in production.
No modification will be implemented in stock house & existing facility of de-dusting at stock house is well sufficient to take care of increase in production.
There is no change in source of water.The consumptive water after enhancement of production will increase by 800KLD There is no change in source of power. Power requirement for BF and the entire project shall be met from the 30 MW CPP
Note:-Technical Feasibility Report for capacity enhancement and technology up-gradation of existing 450m3 Blast Furnace and 75m2 Sinter plant by M/S MECON Limited is attached for reference
LIST OF RAW MATERIALS AND MATERIAL BALANCE FOR BF1,2&3
S. No Material Unit BF1 & 2 BF3 Total
Existing Proposed Existing Proposed Existing Proposed
INPUT
1 Iron Ore Fines For
Sinter Tons 182041 320882 693105 834293 875146 1155175
2 Iron Ore Lumps Tons 350717 332880 308152 370924 658870 703804
3 Coke Tons 193838 223404 298620 349462 492458 572867
4 PCI Tons 6243 17500 49982 78000 56225 95500
5 Limestone Tons 35420 52378 72495 87262 107915 139640
6 Dolomite Tons 32289 45856 57712 69468 90001 115324
7 Quartzite Tons 13658 16371 12696 15282 26354 31653
8 Quick Lime Tons 3996 7044 15215 18314 19211 25358
9 Coke Breeze Tons 11846 20881 45102 54290 56948 75170
Total Tons 830049 1037196 1553079 1877295 2306969 2813963
S. No OUTPUT
1 Hot Metal Production Tons 292000 350000 540000 650000 832000 1000000
2 Slag Tons 114529 143889 229800 288889 344329 432778
3 Dust & Sludge Loss Tons 8760 10500 16200 19500 24960 30000
4 LOI, BF Gas, Losses etc Tons 414760 532808 767079 918906 1105680 1351185
Total Tons 830049 1037196 1553079 1877295 2306969 2813963
c) Oxygen Plant
Process Descriptions: Oxygen capacity – 4500Nm3/hr flow @ 90 % purity.

Page 20 of 41
Air compression and pre-cooling system: Air for this unit is drawn into the plant through an air suction filter to remove dust, dirt and other particles that may be suspended in the air stream. The air is then compressed in a roots blower. The compressed air from the blower is cooled in a water cooled heat exchanger before sending to adsorber system. Molecular sieve adsorber system: The cooled air at a temperature of around 30 deg C is then passed to Molecular sieve adsorber vessels. The adsorption process is described in detail as under ADSORPTION - Water and carbon dioxide are adsorbed preferentially in the inlet zone of the adsorbers. Nitrogen is adsorbed in main zone resulting in oxygen flowing from the adsorber outlet to the buffer vessel. DESORPTION - Following the adsorption phase, the charged adsorber is regenerated by depressurization and evacuation. Water, carbon dioxide and nitrogen are drawn out in the opposite direction to the adsorption mode with a dry-type vacuum pump. The so called waste gas is directed to the atmosphere through a silencer system. RE-PRESSURISATION - After the desorption step the re-pressurization will be started by pressure equalization between the two adsorbers. Dry gas from the pressurized adsorber will flow to the adsorber which is under vacuum. Further pressure build-up will be done with process air from the Process Air Blower Unit. SUMMARY : Each of the adsorbers undergoes the following phases in cycles: - adsorption (O2 production) - desorption (evacuation) -re-pressurization(pressure build-up)- The cycles are automatically controlled through PLC system.
Figure 1: Vacuum Pressure Swing Adsorption (VPSA).

Page 21 of 41
Schematic diagram:
Product compression system Gaseous Oxygen withdrawn from the adsorber is stored in a buffer vessel before being compressed to desired pressure. The product gaseous oxygen at a pressure to near atmospheric is compressed in a compressor. The purity of the gaseous oxygen is monitored with the help of an oxygen analyzer. The low pressure is compressed externally in a reciprocating oxygen compressor to deliver oxygen at specified pressures and flow rates at Furnace. Product distribution The compressed oxygen shall be supplied to various end users ( BF1,2 &3 etc) through oxygen pipelines to be laid on existing pipe supports. Additional Power Requirement: Around 2.0 MWh electrical energy will be required and same will be sourced from own Waste Heat Recovery Boiler based Power Plants. Thus no power is required from Government. Additional Water: Around 120 m3/day water for cooling will be required. Same will be met through existing quantity as mentioned in the Consent. There will be no discharge of liquid effluent as cooling water will be reused after circulation through existing cooling towers or CT blow down shall be utilized at Blast furnace granulation purpose. Solid Waste: No solid waste will be generated.

Page 22 of 41
Details of oxygen consumption at different location from New & Old Oxygen Plant
d) Ductile Iron Pipe Plant
Manufacturing Process
The manufacturing process of DI pipe is a continuous sequential process involving several sub-processes. The process starts with receipt, desulphurization, scrap charging and super heating of molten metal in induction furnace; pipes are centrifugally cast using molten metal; heat treatment follows in annealing furnace to give ductility to the pipes cast; lining and coatings are carried out to manufacture finished pipes. A schematic process flow diagram is given in Figure-1. Desulphurization Sulphur content in the molten metal from Mini Blast Furnace (MBF) is reduced to a level of 0.02 % as low sulphur level is a prerequisite for magnesium treatment. Scrap Addition & Super Heating Desulphurized molten metal is poured in the induction furnace. Scrap and Ferro Alloys are added to arrive at the required chemical composition. Metal is super heated to the desired pouring temperature. Magnesium Treatment Magnesium is introduced in the molten metal to change the shape of the graphite after solidification. Magnesium converts the flake shaped graphite to a nodular shape. The nodular shape of graphite leads to better mechanical properties of ductile iron.

Page 23 of 41
Centrifugal Casting Pipes are cast by continuously pouring liquid metal in rotating, water-cooled, metallic moulds fitted in the spinning machine. Metal is poured at a fixed rate from the holding hopper on to the rotating moulds. Pipes get their extended hollow cylindrical shape through simultaneous rotation to the moulds and downward traverse movement of the spinning machine. Appropriate addition of inoculants is made to get the correct micro-structure and good surface finish of pipes.
Figure-1. A schematic process flow diagram Heat Treatment Pipes are heat treated in an annealing furnace to attain mechanical properties stipulated by standards. Each pipe is subjected to annealing process to dissolve cementite and formation of ferrite in the matrix. This results in the attainment of desired mechanical properties. Annealing is a four stage process involving heating, soaking, rapid cooling and slow cooling. After annealing, mechanical tests are carried out at a regular interval to check the ductility and tensile strength of the pipes.

Page 24 of 41
Marking & Stenciling Name and logo of the manufacturer, year of manufacture, class of pipe, quality certificate number are marked on the external surface of the pipes using stencils. Some of those marked information are requirements of the applicable standards. Storage, Packing & Dispatch Finished pipes are stored in the stockyard in stacks normally in three ways, viz., square stacks, pyramidal stacks and parallel stacks. Pipes of less than DN 400 size are normally bundled after putting wooden bars between pipe layers for the purpose of separating. Pipes are dispatched in trucks and trailers. Support Processes Socket Core Making Sand core is needed to give the internal profile of socket during casting. One core is required to manufacture one pipe as the core gets burnt in the production process. Sand and binders are used in the ore shooting machines to manufacture cores. Mould Maintenance Mould maintenance involves three activities, viz., grinding, peening and welding. Grinding removes heat cracks on moulds which appear during casting of pipes. Peening makes the moulds’ internal surface rough to get desired external surface of pipes. Welding is used to repair deep heat cracks on moulds which grinding cannot remove. Main Plant & Equipment The proposed DI plant will have a capacity to produce 2x150 KTPA/300 KTPA of DI pipes having a size range of DN 80 to DN 1200. Manufacturing Facilities (Phase I) – (tentative) 1. Liquid Metal Holding 150 t : 1 no.(Optional) 2. Induction Furnace 20t x 3 crucibles (Dual Track type) 3. Magnesium Converter 5t x 2 nos. 4. Casting Machines (total 5 nos.)
a. DN 100 – 300 : 2 nos. b. DN 350 – 800 : 2 nos. c. DN 800 – 1200 : 1 no.
5. Annealing Furnace 58 m long 40 tph : 1 no. 6. Core Making Equipment 7. Mould maintenance Equipment. 8. Inspection & QC equipment 9. Finishing Lines 2 no.(Duplex Station)
a. DN 100 - 400 b. DN 450-1200 mm
10. Coating Line : 2 no.(Duplex Station)

Page 25 of 41
a. DN 80-400 b. DN 450 – 1200
11. Hoisting & Handling equipment (EOT Cranes, Electric Hoist, Chain Pulley Blocks) 12. Transfer Cars 13. DM Plant for Soft Water Water cooling Recirculation System (Circulating Pumps, Cooling Tower, Pipes, valves & fittings) 14. Drinking water & Firefighting
Raw Material Requirement
The Consumption of Raw Materials and Fuel for rated capacity of production of DI Pipes are shown in the table-1.3
TABLE-1.3 SPECIFIC CONSUMPTION RAW MATERIALS & UTILITIES
Sr. No. Raw Material kg/t of Cat Pipe
1 Hot Metal 1083.0
2 MS Scrap 100-130
3 Ferro Silicon 10
4 Zn Wire 1.73
5 Bitumen Coal Tar 2.15
6 Magnesium 1.3-1.4
7 Sand for core making 55
8 Graphite Powder/ 0.67
9 Binder 1.3-1.4
10 Catalyst 0.27
11 BF Gas, nm3/t 500-600
12 Cement 30
13 Calcium carbide 14-15
14 Sand for Lining 130-165
15 Utilities - Power kwh/t 350.0
16 Utilities - Water - Make Up -m3/t 1.02-1.05 m3/t
17 Compressed Air, m3/t 70
Raw Materials, Fuel and Production Balance
The material balance has been estimated for 1,50,000 t DI plant and is shown in Table-1.4. TABLE 1.4
MATERIAL BALANCE
Input % t/h Out Put % t/h
HOT METAL 91.31% 20.58 Melting Skull/Slag 7.14% 1.61
SCRAP/Pipe Rejets 6.53% 1.47 Rejections 6.52% 1.47
Other Ferrous Inputs
2.16%
0.49 Runner Sand Bag
& Slag
7.41%
1.67
To Casting Machine 100.00% Other Losses 2.04% 0.46
Coating & Lining (Ave) 7.40% 1.67 Finished Pipe 84.29% 19.00
107.40% 24.21 107.40% 24.21

Page 26 of 41
Material balance for 0.3MTPA DI Pipe Plant
Energy Balance The average energy balance per t of production of DI Pipe has been shown in Table1.5
TABLE-1.5
ENERGY BALANCE
Per t of DI Pipe
S No
Input (kWH) Output (KWH)
Power Consumed
Percent Consumer Power Consumed
Percent
1 350.00 100.00% Holding/Melting Furnace & Converter
208.60 59.60%
2 Casting 14.00 4.00%
3 Annealing 14.00 4.00%
4 Moulding 12.95 3.70%
5 Core Making 2.63 0.75%
6 Zinc Coating 6.13 1.75%
7 Cement Coat 3.15 0.90% 8 Finishing Operations 3.12 0.89%
9 Pump House 16.59 4.74% 10 Compressor 41.83 11.95%
11 Hoisting & Handling 2.10 0.60%
12 Admin Office Lab Stores 0.60 0.17%
13 Illumination Shop, Area Lighting, Utilities
21.00 6.00%
14 Dedusting 3.33 0.95%
15 Total 350.00 350.00 100.00% Services and Utilities
Water Supply Facilities Pipe making is a heat intensive process wherein a considerable quantity of cooling water is required for control of metallurgical processes as well as for dissipation of unutilized heat. In order to conserve precious fresh water demand, closed circuit water re-
Material Balance
Input % t/h Out Put % t/h
HOT METAL
91.31%
41.16000
Melting Skull/Slag
7.14%
3.2200
SCRAP/Pipe Rejets 6.53% 2.94000 Rejections 6.52% 2.9400
Other Ferrous Inputs
2.16%
0.98000 Runner Sand Bag & Slag
7.41%
3.3400
To Casting Machine 100.00% 45.08000 Other Losses 2.04% 0.9300
Coating & Lining (Ave) 7.40% 3.35000 Finished Pipe 84.29% 38.00
107.40% 48.43000 107.40% 48.4300

Page 27 of 41
circulation systems have been planned as far as possible in order to effect extensive recycling and reuse of return water from plant processes. Industrial quality clarified water will be used in most of the cases except induction furnaces where DM water will be required. Cooling towers will be provided for cooling industrial hot re-circulating water. Process water losses will be compensated by adding make-up water.
Water Requirement
Total water requirement will be 1200 m3/day and the source of water is from Bandara which is about 10 km away from the Plant and connected with the pipeline. Make-up water will be drawn from Bandara & stored in raw water sump. The permission to draw the water upto 6000 m3/day from Bandara has already been granted by GWRD-Goa government.
Circulating Water requirement for the proposed project will be 1183 m3/h.
Total water requirement after expansion project will be supplied from existing water supply network of M/s Vedanta Limited. The water requirement for different processes is shown in the Table 1.6
TABLE 1.6
WATER REQUIREMENT
S No.
Unit Circulating Water Requirement
(m3/h) Make up water(m3/h) Waste Water
Proposed Future
Expansion
Total (m3/h)
Proposed
Expansion
m3/h (Total)
1
Induction Furnace
300
300
600
2
2
2 Casting
500
500
1000
5
5
3
Annealing Furnace & Boiler
200
200
400
3
3
4 Zinc 15 15 30 0 0
5 HPTM
90
90
180
1
1
6 Cement lining
48
48
96
1
1
7 Coating
15
15
30
0
0
8 Curing 10 10 20 1 1
9 Hydraulics 5 5 10 0 0
10
Misc
0 2 2 2
11
Gardening, Road Sprinkling
5
5
4
13 Total m3/h 1183 1183 2366 20 20 6
14 Make up
water Per
t
1.05
1.05
0.32
Water Recirculation System The water recirculation systems will comprise the following main units: Pump house & sumps; Circulating water pumps & electrics;
Page 28 of 41
Make-up water pumps & electrics; Strainers; Interconnecting piping; Cooling tower; and Emergency overhead tank for induction furnace.
Make Up Water System Raw water will be stored in make-up water sump. Make-up water will be pumped to different consumers, sumps, etc. through MS pipeline network complete with pumps, valves and fittings. The make-up water pumps will be housed in a proposed common pump house for make-up cum drinking and firefighting. Drinking Water System Raw water after necessary clarification and filtration will stored in the drinking water storage tank and will be supplied to various consumers of the pipe plant by means of drinking water piping network, complete with pumps, valves and fittings. Fire Fighting Water System The firefighting water network will be provided with adequate number of yard hydrants and in-shop landing valves to combat fire hazards in the plant. The piping network will be provided complete with pumps, pipelines, valves, hydrants and fittings. Design Criteria Efficiency, reliability and flexibility of operation and maintenance will be the guiding criteria for the design of the water system of the proposed plant. Pumping systems will be provided with adequate instrumentation, controls and process interlocks to ensure reliability of operation and safety of the plant and personnel. Cooling towers for re-cooling of circulating water will be cross-flow/counter flow induced draft with recovery type fan stack. DM plant will be installed for supply of soft DM water to induction furnaces. Emergency overhead tank will be provided for meeting emergency water requirement of the induction furnaces. Water Pollution Control & Conservation Extensive recycling has been adopted in the design of plant water systems. Quality of circulating water will be maintained through dosing of conditioning chemicals for controlling corrosion, scale deposit and microbial growth. Waste water from treatment plant and DM plant will be neutralized before discharge from the plant. Through cascaded reuse of blow down, the water scheme ensures minimization of waste water discharge from the industrial water circuits. Blast Furnace Gas System Blast Furnace (BF) gas will be used as fuel in the annealing furnace. Required BFG (5,000–8,000 Nm3/h) shall be made available from BF#3 which will meet the fuel requirement of annealing furnace. Balance requirement of fuel for heating/drying will be met with LPG/BFG. The plant will be connected with the BF gas grid of our existing Plant.

Page 29 of 41
LDO System Power Requirement DI Pipe Plant will require about 12 MW of power to operate the Electric/induction furnaces, casting machines and other equipment. Required power will be sourced internally from our 2*30MW heat recovery Power Plant. In Phase-I either pig iron received from Bf#3 will be re-melted into electric arc furnace/coupola or hot liquid metal will be transportedand proceed further for desulphurisation, scrap charging etc, however, in Phase-II rail track will be laid from BF#3 to DI pipe plant for hot metal transportation for better realisation and power saving. Depending on Financials, if at one go 300 KTPA plant is installed then entire liquid hot metal will be utilised for DI pipe production. Quality Assurance DI pipes need to conform to stringent quality standards as they are used to transmit drinking water. Pipes are produced according to the stipulations of applicable quality standards as below: Indian standard - IS 8329: 2000, and International standards – ISO:2531 International standards - BS EN 545: 2002
In order to attain stipulated specifications, stringent quality assurance measures will be enforced at every stage of production which will include chemical analysis, visual inspection, pressure testing, pipe thickness measurement, cement lining thickness measurement, bitumen coating thickness measurement, physical testing, etc.
e) Ferro Silicon Plant
Description of the Process
Mineral Ore like Quartz along with coke and coal as a reducing agent and fluxes are fed into the furnace in required proportion to attain the desired elements in the final product. After the furnace is charged with the blended material, low voltage & high current is passed through the Electrodes. Electrical Energy at high amperage is induced from the furnace transformer through electrodes which results into generation of heat at a high temperature ranging up to 1600 - 1800 Degree Centigrade. The reaction takes place inside the furnace hearth at a high temperature when carbon content in Coke & Coal reacts with the oxides which are reduced to metal by liberation of Carbon monoxide and Carbon dioxide. The impurities in the ore are separated by use of fluxes and forms slag which being lighter floats over the molten metal.
All the process parameters are being controlled through PLC system and closely monitored . As the process of Ferro Silicon is continuous, the charge is fed at continuous intervals through hoppers and charging chutes into the furnace hearth whenever the charge level comes down. Inside the furnace the basic ore is subjected to oxidation at high temperatures between 1350 to 1700OC and are reduced through the Coal and Coke. The fluxes are used to maintain proper

Page 30 of 41
basicity in order to maintain required temperatures and fluidisation of slag. The by-products gases are let out through the highly sophisticated pollution control system and the fume dust is collected in to filter bags. The molten Ferro Silicon and the slag is tapped at regular intervals and are casted as cakes in large Cast iron casting pans for further handling, breaking and sizing to buyers requirement. Every taping sample is drawn to determine the elements present in alloy and also to take corrective actions if required. After proper solidification of these cakes they are shifted to metal handling yard for crushing, sizing, lot preparation, lot sampling, lot analysis, lot packing, lot stacking and allotting lot number for proper identification to meet the market requirements of in house and domestic market. Quality control is exercise right at the Raw Material stage as well as intermediate stage by spoon analysis and finally testing of the finished product in the laboratory.
The gaseous matter and fumes generated in the furnace is treated through pollution control equipment and clean gas is allowed to escape to the atmosphere through chimney.
The equipment and facilities for the proposed Plant will be as follows:
• Receipt of Raw Materials in the Covered Storage Yard.
• Charging of in feed raw materials to Over ground hoppers by excavator. Transportation and conveying of raw materials from OG hoppers to Screening Plant Transportation of screened material to Intermediate hoppers.
• Transportation of screened materials to day bins.
• Transportation of weighted materials from day bins to storage bunkers for Ferro Silicon Batch Charging to SAF
• SAF Operation Tapping of Slag Tapping of Metal • Cooling & Casting into moulds
• Breaking to sizes as per plant requirements.
• Storage of Finished Products Despatch of Finished Products Cooling of Gas. (FDC)
• Fume Cleaning System (Bag filter system )for SAFs.
• Electrical system, drive automation and instrumentation equipment, Intercommunication system and Computers.
• Buildings - Welfare building, control rooms, Sub-Stores, etc. Water, Oxygen and compressed air, and other utilities.
• Ventilation, Air Conditioning and fire-fighting facilities. Roads, drains and sewers etc. in battery limit area.
• Hoisting & Handling facilities. Laboratory Facilities
Process Flow
The process flow is given here under.
Receipt of Raw Materials
Screening of Raw Materials
Page 31 of 41
Intermediate Storage of Screened & Undersize materials.
Storage of different materials in the day bins.
Proportioning of Raw materials
Storage of Charge Materials for Ferro Silicon
Transportation of blended materials to SAF
Material Feeding System to SAF.
SAF
Tapping of Slag & its storage
Tapping of Metal, casting into molds & its cooling
Sizing of finished products.
Storage of different grades of Ferro Silicon..
Despatch of Ferro Silicon.
Material Flow
The Process-cum-Material Flow for the plant is given below

Page 32 of 41
.

Page 33 of 41
For the production of 4950 tpa ferrosilicon , one submerged arc furnace of 7.0 MVA
capacity will be provided to ensure production of 15.2 tons per day liquid ferro Silicon.
Product Mix
The product mix has been categorized depending upon percentage of ferro silicon in the
product The Ferro Silicon Plant has been designed to produce about 4950 tons per year of
Liquid Ferro Silicon as per following production plan.
Description
Annual Production t
Remarks
Ferro silicon 70% Si
3000
This will be as per actual requirements
Ferro silicon 50% Si
1950
Properties of Ferro Silicon
The common properties of Ferro Silicon are given below: Ferro-silicon
Si: 60-80%,
C: 0.15% max,
P: 0.05%, S: 0.05% max,
Al : 1-15% max,
Size: 25-150 mm +/- 10%,
Corresponding ISI specification: IS 1110-2011.
Requirement of Raw Materials & Consumables
The annual requirement of input raw materials and consumables will be as given below : The
details of the annual requirement of raw materials for Ferro Silicon production of 4950 t per
annum has been worked out and given in Table No.1 below:
TABLE No. 1
Annual Requirements of Raw Materials (For Production of 4950t t of Ferro Silicon)
Sl. No.
Raw Material Total Requirement, t/yr. (Approx.)
1 Quartzite 8910
2. Charcoal 3217.5

Page 34 of 41
Sl. No.
Raw Material Total Requirement, t/yr. (Approx.)
3 Coke 3217.5
4 Iron Scrap, Mill Scale 990
5 Electrode Paste 346.5
. Specific Consumption of Raw Materials and Fuel on Dry Basis
The Consumption of Raw Materials and Fuel for rated capacity of production of Ferro
Silicon are shown in the Table No. 2 below :
TABLE No. 2
Specific Consumption Raw Materials & Utilities Sl. No.
Raw Material
kg/t of Cat Pipe
1 Quartzite 1800
2 Coke 650
3 Charcoal/Coal 650
4 Mill Scale/Iron Filings 200
5 Electrode Paste 70
6 Oxygen 10 m3/h
7 Utilities - Power kwh/t 8800
8 Utilities - Water - Make Up 9 m3/h
Raw Materials, Fuel and Production Balance
The material balance has been estimated for 4950 t capacity Ferro Silocon plant and is
shown in Table No.3 below:
TABLE No.3
Material Balance
Input % t/d Out Put t/d %
Quartzite 53.4% 27.36 Fe Si 15.20 30%
Coal 19.3% 9.88 Flue Gas 13.18 26%
Coke 19.3% 9.88 Slag 1.74 3%
Mill Scale 6.0% 3.04 Dust 21.12 41%
Electrode Paste 2.0% 1.064
Total 100.00% 51.224 51.24 100%
Page 35 of 41
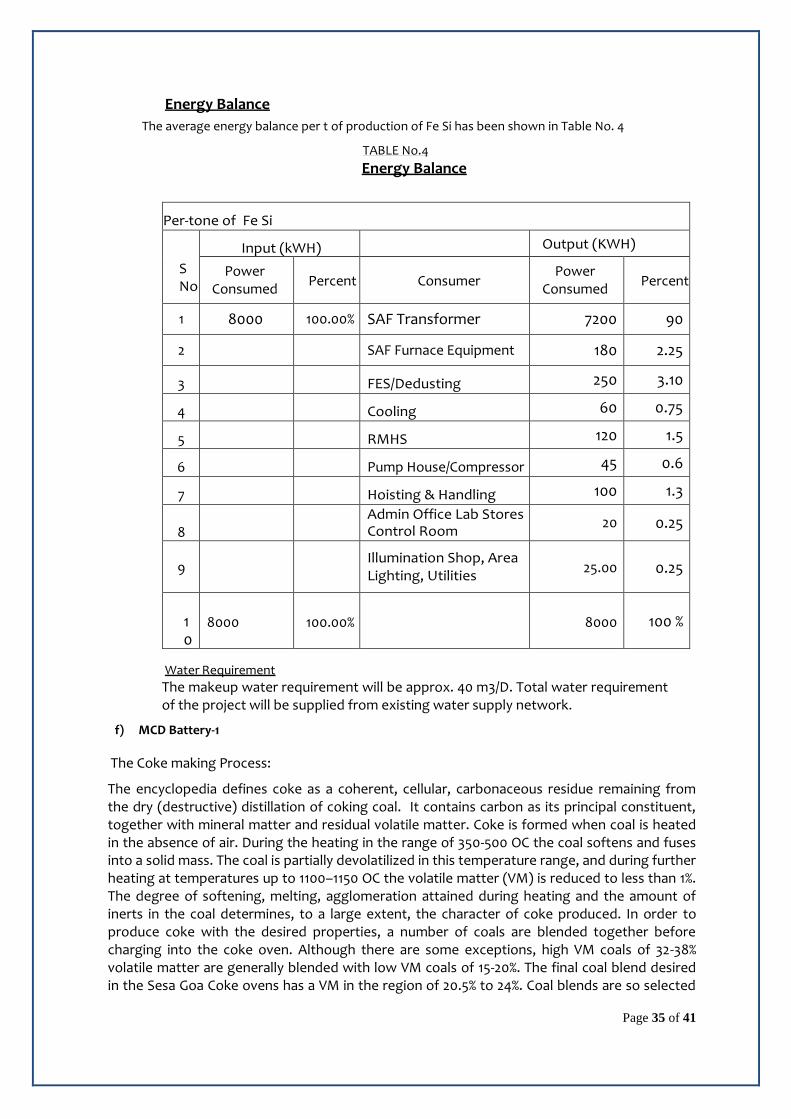
Energy Balance
The average energy balance per t of production of Fe Si has been shown in Table No. 4
TABLE No.4
Energy Balance
Per-tone of Fe Si
S No
Input (kWH) Output (KWH)
Power Consumed
Percent
Consumer Power
Consumed
Percent
1 8000 100.00% SAF Transformer 7200 90
2 SAF Furnace Equipment 180 2.25
3
FES/Dedusting 250 3.10
4
Cooling 60 0.75
5
RMHS 120 1.5
6
Pump House/Compressor 45 0.6
7
Hoisting & Handling 100 1.3
8
Admin Office Lab Stores Control Room
20 0.25
9
Illumination Shop, Area Lighting, Utilities
25.00
0.25
10
8000
100.00%
8000
100 %
Water Requirement
The makeup water requirement will be approx. 40 m3/D. Total water requirement of the project will be supplied from existing water supply network.
f) MCD Battery-1
The Coke making Process:
The encyclopedia defines coke as a coherent, cellular, carbonaceous residue remaining from the dry (destructive) distillation of coking coal. It contains carbon as its principal constituent, together with mineral matter and residual volatile matter. Coke is formed when coal is heated in the absence of air. During the heating in the range of 350-500 OC the coal softens and fuses into a solid mass. The coal is partially devolatilized in this temperature range, and during further heating at temperatures up to 1100–1150 OC the volatile matter (VM) is reduced to less than 1%. The degree of softening, melting, agglomeration attained during heating and the amount of inerts in the coal determines, to a large extent, the character of coke produced. In order to produce coke with the desired properties, a number of coals are blended together before charging into the coke oven. Although there are some exceptions, high VM coals of 32-38% volatile matter are generally blended with low VM coals of 15-20%. The final coal blend desired in the Sesa Goa Coke ovens has a VM in the region of 20.5% to 24%. Coal blends are so selected

Page 36 of 41
that desired properties as well as impurity contents contribute to the required characteristics of the metallurgical coke. The low VM coals usually improve the strength characteristics of the coke and its yield. In the production of the foundry coke, a small percentage of inerts such as petroleum coke (pet coke) and / or ground anthracite fines, improve the characteristics of the coke for use in the foundry. The temperature of coking also plays a very important role in the character of final coke product. Whereas higher temperatures and longer coking cycles are known to produce higher CSR( coke strength after reaction) and lower CRI( coke reactivity index) for similar coal blends, lower coking temperatures improve the shatter index and raise the CRI which are desirable for foundry applications. The predominant (over 90%) use of metallurgical coke in the world is for the production of hot metal in the blast furnace.The Sesa Coke Technology is basically a Non Recovery type, wherein there is no recovery of chemicals by-products. The ovens operate under negative pressure and at high temperature in the range of 1200~1280 Deg Centigrade. At this temperature, all hydrocarbons are combusted. The Sesa Coke ovens are also simple in construction, easy to operate and maintain, and are economical even at lower capacities. The coke produced is of excellent quality, the polluting emissions are most satisfactory and the energy recovery is superior as the foundations are cooled by air and the same is reused in the ovens to conserve energy and minimize pollution.
Dimensions of Oven. Length – 12496 mm Width – 2745 mm Height – 2444 mm
Coal and process requirements
Coal blend quality will be as under:
Total moisture - 7.5% (ar) Volatile Matter - 24% (db) Ash - 10% (db)
Coal cake dimensions required are given below:
Length - 12260 mm Width - 2700 mm Height - 950 mm Cake volume - 31.45 m3 Bulk density - 1.10 ton/m3 (min)
COKE ANALYSIS – TYPICAL SPECIFICATION
The desired typical specification of desired metallurgical coke is as under:
Sr.No. Parameter Specification
1 Moisture 5.0% Max
2 Ash 12.5% Max
3 Volatile Matter 1.2% Max
4 Sulphur 0.55% Max
5 M-10 09.00 Max
6 M-40 78.00 Min
7 FC 85% Min
8 CSR 65 % minimum
9 CRI 18% to 23% Max (depending on coals used)

Page 37 of 41
The Coke Ovens
The Sesa(Vedanta Limited) design of ovens is patented and meets the most stringent
environmental norms. The essence of the technology is the use of suitable fire clay
bricks, which can also better withstand the thermal shocks of the temperature variations
due to the ingress of cold air while charging and pushing.
3 Water & Energy requirement for the project
Water requirement: Total water requirement for proposed project will be 2280 m3/day or KLD, out of which, for DI pipe plant of 0.30 MTPA will require 1200 m3/day, for proposed enhancement of blast furnace capacity from 0.54 MTPA to 0.65 MTPA will require an additional water 600 m3/day and for ferro silicon plant of 0.005 MTPA capacity will require 40 m3/day. The additional water required for production increase at BF1&2will be 330 m3/day and 120m3/D will be for oxygen plant which will cater the oxygen enrichment of BF1,2&3. The water will be sourced from Bandara dam which is about 10 km away from the Plant and connected with the pipeline (existing). Make-up water will be drawn from Bandara dam & stored in raw water sump. The permission to draw the water upto 6,000 m3/day from Bandara dam has already been granted by GWRD-Goa government.
Total water requirement after expansion project will be supplied from existing water supply network of M/s. Vedanta Limited.

Page 38 of 41
Composite water requirement
VAB- WATER BALANCE DIAGRAM- Current
PROPOSED WATER BALANCE @ VAB
Power requirement: Total power requirement for proposed project will be 28 MW, out of which, for DI pipe plant will require 16 MW, for proposed enhancement of blast furnace capacity from 0.54 MTPA to 0.65 MTPA will require an additional power of 3.5 MW and for ferro silicon plant of 0.005 MTPA capacity will require 5 MW. The additional power required for production

Page 39 of 41
increase at BF1&2will be 1.5 MW and 2 MW will be for oxygen plant which will cater the oxygen enrichment of BF1,2&3. The power will be sourced from existing power plant Composite power requirement
ENERGY BALANCE – VALUE ADDITION BUSNESS (PROPOSED SCENARIO)

Page 40 of 41
4 Land requirement for the project Revenue Area
Sr. No Details Area in Ha
1 Existing BF-1 & BF-2 3.85
2 Raw material storage area and Despatch 17.35
3 Internal roads 3.5
4 Administration building, canteen, stores, 2.57
4 Proposed 4 additional ovens 0.12
5 Green Cover 26
6 Utility Area 3.61
Total 57.0 Ha
Industrial Area
Sr. No.
Particulars Area (in ha)
1 Plant, Machinery & Building (Existing) 16
2 Roads, drains, stockyards of finished goods and raw materials and other open areas (Existing)
38.84
3 Proposed DI pipe plant 8.09
4 Proposed Fe-Si Plant 1.26
5 Proposed Oxygen Plant 0.2
6 Green Belt 28
7 Area for future Expansion 11.61
TOTAL AREA 104
Land Utilization for Integrated Amona Plant Sr. No Details Area in Ha
1 Machinery Setups 29.52
2 Raw material storage area and Despatch 31.7
Finished Product Storage 16.15
3 Internal roads 7.0
4 Administration building, canteen, stores, 2.57
4 Green Belt Development 54.0
5 Water Harvesting 4.52
6 ETP 0.32
7 Vacant Land for Future Use 11.61
8 Utility Area 3.61
Total 161.0 Ha
5 Project Schedule and CAPEX
Likely date of start of construction and likely date of completion.
The existing three Blast Furnace is already operating. BF1&2 process optimization could be done without stopping the BF. It will be completed within 10 month of getting EC. BF3 up gradation will be done during the capital repair. Project will be 3months from the date of Environmental Clearance (EC).

Page 41 of 41
The implementation schedule for the proposed DI Pipe plant and Fe-Si Plant project is 24 months from the date of Environmental Clearance (EC). This includes 6 months for the preparation of Basic / Detailed Engineering, 15 months construction period and 3 months for commissioning. The project schedule for setting up of additional ovens for battery-1 will 6 months from the date of Environmental Clearance (EC).
Capital Cost Estimates
The capital cost of proposed project is Rs.701 crores, out of which for technology up-gradation of existing blast furnace will be Rs. 70 Crore, for the DIP expansion plant including auxiliaries is Rs. 550 Crore , for the installation of Ferro silicon plant is Rs. 30 Crores setting up oxygen plant is 45Crore and putting up additional ovens for battery-1 &2 is 6Cr The proposed project will be executed immediately after grant of EC.
Expenditure on Environment in Project Cost
The overall cost on measures for the environment protection will be about 5% of the total project cost. The cost will include the plantation cost, setting up of emission control and environmental monitoring equipments and stations and development of the green land as per the government rules.
6 Rehabilitation and Resettlement (R & R) Plan
Not applicable because no additional land will be required for the production enhancement of blast furnace. DI pipe project and Fe-Si is a brown field project. The entire land required for proposed 4 additional oven for battery-1, DI pipe plant and Fe-Si is already in possession of Vedanta. The land is under industrial use and does not have any settlement. Hence, there are no Rehabilitation & Resettlement (R&R) issues.