Embed Size (px)
Citation preview

energies
Article
Techno-Economic Analysis of a Novel Two-StageFlashing Process for Acid Gas Removal fromNatural Gas
Yiyang Dai 1,* , Yuwei Peng 2, Yi Qiu 3 and Huimin Liu 4
1 School of Chemical Engineering, Sichuan University, Chengdu 610065, China2 College of Chemistry and Chemical Engineering, Southwest Petroleum University, Chengdu 610500, China;
[email protected] China Petroleum Engineering Construction Corporation (Beijing Company), Beijing 10008, China;
[email protected] BLOCK 9 of Kuwait Energy Company KSCC, Nashwa-AlZireje Street, Al-Yamam Statio Shatt al Arab
District, 61014 Basra, Iraq; [email protected]* Correspondence: [email protected]
Received: 12 October 2019; Accepted: 1 November 2019; Published: 5 November 2019�����������������
Abstract: Excessive CO2 content will reduce the natural gas calorific value and increase the energyconsumption of the regenerator in natural gas desulfurization and decarbonization. This paper usesAspen HYSYS to model a novel two-stage flash process of acid gas removal process from naturalgas. According to the results from the simulation, as well as running experiences in a natural gasprocessing plant in the middle east, it can be demonstrated that this new process, which has been usedin the field of natural gas desulfurization and decarbonization, can meet the requirement of productspecifications. Based on the steady state simulation, Aspen HYSYS sensitivity function is used toevaluate influence of key operating parameters, such as the second flash pressure and temperature,on the energy consumption. Compared to the traditional acid gas removal process and acid gasenrichment process, the new two-stage flash acid gas removal process has less energy consumption(2.2 × 10⁹ kJ·h−1). In addition, two-stage flash acid gas removal process also improves the efficiencyof acid gas enrichment, while the overall energy consumption is less than combination process oftraditional process and acid gas enrichment process.
Keywords: natural gas sweetening; acid gas flash; two-stage flashing process absorber; regeneration
1. Introduction
Due to its low cost, clear-burning, and less CO2 release per energy unit, natural gas is considered as aclean energy resource compared with conventional fossil fuels including coal, crude oil >petroleum [1,2].However, around one third of raw natural gases contain CO2 and sulfur components (H2S, RSH, RSSH,CS2, and COS), which need to be removed to meet specifications of sales gas [3]. These acidic impuritieshave no heating value. In addition, these contaminants tend to form acids that can corrode pipelinesand other equipment with the presence of water. Therefore, these acidic impurities have to be removedfrom the sour gas. Particularly, the maximum allowed level of CO2 in natural gas transmitted tocustomers by pipeline is typically less than 3% [4,5]. Product natural gas quality standards for naturalgas content also have more stringent restriction: CO2 needs to be less than 2% (mol), and H2S needs tobe less than 6 mg·m−3 in sweet gas. Therefore, it is of critical importance to remove the acid gases innatural gas to a certain extent to meet the requirements of commodity gas quality standards [6].
The process that removes the acid gas from natural gases is referred as acid gas removal (AGR)process. There are many different methods to remove acid gas from natural gas. To name just a
Energies 2019, 12, 4213; doi:10.3390/en12214213 www.mdpi.com/journal/energies

Energies 2019, 12, 4213 2 of 14
few, these methods include absorption, which can be chemical absorption, physical absorption orcombined absorption. Membrane separation is another method that has been used for naturalgas sweetening [7,8]. Other methods include but are not limited to biochemical method [9],molecular sieving [10], and low-temperature fractionation [11]. Among those technologies listed above,chemical absorption is the most widely used method for acid gas removal. Various amines have beencommonly used as chemical solvents, such as monoethanolamine (MEA), diethanolamine (DEA),and methyldiethanolamine (MDEA). Compared with MEA and DEA, MDEA can selectively removeH2S with the existence of CO2. Secondly, MDEA can remove most CO2 and H2S from the raw naturalgas, which can be beneficial to sulfur recovery. Thirdly, the foaming tendency and corrosiveness ofMDEA are low compared to MEA and DEA. Last but not least, the reaction of MDEA with CO2 is anacid-base reaction with less heat of reaction; thus, less heat is needed during regeneration, so it is idealfor removing CO2 in large quantities [12–14].
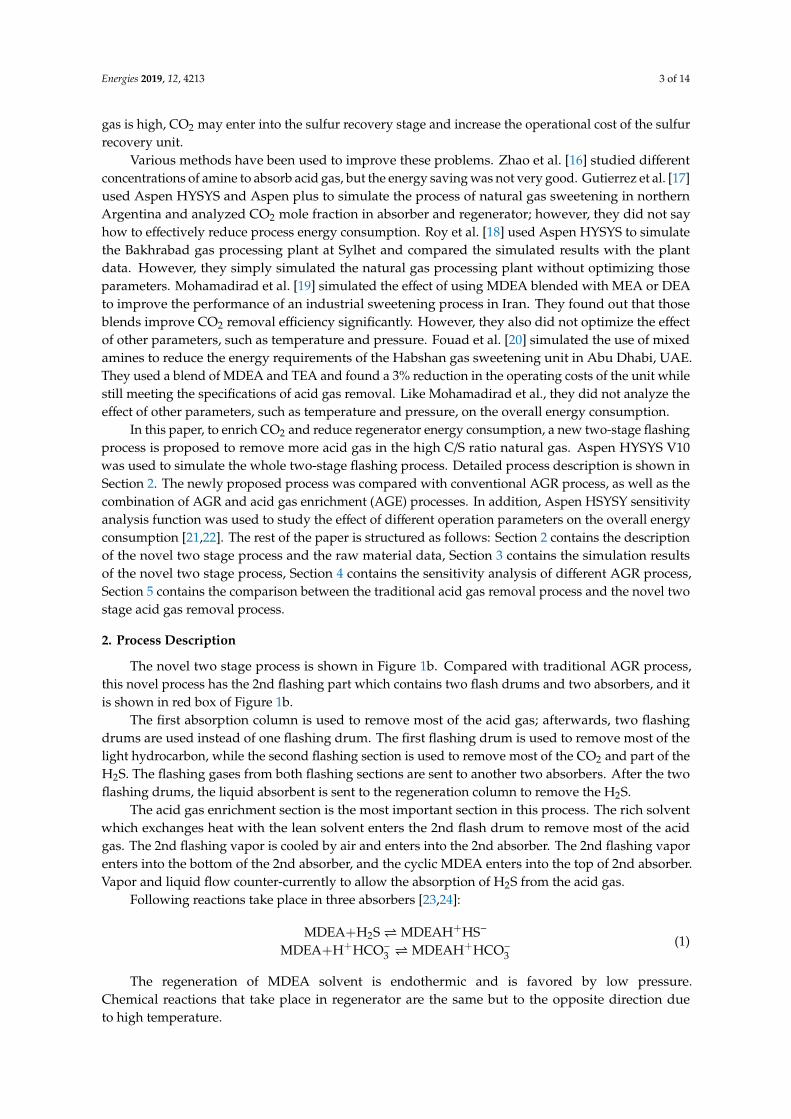
Generally, traditional acid gas removal process includes three main steps, absorption,hydrocarbon flash and regeneration [15] units, which are shown in Figure 1a.
Energies 2019, 12, x FOR PEER REVIEW 2 of 15
The process that removes the acid gas from natural gases is referred as acid gas removal (AGR) process. There are many different methods to remove acid gas from natural gas. To name just a few, these methods include absorption, which can be chemical absorption, physical absorption or combined absorption. Membrane separation is another method that has been used for natural gas sweetening [7,8]. Other methods include but are not limited to biochemical method [9], molecular sieving [10], and low-temperature fractionation [11]. Among those technologies listed above, chemical absorption is the most widely used method for acid gas removal. Various amines have been commonly used as chemical solvents, such as monoethanolamine (MEA), diethanolamine (DEA), and methyldiethanolamine (MDEA). Compared with MEA and DEA, MDEA can selectively remove H2S with the existence of CO2. Secondly, MDEA can remove most CO2 and H2S from the raw natural gas, which can be beneficial to sulfur recovery. Thirdly, the foaming tendency and corrosiveness of MDEA are low compared to MEA and DEA. Last but not least, the reaction of MDEA with CO2 is an acid-base reaction with less heat of reaction; thus, less heat is needed during regeneration, so it is ideal for removing CO2 in large quantities [12–14].
Generally, traditional acid gas removal process includes three main steps, absorption, hydrocarbon flash and regeneration [15] units, which are shown in Figure 1a.
Figure 1. Traditional and novel acid gas removal flowsheet.
In the process shown above, one absorber, one flashing drum, and one regenerator are normally used in the acid gas removal process. The acid gases absorbed in the liquid absorbent can be partly released in the flashing drum; then, the rich solvent is further sent to the regenerator. Traditional acid gas removal process can effectively remove most of H2S from acid gas. It should be noticed that if high carbon/sulfur ratio natural gas is involved, the basic absorbents could remove both sulfur compounds and CO2, but the sulfur compounds (e.g., H2S) cannot be easily regenerated, consequently reducing the overall acid gas removal efficiency. Secondly, the CO2 could diffuse to the
Figure 1. Traditional and novel acid gas removal flowsheet.
In the process shown above, one absorber, one flashing drum, and one regenerator are normallyused in the acid gas removal process. The acid gases absorbed in the liquid absorbent can be partlyreleased in the flashing drum; then, the rich solvent is further sent to the regenerator. Traditional acidgas removal process can effectively remove most of H2S from acid gas. It should be noticed that if highcarbon/sulfur ratio natural gas is involved, the basic absorbents could remove both sulfur compoundsand CO2, but the sulfur compounds (e.g., H2S) cannot be easily regenerated, consequently reducingthe overall acid gas removal efficiency. Secondly, the CO2 could diffuse to the regenerator vapor,which could lead to increased cooling water consumption. Thirdly, if the CO2 content in the natural
Energies 2019, 12, 4213 3 of 14
gas is high, CO2 may enter into the sulfur recovery stage and increase the operational cost of the sulfurrecovery unit.
Various methods have been used to improve these problems. Zhao et al. [16] studied differentconcentrations of amine to absorb acid gas, but the energy saving was not very good. Gutierrez et al. [17]used Aspen HYSYS and Aspen plus to simulate the process of natural gas sweetening in northernArgentina and analyzed CO2 mole fraction in absorber and regenerator; however, they did not sayhow to effectively reduce process energy consumption. Roy et al. [18] used Aspen HYSYS to simulatethe Bakhrabad gas processing plant at Sylhet and compared the simulated results with the plantdata. However, they simply simulated the natural gas processing plant without optimizing thoseparameters. Mohamadirad et al. [19] simulated the effect of using MDEA blended with MEA or DEAto improve the performance of an industrial sweetening process in Iran. They found out that thoseblends improve CO2 removal efficiency significantly. However, they also did not optimize the effectof other parameters, such as temperature and pressure. Fouad et al. [20] simulated the use of mixedamines to reduce the energy requirements of the Habshan gas sweetening unit in Abu Dhabi, UAE.They used a blend of MDEA and TEA and found a 3% reduction in the operating costs of the unit whilestill meeting the specifications of acid gas removal. Like Mohamadirad et al., they did not analyze theeffect of other parameters, such as temperature and pressure, on the overall energy consumption.
In this paper, to enrich CO2 and reduce regenerator energy consumption, a new two-stage flashingprocess is proposed to remove more acid gas in the high C/S ratio natural gas. Aspen HYSYS V10was used to simulate the whole two-stage flashing process. Detailed process description is shown inSection 2. The newly proposed process was compared with conventional AGR process, as well as thecombination of AGR and acid gas enrichment (AGE) processes. In addition, Aspen HSYSY sensitivityanalysis function was used to study the effect of different operation parameters on the overall energyconsumption [21,22]. The rest of the paper is structured as follows: Section 2 contains the descriptionof the novel two stage process and the raw material data, Section 3 contains the simulation resultsof the novel two stage process, Section 4 contains the sensitivity analysis of different AGR process,Section 5 contains the comparison between the traditional acid gas removal process and the novel twostage acid gas removal process.
2. Process Description
The novel two stage process is shown in Figure 1b. Compared with traditional AGR process,this novel process has the 2nd flashing part which contains two flash drums and two absorbers, and itis shown in red box of Figure 1b.
The first absorption column is used to remove most of the acid gas; afterwards, two flashingdrums are used instead of one flashing drum. The first flashing drum is used to remove most of thelight hydrocarbon, while the second flashing section is used to remove most of the CO2 and part of theH2S. The flashing gases from both flashing sections are sent to another two absorbers. After the twoflashing drums, the liquid absorbent is sent to the regeneration column to remove the H2S.
The acid gas enrichment section is the most important section in this process. The rich solventwhich exchanges heat with the lean solvent enters the 2nd flash drum to remove most of the acidgas. The 2nd flashing vapor is cooled by air and enters into the 2nd absorber. The 2nd flashing vaporenters into the bottom of the 2nd absorber, and the cyclic MDEA enters into the top of 2nd absorber.Vapor and liquid flow counter-currently to allow the absorption of H2S from the acid gas.
Following reactions take place in three absorbers [23,24]:
MDEA+H2SMDEAH+HS−
MDEA+H+HCO−3 MDEAH+HCO−3(1)
The regeneration of MDEA solvent is endothermic and is favored by low pressure.Chemical reactions that take place in regenerator are the same but to the opposite direction dueto high temperature.

Energies 2019, 12, 4213 4 of 14
Compared to the conventional one stage absorption process, this novel two-stage acid gas removalprocess has many advantages including: (1) CO2 can be enriched in this novel acid gas, which canreduce the consumption of cooling water; (2) The sulfur compounds and CO2 can be separated in amuch more effective way that the recovery investment is reduced.
The novel acid gas removal process was simulated by Aspen HYSYS. The simulation flowsheet isshown in Figure 2.
Energies 2019, 12, x FOR PEER REVIEW 4 of 15
Compared to the conventional one stage absorption process, this novel two-stage acid gas removal process has many advantages including: (1) CO2 can be enriched in this novel acid gas, which can reduce the consumption of cooling water; (2) The sulfur compounds and CO2 can be separated in a much more effective way that the recovery investment is reduced.
The novel acid gas removal process was simulated by Aspen HYSYS. The simulation flowsheet is shown in Figure 2.
Figure 2. The Aspen HYSYS simulation flowsheet.
The choice of appropriate thermodynamic models and the accuracy of parameters are crucial for the reliability of the design. Acid Gas-Chemical Solvent was used as the property package for acid gas removal process [25,26].
The sour gas composition used in the study was based on the raw material of a middle east plant, which is designed by Saudi Arabian Oil Company. Its composition is shown in Table 1. The carbon to sulfur ratio is 2.3, which justifies the necessity to adopt acid gas enrichment process to remove CO2 and enrich H2S. According to the standard, the CO2 in sweet gas should be lower than 2%, and H2S should be lower than 6 mg·m−3. The mass fraction of MDEA solvent is MDEA: H2O = 55:45.
Table 1. Summary of operation conditions.
Parameters Value Raw natural gas flow rate/kmol·h−1 3.3 × 10⁴
Temperature/K 303.15 Pressure/kPa 8500
Vapor Composition/mol%
CO2 7.7 H2S 4.3 H2O 0
Hydrocarbons 78.8 N2 9.2
3. Results
3.1. Absorption
The purpose of the absorption section is to absorb acid gas by using MDEA solvents. This part of simulation contains a separation drum and an absorber. Based on the plant operation conditions, the pressure and temperature of the 1st absorber was set to 8500 kPa and 334.15 K. A total of 22 stages are used in the 1st absorber. The Aspen HYSYS simulation results are shown in Table 2.
Figure 2. The Aspen HYSYS simulation flowsheet.
The choice of appropriate thermodynamic models and the accuracy of parameters are crucial forthe reliability of the design. Acid Gas-Chemical Solvent was used as the property package for acid gasremoval process [25,26].
The sour gas composition used in the study was based on the raw material of a middle east plant,which is designed by Saudi Arabian Oil Company. Its composition is shown in Table 1. The carbon tosulfur ratio is 2.3, which justifies the necessity to adopt acid gas enrichment process to remove CO2
and enrich H2S. According to the standard, the CO2 in sweet gas should be lower than 2%, and H2Sshould be lower than 6 mg·m−3. The mass fraction of MDEA solvent is MDEA: H2O = 55:45.
Table 1. Summary of operation conditions.
Parameters Value
Raw natural gas flow rate/kmol·h−1 3.3 × 10⁴
Temperature/K 303.15Pressure/kPa 8500
Vapor Composition/mol%
CO2 7.7H2S 4.3H2O 0
Hydrocarbons 78.8N2 9.2
3. Results
3.1. Absorption
The purpose of the absorption section is to absorb acid gas by using MDEA solvents. This partof simulation contains a separation drum and an absorber. Based on the plant operation conditions,the pressure and temperature of the 1st absorber was set to 8500 kPa and 334.15 K. A total of 22 stagesare used in the 1st absorber. The Aspen HYSYS simulation results are shown in Table 2.

Energies 2019, 12, 4213 5 of 14
Table 2. 1st Absorber material balance results.
Parameters Sour Gas MDEA 1 Sweet Gas Rich Solvent 1
Temperature/K 303.15 329.15 329.38 334.73Pressure/kPa 8500.00 7685.60 7500.00 8500.00
Total flow rate/kmol·h−1 33,232.33 180,000.00 29,431.91 183,800.42Composition/mol% - - - -
CO2 7.7 0 1.94 1.09H2S 4.3 0 0.0 0.78H2O 0 84.4 0.26 82.63
MDEA 0 15.6 0.0 15.27Hydrocarbons 78.8 0 85.59 0.22
N2 9.2 0 10.31 0.01
3.2. Hydrocarbons Flash
The hydrocarbons flash section aims to remove most of the light HC and some acid gas from therich solvent.
In the hydrocarbons flash section, the hydrocarbons flash pressure and temperature were set to500 kPa and 335.15 K, which was coming from the plant. The Aspen HYSYS simulation results areshown in Table 3. MEDA 2 flow came from the circulating lean solvent, rich solvent 2 flow came fromthe first absorption section, and rich solvent 3 was sent to acid gas enrichment section
Table 3. Hydrocarbons flashing material balance results.
Parameters Rich Solvent 2 MDEA 2 Flash Gas 2 Rich Solvent 3
Temperature/K 335.15 303.15 305.55 336.3Pressure/kPa 500.00 1390.60 480.00 500.00
Total flow rate/kmol·h−1 183,800.42 733.60 392.94 184,141.08Composition/mol% - - - -
CO2 1.09 0 4.35 1.08H2S 0.78 0 0.09 0.78H2O 82.63 84.4 1.45 82.81
MDEA 15.27 15.6 0.00 15.31Hydrocarbons 0.22 0 90.22 0.02
N2 0.01 0.00 3.89 0.00
3.3. Acid Gas Enrichment Unit (AGE)
The AGE unit concentrates the H2S by introducing a second amine absorption unit. This unitcan not only release big part of the absorbed CO2, which reduces the regeneration column energyconsumption, but also concentrate the H2S content in the liquid phase, which could consequentlyincrease the feed quality to the Claus plant.
The acid gas enrichment section contains a 2nd flash drum, an air cooler, and a 2nd absorber.This is different from the first two steps, in which the parameters are came from the plant. In this step,as a basic case, the temperatures and pressures in the 2nd flash drum is 403.15 K and 300 kPa, while thepressure and temperature of the 2nd absorber are 300 kPa and 338.45 K. In addition, six stages are usedin the 2nd absorber. All these operating parameters are optimized in sensitivity analysis. The simulationresults are shown in Table 4. MDEA 3 flow is came from the circulating lean solvent. Rich solvent 5flow came from hydrocarbon flash section, which was marked as rich solvent 3. Rich solvent flow 6and 7 are sent into regeneration section.

Energies 2019, 12, 4213 6 of 14
Table 4. Acid gas enrichment section material balance results.
Parameters Rich Solvent 5 MDEA3 CO2 Gas Rich Solvent 6 H2O Rich Solvent 7
Temperature/◦C 403.15 303.15 307.15 403.15 333.15 339.33Pressure/kPa 300.00 1390.64 250.00 300.00 300 300
Total flow rate/kmol·h−1 184,141.08 13,500.00 1621.08 171,786 9670 14,563Composition/mol% - - - - - -
CO2 1.08 0.00 95.52 0.21 0.18 0.81H2S 0.78 0.00 0.07 0.63 0.37 5.41H2O 82.81 88.99 1.80 88.13 83.05 79.29
MDEA 15.31 11.01 0.00 11.03 16.40 14.46Hydrocarbons 0.02 0.00 2.61 0.00 0.00 0.03
N2 0.00 0.00 0.00 0.00 0.00 0.00
3.4. Regeneration
The aim of this section is to use steam to remove H2S and regenerate the MEDA solution.This part contains a regenerator and a mixer which mixes regenerate MDEA solvent and make-up
water. The regenerator reflux ratio and regenerator vapor flow rate are 1.5 and 2100 kmol·h−1,respectively. In total 21 stages are used in the regenerator. These operating parameters are consistentwith the plant. The Aspen HYSYS simulation results are shown in Table 5. Rich solvent flow camefrom AGE section, marked as rich solvent 6. The regenerated solvent are sent to absorption section,hydrocarbons flash section, and acid gas enrichment section as the circulating lean solvent.
Table 5. Regeneration section material balance results.
Parameters Rich Solvent Make-Up Water H2S Lean Solvent 2
Temperature/◦C 399.55 453.15 334.66 408.05Pressure/kPa 300.00 1000.0 200.00 280.00
Total flow rate/kmol·h−1 196,020.11 314.69 2101.20 194,233.60Composition/mol% - - - -
CO2 0.22 0.00 20.25 0.00H2S 0.73 0.00 67.10 0.01H2O 83.59 1.00 11.09 84.39
MDEA 15.45 0.00 0.00 15.60Hydrocarbons 0.00 0.00 0.00 0.00
N2 0.00 0.00 0.00 0.00
3.5. Simulation Results Comparison
This paper used Aspen HYSYS to simulate the novel two-stage flash AGR process, the traditionalAGR process, and the combination of the AGR and AGE processes while maintaining the samecomposition for the raw material natural gas. The simulation results and comparison of energyconsumption of different acid gas removal processes are shown in Table 6, and the cost of different acidgas removal processes are shown in Table 7.
Compared with these acid gas removal processes, two-stage flash process has higher CO2
(60.30% and 13.86%) and H2S (97.92% and 92.45%) removal rate than traditional acid gas process.In addition, the H2S composition in the two-stage process is higher than the conventional AGRprocess, which is beneficial for further Klaus plant. Due to the high CO2 removal rate, the regeneratorof two-stage flash process (3.9 × 10⁹ kJ·h−1) has less energy consumption than traditional acid gasprocess (6.5 × 10⁹ kJ·h−1). Even though the combination process of traditional process and acid gasenrichment process (71.36%) has higher CO2 removal rate than two-stage flash process (60.30%),the combination process of traditional process and acid gas enrichment process (2.05 × 10⁵ kmol·h−1)has more MDEA consumption than two-stage flash process (1.935 × 10⁵ kmol·h−1), and the acid gasenrichment regenerator has extra energy consumption (3.07 × 10⁹ kJ·h−1).The total energy consumption

Energies 2019, 12, 4213 7 of 14
of two-stage flash process (6.77 × 10⁹ kJ·h−1) is less than combination process of traditional processand acid gas enrichment process (8.89 × 10⁹ kJ·h−1).
Table 6. The simulation results and comparison of energy consumption of different acid gasremoval processes.
Parameters Traditional AGR Process Two-Stage FlashingProcess of AGR
The Combination of theAGR and AGE Processes
CO2 removal rate/% 13.86 60.30 71.36Regenerator vapor CO2 composition/mol% 46.73 19.32 46.73Regenerator vapor H2S composition/mol% 39.17 64.09 39.17
H2S removal rate/% 92.45 97.92 92.451st absorber MDEA flow rate/kmol·h−1 1.80 × 10⁵ 1.80 × 10⁵ 1.80 × 10⁵
HC flash absorber MDEA flow rate/kmol·h−1 731 731 731AGE MDEA flow rate/kmol·h−1 / 1.35 × 10⁴ 2.5 × 10⁴
2nd flash heater duty/kJ·h−1 9.1 × 10⁸ 8.7 × 10⁸ 9.1 × 10⁸
2nd flash air cooler duty/kJ·h−1 / 4.4 × 10⁸ /
Regenerator reboiler duty/kJ·h−1 3.7 × 10⁹ 2.10 × 10⁹ 5.38 × 10⁹
Regenerator condenser duty/kJ·h−1 2.8 × 10⁹ 1.80 × 10⁹ 4.19 × 10⁹
AGE regenerator reboiler duty/ kJ·h−1 / / 1.68 × 10⁹
AGE regenerator condenser duty/kJ·h−1 / / 1.39 × 10⁹
Pump duty/kW 1.65 × 10⁴ 1.67 × 10⁴ 1.68 × 10⁴
Rich solvent cooler duty/kJ·h−1 1.48 × 10⁹ 1.56 × 10⁹ 1.76 × 10⁹
Total electric energy/kW 1.65 × 10⁴ 1.67 × 10⁴ 1.68 × 10⁴
Total utilities energy/kJ·h−1 8.89 × 10⁹ 6.77 × 10⁹ 15.31 × 10⁹
Table 7. The cost of different acid gas removal processes.
Parameters Traditional AGR Process Two-Stage FlashingProcess of AGR
The Combination of theAGR and AGE Process
Cooling water unit cost/$ t−1 0.01Cooling water flow rate/kg h−1 2.058 × 10⁸ 9.659 × 10⁷ 2.873 × 10⁸
Cooling water total cost/$ h−1 2058 965.9 2873LP stream unit cost/$ t−1 16.02
LP stream flow rate/kg h−1 2.11 × 10⁶ 1.886 × 10⁶ 2.876 × 10⁶
LP stream cost/$ h−1 3.38 × 10⁵ 3.02 × 10⁵ 4.60 × 10⁵
Electric energy unit cost/$ (kWh)−1 0.07Electric energy/kW 1.65 × 10⁴ 1.67 × 10⁴ 1.68 × 10⁴
Electric energy total cost/$ h−1 1155 1167 1176Total Utilities cost/$ h−1 3.41 × 10⁵ 3.04 × 10⁵ 4.64 × 10⁵
Equipment cost/$ h−1 2.5 3.25 4.25Maintenance cost/$ h−1 0.125 0.1625 0.2125
Labor cost/$ h−1 15Total cost/$ h−1 3.41 × 10⁵ 3.04 × 10⁵ 4.64 × 10⁵
Separation cost/ $ kmol−1 10.3 9.2 13.9
Compared with these acid gas removal processes, even though the two-stage has a 2nd absorber,the equipment cost is slightly higher than traditional process. The two-stage flash process couldsharply reduce the total utilities cost, thus leading to the lowest separation cost (0.92 $·kmol−1), and thecombination of the AGR and AGE processes has the AGE process than traditional AGR process, so theseparation cost (13.9 $·kmol−1) is the highest.
4. Discussion
The Aspen HYSYS sensitivity analysis function is used to evaluate the influence of differentoperational parameters in the two-stage acid gas removal process.
4.1. The Effects of MDEA Flow Rate on the Process Performance
4.1.1. First Absorber
The MDEA flow rate is a key factor for the three absorbers to absorb acid gas. The purpose of theanalysis is to optimize the MDEA flow rate, to make the 1st absorber sweet gas reach the standard and

Energies 2019, 12, 4213 8 of 14
hydrocarbon flash absorber, 2nd absorber, absorb more acid gas. The effect of MEDA flow rate on thefinal sweet gas H2S and CO2 composition was studied, and results were shown in Figure 3a.
Energies 2019, 12, x FOR PEER REVIEW 8 of 15
stage flash process (6.77 × 10⁹ kJ·h−1) is less than combination process of traditional process and acid gas enrichment process (8.89 × 10⁹ kJ·h−1).
Compared with these acid gas removal processes, even though the two-stage has a 2nd absorber, the equipment cost is slightly higher than traditional process. The two-stage flash process could sharply reduce the total utilities cost, thus leading to the lowest separation cost (0.92 $·kmol−1), and the combination of the AGR and AGE processes has the AGE process than traditional AGR process, so the separation cost (13.9 $·kmol−1) is the highest.
4. Discussion
The Aspen HYSYS sensitivity analysis function is used to evaluate the influence of different operational parameters in the two-stage acid gas removal process.
4.1. The Effects of MDEA Flow Rate on the Process Performance
4.1.1. First Absorber
The MDEA flow rate is a key factor for the three absorbers to absorb acid gas. The purpose of the analysis is to optimize the MDEA flow rate, to make the 1st absorber sweet gas reach the standard and hydrocarbon flash absorber, 2nd absorber, absorb more acid gas. The effect of MEDA flow rate on the final sweet gas H2S and CO2 composition was studied, and results were shown in Figure 3a.
Figure 3. The effect of MDEA flow rate on different section.
As the basic case, the 1st absorber pressure is set as 8500 kPa, and the MDEA flow rate are varied from 1.5 × 10⁵ to 2.0 × 10⁵ kmol·h−1. It was found that the H2S concentration dramatically decreases with MEDA flow rate increasing at a lower flow rate range. Further increases the MDEA flow from 1.75 × 10⁵ to 2.0 × 10⁵ kmol·h−1 have limited effect on reducing H2S composition in the sweet gas. On the other hand, the CO2 concentration decreases lineally while MEDA flow rate increases. A MDEA flow rate higher than 1.75 × 10⁵ kmol·h−1 could ensure a CO2 content lower than 2%.
4.1.2. Hydrocarbons Flash Section
Figure 3. The effect of MDEA flow rate on different section.
As the basic case, the 1st absorber pressure is set as 8500 kPa, and the MDEA flow rate are variedfrom 1.5 × 10⁵ to 2.0 × 10⁵ kmol·h−1. It was found that the H2S concentration dramatically decreaseswith MEDA flow rate increasing at a lower flow rate range. Further increases the MDEA flow from1.75 × 105 to 2.0 × 10⁵ kmol·h−1 have limited effect on reducing H2S composition in the sweet gas.On the other hand, the CO2 concentration decreases lineally while MEDA flow rate increases. A MDEAflow rate higher than 1.75 × 10⁵ kmol·h−1 could ensure a CO2 content lower than 2%.
4.1.2. Hydrocarbons Flash Section
MEDA was also used in hydrocarbon flash section, thus the effect of MEDA flow rate on CO2 gas2 composition and CO2 recovery rate was studied and results are shown in Figure 3b.
Hydrocarbons flash section aims to remove hydrocarbons and absorb acid gas, so with the increaseof the MDEA flow rate, more acid gas can be absorbed while more hydrocarbons also can be absorbedinto rich solvent. Hydrocarbons flash temperature and pressure are 63 ◦C and 500 kPa; the MDEAflow rates are varied from 100 to 1000 kmol·h−1. Figure 3b shows that the compositions of H2S andCO2 decrease as the MDEA flow rate increases, while the MDEA flow rate reaches 700 kmol·h−1,the flow rates of H2S and CO2 stabilize at 16 kmol·h−1 and 0 kmol·h−1; and hydrocarbons recovery inhydrocarbons flash section decreases with the increase of MDEA flow rate.
4.1.3. Acid Gas Enrichment Section
The effect of MEDA flow rate on acid gas enrichment section was also studied, and results arepresented in Figure 3c.
The temperature and pressure of 2nd absorber gas feed is 60 ◦C and 300 kPa; the MDEA flowrates are varied from 1.00 × 10⁵ to 1.45 × 10⁵ kmol·h−1. Figure 3c shows that increasing MDEA flowrate increases the CO2 composition in the enriched CO2 gas flow, while H2S concentration decreases.In addition, increasing MDEA flow rate also resulted in a slight decrease in CO2 recovery rate.

Energies 2019, 12, 4213 9 of 14
4.2. The Effects of Temperature on Process Performance
Temperature is the crucial factor for the flash temperature, the change of temperature onabsorption section have little effect, so this paper did not list the sensitivity analysis results, but thechange of temperature has large influence on other sections, especially the 2nd flash temperature.Therefore, the effect on temperature on different sections were studied and results were shown below.
4.2.1. Hydrocarbons Flash Section
In the hydrocarbons flash section, MDEA flow rate is set as 730 kmol·h−1, and the hydrocarbonsflash pressure is set as 500 kPa. The hydrocarbons flash temperature is varied from 323.15 to 368.15 K.Figure 4a shows that, as the operation temperature increases, the flow rate of H2S and CO2 areboth increases, while increasing T is more effective in promoting CO2 flow rate than H2S flow rate.On the other hand, increasing temperature also increased the hydrocarbon recovery rate. A possibleexplanation can be that at higher temperature conditions, the hydrocarbon solubility in the liquidabsorber decreases, thus resulting in a higher hydrocarbon recovery rate.Energies 2019, 12, x FOR PEER REVIEW 10 of 15
Figure 4. The effect of temperature on different section and duty.
4.2.2. Acid Gas Enrichment Section
From the Figure 4b, as the 2nd flash temperature increases, CO2 composition in enriched CO2 gas first decreases while the H2S composition increases; when 2nd flash temperature reaches 413.15 K, CO2 composition in enriched CO2 gas starts to increase while the H2S composition decreases; meanwhile, the CO2 recovery rate reaches the maximum 87.17% when the temperature is 413.15 K.
At the beginning, more CO2 and H2S enter enriched CO2 gas, meanwhile the total enriched CO2 flow rate also increases, so the CO2 in enriched CO2 remains steady while the total CO2 flow rate increases, and CO2 recovery in acid gas enrichment section also increases. With the increase of the 2nd temperature, more acid gas enters into 2nd absorber. Because MDEA flow rate is constant, more H2S enters into enriched CO2 gas, which causes the H2S composition in enriched CO2 to increase. When the temperature reaches 413.15 K, more H2O enters into the 2nd absorber, which causes the H2O composition in enriched CO2 gas to increase so that the compositions of H2S and CO2 in enriched CO2 gas decrease.
4.2.3. Regeneration Section
Figure 4c shows that as the 2nd flash temperature increases, the CO2 and H2S compositions in desorbed H2S gas first decrease, then the compositions of CO2 and H2S start to increase when the temperature reaches 413.15 K.
Based on the results of Figure 4b, when temperature is lower than 413.15 K, more H2S and CO2 enter into enriched CO2 gas, so that the concentrations of H2S and CO2 in regenerator feed decrease, which can lead to the decrease of H2S and CO2 compositions in desorbed H2S and total H2S recovery. When temperature is higher than 413.15 K, more H2S and some CO2 is absorbed, so the concentrations of H2S and CO2 in regenerator feed increase, which can lead to the increase of H2S and CO2 compositions in desorbed H2S and total H2S recovery.
Figure 4. The effect of temperature on different section and duty.
4.2.2. Acid Gas Enrichment Section
From the Figure 4b, as the 2nd flash temperature increases, CO2 composition in enrichedCO2 gas first decreases while the H2S composition increases; when 2nd flash temperature reaches413.15 K, CO2 composition in enriched CO2 gas starts to increase while the H2S composition decreases;meanwhile, the CO2 recovery rate reaches the maximum 87.17% when the temperature is 413.15 K.
At the beginning, more CO2 and H2S enter enriched CO2 gas, meanwhile the total enrichedCO2 flow rate also increases, so the CO2 in enriched CO2 remains steady while the total CO2 flowrate increases, and CO2 recovery in acid gas enrichment section also increases. With the increase ofthe 2nd temperature, more acid gas enters into 2nd absorber. Because MDEA flow rate is constant,more H2S enters into enriched CO2 gas, which causes the H2S composition in enriched CO2 to increase.When the temperature reaches 413.15 K, more H2O enters into the 2nd absorber, which causes the H2Ocomposition in enriched CO2 gas to increase so that the compositions of H2S and CO2 in enriched CO2
gas decrease.

Energies 2019, 12, 4213 10 of 14
4.2.3. Regeneration Section
Figure 4c shows that as the 2nd flash temperature increases, the CO2 and H2S compositions indesorbed H2S gas first decrease, then the compositions of CO2 and H2S start to increase when thetemperature reaches 413.15 K.
Based on the results of Figure 4b, when temperature is lower than 413.15 K, more H2S andCO2 enter into enriched CO2 gas, so that the concentrations of H2S and CO2 in regenerator feeddecrease, which can lead to the decrease of H2S and CO2 compositions in desorbed H2S and total H2Srecovery. When temperature is higher than 413.15 K, more H2S and some CO2 is absorbed, so theconcentrations of H2S and CO2 in regenerator feed increase, which can lead to the increase of H2S andCO2 compositions in desorbed H2S and total H2S recovery.
4.2.4. Duty of Exchangers and Regeneration
From the Figure 4d, the duties of 2nd flash heater and air cooler have increased as 2nd flashtemperature increases. Meanwhile the reboiler and condenser increase first upon increasing 2nd flashtemperature, then increase when 2nd flash temperature reaches 413.15 K.
When temperature is lower than 413.15 K, more H2S and CO2 enter into enriched CO2 gas, so thatthe concentration of H2S and CO2 in regenerator feed decrease, which can lead to the decrease of dutyof reboiler and condenser. When temperature is higher than 413.15 K, more H2S and some CO2 areabsorbed, so the concentrations of H2S and CO2 in regenerator feed increase, which can lead to theincrease of reboiler and condenser duty.
4.3. The Effects of Pressure on Process Performance
Pressure is an influencing factor for this process, especially the 2nd flash pressure; this paperanalyzes the pressure of hydrocarbons flash section and acid gas enrichment section.
In the sensitivity analysis of the effect of flash temperature on acid gas enrichment section andregeneration section, MDEA flow rate is 13,500 kmol·h−1, and the hydrocarbons flash temperature is130 ◦C, and 2nd absorber pressure is 300 kPa; the 2nd flash pressure are varied from 300 to 380 kPa.The results of sensitivity analysis are shown in Figure 5.
Energies 2019, 12, x FOR PEER REVIEW 11 of 15
4.2.4. Duty of Exchangers and Regeneration
From the Figure 4d, the duties of 2nd flash heater and air cooler have increased as 2nd flash temperature increases. Meanwhile the reboiler and condenser increase first upon increasing 2nd flash temperature, then increase when 2nd flash temperature reaches 413.15 K.
When temperature is lower than 413.15 K, more H2S and CO2 enter into enriched CO2 gas, so that the concentration of H2S and CO2 in regenerator feed decrease, which can lead to the decrease of duty of reboiler and condenser. When temperature is higher than 413.15 K, more H2S and some CO2 are absorbed, so the concentrations of H2S and CO2 in regenerator feed increase, which can lead to the increase of reboiler and condenser duty.
4.3. The Effects of Pressure on Process Performance
Pressure is an influencing factor for this process, especially the 2nd flash pressure; this paper analyzes the pressure of hydrocarbons flash section and acid gas enrichment section.
In the sensitivity analysis of the effect of flash temperature on acid gas enrichment section and regeneration section, MDEA flow rate is 13,500 kmol·h−1, and the hydrocarbons flash temperature is 130 °C, and 2nd absorber pressure is 300 kPa; the 2nd flash pressure are varied from 300 to 380 kPa. The results of sensitivity analysis are shown in Figure 5.
4.3.1. Hydrocarbons Flash Section
As shown in Figure 5a, with the increase of 1st flash pressure, the concentration of H2S and CO2 in sweet gas stabilizes at 0 and around 25 kmol·h−1, and hydrocarbons recovery rate is also stable at around 92%.
Because the pressure has little effect on the composition of the hydrocarbons flash vapor, and the hydrocarbons flash temperature, and pressure of the hydrocarbons flash absorber is constant, the change of hydrocarbons flash pressure has no effect on the concentration of H2S and CO2 in sweet gas and the hydrocarbons recovery rate.
Figure 5. The effect of pressure on different section and duty.
4.3.2. Acid Gas Enrichment Section
Figure 5. The effect of pressure on different section and duty.

Energies 2019, 12, 4213 11 of 14
4.3.1. Hydrocarbons Flash Section
As shown in Figure 5a, with the increase of 1st flash pressure, the concentration of H2S and CO2
in sweet gas stabilizes at 0 and around 25 kmol·h−1, and hydrocarbons recovery rate is also stable ataround 92%.
Because the pressure has little effect on the composition of the hydrocarbons flash vapor, and thehydrocarbons flash temperature, and pressure of the hydrocarbons flash absorber is constant, the changeof hydrocarbons flash pressure has no effect on the concentration of H2S and CO2 in sweet gas and thehydrocarbons recovery rate.
4.3.2. Acid Gas Enrichment Section
As shown in Figure 5b, with the 2nd flash pressure increase, the compositions of CO2 and H2S inenriched CO2 gas and CO2 recovery rate are basically stable.
With the increase of the 2nd pressure, the CO2 and H2S compositions in 2nd absorber feedflow decrease; H2S is basically absorbed by MDEA, and most CO2 enters into enriched CO2 gas,which causes the compositions of CO2 and H2S in enriched CO2 gas and CO2 recovery rate to bebasically stable.
4.3.3. Regeneration Section
As shown in Figure 5c, with the increase of 2nd flash pressure, H2S composition has been increasingwhile CO2 composition is stable at around 61.5%, and the H2S recovery rate has been decreasing.
With the increase of the 2nd pressure, more rich solvent enters into regenerator, more H2S andH2O will enter into desorbed H2S gas, which causes the H2S composition of desorbed H2S gas toincrease; because the increase of H2O in desorbed H2S gas, the H2S recovery decreases.
4.3.4. Duty of Exchangers and Regeneration
From Figure 5d, it can be indicated that as the increase of pressure, the duty of 2nd flash heaterand 2nd flash air cooler decrease while the regenerator duty increase.
With the increase of the 2nd pressure, less 2nd flash gas enters into 2nd absorber, which causes theduties of 2nd flash heater and 2nd flash air cooler to decrease, and more acid gas enters into regenerator,which causes regenerator duty increase.
4.4. The Effects of Other Parameters on Process Performance
There are some other factors in this process, and some sensitivity analyses are shown in Figure 6.
Energies 2019, 12, x FOR PEER REVIEW 12 of 15
As shown in Figure 5b, with the 2nd flash pressure increase, the compositions of CO2 and H2S in enriched CO2 gas and CO2 recovery rate are basically stable.
With the increase of the 2nd pressure, the CO2 and H2S compositions in 2nd absorber feed flow decrease; H2S is basically absorbed by MDEA, and most CO2 enters into enriched CO2 gas, which causes the compositions of CO2 and H2S in enriched CO2 gas and CO2 recovery rate to be basically stable.
4.3.3. Regeneration Section
As shown in Figure 5c, with the increase of 2nd flash pressure, H2S composition has been increasing while CO2 composition is stable at around 61.5%, and the H2S recovery rate has been decreasing.
With the increase of the 2nd pressure, more rich solvent enters into regenerator, more H2S and H2O will enter into desorbed H2S gas, which causes the H2S composition of desorbed H2S gas to increase; because the increase of H2O in desorbed H2S gas, the H2S recovery decreases.
4.3.4. Duty of Exchangers and Regeneration
From Figure 5d, it can be indicated that as the increase of pressure, the duty of 2nd flash heater and 2nd flash air cooler decrease while the regenerator duty increase.
With the increase of the 2nd pressure, less 2nd flash gas enters into 2nd absorber, which causes the duties of 2nd flash heater and 2nd flash air cooler to decrease, and more acid gas enters into regenerator, which causes regenerator duty increase.
4.4. The Effects of Other Parameters on Process Performance
There are some other factors in this process, and some sensitivity analyses are shown in Figure 6.
Figure 6. The effect of other parameters on regeneration section.
As shown in Figure 6a, increasing reflux ratio significantly increases the H2S composition in the H2S gas flow and H2S recovery rate. As the reflux ratio increased to a value of 0.8, the H2S recovery rate was approaching 100%, denoting that almost all the H2S moved to the gas phase; thus, further increasing the reflux ratio has a negligible effect on changing the H2S gas flow composition.
It is known that changing vapor flow rate could also influence the H2S gas composition and H2S recovery rate. The effect of vapor flow rate was studied and results are shown in Figure 6b. Based on the results, it is clear that increasing vapor flow rate could reduce both CO2 and H2S composition in the H2S gas, while it could also slightly increase the H2S recovery.
In this section, Aspen HYSYS sensitivity was used to evaluate the influence of different operating parameters in two-stage flashing process of acid gas removal. It can be indicated that (1) temperature is the most important parameter in this novel AGR process, especially the 2nd flash temperature, as
Figure 6. The effect of other parameters on regeneration section.
Energies 2019, 12, 4213 12 of 14
As shown in Figure 6a, increasing reflux ratio significantly increases the H2S composition in theH2S gas flow and H2S recovery rate. As the reflux ratio increased to a value of 0.8, the H2S recoveryrate was approaching 100%, denoting that almost all the H2S moved to the gas phase; thus, furtherincreasing the reflux ratio has a negligible effect on changing the H2S gas flow composition.
It is known that changing vapor flow rate could also influence the H2S gas composition and H2Srecovery rate. The effect of vapor flow rate was studied and results are shown in Figure 6b. Based onthe results, it is clear that increasing vapor flow rate could reduce both CO2 and H2S composition inthe H2S gas, while it could also slightly increase the H2S recovery.
In this section, Aspen HYSYS sensitivity was used to evaluate the influence of different operatingparameters in two-stage flashing process of acid gas removal. It can be indicated that (1) temperatureis the most important parameter in this novel AGR process, especially the 2nd flash temperature, as itcan influence the CO2 removal rate and the regenerator energy consumption. From the sensitivityresults, it can be indicated that the best 2nd flash temperature is 413.15 K. (2) MDEA flow rate isanother important parameter, the novel AGR process has one more absorber than traditional AGRprocess, so the MDEA can influence the acid gas content in sweet gas, flash gas, and 2nd absorbervapor. The best 2nd absorber MDEA flow rate is 1.35 × 10⁵ kmol·h−1. (3) Reflux ratio and vaporflow rate of regenerator can influence the H2S recovery rate; the reflux ratio and vapor flow rate ofregenerator are 0.8 and 2200 kmol·h−1. (4) From the pressure sensitivity, pressure has little influence inthis novel AGR process.
This paper simulates traditional acid gas removal process and novel two stage process andoptimizes some of the operating parameters, but this novel two stage process is only suitable forhigh C/S ratio natural gas, and in future works, this novel process can consider natural gas C/Sratio approximate range, amine solvent type, and composition. Compared to the conventional AGRprocesses, even though this two-stage acid gas removal process has slightly higher equipment cost andmaintenance cost, it has much less energy consumption than traditional AGR process; thus, it couldreduce up to more than 10% separation cost. It has been reported that the membrane separation canseparate acid gas more efficiently, so future work could study the energy consumption and separationcost of using membrane separation technology in AGR process.
5. Conclusions
In order to reduce the investment, operational cost, and energy consumption of a natural gasprocessing facility using high carbon to sulfur ratio natural gases as raw materials, this paper presentsa novel two-stage flashing process for acid gas removal based on traditional acid gas removal. By usingAspen HYSYS, this paper simulated different acid gas removal processes, using the sensitivity analysisfunction in Aspen HYSYS to analyze the influence of the different operating parameters in two-stageflashing process of acid gas removal. The results indicate that the process can reach the standards andenrich the acid gas. Below are several conclusions which can be drawn from this study.
1. This novel acid gas removal process is suitable for acid gas removal with high carbon to sulfurratio; the content of CO2 is lower than 2%, and the content of H2S is lower than 20 mg·m−3.The CO2 removal rate is 77% in acid gas enrichment section, and it can remove lots of CO2 inthis section.
2. Compared with traditional acid gas removal process and traditional acid gas enrichment process,two-stage flash process of acid gas removal can enrich acid gas and reduce the regeneratorenergy consumption. It can be indicated that two-stage flash process of acid gas removal has2.2 × 109 kJ·h−1 less energy consumption than traditional acid gas removal process, and the totalenergy of two-stage flash process of acid gas removal is less 8.54 × 10⁹ kJ·h−1 than combinationprocess of traditional process and acid gas enrichment process.
3. Compared with these acid gas removal processes, two-stage flash process has the lowest separationcost (0.92 $·kmol−1), and the combination of the AGR and AGE process has the AGE process than

Energies 2019, 12, 4213 13 of 14
traditional AGR process, so the separation cost (13.9 $·kmol−1) is the highest. Because two-stagehas a 2nd absorber, the equipment cost is higher than traditional process.
4. The acid gas enrichment section adopts a two-stage flashing process. The 1st flashing sectionseparates most CO2 and some H2S into the rich solvent. The 2nd flashing section separates waterand acid gas to reduce the vapor loading of 2nd absorber. The 2nd absorber section absorbs H2Sfrom the acid gas. By using Aspen HYSYS sensitivity analysis, we analyzed the main operatingparameters, especially the 2nd flashing pressure and temperature. According to the results, it wasfound that the optimal 2nd flashing pressure and temperature should be 413.15 K and 300 kPa.
Author Contributions: Conceptualization, Y.D., H.L.; methodology, Y.D., Y.P.; software, Y.D., Y.P.; resources, H.L.;data curation, H.L., Y.Q.; writing—original draft preparation, Y.D., Y.P., Y.Q., H.L.; writing—review and editing,Y.D., Y.P., Y.Q., H.L.
Funding: This research was funded by National Natural Science Foundation of China, grant No. 21706220.
Conflicts of Interest: The authors declare no conflict of interest.
References
1. Mac Kinnon, M.A.; Brouwer, J.; Samuelsen, S. The role of natural gas and its infrastructure in mitigatinggreenhouse gas emissions, improving regional air quality, and renewable resource integration. Prog. EnergyCombust. Sci. 2018, 64, 62–92. [CrossRef]
2. Castaneda, C.J. Historica overview of the natural gas industry a2—Dellasala, dominick a. In Encyclopedia ofthe Anthropocene; Goldstein, M.I., Ed.; Elsevier: Oxford, UK, 2018; pp. 63–73.
3. Das, S.K.; Wang, X.; Ostwal, M.M.; Lai, Z. A highly stable microporous covalent imine network adsorbent fornatural gas upgrading and flue gas CO2 capture. Sep. Purif. Technol. 2016, 170, 68–77. [CrossRef]
4. Faiz, R.; Al-Marzouqi, M. Insights on natural gas purification: Simultaneous absorption of CO2 and H2Susing membrane contactors. Sep. Purif. Technol. 2011, 76, 351–361. [CrossRef]
5. Abotaleb, A.; El-Naas, M.H.; Amhamed, A. Enhancing gas loading and reducing energy consumption in acidgas removal systems: A simulation study based on real ngl plant data. J. Nat. Gas Sci. Eng. 2018, 55, 565–574.[CrossRef]
6. Halim, H.N.A.; Shariff, A.M.; Bustam, M.A. High pressure CO2 absorption from natural gas using piperazinepromoted 2-amino-2-methyl-1-propanol in a packed absorption column. Sep. Purif. Technol. 2015, 152, 87–93.[CrossRef]
7. Alcheikhhamdon, Y.; Hoorfar, M. Natural gas purification from acid gases using membranes: A review ofthe history, features, techno-commercial challenges, and process intensification of commercial membranes.Chem. Eng. Process. Process Intensif. 2017, 120, 105–113. [CrossRef]
8. Zhimin, H.; Zhigang, T.; Ataeivarjovi, E.; Dong, G.; Zhijun, Z.; Hongwei, L. Study on polydimethylsiloxanedesorption membrane of CO2—Dimethyl carbonate system. Energy Procedia 2017, 118, 210–215. [CrossRef]
9. Thanakunpaisit, N.; Jantarachat, N.; Onthong, U. Removal of hydrogen sulfide from biogas using lateritematerials as an adsorbent. Energy Procedia 2017, 138, 1134–1139. [CrossRef]
10. Jiao, W.; Ban, Y.; Shi, Z.; Jiang, X.; Li, Y.; Yang, W. Gas separation performance of supported carbon molecularsieve membranes based on soluble polybenzimidazole. J. Membr. Sci. 2017, 533, 1–10. [CrossRef]
11. Maqsood, K.; Ali, A.; Shariff, A.B.M.; Ganguly, S. Process intensification using mixed sequential andintegrated hybrid cryogenic distillation network for purification of high CO2 natural gas. Chem. Eng. Res.Des. 2017, 117, 414–438. [CrossRef]
12. Pellegrini, L.A.; Moioli, S.; Gamba, S. Energy saving in a CO2 capture plant by mea scrubbing. Chem. Eng.Res. Des. 2011, 89, 1676–1683. [CrossRef]
13. Gupta, A.K.; Ibrahim, S.; Shoaibi, A.A. Advances in sulfur chemistry for treatment of acid gases. Prog. EnergyCombust. Sci. 2016, 54, 65–92. [CrossRef]
14. Abu-Zahra, M.R.M.; Schneiders, L.H.J.; Niederer, J.P.M.; Feron, P.H.M.; Versteeg, G.F. CO2 capture frompower plants: Part i. A parametric study of the technical performance based on monoethanolamine. Int. J.Greenh. Gas Control 2007, 1, 37–46. [CrossRef]

Energies 2019, 12, 4213 14 of 14
15. Van Duc Long, N.; Lee, M. Novel acid gas removal process based on self-heat recuperation technology. Int. J.Greenh. Gas Control 2017, 64, 34–42. [CrossRef]
16. Zhao, B.; Liu, F.; Zheng, C.; Liu, C.; Yue, H.; Tang, S.; Liu, Y.; Lu, H.; Liang, B.J.A.E. Enhancing the energeticefficiency of mdea/pz-based CO2 capture technology for a 650 mw power plant: Process improvement.Appl. Energy 2017, 185, 362–375. [CrossRef]
17. Gutierrez, J.P.; Benitez, L.A.; Ruiz, E.L.A.; Erdmann, E. A sensitivity analysis and a comparison of twosimulators performance for the process of natural gas sweetening. J. Nat. Gas Sci. Eng. 2016, 31, 800–807.[CrossRef]
18. Roy, P.S.; Amin, M.R. Aspen-Hysys simulation of natural gas processing plant. J. Chem. Eng. 2012, 26, 62–65.[CrossRef]
19. Mohamadirad, R.; Hamlehdar, O.; Boor, H.; Monnavar, A.F.; Rostami, S. Mixed amines application in gassweetening plants. Chem. Eng. Trans. 2011, 24, 265–270.
20. Fouad, W.A.; Berrouk, A.S. Using mixed tertiary amines for gas sweetening energy requirement reduction.J. Nat. Gas Sci. Eng. 2013, 11, 12–17. [CrossRef]
21. Alobaid, F.; Mertens, N.; Starkloff, R.; Lanz, T.; Heinze, C.; Epple, B. Progress in dynamic simulation ofthermal power plants. Prog. Energy Combust. Sci. 2017, 59, 79–162. [CrossRef]
22. Chemmangattuvalappil, N.; Chong, S. Chapter 11—Basics of process simulation with aspen hysys. In ChemicalEngineering Process Simulation; Elsevier: Amsterdam, The Netherlands, 2017; pp. 233–252.
23. Cummings, A.L.; Smith, G.D.; Nelsen, D.K. Advances in amine reclaiming–Why there‘s no excuse to operatea dirty amine system. In Proceedings of the Laurance Reid Gas Conditioning Conference, Norman, OK,USA, 25–28 February 2007.
24. Banat, F.; Younas, O.; Didarul, I. Energy and exergical dissection of a natural gas sweetening plant usingmethyldiethanol amine (mdea) solution. J. Nat. Gas Sci. Eng. 2014, 16, 1–7. [CrossRef]
25. Sadegh, N.; Stenby, E.H.; Thomsen, K. Thermodynamic modelling of acid gas removal from natural gasusing the extended uniquac model. Fluid Phase Equilibria 2017, 442, 38–43. [CrossRef]
26. Alfadala, H.E.; Al-Musleh, E. Simulation of an acid gas removal process using methyldiethanolamine;an equilibrium approach. In Proceedings of the 1st Annual Gas Processing Symposium; Elsevier: Amsterdam,The Netherlands, 2009; Volume 1, pp. 256–265.
© 2019 by the authors. Licensee MDPI, Basel, Switzerland. This article is an open accessarticle distributed under the terms and conditions of the Creative Commons Attribution(CC BY) license (http://creativecommons.org/licenses/by/4.0/).