Embed Size (px)
Citation preview
1 NASA Techn ica I Paper 2880
I 1 1989 I
#
National Aeronautics and Space Administration
Scientific and Technical Information Division
Technique for Temperature Compensation of Eddy- Current Proximity Probes
Robert M. Masters Lewis Research Center Cleveland, Ohio
https://ntrs.nasa.gov/search.jsp?R=19890006009 2018-04-08T01:40:00+00:00Z

Summary Eddy-current proximity probes are used in turbomachinery
evaluation testing and operation to measure distances, primarily vibration, deflection, or displacement of shafts, bearings, and seals. Measurements of steady-state conditions made with standard eddy-current proximity probes are susceptible to error caused by temperature variations during normal operation of the component under investigation. Errors resulting from temperature effects for the specific probes used in this study were approximately 1.016 x lop3 mm/"C over the temperature range of -252 to 100 "C. This report examines temperature-caused changes on the eddy-current proximity probe measurement system, establishes their origin, and discusses what may be done to minimize their effect on the output signal. In addition, recommendations are made for the installation and operation of the electronic components associated with an eddy-current proximity probe. Several techniques are described that provide active on-line error compensation for over 95 percent of the temperature effects.
Background The eddy-current proximity probe is a valuable tool used
extensively in the evaluation and monitoring of rotating machinery (refs. 1 and 2). It is used to measure clearances, material growth, vibration, and other distance-dependent information. The eddy-current proximity probe is a commercial device which uses a wire loop as the active element in a radiofrequency-tuned circuit. As the loop is brought close to a metallic object, the impedance of the coil is varied. This produces a change in the detected output of the tuned circuit. The complete measurement system is calibrated with a specific target material to obtain a distance-versus-output calibration curve.
Typical applications for which eddy-current proximity probes are used include monitoring large turbomachinery operating at constant conditions for long periods. Generally the eddy-current proximity probes in these applications monitor large displacements, typically on the order of 0.254 mm. Because of the constant operating conditions, temperature variations are small and the resultant error is normally ignored.
Eddy-current proximity probes are also used extensively in the testing of high-speed rocket engine turbopumps and
I
component parts such as shafts, bearings, and seals. In these applications closer tolerances are typical and distances of concern are much smaller. These pumps are operated with cryogenic fluids, and temperature variations can cause significant errors in proximity probe measurements. In an ideal situation, temperature changes would be detected and readings compensated for immediate use.
The temperature-caused error in the eddy-current proximity probe is a result of the varying resistance of the active coil. The resistance has an effect on the impedance Z of a series tuned resistance, inductance, capacitance (RLC) circuit as shown by the following equation:
z = .\/R* + (X, - x,p where R is circuit resistance, X, is capacitive reactance, and X, is inductive reactance. Temperature changes will vary the circuit resistance and produce a corresponding change in the level of the RLC circuit output which will be considered an error for this report.
This error is recognized but is usually accounted for only after a test run has been completed and a compensation factor applied to the data. To speed up the correction process, a method of compensation was devised to provide an accurate real-time indication of the corrected readings. This report describes the temperature corrections required to provide the desired real-time corrected output.
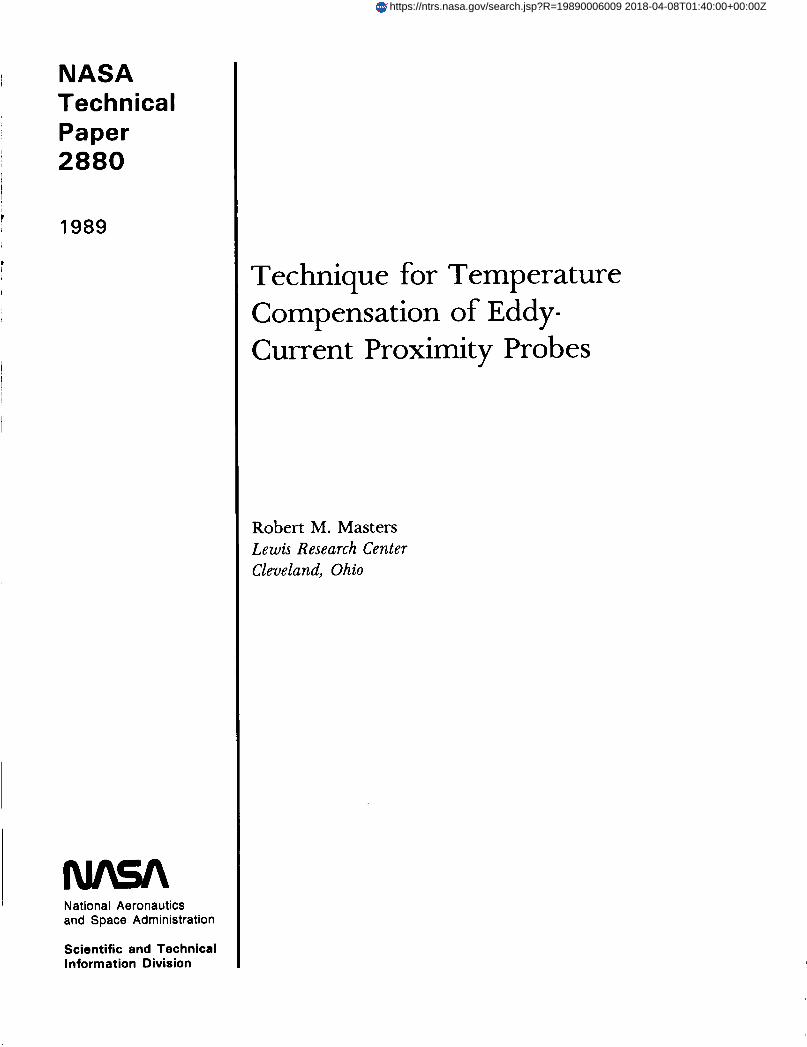
This work was instigated by tests run on the cryogenic bearing configuration shown in figure 1 and reported in reference 3. Two orthogonal proximity probes located in a bearing test fixture measured displacement of a shaft rotating about 66 OOO rpm. In this application it was imperative that both high-frequency (HF), higher than 5 Hz, and low- frequency dc-referenced (LFDC) information be retained in the output signal. The HF content is used for determining shaft resonances and balance, whereas the LFDC content is an indication of the shaft centerline. Figure 2(a) displays the HF output signal from an eddy-current proximity probe for one shaft rotation at 66 OOO rpm. The display presents the surface of the rotating shaft as seen by the eddy-current proximity probe. The shaft surface has a machined 0.03-mm notch in the probe viewing surface for use as a once-per-revolution distance calibration. The one-revolution display also indicates the shaft runout signal, which is a combination of machining and material inconsistancies that are seen by the distance probe.
1
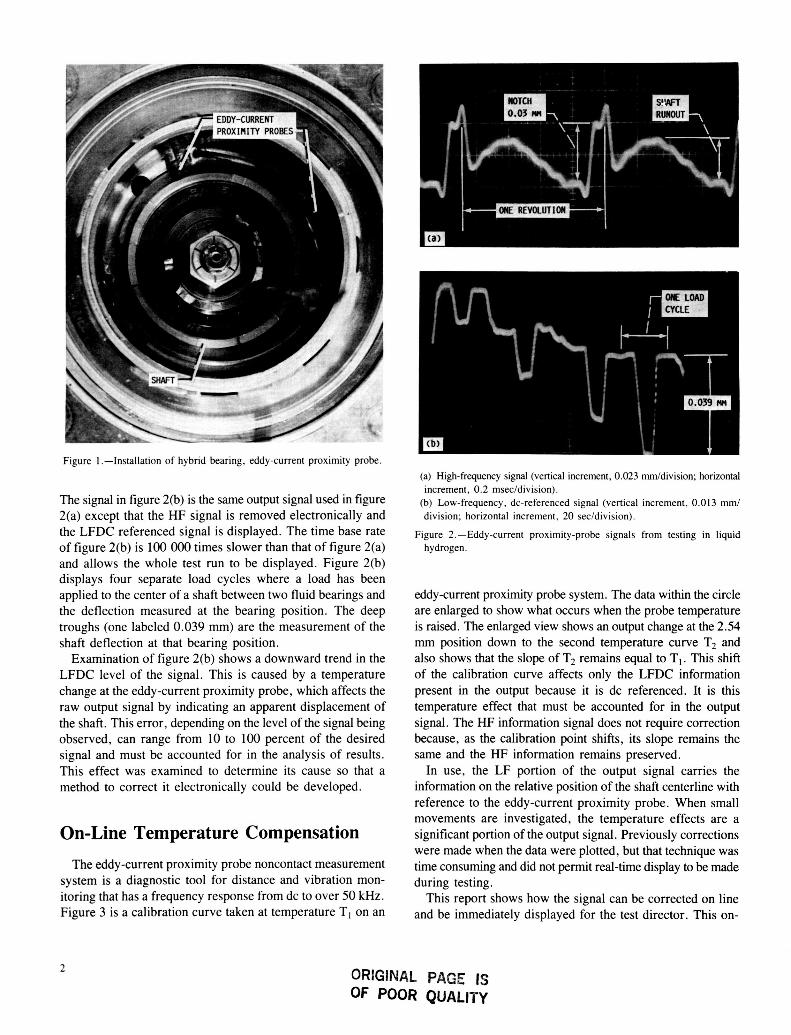
Figure 1 .-Installation of hybrid bearing, eddy-current proximity probe.
The signal in figure 2(b) is the same output signal used in figure 2(a) except that the HF signal is removed electronically and the LFDC referenced signal is displayed. The time base rate of figure 2(b) is 100 OOO times slower than that of figure 2(a) and allows the whole test run to be displayed. Figure 2 0 ) displays four separate load cycles where a load has been applied to the center of a shaft between two fluid bearings and the deflection measured at the bearing position. The deep troughs (one labeled 0.039 mm) are the measurement of the shaft deflection at that bearing position.
Examination of figure 2(b) shows a downward trend in the LFDC level of the signal. This is caused by a temperature change at the eddy-current proximity probe, which affects the raw output signal by indicating an apparent displacement of the shaft. This error, depending on the level of the signal being observed, can range from 10 to 100 percent of the desired signal and must be accounted for in the analysis of results. This effect was examined to determine its cause so that a method to correct it electronically could be developed.
On-Line Temperature Compensation The eddy-current proximity probe noncontact measurement
system is a diagnostic tool for distance and vibration mon- itoring that has a frequency response from dc to over 50 kHz. Figure 3 is a calibration curve taken at temperature TI on an
(a) High-frequency signal (vertical increment, 0.023 mddivision; horizontal
(b) Low-frequency, dc-referenced signal (vertical increment, 0.013 mm/ increment, 0.2 msec/division).
division; horizontal increment, 20 secldivision).
Figure 2.-Eddy-current proximity-probe signals from testing in liquid hydrogen.
eddycurrent proximity probe system. The data within the circle are enlarged to show what occurs when the probe temperature is raised. The enlarged view shows an output change at the 2.54 mm position down to the second temperature curve T2 and also shows that the slope of T2 remains equal to TI. This shift of the calibration curve affects only the LFDC information present in the output because it is dc referenced. It is this temperature effect that must be accounted for in the output signal. The HF information signal does not require correction because, as the calibration point shifts, its slope remains the same and the HF information remains preserved.
In use, the LF portion of the output signal carries the information on the relative position of the shaft centerline with reference to the eddy-current proximity probe. When small movements are investigated, the temperature effects are a significant portion of the output signal. Previously corrections were made when the data were plotted, but that technique was time consuming and did not permit real-time display to be made during testing.
This report shows how the signal can be corrected on line and be immediately displayed for the test director. This on-
2 ORIGINAL PAGE IS OF POOR QUALITY

r PROXIMITY ,r TEMPERATURE 1 CONTROL 1 PROBE
POWER ROOM SUPPLY
- COMPONENT UNDER TESTING
TEMPERATURE
-12 - 0.254 M Figure 4.--Installation of eddy-current proximity probe.
Proximity-Probe Conditioner Electronics Eliminating temperature effects on the measuring system
requires a stable power supply with a low temperature coefficient to power the probe conditioner electronics. The following specifications are the minimum required for the power supply used in this work:
(1) Line regulation, kO.02 percent for an input change from 105 to 125 V ac with constant load
(2) Temperature coefficient, O.O15/"C (3) Load Regulation, &0.03 percent for load change from
To provide a constant temperature environment for the power supply, the unit must be well insulated and operated until the internal temperature stabilizes. This is a particularly necessary precaution for outdoor testing applications in northeastern Ohio because temperatures in the vicinity of the conditioning electronics may vary between -10 and 90 "F with wind
> ui 4
3 W
0 >
no load to full load with constant input voltage
J 0 .2 .4 .6 .8
DISTANCE. P(M
Figure 3.-Calibration curve of eddy-current proximity-probe temperature effect.
line correction temperature compensation technique provides a corrected signal for use while a test is in progress. It also provides a distance signal that is more accurate than anything previously available for determining clearance dimensions in this type of operating equipment. Thus, on-line correction is now available for the LFDC temperature-caused effects without affecting the quality of the measurements and the frequency response of the basic measurement system.
Proximity-Probe Installation I A typical proximity-probe measurement system is shown
schematically in figure 4. The probe has a cable approximately 4 ft long and is attached to a conditioner-electronics assembly. The signal output from the conditioner electronics is sent to a control room for any further conditioning and use. There are two primary areas where errors can be initiated by temperature variations: (1) proximity-probe conditioner elec- tronics, and (2) proximity-probe impedance.
l
conditions from calm to 25 mph. These extremes introduce large errors into the output signal. When using cryogenic fluids in an application, it is also possible to have large local temperature variations caused by extremely cold fluids in the vicinity of the conditioning electronics.
In addition to the power supply the probe conditioner electronics should be housed within an insulated container. The conditioner electronics are affected by temperature changes and must be insulated to eliminate the potential of errors being added to the measurement signal. In this application a foam-insulated container was used. The power supply and the conditioner electronics may be located in the same or separate foam containers. For testing times of up to 30 min, the foam container is adequate; however, if longer runs are required, active temperature compensation should be considered in addition to thermal isolation.
These installation techniques are used to eliminate the effect of temperature on the conditioner electronics which are external to the proximity probe. The methods are simple and easy to accomplish but are very necessary to minimize errors in the measurement system.
3

A
Figure 5.-Exploded view of test fixture. (All material is 304 stainless steel.)
Probe Impedance Changes Once the probe electronics conditioning box and its power
supply are installed and insulated, the eddy-current proximity probe can be examined for temperature-caused effects. To demonstrate the correction method, the eddy-current proximity probe was installed in port 1 of the test fixture shown in figure 5. A copper-constantan (type T) thermocouple was installed in port 2. Next the probe and the thermocouple were attached to a data system that consisted of a six-digit integrating voltmeter/ ohmmeter and a personal computer. The data system was programmed to continuously sample the thermocouple voltage readings and to compare them with standard thermocouple tables of voltage and temperature to identify when a specific temper- ature had been reached. At that time the temperature reading and corresponding probe resistance were taken and stored.
The prepared fixture was placed into a dewar of liquid hydrogen, and as the temperature decreased a resistance reading was taken for each degree until the temperature reached -252 "C. The fixture was well insulated to keep the temperatures throughout the fixture uniform while the overall temperature changed from -252 to 100 "C. The fixture remained in the dewar until the hydrogen boiled off and the
l
I
temperature returned to ambient. Another complete set of readings was taken during the temperature rise. The data are plotted in figure 6 as change in resistance versus temperature. In addition the fixture was placed into an oven and the temperature raised to 100 "C and then allowed to fall back to room ambient. This was done to complete a range of temperature readings from liquid hydrogen to boiling water.
Figure 6 shows a straight line from - 175 to 100 "C. The following temperature sensitivity testing was performed within that linear range to separate the effects caused by a change in the resistance of the proximity probe and any dimensional changes caused by temperature changes of the probe and test fixture installation. The proximity probe installed in port 1 was held securely in place at an approximate distance of 0.254 mm from the target area, as was the thermocouple bead installed in port 2. Initially the test fixture was placed into an oven set to 40 "C above ambient until equilibrium was reached. The oven was turned off and the temperature fell to the ambient temperature while the data system read and stored the data at each discrete degree of temperature change.
Figure 7 shows the data obtained from the test fixture at 66 to 26 "C. The curves, which are described in the next paragraph, are labeled as follows:
4

25 r
c .1 5t -300 -200 -100 0 100 0
TEMPERATURE, OC Figure 6.-Temperature versus coil resistance change.
(1) Temperature (2) Base reading (3) Probe resistance (4) Uncorrected output (5 ) Corrected distance (6) Thermal expansion change
The temperature curve shows the time at which the oven was turned off and the temperature of the probe during this test. The base reading is the adjusted starting level of both the uncorrected output and the probe resistance curves. The base reading is the reference level to which all readings are corrected. The uncorrected output of the eddy-current proximity probe system contains the electronic error due to probe resistance variations and the change caused by probe movement due to thermal expansion changes. The value of the probe resistance or temperature reading is representative of the electronic error present in the uncorrected output reading. Corrected distance is the result of taking the uncorrected output readings and correcting them with a properly scaled correction factor based on the probe resistance or temperature reading. The thermal expansion change is the result of the coefficient of expansion on the materials in the measurement loop.
The data presented in figure 7 contain no HF information so that only the temperature effects on the LFDC information may be observed. The uncorrected output information represents an apparent change of distance from the probe to target. The test as designed allows no movement of the probe within the fixture except for what occurs because of the thermal coefficient of expansion. Since the temperature was decreasing in this test and the metal was contracting, the probe was able
0
PROBE RESISTANCE7 TEMPERATURE 7
THERMAL EXPANSION CHANGE
t TIME- OVEN OFF
Figure 7.-Steady state versus time and temperature for eddy-current proximity probe.
to move closer to the target. Nevertheless, the uncorrected output reading obtained was in a positive direction. This was because the probe resistance change had a larger positive effect on the uncorrected output than the negative thermal expansion change. The thermal expansion distance for the temperatures in this test were calculated and scaled for display in figure 7.
Data obtained during a -40 "C temperature change showed a total uncorrected output displacement of 0.044 mm. This was determined by dividing the uncorrected output voltage change of 0.34935 V by the calibrated proximity system sensitivity (0.200 V/0.02540 mm) for a change of 0.044 mm. The general shapes of the thermal expansion and probe resistance curves differ by a multiplicative constant that allows the probe resistance curves to be used to correct the uncorrected output. The probe resistance reading is scaled to provide a -0.0087 V/"C correction factor for the uncorrected output reading.
Corrections were made by using the base reading as the reference for all the corrections during that run. This was done in a personal computer by using the correction factor specified and then subtracting the results from the uncorrected output reading. The result was a corrected distance reading which would remain constant throughout the temperature change even though the probe had physically moved closer to the target and the probe resistance change had added an error to the uncorrected output.
This method for correcting the error caused by the probe resistance change and the neutralization of the thermal expansion caused by a temperature change is effective. More than 95 percent of the temperature-caused apparent changes may be corrected by this method.
5
Proximity-Probe Temperature Determination
RELAY PROBE
C"' CONDl T I ONER ELECTRONICS
r .
t TIME- OVEN OFF
Figure 8.-Combined steady state and high frequency versus time and temperature for eddy-current proximity probe (high-frequency signal shown at 1/100 normal frequency for illustration purposes).
SUM I NG CORRECTED
0 DISTANCE
Figure 8 illustrates a high-frequency signal being sensed by the proximity probe. The high-frequency signal is rep- resentative of the runout of a rotating shaft, and the normal output would be as shown in the base reading portion leading up to the temperature step. As in figure 7, the probe resistance is used as the correction signal. The uncorrected output which now carries the HF and LFDC signals is corrected by using the properly scaled probe resistance signal and is displayed as the corrected output curve. The corrected output signal shows that the temperature errors and the thermal expansion changes have been corrected and that the original dc level has been restored to the base reading reference level.
O H W T E R ELECTRON I CS
RELAY CONTROL
i
To separate the errors in this study, the temperature of the proximity probe and the fixture must be equal. This was accomplished by having the fixture and probe in a well- insulated oven to provide a long thermal time constant which allowed all the temperatures to track through the temperature change. During the test run the proximity probe was monitored to determine its temperature at all times. Two methods may be used to determine the probe temperature:
(1) Measure the resistance of the probe directly and correlate that reading to temperature and a correlation factor.
(2) Locate a temperature probe close to the probe for an inferred temperature and a correction factor.
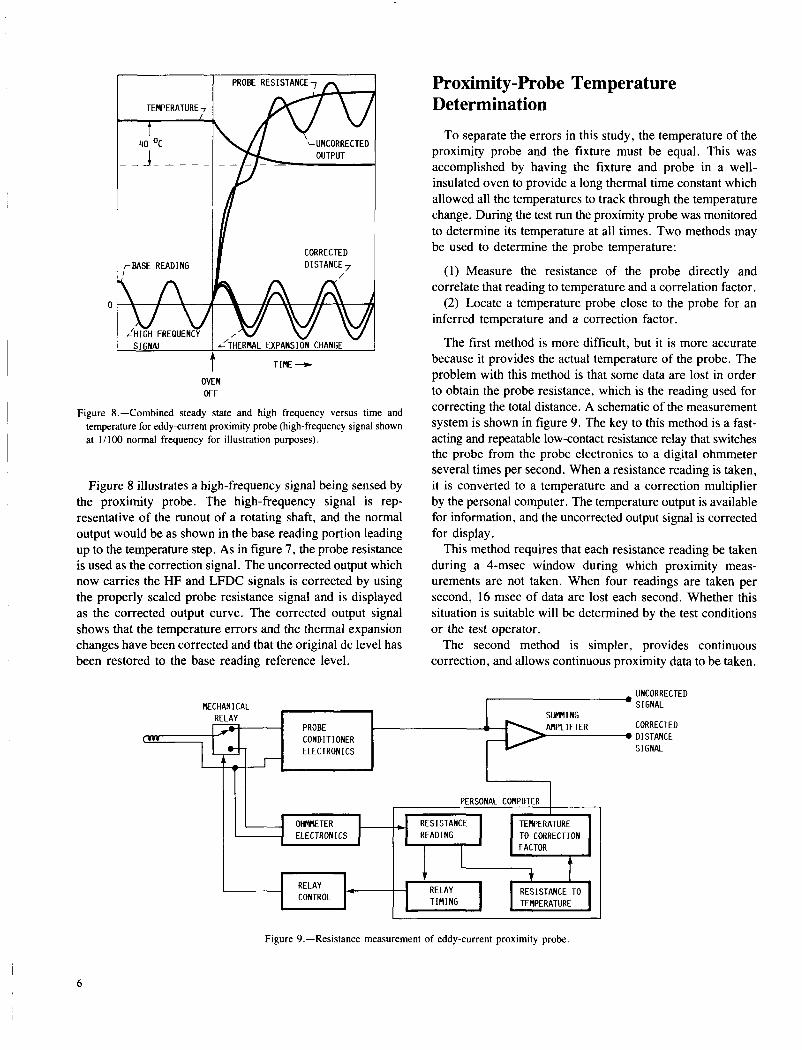
The first method is more difficult, but it is more accurate because it provides the actual temperature of the probe. The problem with this method is that some data are lost in order to obtain the probe resistance, which is the reading used for correcting the total distance. A schematic of the measurement system is shown in figure 9. The key to this method is a fast- acting and repeatable low-contact resistance relay that switches the probe from the probe electronics to a digital ohmmeter several times per second. When a resistance reading is taken, it is converted to a temperature and a correction multiplier by the personal computer. The temperature output is available for information, and the uncorrected output signal is corrected for display.
This method requires that each resistance reading be taken during a 4-msec window during which proximity meas- urements are not taken. When four readings are taken per second, 16 msec of data are lost each second. Whether this situation is suitable will be determined by the test conditions or the test operator.
The second method is simpler, provides continuous correction, and allows continuous proximity data to be taken.
I RESISTANCE TEMPERATURE READING TO CORRECTION
I ' FACTOR
+ t RELAY RESISTANCE TO TlNING TEnPERATURE
UNCORRECTED I-' SIGNAL
I I I Y
SIGNAL
6

UNCORRECTED 7' SIGNAL
a00 SUMMING
DIGITAL CORRECTED VOLTMETER
PROBE CONDITIONER - ELECTRON I CS ' SIGNAL
READING - -- 0 TEMPERATURE D I G 1 1 AL TEMPERATURE
Figure IO.-Block diagram of inferred temperature correction.
CONDITIONING
It requires that a temperature measuring device be placed close to the proximity probe to get an inferred probe temperature. This temperature is used to continuously correct the proximity probe signal, as illustrated by the schematic in figure 10. The temperature signal is properly scaled and added to the uncorrected output signal by the data system. This provides a continuously corrected signal without losing any proximity data. Any method of temperature measurement may be used, for example, thermocouples, silicon sensors, or resistance sensors. The only requirement is that the temperature sensor have a fast response time constant and be close enough to the proximity sensor to ensure a reliable temperature reference without affecting the probe calibration.
TO TEMPERATURE
VOLTMETER -
Concluding Remarks The use of proximity probes for distance measurement in
operating turbomachinery has been standard practice for many years. Generally there have been known temperature errors and effects in the data which were adjusted after testing was completed. On-line compensation was needed for immediate, accurate correction of any temperature-caused dc level shift. This work separated and characterized the temperature effects and errors that were present, and then established a technique for correcting the output signal to minimize them.
The basic installation of a proximity probe for distance or frequency measurements should follow the manufacturer's recommendations for the system. In addition the associated electronic conditioner and power supply must then be installed such that temperature changes do not effect their calibration. Placing the electronics in a foam-insulated chamber provided sufficient stability for test runs of up to 1/2-hr duration.
With the eddy-current proximity probe installed, two temper- ature effects have to be corrected in the output signal. The first is the thermal expansion change that occurs because of the change in measurement gap and the expansion of dissimilar
material in the measurement loop, which creates a change in the dc output level. The second effect is the electronic error caused by the change in resistance of the probe, which varies the impedance of the tuned electronics and changes the dc level of the output. The thermal expansion change is about one-tenth the electronic error and is of opposite polarity. With all the material thermal- properties and error information available, a table of corrections may be assembled for all the temperatures over which a test is run. This information table may be stored in the personal computer that collects the unprocessed data, and corrections may be made immediately after each reading.
Temperature effects thus corrected present the rotational HF and clearance LFDC data with a minimum of temperature- caused error. With careful setup and the correction method specified in h s report, more than 95 percent of the temperature- caused error in the output signal of an eddy-current measurement system can be eliminated. The range of temper- atures considered in this investigation were from -252 "C (liquid hydrogen) to 100 "C (boiling water). This method of temperature correcting of the eddy-current proximity probe may be used at elevated temperatures if data on equipment responses are made for the operating temperatures.
Lewis Research Center National Aeronautics and Space Administration Cleveland, Ohio, October 21, 1988
References 1. Machinery Protection Systems for Various Types of Rotating Equipment,
Parts 1.2, and 3. Bently Nevada Corporation Applications Note, Minden, NV, 1980.
2. American Petroleum Institute, Standard 670, Vibration, Axial Position Monitoring System.
3. Spica, P. W.; Hannum, N. P.; and Meyer, S. D.: Evaluationofa Hybrid Hydrostatic Bearing for Cryogenic Turbopump Application. NASA TM-87255, 1986.
7

National Aeronautics and Space Administration
1. Report No.
NASA TP-2880
Report Documentation Page 2. Government Accession No. 3. Recipient's Catalog No.
4. Title and Subtitle 5. Report Date
Technique for Temperature Compensation of Eddy-Current Proximity Probes
7. Author(s)
Robert M. Masters
January 1989 6. Performing Organization Code '----- 8. Performing Organization Report No.
E-43 16
2. Sponsoring Agency Name and Address
IO. Work Unit No.
Technical Paper
9. Performing Organization Name and Address
National Aeronautics and Space Administration Lewis Research Center Cleveland, Ohio 44135-3191
7. Key Words (Suggested by Author(s))
Proximity measurement Proximity measurement temperature compensation
-1 506-42-21
18. Distribution Statement
Unclassified - Unlimited Subject Category 35
11. Contract or Grant No. l------
3. Security Classif. (of this report)
Unclassified
113. Type of Report and Period Covered
21. No of pages 22. Price' 20. Security Classif. (of this page)
Unclassified 1 2 A03
National Aeronautics and Space Administration Washington, D.C. 20546-0001
14. Sponsoring Agency Code c I
5. Supplementary Notes
Eddy-current proximity probes are used in turbomachinery evaluation testing and operation to measure distances, primarily vibration, deflection, or displacement of shafts, bearings, and seals. Measurements of steady-state conditions made with standard eddy-current proximity probes are susceptible to error caused by temperature variations during normal operation of the component under investigation. Errors resulting from temperature effects for the specific probes used in this study were approximately 1.016 x range of -252 to 100 "C. This report examines temperature-caused changes on the eddy-current proximity probe measurement system, establishes their origin, and discusses what may be done to minimize their effect on the output signal. In addition, recommendations are made for the installation and operation of the electronic components associated with an eddy-current proximity probe. Several techniques are described that provide active on-line error compensation for over 95 percent of the temperature effects.
mm/"C over the temperature


![Dispersion-Compensation Technique for Log …ap-s.ei.tuat.ac.jp/isapx/2011/pdf/[FrA4-4] A06_1002.pdfDispersion-Compensation Technique for Log-Periodic Antennas using C-section All-Pass](https://img.dokumen.tips/doc/110x75/5fe2247ddedfd0279f38caa6/dispersion-compensation-technique-for-log-ap-seituatacjpisapx2011pdffra4-4.jpg)


![Capacity limits of systems employing multiple optical ... · compensation, optical phase conjugation (OPC) [8,11,18–25]. This all optical technique provides compensation of both](https://img.dokumen.tips/doc/110x75/5fbae1b56c3386685757997b/capacity-limits-of-systems-employing-multiple-optical-compensation-optical.jpg)