Embed Size (px)
Citation preview

D R A F T W O R K P L A N
Technical Work Plan – Downtown Environmental Assessment Project,
Montgomery, Alabama
Prepared for
Alabama Department of Environmental Management by the Downtown Environmental
Alliance
January 2016
CH2M HILL, Inc. 4121 Carmichael Rd.
Suite 400 Montgomery, Alabama 36106

PG Certification This Work Plan was prepared under the supervision of a Professional Geologist licensed by the Alabama Board of Licensure for Professional Geologists.
DRAFT Stephanie Park Date PG No. 1225

Contents Section Page
PG Certification ....................................................................................................................................... iii
Acronyms and Abbreviations .................................................................................................................... v
Background and Introduction .................................................................................................... 1-1 1.1 Definition of the DEAP ........................................................................................................... 1-1 1.2 Chemicals of Concern ............................................................................................................ 1-2
Previous Activities and Work Plan Purpose ................................................................................ 2-1 2.1 History of DEAP Investigations............................................................................................... 2-1
ADEM Preliminary Investigations ............................................................................. 2-1 Downtown Montgomery Sewer Study ..................................................................... 2-1 EPA Remedial Investigation ...................................................................................... 2-2 Feasibility Study ........................................................................................................ 2-2 Public Health Assessment Report ............................................................................. 2-2 Groundwater Monitoring ......................................................................................... 2-3 USGS Source Investigation ........................................................................................ 2-3 Indoor Air and Soil Vapor Surveys ............................................................................ 2-4
2.2 Remedial Activities ................................................................................................................. 2-4 2.3 DEAP Purpose and Scope ....................................................................................................... 2-5
Evaluation of Existing DEAP Data ............................................................................................... 3-1 3.1 Groundwater .......................................................................................................................... 3-1
COC Concentrations .................................................................................................. 3-1 Potentiometric Surface ............................................................................................. 3-1
3.2 Surface Water ........................................................................................................................ 3-1 3.3 Soil .......................................................................................................................................... 3-2 3.4 Soil Vapor ............................................................................................................................... 3-2 3.5 Indoor Air ............................................................................................................................... 3-2 3.6 Tree Core ................................................................................................................................ 3-3 3.7 Conclusions and Data Usability .............................................................................................. 3-3
Draft Conceptual Site Model ..................................................................................................... 4-1 4.1 Site Geology/Hydrogeology ................................................................................................... 4-1 4.2 Source Areas .......................................................................................................................... 4-1 4.3 Plume Extents ........................................................................................................................ 4-1 4.4 Evaluation of Potential Exposure Pathways .......................................................................... 4-2
Proposed Environmental Investigation ...................................................................................... 5-1 5.1 Groundwater Sampling .......................................................................................................... 5-1 5.2 Soil Vapor Sampling ............................................................................................................... 5-1 5.3 Geotechnical Sampling .......................................................................................................... 5-2 5.4 Hydraulic Study at Cypress Creek .......................................................................................... 5-2
Results Evaluation ..................................................................................................................... 6-1 6.1 Data Evaluation and Screening .............................................................................................. 6-1
Groundwater Data Evaluation and Screening .......................................................... 6-1 Vapor Intrusion Data Evaluation ............................................................................... 6-1
EN1214151012MGM III

Hydraulic Study Evaluation ....................................................................................... 6-1 6.2 Environmental Investigation Report ...................................................................................... 6-1
References ................................................................................................................................ 7-1
Appendixes
A Sampling and Analysis Plan
Tables
2-1 3-1 3-2 3-3 3-4 3-5 3-6 3-7 5-1
Historical Data Related to Downtown Environmental Assessment Project Screening Levels for Groundwater, Soil, Soil Vapor, and Indoor Air Comparison of Recent Groundwater Data to Screening Levels Groundwater Elevations – August 2011 Surface Water Sample Results Soil Sample Results Soil Vapor Sample Results Indoor Air Sample Results Proposed Sampling by Media
Figures
2-1 DEAP Boundary 3-1 All Historical Sample Locations 3-2 Groundwater Sample Locations 3-3 Potentiometric Surface – Shallow Interval 3-4 Historical Surface Water Sample Locations 3-5 Historical Soil Sample Locations 3-6 Historical Soil Vapor Sample Locations 3-7 Annex and Alabama Attorney General’s Buildings Historical Indoor Air and Soil Vapor Sample
Locations 4-1 Conceptual Site Model 5-1 Proposed Sample Locations
EN1214151012MGM IV

Acronyms and Abbreviations µg/L micrograms per liter µg/kg micrograms per kilogram µs/cm microsiemens per centimeter AEIRG Alabama Environmental Investigation and Remediation Guidance ADEM Alabama Department of Environmental Management ALDOT Alabama Department of Transportation ATSDR Agency for Toxic Substances and Disease Registry bgs below ground surface Board Water Works and Sanitary Sewer Board of the City of Montgomery, Alabama BTEX benzene, toluene, ethylbenzene, and xylenes City City of Montgomery COC chemical of concern COPC chemical of potential concern CSM conceptual site model DCE dichloroethene DEA Downtown Environmental Alliance DEAP Downtown Environmental Assessment Project DO dissolved oxygen DPT direct-push technology EAP Environmental Assessment Project EI Environmental Investigation ELCR excess lifetime cancer risk EMC Environmental Materials Consulting, Inc. EPA United States Environmental Protection Agency ft/min feet per minute ft/yr feet per year FS feasibility study HQ hazard quotient MCL maximum contaminant level mg/L milligrams per liter mL/min milliliters per minute MNA monitored natural attenuation NPL National Priorities List NTU nephelometric turbidity units ORP oxidation-reduction potential PCE tetrachloroethene PDB passive diffusion bag PID photoionization detector ppbv parts per billion by volume PRT post-run tubing PSVs preliminary screening values PVC polyvinyl chloride PW public water supply well RI Remedial Investigation RSA Retirement Systems of Alabama RSL Regional Screening Level SAP Sampling and Analysis Plan
EN1214151012MGM V

ACRONYMS AND ABBREVIATIONS
SVOC semivolatile organic compound TCE trichloroethene TPC toxic pollutant criteria USGS U.S. Geological Survey VI vapor intrusion VIMS vapor intrusion monitoring system VISL vapor intrusion screening level VOC volatile organic compound
EN1214151012MGM VI

SECTION 1
Background and Introduction This Work Plan is submitted to the Alabama Department of Environmental Management (ADEM) by the Downtown Environmental Alliance (DEA) to further evaluate tetrachloroethene (PCE) in groundwater that was discovered in downtown Montgomery in the early 1990s. In 1991, PCE was detected in former public water supply well PW-9W and also during the construction of the Retirement Systems of Alabama (RSA) Energy Plant in 1993. After several years of investigative activities by ADEM and the City of Montgomery (City), regulatory lead on the site was transferred to the U.S. Environmental Protection Agency (EPA). Additional investigative activities were conducted by EPA and the City through 2012 under EPA’s Comprehensive Environmental Response, Compensation, and Liability Act of 1980 (CERCLA) authorities. In a June 2012 letter to EPA, the City requested that the EPA allow it to develop an action plan to address environmental concerns at the site pursuant to establishing a formal agreement to accomplish any necessary environmental investigative and remedial activities under ADEM’s regulatory authorities.
The City subsequently developed a group of interested stakeholders in Montgomery (Downtown Environmental Alliance [DEA]) and thereafter prepared an Environmental Action Plan, which was presented to EPA in February 2013. After additional discussions with EPA and further development of the Action Plan, it was finalized and delivered to EPA in March 2014. The Action Plan was approved by EPA in May 2014, along with a commitment from EPA that it would defer regulatory lead of the site to ADEM once an enforceable agreement to complete the site actions was made with the DEA. Subsequently, the Settlement Agreement for Site Response (ADEM, 2015) was signed by the DEA and ADEM on September 30, 2015, which outlines the requirements for the DEA to resolve the environmental conditions at the site moving forward.
The DEA currently consists of the following members:
• City of Montgomery—Facilitator • Alabama Department of Education • Alabama Department of Transportation (ALDOT) • Alabama Law Enforcement Agency (formerly Alabama Department of Public Safety) • The Advertiser Company • Montgomery County Commission • Water Works and Sanitary Sewer Board of the City of Montgomery, Alabama (Board)
This Environmental Investigation (EI) Work Plan was developed to meet the objectives outlined in the Environmental Action Plan (CH2M HILL, 2014) and the requirements of Section VIII.B of the Settlement Agreement for Site Response (ADEM, 2015). This Work Plan provides a summary and evaluation of existing data and a description of additional data needed to complete the assessment and evaluate potential risks at the site. Additional investigative efforts proposed include groundwater sampling, soil vapor sampling, soil geotechnical testing, and a hydraulic study at Cypress Creek. The data collected will be used to update the conceptual site model (CSM); evaluate current conditions, the interaction between groundwater and surface water, the vapor intrusion (VI) pathway; and assess human health risk.
1.1 Definition of the DEAP Based on the discovery of PCE at PW-9W and the RSA Energy Plant, the Downtown Environmental Assessment Project (DEAP) includes the area where PCE was discovered during the construction of the RSA Energy Plant and groundwater surrounding and downgradient from that area. It does not include all urban contaminants from various sources throughout Montgomery (i.e., gas stations). During investigations by EPA, two additional buildings were identified:
• County Annex III Building
EN1214151012MGM 1-1

SECTION 1 BACKGROUND AND INTRODUCTION
• Attorney General’s (AG) Building
Based on the locations where PCE was discovered, and data from many investigations in the area, the DEAP boundary is defined as shown on Figure 1-1.
1.2 DEAP Chemicals of Concern From 1993 to 2012, various environmental sampling has been performed including soil, groundwater, indoor air, soil vapor, surface water, sewer manhole, and tree core sampling to evaluate the nature and extent of the PCE in the project area. Results indicate that chemicals of concern (COCs) in groundwater include PCE and two potential PCE daughter products, trichloroethene (TCE) and cis-1,2-dichloroethene (DCE).
In addition to PCE and TCE, the gasoline-related compounds benzene, toluene, ethylbenzene, and xylenes (BTEX) were identified by EPA as possible COCs; however, the following have been observed from a review of the existing data in the DEAP:
• BTEX was not detected in surface water samples at concentrations exceeding screening levels (see Section 3.2).
• BTEX was not detected in soil samples at concentrations exceeding screening levels (see Section 3.3).
• BTEX was not detected in the most recent groundwater sampling (2010 and 2011) in the DEAP (see Section 2.1.6).
• BTEX was not identified in PW-9W nor as a contaminant in the RSA construction area.
• A comparison of the most recently detected BTEX concentrations in soil vapor (Section 3.4) indicates that BTEX chemicals do not exceed EPA’s vapor intrusion screening levels (VISLs).
• BTEX is not associated with the activities which contributed to the definition of the site, i.e., the detection of PCE in the former public water supply well PW-9W, nor in the contaminants found during the construction of the RSA Energy Plant (see Section 2.1.1).
For these reasons, BTEX constituents are not considered a COC for the purposes of this Work Plan.
EN1214151012MGM 1-2

SECTION 2
Previous Activities and Work Plan Purpose This section provides a summary of previous investigations and remedial actions, and the purpose and scope of proposed activities.
2.1 History of DEAP Investigations Numerous investigations have assessed the nature and extent of contamination and potential human health risks associated with the PCE identified in PW-9W and the RSA construction area. The available reports from these investigations are listed in Table 2-1. Data from these reports were reviewed as part of the development of this Work Plan. In addition, results were also available from other assessments and investigations conducted as environmental site assessments for commercial and industrial properties within downtown development projects. These data were used to augment data collected as part of the PCE evaluations to develop a more robust understanding of potential PCE contamination within downtown Montgomery. All available data were compiled into a database and are summarized in Section 3.
2.1.1 ADEM Preliminary Investigations In 1995, ADEM conducted a Preliminary Assessment of the soil and groundwater around the RSA Energy Plant, which included the installation of four groundwater monitoring wells. The Preliminary Assessment report also summarized previous ADEM investigations, including the Phase I and II investigations conducted in 1993 and 1995, respectively (ADEM, 1996). Groundwater and soil vapor sampling were conducted to assess plume extents, and surface and subsurface hydrology were evaluated via literature review to determine potential impacts to surface water and aquifers within the Montgomery area. No specific sources of the PCE were identified; however, the report identified numerous historical drycleaners in the downtown area. ADEM did not extensively research the possible sources of groundwater plumes contaminated with BTEX, but noted that the sources of two BTEX plumes were considered to be leaking underground storage tanks. As a result of the investigation, ADEM recommended that the site be considered as a candidate for the National Priorities List (NPL).
2.1.2 Downtown Montgomery Sewer Data In March 1999, CH2M HILL conducted soil, groundwater, and sewer manhole sampling. Soil and groundwater samples were collected from 18 locations adjacent to sewers in downtown Montgomery. Borings were drilled to the water table, at depths ranging from 32 to 70 feet below ground surface (bgs), and sampled every 5 feet for volatile organic compounds (VOCs). Groundwater from each boring and 17 manholes were analyzed for VOCs and semivolatile organic compounds (SVOCs).
The groundwater data from the study indicate that VOCs were present in 14 of the 18 locations, compared to only 9 of the 18 borings reporting VOCs in soil. Seven of the soil borings only reported VOCs at one depth interval. Two soil borings reported VOCs at multiple depth intervals and at higher concentrations, but are located at different study locations indicating limited lateral extent of COCs in soil. The soil data indicate that the VOCs reported in groundwater are not present in soil; rather soil contamination is limited in extent.
Following the soil and groundwater sampling, sewer water samples were collected from manholes. The VOCs detected in the sewers were generally of lower concentrations than reported in groundwater from adjacent borings. As no patterns were observed in the data or from the distribution of VOCs detected, VOCs detected in groundwater appear to be the result of multiple releases.
EN1214151012MGM 2-1

SECTION 2 PREVIOUS ACTIVITIES AND WORK PLAN PURPOSE
2.1.3 EPA Remedial Investigation Between 1999 and 2001, the EPA contracted Black & Veatch to conduct a Remedial Investigation (RI) to evaluate the nature and extent of groundwater contamination due to the PCE discovered in downtown Montgomery (Black & Veatch, 2002). During this investigation, 16 permanent and 16 temporary wells were installed to monitor the vadose zone and the top and bottom of the uppermost aquifer, estimate hydraulic conductivity, and to evaluate the nature and extent of groundwater contamination. Sixty-six subsurface soil samples also were collected to characterize potential source areas. Results of the soil sampling indicated very little contamination; except for the presence of benzo(a)pyrene in one sample, no organic contamination was detected above screening levels. In groundwater, PCE was identified as the most common organic constituent. The RI concluded that DEAP contaminants likely originated from multiple sources within the downtown Montgomery area and the groundwater exposure pathway to residents is incomplete.
To estimate hydraulic conductivity, slug tests were conducted in installed wells. Based on slug test results, EPA estimated hydraulic conductivities of 4.45 × 10⁻³ feet per minute (ft/min) and 2.48 × 10⁻³ ft/min in the upper and lower portions of the aquifer, respectively, and associated velocities of 95 feet per year (ft/yr) and 91.6 ft/yr, respectively.
2.1.4 Feasibility Study Subsequent to the completion of the RI report, the City contracted Malcolm Pirnie to develop a Feasibility Study (FS) for the project area (Malcolm Pirnie, Inc., 2003). Potential remedial options were evaluated for their ability to meet the following generalized remedial action objectives:
• Prevent completion of exposure pathways
- Prevent migration of impacted groundwater to surface water - Prohibit potable use of area groundwater
• Reduce contaminant levels to below risk-based levels
• Prevent human consumption of and inhalation of vapors from contaminated groundwater that would result in unacceptable risk
• Remediate groundwater to meet risk criteria
• Minimize inconvenience to property owners and business from activities related to the installation and implementation of the remedial action
The FS evaluated the following potential remedial options:
• No further action • No further action with monitored natural attenuation • In situ chemical oxidation • Ex situ pumping with advanced oxidation system • Groundwater pumping to ex situ carbon absorption • In situ bioremediation
Institutional controls and groundwater monitoring were retained as part of all alternatives. No preferred alternative was identified.
2.1.5 Public Health Assessment Report In 2004, the Agency for Toxic Substances and Disease Registry (ATSDR, 2004) issued a Public Health Assessment Report for the site. Based on previous studies, the ATSDR compared detected chemicals of potential concern (COPCs) against multiple comparison criteria:
EN1214151012MGM 2-2

SECTION 2 PREVIOUS ACTIVITIES AND WORK PLAN PURPOSE
• ATSDR Environmental Media Evaluation Guides
• ATSDR Cancer Risk Guides
• Reference Dose Media Evaluation Guides (computed from the EPA Reference Dose for chronic exposure to a child, assuming pica behavior from soil ingestion)
• EPA Drinking Water Health Advisories (Lifetime)
• EPA Safe Drinking Water Act MCLs
Exposure pathways were evaluated based on available data and the most current (at the time) CSM. Based on those data, potential exposure pathways were not complete. No human health risks associated with drinking the groundwater and no known health effects from industrial use of the groundwater were identified. Soil vapor did not present a risk to human health because of the depth of groundwater (approximately 50 feet bgs). ATSDR noted that because of the quick response by the Board in removing the contaminated well from service and the dilution of any contaminants that may have been present due to blending in the Montgomery water supply system, the site represented “no apparent public health hazard.” The primary concerns of ATSDR were the migration of contamination into nearby aquifers and potential future exposure to contaminated groundwater. Due to depth to groundwater, the report concluded that VI is unlikely at the site.
2.1.6 Groundwater Monitoring Groundwater sampling was conducted in 2007, 2009, 2010, and 2011 by the City, USGS, and EPA (2010 and 2011), respectively. In 2007, eleven monitoring wells were sampled for VOCs, chromium, lead, and thallium. Wells MWs-03S, -04S, -08S, -11S, and -12S were also sampled for biodegradation indicator parameters (nitrate, sulfate, chloride, and total organic carbon) (Hall, 2007). PCE was detected in the wells where it had been reported previously and at similar concentrations, exceeding the MCL at MWs-02S, -03S, -04S, -08S, and -12S. The report concluded that PCE was not migrating. TCE was only detected in MWs-03S and -04S; it was previously reported in MW-09S. The report indicated concentrations of TCE were decreasing in MW-03S and increasing in MW-04S. Benzene, toluene, and ethylbenzene were not detected in any of the wells (xylenes were not analyzed) (Hall, 2007).
As part of the USGS investigation of the DEAP described in Section 2.1.7, groundwater samples were collected from 13 monitoring wells in 2009 and analyzed for VOCs, and natural attenuation parameters ferrous iron, nitrate, sulfate, and sulfide (USGS, 2011). PCE exceeded the MCL in five wells, MWs-01S, -02S, -04S, -08S, and -12S. TCE only exceeded the MCL in MW-04S. Benzene and toluene were reported at two orders of magnitude or more below MCLs at MW-01S. Benzene was also detected at estimated concentrations in MW-04S and toluene at MW-02S. Ethylbenzene and xylenes results were not included in the report.
In 2010, EPA sampled 13 existing wells for VOCs and metals analyses. PCE was detected in eight wells and exceeded the MCL in five wells (MWs-02S, -04S, -05I, -08S, and -12S). Although TCE was detected in six wells, it was not reported at concentrations above the MCL. BTEX were not detected in any of the samples (EPA, 2010).
EPA sampled the same set of wells again in 2011 for VOCs and metals analyses. Similar results were reported with MCL exceedances of PCE noted in the same wells and no exceedances of TCE reported. As in 2010, PCE was detected in eight wells and TCE in six wells. BTEX were not detected in any of the samples (EPA, 2012a).
2.1.7 USGS Source Investigation From 2008 to 2010, USGS conducted tree tissue, pore water, and groundwater surveys to determine the nature and extent of the contamination in the downtown Montgomery area (USGS, 2011). The results of these surveys are described below.
EN1214151012MGM 2-3

SECTION 2 PREVIOUS ACTIVITIES AND WORK PLAN PURPOSE
From 2008 to 2010, USGS, in cooperation with EPA, conducted a survey that included passive diffusion bag (PDB) sampling of pore water from the hyporheic zone of Cypress Creek, collection of tree cores, and collection of groundwater from 13 monitoring wells, as described in Section 2.1.6. The PDB samplers were deployed in the hyporheic zone during the tree coring event, and the authors report only one sampler resulted in detections (TCE and cis-1,2-dichloroethene [DCE] at PDB1); however, concentrations were not provided in the report. PDB1 was located in the proximity of former public-supply well PW-9W.
Tree tissue survey results indicated elevated levels of TCE within a tree (T64) compared to other tissue sample results. This tree is located at the corner of Washington and South Lawrence Street. Well MW-09S is located near the tree and contains concentrations of TCE that do not exceed the MCL.
2.1.8 Indoor Air and Soil Vapor Surveys Environmental Materials Consulting, Inc. (EMC) collected Summa and Tedlar air samples from 2010 through 2011 in the County Annex III Building. VOC results were all below regulatory standards and did not indicate a source (EMC, 2010). Five samples collected in February 2011 were analyzed for methane and hydrogen sulfide to assess sewers as a potential source. Results were similar to background concentrations and did not identify the sewer as a source (EMC, 2011).
From April 2011 through August 2012, USGS conducted soil vapor and indoor air surveys near the County Annex III Building and Alabama Attorney General’s (AG’s) Building based on complaints about indoor air quality. Fourteen indoor air and nine soil vapor samples were collected at the County Annex III Building, and eight indoor air and nine soil vapor samples were collected at the Alabama AG’s Building. Samples were collected using a passive sampling technique (Gore® Modules) over a 1-week period in August 2011. EPA concluded that indoor air and subslab results from County Annex III Building and the subbasement of the Alabama AG’s Building were below EPA risk targets and soil vapor results were below screening levels. Based on these results, EPA concluded that mitigation is unwarranted (EPA, 2011). A high efficiency filtration system was installed in the County Annex III Building to address the odor complaints. Carpet in the subbasement of the AG Building was determined to be the cause of the odor in the AG Building and was replaced.
A soil vapor survey was performed in April 2011 by USGS in the parking lot east of the Montgomery Biscuits baseball stadium. Thirteen Gore Modules were installed to evaluate soil vapor responses at the site of the City phytoremediation site. A report of the findings was never provided, but raw data indicates that there is not a substantial mass of PCE in the soil vapor at that location and thus, soil vapor concentrations would be very low.
USGS installed a vapor-intrusion monitoring system (VIMS) adjacent to tree 64. The VIMS allowed for the sampling of soil vapor in 10-foot depth intervals at 10, 20, 30, 40, and 50 feet bgs. Two sampling events occurred: one collecting soil vapor for 24 hours and one for 72 hours. TCE was reported to exceed its VISL in each sample.
2.2 Remedial Activities In response to the discovery of PCE in Well PW-9W, the Board removed PW-9W from service and abandoned all wells associated with the North Well Field (public water supply wells) except PW-9W, which was retained for environmental testing. This eliminated the potential for consumption of contaminated groundwater. Additionally, the City enacted an ordinance in 2003 to prohibit future well drilling in the downtown area. This reduces the potential for an ingestion exposure pathway to downtown residents and employees.
At this time, there is believed to be only a single industrial groundwater well that is known to exist in or close to the site. The well is located at the bus maintenance facility on North Court Street, where
EN1214151012MGM 2-4

SECTION 2 PREVIOUS ACTIVITIES AND WORK PLAN PURPOSE
groundwater is periodically used for bus washing. In August 2014, the well was sampled and did not contain detectable concentrations of VOCs.
An emergency removal action was conducted in 1993 by the contractors excavating at the RSA Energy Plant. The remedial action included the removal of contaminated soil and groundwater, and non-aqueous phase liquid (Black & Veatch, 2002). This action eliminated the PCE source area.
In 2011, the City of Montgomery planted clonal cottonwood trees in the greenspace of several parking lots used for the Montgomery Biscuits baseball stadium. Monitoring well MW-08S had shown a slight increasing trend in PCE groundwater concentrations and is located in the southwestern corner of the easternmost parking lot.
2.3 DEAP Purpose and Scope The purpose of the work proposed in this Work Plan is to:
• Assess the current concentrations and trends of COCs in groundwater.
• Evaluate concentrations in soil vapor where groundwater exceeds EPA residential VISLs.
• Evaluate the potential for vapor intrusion in the vicinity of the current Alabama AG Building and County Annex III Building.
• Evaluate the potential for groundwater to impact surface water in Cypress Creek adjacent to the DEAP.
• Provide sufficient data to assess human health risk for the DEAP.
The scope of field work for this project is detailed in Section 5. The data will be evaluated and results reported as described in Section 6. Upon completion of the investigations, an EI Report will be prepared.
EN1214151012MGM 2-5

SECTION 3
Evaluation of Existing DEAP Data All available data from previous sampling events were compiled into a single database and used to develop the DEAP CSM. The locations of the samples collected during these investigations (except tree core data) are shown on Figure 3-1. Concentrations of COCs and BTEX from shallow interval0F
1 groundwater, soil, and soil vapor samples were compared against default EPA Residential VISLs based on a target excess lifetime cancer risk (ELCR) of 1 × 10⁻⁶ and target Hazard Quotient (HQ) of 1. Indoor air data were compared to EPA Residential indoor air Regional Screening Levels (RSLs) based on a target ELCR of 1 × 10⁻⁶ and target HQ of 1. Groundwater results from all wells were also compared to EPA MCLs and ADEM Preliminary Screening Values (PSVs) for residential use. Soil results were compared to ADEM residential PSVs. Surface water results were compared to water quality criteria (toxic pollutant criteria [TPC]) per ADEM Admin. Code R. 335-6-10-.07. Tree tissue samples were not compared to screening levels since there are no screening levels for tree tissue. The screening levels for each medium are presented in Table 3-1. The results of the screening are summarized below.
3.1 Groundwater Figure 3-2 shows the locations of groundwater data used for development of the CSM (presented in Section 4). These data include sampling results from existing groundwater wells, former public water supply well PW-9W, direct-push locations, and temporary wells. The most recent two years of data collected from the monitoring wells shown on Figure 3-2 were compared to screening levels. EPA guidance recommends that data collected within the last year be used so that it is representative of current conditions (EPA, 2015).
3.1.1 COC Concentrations A review of the COC and BTEX results indicate that only PCE, TCE, and cis-1,2-DCE were detected in groundwater in 2010 and 2011. PCE exceeded VISLs in shallow monitoring wells MWs-02S, -04S, -08S, and -12S in 2010 and 2011. Only PCE exceeded its MCL/PSV in the four monitoring wells where the VISL exceedance was observed and in intermediate well MW-05I. In 2011, concentrations of TCE decreased in MW-12S to below the VISL and only MWs-04S and -09S exceeded the VISLs. Concentrations of TCE did not exceed the MCL/PSV in any of the monitoring wells in 2010 or 2011. BTEX was not detected in any of the monitoring wells in 2010 or 2011.
3.1.2 Potentiometric Surface Water levels recorded during the most recent (2011) groundwater sampling event (Table 3-3) were used to develop a potentiometric surface map of the shallow interval (shown on Figure 3-3). The results are consistent with historical flow patterns and indicate that shallow groundwater within the project area generally flows from the southeast to the northwest, towards the Alabama River and Cypress Creek.
3.2 Surface Water Surface water samples were collected from Cypress Creek and some of its tributaries in 2006 (four locations) and 2008 (seven locations), as shown on Figure 3-4. The results indicate that although PCE, TCE, and/or toluene were detected at all seven locations during the 2008 sampling event (Table 3-4); laboratory reporting levels were below typical laboratory practical quantitation limits. Sample location 0241998808 is located downgradient from the DEAP; concentrations identified at that location are similar to
1 The shallow-most interval of groundwater is the appropriate interval to compare to VISLs, consistent with EPA guidance (2015).
EN1214151012MGM 3-1

SECTION 3 EVALUATION OF EXISTING DEAP DATA
concentrations identified in samples collected from both upstream and downstream locations, providing no evidence of impacts to surface water from groundwater. None of the surface water samples exceeded TPC.
3.3 Soil Based on available reports, soil samples were collected during at least 16 separate events from 1993 to 2010 at the locations shown on Figure 3-5. Data are available for 276 soil samples collected from 71 unique sample locations summarized in Table 3-5.
Samples collected during early investigations of soil near the RSA Energy Plant were not analyzed for all VOCs; however, results indicate that PCE in soil was limited to the excavation area and generally found at depth. A more extensive study conducted around the sewer system in downtown Montgomery 1999 indicated that COCs were detected in only half of the borings sampled. None of the concentrations exceed PSVs (Table 3-5). The lack of contamination in soils was also confirmed during the EPA RI (Black & Veatch, 2002) that reported very little contamination; only benzo(a)pyrene in one sample was detected at levels above screening levels. Historical soil sampling results do not indicate a residual source.
3.4 Soil Vapor Soil vapor sampling was conducted from 2010 to 2012 at 47 locations within the DEAP, as shown on Figures 3-6 and 3-7. The soil vapor results were compared to EPA residential VISLs. Only TCE exceeded the VISL at all five depths for both VIMS sampling events, with concentrations generally increasing with depth (Table 3-6). No soil vapor exceedances were reported from samples collected adjacent to the County Annex III Building, the Alabama AG’s Building, the Wallace Building, and the Folsom Building.
The soil vapor screening survey conducted in 2011 was performed at the phytoremediation test site located at the parking lots for the Montgomery Biscuits baseball stadium. The results were presented as a total mass, rather than a concentration; thus, there are no screening levels for comparison. The samples were collected very near the location of monitoring well MW-08S, which has shown a slight increasing trend in PCE concentration in the groundwater. Because only a small mass of PCE was present in a few of the Gore sorber modules, it is expected that the soil vapor concentrations would be very low.
3.5 Indoor Air Sixty-three indoor air samples were collected at the County Annex III Building and the Alabama AG’s Building (Figure 3-7) using various sampling methods including Gore-sorber technology, Tedlar bags, and Summa canisters. Samples were analyzed for VOCs.
In the County Annex III Building, only PCE (4 samples), TCE (1 sample), benzene (1 sample) and ethylbenzene (29 samples) were detected at concentrations exceeding RSLs (Table 3-7). All of these compounds are common indoor air contaminants and do not correlate with results from the soil vapor samples collected adjacent to the building. The County installed a high efficiency air filtration system in the Annex III building. No additional indoor air quality complaints have been received.
In the Alabama AG’s Building, none of the compounds detected exceeded the RSLs (Table 3-7). Testing of emissions from carpet installed in the subbasement verified that the carpet was the source of chemicals reported by the Gore-sorber method. The carpet was reacting with the moisture and pH of the concrete slab in the subbasement. The carpet squares were removed, the concrete floor sealed, and a new rolled carpet (without vinyl backing) was installed. No additional odor complaints have been received.
EN1214151012MGM 3-2

SECTION 3 EVALUATION OF EXISTING DEAP DATA
3.6 Tree Core In August 2008, tree core samples were collected from 69 trees in and around downtown Montgomery, and in native vegetation growing in the riparian zones of the Alabama River and Cypress Creek. TCE was detected in 24 of the trees sampled, PCE in 7 of the trees, and cis-1,2-DCE in 2 of the trees. The highest concentration of TCE was reported in T64 located near monitoring well MW-09S; however, groundwater at MW-09S indicates only low levels of TCE (3.5 micrograms per liter [µg/L] in 2010) at concentrations below the MCL/PSV. The tree tissue results do not correlate with groundwater concentrations as indicated by the elevated TCE reported in T64 (68,650 parts per billion by volume [ppbv]) and low TCE concentration at MW-09S. In addition, TCE was not detected in adjacent trees T63 and T62, indicating a sporadic spatial distribution that is inconsistent with a groundwater plume.
3.7 Conclusions and Data Usability Groundwater, soil, and surface water analytical data are considered to be of sufficient quality for use in developing the CSM and proposed sampling approach. The results of the evaluation indicate that groundwater contains low concentrations of PCE, TCE and cis-1,2-DCE. BTEX was not detected in groundwater samples from wells within the DEAP during the last two monitoring events (2010 and 2011), and only benzene and toluene were detected in 2009 at low concentrations below screening levels. (Note that laboratory detection limits in 2009 were below typical laboratory limits).
Groundwater flow is towards the Alabama River and Cypress Creek. Because of the detections of COCs at most sampling locations in Cypress Creek, and particularly upstream of the DEAP, sampling of the Creek is not recommended to assess potential impacts from the plume. Rather, additional evaluation of the interaction between groundwater and Cypress Creek are proposed to assess the potential for DEAP groundwater to impact Cypress Creek.
Soil sampling results indicate that there is no residual mass within the DEAP vadose zone. No additional sampling of soil is proposed in this Work Plan.
The soil vapor and indoor air data were evaluated as screening level data only. Additional soil vapor samples are proposed to further evaluate the potential for vapor intrusion.
The tree tissue sampling results were evaluated as screening level data. The results did not correlate to groundwater concentrations or reveal a spatial distribution pattern that would indicate that the data are representative of a groundwater plume, thus further tree tissue sampling is not recommended. Groundwater and soil vapor concentrations will be used to further evaluate the site.
EN1214151012MGM 3-3

SECTION 4
Draft Conceptual Site Model The CSM has been developed using the historical investigation results summarized in Sections 2 and 3, and is represented on Figure 4-1.
4.1 Site Geology/Hydrogeology The geology beneath the DEAP consist of a thin soil layer on top of quaternary terrace deposits comprised of medium to coarse-grained sand, with interbedded clay and gravel lenses. Underlying these recent terrace deposits are Cretaceous sediments of the Eutaw, Gordo, and Coker formations. The Eutaw formation is an aquifer unit characterized by two thick layers of marine sands separated by a thin layer of marine clay (USGS, 1987). The terrace deposits and Eutaw formation are combined to comprise the shallow aquifer. The Gordo and Coker aquifers consist of an estimated 500 feet of interbedded clay, sand, and gravel above crystalline bedrock.
The shallow aquifer is unconfined and 120 to 150 feet thick underneath the DEAP, but a localized low permeability zone may exist from approximately 35 to 50 feet bgs (ADEM, 1995). Groundwater is typically encountered from approximately 30 to 45 feet bgs and generally flows west-northwest. Based upon slug tests, hydraulic conductivity in the shallow aquifer has been estimated between 2.48 x 10⁻³ ft/min and 4.45 x 10⁻³ ft/min (Black & Veatch, 2002). The shallow aquifer is underlain by a low-permeability sandy clay unit that effectively separates it from the underlying Gordo and Coker formations.
4.2 Source Areas Impacted soil, groundwater, and non-aqueous phase liquid was removed from the RSA Energy Plant construction area during the 1993 emergency removal action. The RSA Energy Plant received regulatory closure and therefore is understood not to be a likely continuing source for PCE contamination in downtown Montgomery. In addition, the historical investigation results indicate that little to no residual mass is present in soils and that the presence of groundwater contamination is likely due to multiple historical releases within downtown Montgomery.
4.3 Plume Extents The two plumes shown on Figure 4-1 were delineated based on the historical data. In particular, Figure 4-1 shows whether PCE was not detected (green locations), detected below the MCL/PSV (yellow locations), or detected at concentrations greater than the MCL/PSV (red locations). Plume boundaries are drawn based on locations that exceed criteria with the exception of MW-04S. Five sample locations north of and including MW-09S define a boundary between the PCE plume at the RSA building and MW-04S; because no PCE was identified in this area, concentrations of PCE at MW-04S are not associated with the DEAP.
The southern plume includes the RSA building area because of the discovery of PCE. The northern extent of that plume area is limited because PCE was not detected in MW-07I until 2009, 8 years after installation. PCE has been detected in MW-08S since it was first sampled in 2000. The data from these two wells indicate that these plumes are not connected. This plume is bound to the south by MW-10S and to the east by a sample adjacent to a parking deck owned by the State of Alabama (Figure 4-1).
The plume that extends from MW-08S is delineated to the east, southwest, and north by one-time samples that were collected during historical investigations. To the northwest, it is bound by Cypress Creek.
EN1214151012MGM 4-1

SECTION 4 DRAFT CONCEPTUAL SITE MODEL
4.4 Evaluation of Potential Exposure Pathways A 2004 evaluation of available data conducted by ATSDR concluded that no residential or municipal wells still in use were known to be contaminated with PCE or TCE. ATSDR also concluded that there was no known exposure via the air pathway, but did note a potential for VI (ATSDR, 2004). All public water supply wells were closed in 1991 following initial detection of the PCE. The North Well Field was replaced with a new well field far from downtown, in southern Montgomery County. The wells in the North Well Field were permanently abandoned (casing pulled and well grouted) in 2011. PW-9W was retained for environmental testing purposes only.
This study will evaluate the current and future potential for exposure to COCs in groundwater and soil vapor. Additionally, the interaction between groundwater and surface water at Cypress Creek will be evaluated.
EN1214151012MGM 4-2

SECTION 5
Proposed Environmental Investigation The proposed site investigation includes three components:
• Collecting groundwater samples from existing monitoring wells and a piezometer to be constructed near Cypress Creek.
• Collecting soil vapor samples near monitoring wells that exceed VISLs and near the County Annex III Building and the north wing of the Alabama AG’s Building
• Evaluating the groundwater to surface water interaction at Cypress Creek adjacent to the DEAP.
Field activities will be conducted by qualified personnel working under a project-specific Sampling and Analysis Plan (SAP in Appendix A) and a project-specific Health and Safety Plan.
5.1 Groundwater Sampling Groundwater samples will be collected from 13 existing monitoring wells (Table 5-1) and PW-9W. In addition, after installation, the temporary piezometer proposed to assess surface water/groundwater interaction at Cypress Creek (TMPZ-1 on Figure 5-1) will be sampled. Samples will be analyzed for COCs, as summarized in Table 5-1. This groundwater sampling event should be conducted during the summer, when the potential for volatilization is highest to conservatively assess soil vapor concentrations (Section 5.2). Samples will be collected in accordance with the Alabama Environmental Investigation and Remediation Guidance (AEIRG) and the site specific SAP in Appendix A.
5.2 Soil Vapor Sampling Site-wide soil vapor sample locations will be selected based on current groundwater concentrations. Soil vapor sampling will be performed where COCs are present in shallow groundwater at concentrations exceeding EPA residential VISLs (adjusted for site-specific groundwater temperature). Temporary dual-depth soil vapor probes will be installed and sampled near each shallow groundwater monitoring well where COC concentrations exceed one or more VISLs. Groundwater from eight shallow monitoring wells and one shallow piezometer (Table 5-1) will be sampled as discussed in Section 5.1. A soil core will be collected at each proposed soil vapor sampling location to determine the depth to groundwater. Geotechnical sampling will be performed at three locations, as discussed in Section 5.3.
Initially, the shallower depth, 6 to 8 feet bgs, which is the approximate basement slab depth, will be sampled. The deeper depth probe will then be installed in a separate hole. Each of the borings will be at least 5 feet away from the monitoring well and each other. The deeper depth probe will be within several feet of the groundwater table as determined from the soil core, which ranges from approximately 25 to 60 feet bgs throughout the site.
Area-specific soil vapor samples will be collected around the County Annex III Building and north wing of the Alabama AG’s Building. Temporary exterior subslab soil vapor probes (or vapor pins) will be installed and sampled at four locations surrounding the County Annex III Building (one on each side of the building) and three locations around the northern wing of the Alabama AG’s Building (one on each side of the wing).
Additionally, soil vapor samples will be collected from two depths, 10 feet and 50 feet, of the existing VIMS located across Washington Avenue from the County Annex III Building.
The soil vapor probes will be installed, sampled, and abandoned in accordance with the AEIRG and the site specific SAP. The soil vapor samples will be analyzed for COCs as summarized in Table 5-1.
EN1214151012MGM 5-1

SECTION 5 PROPOSED ENVIRONMENTAL INVESTIGATION
5.3 Geotechnical Sampling Geotechnical samples will be collected from the vadose zone using Shelby Tubes. The samples will be co-located at three locations where soil vapor samples will be collected. Geotechnical samples will be collected using a direct push technology (DPT) drilling rig. One Shelby Tube will be collected at each lithologic unit identified in the boring based on available boring logs. The samples will be collected for analysis of dry bulk density, total porosity, and saturated porosity (Table 5-1). These samples will be used to evaluate the site-specific potential for soil vapor attenuation in the vadose zone and the variability of geotechnical parameters in the subsurface.
5.4 Hydraulic Study at Cypress Creek The interaction between groundwater and the reach of Cypress Creek adjacent to the DEAP will be analyzed over two time periods (spring and summer) to assess changes due to seasonal fluctuations. A temporary creek gauge will be installed within Cypress Creek and an adjacent temporary piezometer near the stream bank (Figure 5-1). The relationship between the Creek and groundwater levels at any given time will provide information as to whether groundwater is flowing into the creek (gaining reach) or surface water is flowing out of the Creek into the underlying aquifer (losing reach). To evaluate seasonal changes within Cypress Creek, LevelTroll transducers will be deployed in the temporary creek gauge and the adjacent temporary piezometer during both a spring and summer period. The first study period will begin within approximately 30 days of approval of this Work Plan (ideally in March or early April when precipitation is typically higher). The second study period will be conducted during the summer (ideally in August or September when precipitation is usually low). The piezometer will be installed in accordance with the AEIRG and the site specific SAP.
EN1214151012MGM 5-2

SECTION 6
Results Evaluation 6.1 Data Evaluation and Screening When all three components of the investigation are concluded, the data will be evaluated as outlined below.
6.1.1 Groundwater Data Evaluation and Screening Groundwater analytical results will be compared to EPA MCLs and ADEM residential PSVs. Historical data available at the monitored locations then will be plotted versus time (time series charts) to assess concentration trends.
The time series charts will also be used to assess natural attenuation of the plume. Lines of evidence used to demonstrate that natural attenuation is effective in reducing COC concentrations will include the use of historical data to demonstrate stable or decreasing concentration trends with time and distance. The time series charts will be used to evaluate whether trends are increasing, stable, or declining. Field parameters, dissolved oxygen (DO) and oxidation-reduction potential (ORP), may be used to assess whether aquifer conditions are suited to degradation of the COCs.
6.1.2 Vapor Intrusion Data Evaluation Soil vapor data will be compared to the most recent version of EPA’s residential VISLs based on a target ELCR of 1 × 10⁻⁵and target HQ of 1. This provides a risk estimate that will meet both the EPA target risk range and ADEM criteria. For any soil vapor sample with at least one chemical exceeding its VISL, the EPA VISL calculator will be used to calculate indoor air risk estimates for a hypothetical resident living in a building constructed above the sampling location. This is expected to provide a conservative evaluation of potential current and future exposure scenarios at the soil vapor sampling location.
Data from soil vapor samples collected adjacent to the County Annex III Building and the north wing of the Alabama AG’s Building will also be compared to the most recent version of EPA’s commercial VISLs based on a target ELCR of 1 × 10⁻⁵ and target HQ of 1. For any soil vapor sample with at least one chemical exceeding its VISL, the EPA VISL calculator will be used to calculate indoor air risk estimates for workers in the building adjacent to the sample with the exceedance.
6.1.3 Hydraulic Study Evaluation The results of the hydraulic study at Cypress Creek will be used to assess whether the identified reach of the creek is either a losing or gaining reach. Surface water elevation recorded over the length of each study period (estimated to be conducted over 2 weeks) will be compared to groundwater elevation data collected at the piezometer (TMPZ-1; Figure 5-1). If the data indicate that the reach of Cypress Creek is losing over both study periods, then it will be concluded that the Creek acts as a hydraulic barrier to groundwater flow. No additional investigation will be conducted within the Creek.
If, during any phase of the study, the data indicate that this reach of Cypress Creek is a gaining reach, further evaluation will be proposed.
6.2 Environmental Investigation Report Once all three components of the investigation are concluded and the data have been evaluated as described in Section 6.1, the results of the investigations within the DEAP will be compiled in an EI Report. The EI Report is scheduled to be completed 9 months after ADEM approval of this Work Plan.
EN1214151012MGM 6-1

SECTION 7
References Alabama Department of Environmental Management (ADEM). 1995. Preliminary Assessment, Capitol City Plume, Montgomery, Alabama. February.
Alabama Department of Environmental Management (ADEM). 1996. Capitol City Plume Memorandum dated March 7, 1996.
Alabama Department of Environmental Management (ADEM). 2010. Brownfields Phase 2 Assessment: Montgomery Urban Garden. September.
Agency for Toxic Substances and Disease Registry (ATSDR). 2004. Public Health Assessment for Capitol City Plume, Montgomery, Alabama. January.
Black & Veatch. 2002. Remedial Investigation Report, Capitol City Plume Site, Montgomery, Alabama. November.
CH2M HILL. 2014. Environmental Action Plan: Downtown Environmental Assessment, Montgomery, Alabama. March.
City of Montgomery, Alabama, 2014. Letter dated March 11, 2014.
Environmental Materials Consultant (EMC). 2010. Outdoor and Indoor Air Quality Issues. Letter dated December 3.
Hall, J.M. 2007. Strategic Environmental Analysis Ground Water Monitoring Report Capitol City Plume Site, Montgomery, Alabama. August.
Malcolm Pirnie, Inc. 2003. Feasibility Study, Capitol City Plume Site, Montgomery, Alabama. October.
U.S. Environmental Protection Agency (EPA). 1998. W.L. Gore & Associates' Environmental Technology Verification Report Soil Gas Sampling Technology. August.
U.S. Environmental Protection Agency (EPA). 2010. Report of the Continued Monitoring of Contamination in the Shallow Ground Water within the Capitol City Plume Site, Montgomery, Alabama. Memorandum dated June 28.
U.S. Environmental Protection Agency (EPA). 2011. Review of Preliminary Data for Indoor Air and Soil-Gas Sampling Event, Capitol City Plume, Montgomery, AL. Memorandum from EPA Technical Services Branch dated October 12.
U.S. Environmental Protection Agency (EPA). 2012a. Final Report for Capitol City Plume Site, Montgomery, Alabama. Memorandum dated February 28.
U.S. Environmental Protection Agency (EPA). 2012b. Letter dated November 14.
U.S. Environmental Protection Agency (EPA). 2014. Determining Groundwater Exposure Point Concentrations. OSWER Directive 9283.1-42. February.
EN1214151012MGM 7-1

SECTION 7 REFRENCES
U.S. Environmental Protection Agency (EPA). 2015. OSWER Technical Guide for Assessing and Mitigating the Vapor Intrusion Pathway from Subsurface Vapor Sources to Indoor Air. OSWER Publication 9200.2-154. June.
U.S. Geological Survey (USGS). 2010. Investigation of the Potential Source Area, Contamination Pathway, and Probable Release History of Chlorinated-Solvent-Contaminated Groundwater at the Capital City Plume Site, Montgomery, Alabama, USGS, 2008-2010.
U.S. Geological Survey (USGS). 2011. USGS Circular: Determination of the Potential Source Area, Contamination Pathway, and Probable Release History of Chlorinated-Solvent-Contaminated Groundwater at the Capital City Plume Site. January.
EN1214151012MGM 7-2

Tables

Technical Work Plan‐‐DEAP, Montgomery, Alabama
Year Title Author
1991The Montgomery Water Works and Sanitary Sewer Board Notifies ADEM of Contamination in PW‐9W
MWWSB
1993 Special Projects Phase I Report ADEM
1993 Special Projects Phase II Report ADEM
1995 Preliminary Assessment ‐ Capitol City Plume ADEM
1996 Site Inspection ‐ Capitol City Plume ADEM
1999 CH2M HILL Sewer Data Collection CH2M HILL
2000Data Evaluation Report, Capitol City Plume Site Remedial Investigation
Black & Veatch Special Projects Corp.
2002 Remedial Investigation Report, Capitol City Plume Black & Veatch Special Projects Corp.
2004 Capitol City Plume, Montgomery, Montgomery County, AlabamaU.S. Department of Health and Human Services
2005 CERCLA: Brownfield Site Inspection ADEM
2007 Ground Water Monitoring Report, Capitol City Plume SiteJM Hall Strategic Environmental Analysis
2010
Request for Information Pursuant to Section 104 of CERCLA and Section 3007 of RCRA for the Capitol City Plume Superfund Site in Montgomery, Alabama
Krevolin and Horst, LLC.
2010TO‐15 Analytical Data and Summary Tables, Montgomery County Annex III
Environmental‐Materials Consultants, Inc.
2010Report of the Continued Monitoring of Contamination in the Shallow Ground Water within the Capitol City Plume Site
EPA
2011 "Sewer Gas" Testing, Montgomery County Annex IIIEnvironmental‐Materials Consultants, Inc.
2011 GORE Surveys Final Report, CCP ‐ Baseball Field Parking W.L. Gore and Associates, Inc.2011 GORE Surveys Final Report, Alabama Site Phase II W.L. Gore and Associates, Inc.2012 Sampling Investigation Report, Capitol City Plume EPA
2012
Investigation of the Potential Source Area, Contamination Pathway, and Probable Release History of Chlorinated‐Solvent‐Contaminated Groundwater at the Capitol City Plume Site, Montgomery, Alabama, 2008‐2010
USGS
2012 USEPA TO‐15 Data Report, Capitol City Plume USGS
2012 GORE Surveys Analytical Results, Alabama Site, Montgomery, AL USGS
2012GORE Surveys Laboratory Report, Alabama Site ‐ Air Sampling, Montgomery, AL
W.L. Gore and Associates, Inc.
2012GORE Surveys Laboratory Report, Alabama Site ‐ Soil Gas, Montgomery, AL
W.L. Gore and Associates, Inc.
Year Title Author
1998 Phase II Environmental Site Assessment, Statehouse Inn The CWA Group, Inc.
1999 Phase II Environmental Site Assessment, Old Red Taxi Site The CWA Group, Inc.
2007Geotechnical Report, Proposed Coosa Street Parking Deck, Montgomery, Alabama
TTL, Inc.
2003 Environmental Site Assessment, Montgomery Advertiser PropertiesEnvironmental‐Materials Consultants, Inc.
2004Voluntary Cleanup Program Assessment Report, Proposed Montgomery County Jail Site
Goodwyn, Mills, & Cawood Incorporated
2004Phase II Environmental Site Assessment, Riverfront Inn Property‐‐Tract No. 2
Christian Testing Laboratories, Inc.
TABLE 2‐1Historical Data Related to Downtown Environmental Assessment Project
Investigations of the Downtown Environmental Assessment Project
Additional Investigations Used to Support Conceptual Site Model Development
EN1214151012MGM Page 1 of 2

Technical Work Plan‐‐DEAP, Montgomery, Alabama
TABLE 2‐1Historical Data Related to Downtown Environmental Assessment Project
Year Title Author
2005 Phase II Soil and Groundwater Testing, Montgomery Civic Center SiteEnvironmental‐Materials Consultants, Inc.
2010Proposed Signal Foundations, Madison Avenue Resignalization at North Decatur Street and North Union Street, Montgomery County
AECOM Technical Services, Inc.
2010 Brownfields Phase 2 Assessment: Montgomery Urban Garden ADEM
2010Report of Geotechnical Exploration, Proposed Multi‐Purpose Facility and Improvements to Cramton Bowl
Christian Testing Laboratories, Inc.
2011Supplemental Geotechnical Testing, Multi Purpose Building, Cramton Bowl, Montgomery, Alabama
Christian Testing Laboratories, Inc.
2012Report of Geotechnical Subsurface Investigation, Alabama Capitol Complex Parking Deck
Carmichael Engineering, Inc.
2012 Report of Geotechnical Subsurface Investigation, Five Story Building Carmichael Engineering, Inc.
2012Phase I Environmental Site Assessment, State House Inn Plaza, Montgomery, Alabama
Goodwyn, Mills, & Cawood Incorporated
2013Report of Geotechnical Exploration, Proposed Justice Center, Madison Avenue, Montgomery, Alabama
CTL Geotechnical Services, Inc.
Notes: ADEM ‐ Alabama Department of Environmental Management
EPA ‐ United States Environmental Protection AgencyUSGS ‐ United States Geological SurveyDEAP ‐ Downtown Environmental Assessment ProjectMWWSB ‐ Montgomery Water Works and Sanitary Sewer Board
Additional Investigations Used to Support Conceptual Site Model Development
EN1214151012MGM Page 2 of 2

TABLE 3‐1Screening Levels for Groundwater, Surface Water, Soil, Soil Vapor, and Indoor Air
Technical Work Plan‐‐DEAP, Montgomery, Alabama
Surface Water
(µg/L)
Soil
(mg/kg)
Soil Vapor
(µg/m3)
Indoor Air
(µg/m3)
Analyte VISL MCL PSV TPC PSV VISL RSL
PCE 15 5 5 1.9 0.48 360 11
TCE 1.2 5 5 17.5 0.053 16 0.48
cis‐1,2‐DCE NA 70 70 5,907* 4.3 NA NA
trans‐1,2‐DCE NA 100 100 5,907 6.9 NA NA
Vinyl chloride 0.15 2 2 1.4 0.079 5.6 0.17
Benzene 1.6 5 5 15.5 0.64 12 0.36
Toluene 3.5 1,000 1,000 8,723 520 37 5,200
Ethylbenzene 19,000 700 700 1,244 400 170,000 1.1
m,p‐Xylene 360 10,000 10,000** NA 27 3,500 100
o‐Xylene 370 10,000 10,000** NA 27 3,500 100
Notes:
Groundwater and surface water screening levels are in micrograms per liter (µg/L)Soil screening levels are in milligrams per kilogram (mg/kg)
Soil vapor and indoor air screening levels are in micrograms per cubic meter (µg/m3)
* the TPC for trans‐1,2‐DCE was used
** the PSV for total Xylenes was usedPCE ‐ tetrachloroetheneTCE ‐ trichloroetheneDCE ‐ dichloroetheneVISL ‐ EPA Residential Vapor Intrusion Screening Level (based on target risk of 1x10‐6 and target hazard quotient of 1)MCL ‐ U.S. Environmental Protection Agency Maximum Contaminant Level
TPC ‐ toxic pollutant criteria per ADEM Admin. Code R. 335‐6‐10.07ADEM ‐ Alabama Department of Environmental QualityRSL ‐ Regional Screening LevelNA ‐ no screening level available
DEAP ‐ Downtown Environmental Assessment Project
Groundwater
(µg/L)
PSV ‐ Residential Preliminary Screening Value from Alabama Risk‐based Corrective Action Guidance Manual (2008), direct contact exposure pathway
EN1214151012MGM Page 1 of 1

TABLE 3‐2Comparison of Most Recent Groundwater Data to Screening Levels
Technical Work Plan‐‐DEAP, Montgomery, Alabama
PCE
VISL: 15MCL/PSV: 5
TCE
VISL: 1.2MCL/PSV: 5
cis‐1,2‐DCE
VISL: NAMCL/PSV: 70
PCE
VISL: 15MCL/PSV: 5
TCE
VISL: 1.2MCL/PSV: 5
cis‐1,2‐DCE
VISL: NAMCL/PSV: 70
Shallow Interval Wells
MW‐01S 0.26 J < 0.5 < 0.5 1.5 < 0.5 < 0.5MW‐02S 45 0.17 J < 0.5 44 0.18 J < 0.5MW‐04S 62 4.8 6.7 38 2.8 2.2
MW‐07S 0.57 < 0.5 < 0.5 < 0.5 < 0.5 < 0.5MW‐08S 22 0.54 < 0.5 55 0.72 < 0.5MW‐09S < 0.5 3.5 < 0.5 < 0.5 2.1 < 0.5MW‐10S < 0.5 < 0.5 < 0.5 < 0.5 < 0.5 < 0.5MW‐12S 270 1.2 1.2 120 0.64 0.48 JIntermediate Interval Wells
MW‐01l 0.13 J < 0.5 < 0.5 0.28 J < 0.5 < 0.5MW‐05l 14 1.4 < 0.5 20 0.57 < 0.5MW‐07l 0.19 J < 0.5 < 0.5 2.1 < 0.5 < 0.5MW‐08l < 0.5 < 0.5 < 0.5 < 0.5 < 0.5 < 0.5MW‐12l < 0.5 < 0.5 < 0.5 < 0.5 < 0.5 < 0.5Notes: Values are in micrograms per liter (µg/L)Shaded cells are shallow interval well concentrations exceeding EPA residential VISLs.Exceedances of the MCL/PSV are bold.trans‐1,2‐DCE, vinyl chloride and BTEX constituents were not detected in any sample.
The detection limit for trans‐1,2‐DCE, VC, benzene, toluene, ethylbenzene and o‐xylene is 0.5 µg/L.The detection limit for m,p‐xylene is 1 µg/L.BTEX ‐ benzene, toluene, ethylbenzene, and xylenesPCE ‐ tetrachloroetheneTCE ‐ trichloroetheneDCE ‐ dichloroetheneMCL ‐ U.S. Environmental Protection Agency (EPA) Maximum Contaminant Level
VISL ‐ vapor intrusion screening level (EPA, 2015)NA ‐ no VISL availableDEAP ‐ Downtown Environmental Assessment Project
Well ID
20112010
PSV ‐ Residential Preliminary Screening Value from Alabama Risk‐based Corrective Action Guidance Manual (2008), direct contact exposure pathway
EN1214151012MGM Page 1 of 1

TABLE 3‐3Groundwater Elevations ‐ August 2011
Technical Work Plan‐‐DEAP, Montgomery, Alabama
Well TOC Elevations DTWGroundwater
Elevation
MW‐01S 189.37 39.24 150.13
MW‐02S 188.59 41.31 147.28
MW‐04S 178.72 32.24 146.48
MW‐07S 179.65 35.66 143.99
MW‐08S 173.46 37.11 136.35
MW‐09S 213.41 55.15 158.26
MW‐10S 212.67 56.94 155.73
MW‐12S 157.58 26.20 131.38
MW‐05I 210.98 58.31 152.67
MW‐01I 190.00 40.21 149.79
MW‐07I 179.76 35.70 144.06
MW‐08I 173.42 37.01 136.41
MW‐12I 157.82 26.24 131.58
Notes:
TOC ‐ top of casing in feet above mean sea levelDTW ‐ depth to water in feet below TOCElevation in feet above mean sea level
EN1214151012MGM Page 1 of 1

TABLE 3‐4
Surface Water Sample Results
Technical Work Plan‐‐DEAP, Montgomery, Alabama
PCE
TPC: 1.9TCE
TPC: 17.5cis‐1,2‐DCE
TPC: 5,907
trans‐1,2‐
DCE
TPC: 5,907
Vinyl
chloride
TPC: 1.4Benzene
TPC: 15.5Toluene
TPC: 8,723
Ethyl‐
benzene
TPC: 1.244
total
Xylenes
TPC: NA
0241998804 0.23 0.04 J < 0.02 < 0.032 < 0.08 < 0.021 0.05 J < 0.03 < 0.038
0241998805 0.22 0.04 J < 0.02 < 0.032 < 0.08 < 0.021 0.02 J < 0.03 < 0.038
0241998807 0.03 J < 0.04 < 0.02 < 0.032 < 0.08 < 0.021 < 0.02 < 0.03 < 0.038
0241998808 < 0.03 < 0.04 < 0.02 < 0.032 < 0.08 < 0.021 0.03 J < 0.03 < 0.038
PCE TCE cis‐1,2‐DCE
trans‐1,2‐
DCE
Vinyl
chloride Benzene Toluene
Ethyl‐
benzene
total
Xylenes
0241998802 < 0.04 < 0.02 < 0.02 < 0.02 < 0.08 < 0.02 0.07 J < 0.04 < 0.04
0241998804 0.11 0.03 J < 0.02 < 0.02 < 0.08 < 0.02 0.06 J < 0.04 < 0.04
0241998805 0.09 J 0.03 J < 0.02 < 0.02 < 0.08 < 0.02 0.04 J < 0.04 < 0.04
0241998806 0.09 J 0.03 J < 0.02 < 0.02 < 0.08 < 0.02 0.04 J < 0.04 < 0.04
0241998807 0.03 J < 0.02 < 0.02 < 0.02 < 0.08 < 0.02 < 0.02 < 0.04 < 0.04
0241998808 0.03 J < 0.02 < 0.02 < 0.02 < 0.08 < 0.02 0.06 J < 0.04 < 0.04
0241998809 0.52 < 0.02 < 0.02 < 0.02 < 0.08 < 0.02 0.03 J < 0.04 < 0.04
Notes:
Concentrations are in micrograms per liter
J ‐ the value is estimated
PCE ‐ tetrachloroethene
TCE ‐ trichloroethene
DCE ‐ dichloroethene
TPC ‐ toxic pollutant criteria per ADEM Admin. Code R. 335‐6‐10.07
NA ‐ no screening level available
DEAP ‐ Downtown Environmental Assessment Project
Station ID
Station ID
2006
2008
EN1214151012MGM Page 1 of 1

TABLE 3‐5Soil Sample Results
Technical Work Plan‐‐DEAP, Montgomery, Alabama
Station ID
Sample Depth
Interval
(ft bgs)
PCE
PSV: 0.48
TCE
PSV: 0.053
cis‐1,2‐DCE
PSV: 4.3
trans‐1,2‐DCE
PSV: 6.9
Vinyl chloride
PSV: 0.079
Benzene
PSV: 0.64
Toluene
PSV: 520
Ethyl‐
benzene
PSV: 400
total Xylenes
PSV: 27
RSA‐1 1.5 ‐ 4 < 0.050 NR1 NR1 NR1 NR1 NR1 NR1 NR1 NR1
RSA‐1 25 ‐ 25 3989 NR1 NR1 NR1 NR1 NR1 NR1 NR1 NR1
RSA‐2 4 ‐ 6.5 < 0.025 NR1 NR1 NR1 NR1 NR1 NR1 NR1 NR1
RSA‐2 21.5 ‐ 21.5 7066 NR1 NR1 NR1 NR1 NR1 NR1 NR1 NR1
RSA‐2 25 ‐ 25 7268 NR1 NR1 NR1 NR1 NR1 NR1 NR1 NR1
RSA‐3 25 ‐ 25 7843 NR1 NR1 NR1 NR1 NR1 NR1 NR1 NR1
ADEM‐T4 0 ‐ 4 0.06 NR1 NR1 NR1 NR1 NR1 NR1 NR1 NR1
H‐1 1.5 ‐ 4 ND1 NR1 NR1 NR1 NR1 NR1 NR1 NR1 NR1
H‐1 4 ‐ 6 ND1 NR1 NR1 NR1 NR1 NR1 NR1 NR1 NR1
H‐4 1.5 ‐ 4 ND1 NR1 NR1 NR1 NR1 NR1 NR1 NR1 NR1
TR‐5 0 ‐ 4 0.06 NR1 NR1 NR1 NR1 NR1 NR1 NR1 NR1
TR‐6 0 ‐ 4 0.13 NR1 NR1 NR1 NR1 NR1 NR1 NR1 NR1
HSA‐1 1.5 ‐ 4 < 0.025 NR1 NR1 NR1 NR1 NR1 NR1 NR1 NR1
HSA‐1 4 ‐ 6.5 0.09 NR1 NR1 NR1 NR1 NR1 NR1 NR1 NR1
HSA‐2 1.5 ‐ 4 < 0.025 NR1 NR1 NR1 NR1 NR1 NR1 NR1 NR1
HSA‐2 4 ‐ 6.5 < 0.025 NR1 NR1 NR1 NR1 NR1 NR1 NR1 NR1
HSA‐3 1.5 ‐ 4 < 0.025 NR1 NR1 NR1 NR1 NR1 NR1 NR1 NR1
HSA‐3 4 ‐ 6.5 < 0.025 NR1 NR1 NR1 NR1 NR1 NR1 NR1 NR1
HSA‐3 6.5 ‐ 8 < 0.025 NR1 NR1 NR1 NR1 NR1 NR1 NR1 NR1
SP‐2C 4 ‐ 6.5 ND1 NR1 NR1 NR1 NR1 NR1 NR1 NR1 NR1
BH‐1 1.5 ‐ 4 < 0.025 NR1 NR1 NR1 NR1 NR1 NR1 NR1 NR1
BH‐1 4 ‐ 6.5 < 0.025 NR1 NR1 NR1 NR1 NR1 NR1 NR1 NR1
BH‐5 6.5 ‐ 8 0.02 NR1 NR1 NR1 NR1 NR1 NR1 NR1 NR1
MW‐02S 11 ‐ 13 < 0.050 < 0.050 < 0.050 ND1 < 0.050 < 0.050 < 0.050 < 0.050 < 0.050MW‐02S 18 ‐ 20 < 0.050 < 0.050 < 0.050 ND1 < 0.050 < 0.050 < 0.050 < 0.050 < 0.050MW‐02S 25 ‐ 27 < 0.050 < 0.050 < 0.050 ND1 < 0.050 < 0.050 < 0.050 < 0.050 < 0.050MW‐02S 32 ‐ 34 < 0.050 < 0.050 < 0.050 ND1 < 0.050 < 0.050 < 0.050 < 0.050 < 0.050MW‐02S 4 ‐ 6 < 0.050 < 0.050 < 0.050 ND1 < 0.050 < 0.050 < 0.050 < 0.050 < 0.050MW‐03S 4 ‐ 6 < 0.050 < 0.05 < 0.050 ND1 < 0.05 < 0.050 < 0.050 < 0.050 < 0.05MW‐03S 11 ‐ 13 < 0.050 < 0.05 < 0.050 ND1 < 0.05 < 0.050 < 0.050 < 0.050 < 0.05MW‐03S 18 ‐ 20 < 0.050 < 0.05 < 0.050 ND1 < 0.05 < 0.050 < 0.050 < 0.050 < 0.05MW‐03S 25 ‐ 27 < 0.050 < 0.05 < 0.050 ND1 < 0.05 < 0.050 < 0.050 < 0.050 < 0.05MW‐03S 32 ‐ 34 < 0.050 < 0.05 < 0.050 ND1 < 0.05 < 0.050 < 0.050 < 0.050 < 0.05B1 4 ‐ 6 < 0.025 < 0.025 < 0.025 ND1 < 0.025 < 0.025 < 0.025 < 0.025 < 0.025
1993
EN1214151012MGM Page 1 of 9

TABLE 3‐5Soil Sample Results
Technical Work Plan‐‐DEAP, Montgomery, Alabama
Station ID
Sample Depth
Interval
(ft bgs)
PCE
PSV: 0.48
TCE
PSV: 0.053
cis‐1,2‐DCE
PSV: 4.3
trans‐1,2‐DCE
PSV: 6.9
Vinyl chloride
PSV: 0.079
Benzene
PSV: 0.64
Toluene
PSV: 520
Ethyl‐
benzene
PSV: 400
total Xylenes
PSV: 27
B1 11 ‐ 13 < 0.025 ND1 ND1 ND1 ND1 ND1 ND1 ND1 ND1
B1 18 ‐ 20 < 0.025 ND1 ND1 ND1 ND1 < 0.025 ND1 ND1 ND1
B1 25 ‐ 27 < 0.025 < 0.025 < 0.025 ND1 < 0.025 < 0.025 < 0.025 < 0.025 < 0.025B1 32 ‐ 34 < 0.025 < 0.025 < 0.025 ND1 < 0.025 < 0.025 < 0.025 < 0.025 < 0.025B2 4 ‐ 6 < 0.025 < 0.025 < 0.025 ND1 < 0.025 < 0.025 < 0.025 < 0.025 < 0.025B2 11 ‐ 13 < 0.025 < 0.025 < 0.025 ND1 < 0.025 < 0.025 < 0.025 < 0.025 < 0.025B2 18 ‐ 20 < 0.025 < 0.025 < 0.025 ND1 < 0.025 < 0.025 < 0.025 < 0.025 < 0.025B2 25 ‐ 27 < 0.025 < 0.025 < 0.025 ND1 < 0.025 < 0.025 < 0.025 < 0.025 < 0.025B2 32 ‐ 34 < 0.025 < 0.025 < 0.025 ND1 < 0.025 < 0.025 < 0.025 < 0.025 < 0.025B4 4 ‐ 6 < 0.050 < 0.05 < 0.050 ND1 < 0.05 < 0.050 < 0.050 < 0.050 < 0.05B4 11 ‐ 13 < 0.018 < 0.018 < 0.018 ND1 < 0.018 < 0.018 < 0.018 < 0.018 < 0.018B4 18 ‐ 20 < 0.050 < 0.05 < 0.050 ND1 < 0.05 < 0.050 < 0.050 < 0.050 < 0.05B4 25 ‐ 27 < 0.050 < 0.05 < 0.050 ND1 < 0.05 < 0.050 < 0.050 < 0.050 < 0.05B4 32 ‐ 34 < 0.025 < 0.025 < 0.025 ND1 < 0.025 < 0.025 < 0.025 < 0.025 < 0.025
RI_B‐1 20 ‐ 21.5 ND2 ND2 ND2 ND2 N/A ND2 ND2 ND2 ND2
RI_B‐1 30 ‐ 31.5 ND2 ND2 ND2 ND2 N/A ND2 ND2 ND2 ND2
RI_B‐2 10 ‐ 11.5 ND2 ND2 ND2 ND2 N/A ND2 ND2 ND2 ND2
RI_B‐2 30 ‐ 31.5 ND2 ND2 ND2 ND2 N/A ND2 ND2 ND2 ND2
RI_B‐3 5 ‐ 6.5 27 22 ND2 ND2 N/A ND2 ND2 ND2 ND2
RI_B‐3 30 ‐ 31.5 ND2 ND2 ND2 ND2 N/A ND2 ND2 ND2 ND2
CH2‐SB01 5 ‐ 7 0.00071 0.00012 < 0.002 < 0.002 < 0.002 0.00097 0.00071 0.00042 0.00038
CH2‐SB01 10 ‐ 12 0.00041 0.00015 < 0.002 0.0001 < 0.002 0.00016 0.00043 0.00052 0.00036
CH2‐SB01 15 ‐ 17 0.00047 < 0.002 < 0.002 < 0.002 < 0.002 0.00055 0.00079 0.00052 0.00032
CH2‐SB01 20 ‐ 22 0.0002 0.00005 < 0.002 < 0.002 < 0.002 0.00018 0.00051 0.0003 0.00019
CH2‐SB01 25 ‐ 27 0.00013 0.00006 < 0.002 < 0.002 < 0.002 0.00011 0.00056 0.00037 0.0002
CH2‐SB01 30 ‐ 32 0.00002 < 0.002 < 0.002 < 0.002 < 0.002 0.00007 0.0002 0.00025 0.00011
CH2‐SB02 5 ‐ 7 0.00025 < 0.002 < 0.002 < 0.002 < 0.002 0.00013 0.00066 0.00027 0.00017
CH2‐SB02 10 ‐ 12 0.00006 < 0.002 < 0.002 < 0.002 < 0.002 0.00009 0.00026 0.00026 0.00014
CH2‐SB02 15 ‐ 17 0.00008 0.00002 < 0.002 < 0.002 < 0.002 0.00008 0.00027 0.00026 0.00013
CH2‐SB02 20 ‐ 22 0.00005 < 0.002 < 0.002 < 0.002 < 0.002 0.00015 0.00051 0.0002 0.0001
CH2‐SB02 25 ‐ 27 0.00001 < 0.002 < 0.002 < 0.002 < 0.002 0.00008 0.00045 0.00026 0.00012
CH2‐SB02 30 ‐ 32 0.00009 0.00001 < 0.002 < 0.002 < 0.002 0.00012 0.00039 0.0001 0.00009
1998
1999
1993 (cont'd)
EN1214151012MGM Page 2 of 9

TABLE 3‐5Soil Sample Results
Technical Work Plan‐‐DEAP, Montgomery, Alabama
Station ID
Sample Depth
Interval
(ft bgs)
PCE
PSV: 0.48
TCE
PSV: 0.053
cis‐1,2‐DCE
PSV: 4.3
trans‐1,2‐DCE
PSV: 6.9
Vinyl chloride
PSV: 0.079
Benzene
PSV: 0.64
Toluene
PSV: 520
Ethyl‐
benzene
PSV: 400
total Xylenes
PSV: 27
CH2‐SB03 5 ‐ 7 0.00023 0.00015 < 0.002 < 0.002 < 0.002 0.00013 0.00074 0.00021 0.00016
CH2‐SB03 10 ‐ 12 0.00105 0.00065 < 0.002 0.00024 < 0.002 0.00041 0.00154 0.00074 0.00063
CH2‐SB03 15 ‐ 17 0.00088 0.00067 0.00034 0.00057 0.00006 0.0004 0.00135 0.00087 0.00087
CH2‐SB03 20 ‐ 22 0.00024 0.00003 < 0.002 < 0.002 < 0.002 0.00012 0.00035 0.00037 0.00022
CH2‐SB03 25 ‐ 27 0.00008 0.00003 < 0.002 < 0.002 < 0.002 0.0001 0.00011 0.00031 0.00014
CH2‐SB03 30 ‐ 32 0.00019 0.00008 < 0.002 0.00008 < 0.002 0.00014 0.00038 0.00027 0.00018
CH2‐SB04 5 ‐ 7 0.00007 < 0.002 < 0.002 < 0.002 < 0.002 0.00013 0.00041 0.00031 0.00012
CH2‐SB04 10 ‐ 12 0.00021 0.00001 < 0.002 < 0.002 < 0.002 0.01028 0.00362 0.00073 0.00047
CH2‐SB04 15 ‐ 17 0.00007 < 0.002 < 0.002 < 0.002 < 0.002 0.00011 0.00036 0.00019 0.00012
CH2‐SB04 20 ‐ 22 0.00007 < 0.002 < 0.002 < 0.002 < 0.002 0.00033 0.00048 0.00018 0.00011
CH2‐SB04 25 ‐ 27 0.00005 < 0.002 < 0.002 < 0.002 < 0.002 0.00027 0.0004 0.00017 0.00011
CH2‐SB04 30 ‐ 32 0.00003 0.00004 < 0.002 < 0.002 < 0.002 0.00007 0.00018 0.00015 0.00008
CH2‐SB05 5 ‐ 7 < 0.002 0.0015 < 0.002 < 0.002 < 0.002 < 0.002 < 0.002 0.01277 0.00685
CH2‐SB05 10 ‐ 12 < 0.002 < 0.002 < 0.002 < 0.002 < 0.002 0.00092 0.00085 0.00124 0.00044
CH2‐SB05 15 ‐ 17 0.00022 0.00012 < 0.002 0.00007 < 0.002 0.00285 0.00064 0.00248 0.00053
CH2‐SB05 20 ‐ 22 0.00244 0.00045 < 0.002 < 0.002 < 0.002 0.00086 0.00201 0.00249 0.00281
CH2‐SB05 25 ‐ 27 0.00005 0.00005 < 0.002 < 0.002 < 0.002 0.00015 0.00017 0.00038 0.00017
CH2‐SB05 30 ‐ 32 0.00017 0.00013 < 0.002 < 0.002 < 0.002 0.00022 0.00098 0.00031 0.00022
CH2‐SB06 5 ‐ 7 0.00132 0.00017 < 0.002 < 0.002 < 0.002 0.00019 0.00113 0.00022 0.00025
CH2‐SB06 10 ‐ 12 0.00184 0.00059 0.00016 0.00037 0.00003 0.00029 0.00146 0.00044 0.00045
CH2‐SB06 15 ‐ 17 0.0006 0.00008 < 0.002 0.00037 < 0.002 0.00014 0.00127 0.0002 0.00015
CH2‐SB06 20 ‐ 22 0.00154 0.00036 0.00014 0.00031 < 0.002 0.00027 0.00124 0.00034 0.00027
CH2‐SB06 25 ‐ 27 0.00176 0.00023 0.0001 0.00017 < 0.002 0.00021 0.00119 0.00043 0.00031
CH2‐SB06 30 ‐ 32 0.00086 0.0007 0.0001 0.00036 < 0.002 0.00041 0.00112 0.00063 0.00047
CH2‐SB07 5 ‐ 7 0.00004 0.00001 < 0.002 < 0.002 < 0.002 0.00006 0.00007 0.00009 0.00012
CH2‐SB07 10 ‐ 12 0.00004 0.00001 < 0.002 < 0.002 0.00001 0.00007 0.00008 0.00033 0.00025
CH2‐SB07 15 ‐ 17 0.00003 0.00001 < 0.002 < 0.002 < 0.002 0.00005 0.00007 0.00029 0.00022
CH2‐SB07 20 ‐ 22 0.00004 0.00002 < 0.002 < 0.002 < 0.002 0.00007 0.00008 0.00026 0.00021
CH2‐SB07 25 ‐ 27 0.00017 0.00002 < 0.002 < 0.002 < 0.002 0.0001 0.0001 0.00032 0.00021
CH2‐SB07 30 ‐ 32 0.00005 0.00001 < 0.002 < 0.002 < 0.002 0.00006 0.00008 0.00021 0.00018
CH2‐SB07 35 ‐ 37 0.00003 0.00001 < 0.002 < 0.002 < 0.002 0.00006 0.00011 0.00015 0.00019
CH2‐SB08 5 ‐ 7 0.00016 0.00002 < 0.002 < 0.002 < 0.002 0.00021 0.00054 0.00075 0.00098
CH2‐SB08 10 ‐ 12 0.00006 < 0.002 < 0.002 < 0.002 < 0.002 0.00007 0.00008 0.00031 0.00024
CH2‐SB08 15 ‐ 17 0.00005 0.00001 < 0.002 < 0.002 < 0.002 0.00007 0.00007 0.00012 0.00019
1999 (cont'd)
EN1214151012MGM Page 3 of 9

TABLE 3‐5Soil Sample Results
Technical Work Plan‐‐DEAP, Montgomery, Alabama
Station ID
Sample Depth
Interval
(ft bgs)
PCE
PSV: 0.48
TCE
PSV: 0.053
cis‐1,2‐DCE
PSV: 4.3
trans‐1,2‐DCE
PSV: 6.9
Vinyl chloride
PSV: 0.079
Benzene
PSV: 0.64
Toluene
PSV: 520
Ethyl‐
benzene
PSV: 400
total Xylenes
PSV: 27
CH2‐SB08 20 ‐ 22 0.00004 < 0.002 < 0.002 < 0.002 < 0.002 0.00005 0.00006 0.0002 0.00016
CH2‐SB08 25 ‐ 27 0.0001 0.00004 < 0.002 < 0.002 < 0.002 0.0001 0.00043 0.00016 0.00015
CH2‐SB08 30 ‐ 32 0.00009 0.00001 < 0.002 < 0.002 < 0.002 0.00007 0.00041 < 0.002 0.00026
CH2‐SB09 5 ‐ 7 < 0.002 < 0.002 < 0.002 0.00222 < 0.002 0.00181 0.0139 0.16148 0.19918
CH2‐SB09 10 ‐ 12 0.00006 < 0.002 < 0.002 < 0.002 < 0.002 0.00007 0.00025 0.00031 0.00018
CH2‐SB09 15 ‐ 17 0.00007 < 0.002 < 0.002 < 0.002 < 0.002 0.00007 0.00016 0.00018 0.00019
CH2‐SB09 20 ‐ 22 0.00005 < 0.002 < 0.002 < 0.002 < 0.002 0.00005 0.00025 0.00021 0.00023
CH2‐SB09 25 ‐ 27 0.00006 < 0.002 < 0.002 < 0.002 < 0.002 0.00006 0.00019 0.00019 0.00011
CH2‐SB09 30 ‐ 32 0.00011 0.00003 < 0.002 < 0.002 < 0.002 0.00008 0.00023 0.00032 0.00025
CH2‐SB10 5 ‐ 7 0.00027 0.00015 0.00006 0.0001 0.00006 0.00011 0.00018 0.00038 0.00036
CH2‐SB10 10 ‐ 12 0.00007 0.00001 < 0.002 < 0.002 < 0.002 0.00011 0.00012 0.00019 0.00021
CH2‐SB10 15 ‐ 17 0.00007 0.00002 0.00002 < 0.002 0.00002 0.00011 0.00014 0.00022 0.00021
CH2‐SB10 20 ‐ 22 0.00003 < 0.002 < 0.002 < 0.002 < 0.002 0.00006 0.00008 0.00012 0.00018
CH2‐SB10 25 ‐ 27 0.00008 0.00003 0.00002 0.00003 < 0.002 0.00006 0.00008 0.00024 0.00016
CH2‐SB10 30 ‐ 32 0.00005 0.00001 < 0.002 < 0.002 < 0.002 0.00007 0.00012 0.00018 0.00022
CH2‐SB10 35 ‐ 37 0.00005 < 0.002 < 0.002 < 0.002 < 0.002 0.00007 0.00008 0.00022 0.00015
CH2‐SB10 40 ‐ 42 0.00009 0.00003 < 0.002 < 0.002 < 0.002 0.00006 0.00031 0.00035 0.00027
CH2‐SB11 5 ‐ 7 0.00005 < 0.002 < 0.002 < 0.002 < 0.002 0.00009 0.0001 0.00011 0.00013
CH2‐SB11 10 ‐ 12 0.00013 < 0.002 < 0.002 < 0.002 < 0.002 0.00008 0.00033 0.0007 0.0004
CH2‐SB11 15 ‐ 17 0.00009 0.00002 < 0.002 < 0.002 < 0.002 0.00007 0.00032 0.0002 0.00034
CH2‐SB11 20 ‐ 22 0.0001 0.00003 < 0.002 < 0.002 < 0.002 0.00006 0.00032 0.0001 0.00019
CH2‐SB11 25 ‐ 27 0.00019 0.00003 < 0.002 < 0.002 < 0.002 0.00007 0.00027 < 0.002 0.0003
CH2‐SB11 30 ‐ 32 0.00008 0.00002 < 0.002 < 0.002 < 0.002 0.00009 0.00031 0.00033 0.00024
CH2‐SB11 35 ‐ 37 0.00012 0.00002 < 0.002 < 0.002 < 0.002 0.00018 0.00031 0.0005 0.00031
CH2‐SB11 40 ‐ 42 0.00011 0.00002 < 0.002 < 0.002 < 0.002 0.00007 0.00032 0.0005 0.00024
CH2‐SB12 5 ‐ 7 0.00008 0.00001 < 0.002 < 0.002 < 0.002 0.00005 0.00017 0.00023 0.00015
CH2‐SB12 10 ‐ 12 0.00005 < 0.002 < 0.002 < 0.002 < 0.002 0.00007 0.00016 0.00015 0.00016
CH2‐SB12 15 ‐ 17 0.00005 < 0.002 < 0.002 < 0.002 < 0.002 0.00006 0.00017 0.00032 0.00018
CH2‐SB12 20 ‐ 22 0.00005 0.00001 < 0.002 < 0.002 < 0.002 0.00005 0.00016 0.00016 0.00013
CH2‐SB12 25 ‐ 27 0.00008 0.00002 < 0.002 < 0.002 < 0.002 0.00009 0.00019 0.00044 0.00026
CH2‐SB12 30 ‐ 32 0.00018 0.00017 0.00003 0.00011 0.00013 0.00011 0.0002 0.00043 0.00039
CH2‐SB12 35 ‐ 37 0.00022 0.00007 0.00002 0.00006 < 0.002 0.00007 0.0002 0.00037 0.00028
CH2‐SB12 40 ‐ 42 0.00046 0.0002 0.00007 0.00016 < 0.002 0.00015 0.00042 0.00047 0.00052
CH2‐SB13 5 ‐ 7 < 0.002 0.00002 < 0.002 < 0.002 < 0.002 0.00013 0.00018 0.00089 0.00033
1999 (cont'd)
EN1214151012MGM Page 4 of 9
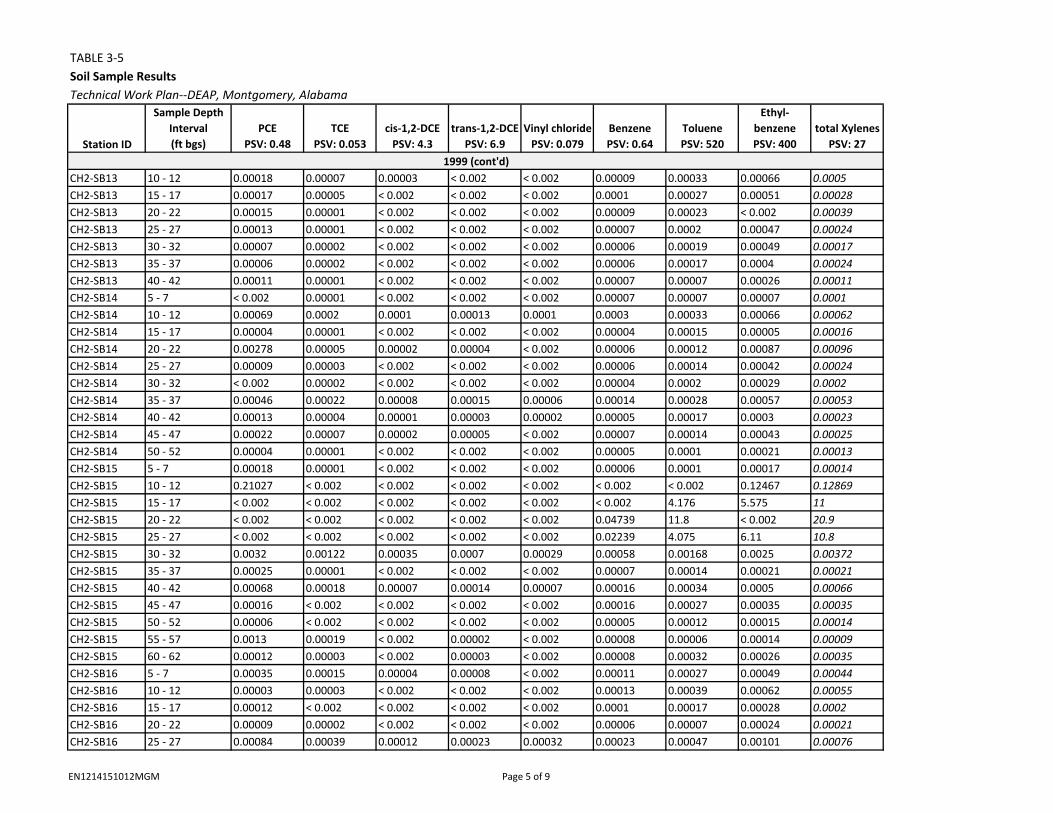
TABLE 3‐5Soil Sample Results
Technical Work Plan‐‐DEAP, Montgomery, Alabama
Station ID
Sample Depth
Interval
(ft bgs)
PCE
PSV: 0.48
TCE
PSV: 0.053
cis‐1,2‐DCE
PSV: 4.3
trans‐1,2‐DCE
PSV: 6.9
Vinyl chloride
PSV: 0.079
Benzene
PSV: 0.64
Toluene
PSV: 520
Ethyl‐
benzene
PSV: 400
total Xylenes
PSV: 27
CH2‐SB13 10 ‐ 12 0.00018 0.00007 0.00003 < 0.002 < 0.002 0.00009 0.00033 0.00066 0.0005
CH2‐SB13 15 ‐ 17 0.00017 0.00005 < 0.002 < 0.002 < 0.002 0.0001 0.00027 0.00051 0.00028
CH2‐SB13 20 ‐ 22 0.00015 0.00001 < 0.002 < 0.002 < 0.002 0.00009 0.00023 < 0.002 0.00039
CH2‐SB13 25 ‐ 27 0.00013 0.00001 < 0.002 < 0.002 < 0.002 0.00007 0.0002 0.00047 0.00024
CH2‐SB13 30 ‐ 32 0.00007 0.00002 < 0.002 < 0.002 < 0.002 0.00006 0.00019 0.00049 0.00017
CH2‐SB13 35 ‐ 37 0.00006 0.00002 < 0.002 < 0.002 < 0.002 0.00006 0.00017 0.0004 0.00024
CH2‐SB13 40 ‐ 42 0.00011 0.00001 < 0.002 < 0.002 < 0.002 0.00007 0.00007 0.00026 0.00011
CH2‐SB14 5 ‐ 7 < 0.002 0.00001 < 0.002 < 0.002 < 0.002 0.00007 0.00007 0.00007 0.0001
CH2‐SB14 10 ‐ 12 0.00069 0.0002 0.0001 0.00013 0.0001 0.0003 0.00033 0.00066 0.00062
CH2‐SB14 15 ‐ 17 0.00004 0.00001 < 0.002 < 0.002 < 0.002 0.00004 0.00015 0.00005 0.00016
CH2‐SB14 20 ‐ 22 0.00278 0.00005 0.00002 0.00004 < 0.002 0.00006 0.00012 0.00087 0.00096
CH2‐SB14 25 ‐ 27 0.00009 0.00003 < 0.002 < 0.002 < 0.002 0.00006 0.00014 0.00042 0.00024
CH2‐SB14 30 ‐ 32 < 0.002 0.00002 < 0.002 < 0.002 < 0.002 0.00004 0.0002 0.00029 0.0002
CH2‐SB14 35 ‐ 37 0.00046 0.00022 0.00008 0.00015 0.00006 0.00014 0.00028 0.00057 0.00053
CH2‐SB14 40 ‐ 42 0.00013 0.00004 0.00001 0.00003 0.00002 0.00005 0.00017 0.0003 0.00023
CH2‐SB14 45 ‐ 47 0.00022 0.00007 0.00002 0.00005 < 0.002 0.00007 0.00014 0.00043 0.00025
CH2‐SB14 50 ‐ 52 0.00004 0.00001 < 0.002 < 0.002 < 0.002 0.00005 0.0001 0.00021 0.00013
CH2‐SB15 5 ‐ 7 0.00018 0.00001 < 0.002 < 0.002 < 0.002 0.00006 0.0001 0.00017 0.00014
CH2‐SB15 10 ‐ 12 0.21027 < 0.002 < 0.002 < 0.002 < 0.002 < 0.002 < 0.002 0.12467 0.12869
CH2‐SB15 15 ‐ 17 < 0.002 < 0.002 < 0.002 < 0.002 < 0.002 < 0.002 4.176 5.575 11
CH2‐SB15 20 ‐ 22 < 0.002 < 0.002 < 0.002 < 0.002 < 0.002 0.04739 11.8 < 0.002 20.9
CH2‐SB15 25 ‐ 27 < 0.002 < 0.002 < 0.002 < 0.002 < 0.002 0.02239 4.075 6.11 10.8
CH2‐SB15 30 ‐ 32 0.0032 0.00122 0.00035 0.0007 0.00029 0.00058 0.00168 0.0025 0.00372
CH2‐SB15 35 ‐ 37 0.00025 0.00001 < 0.002 < 0.002 < 0.002 0.00007 0.00014 0.00021 0.00021
CH2‐SB15 40 ‐ 42 0.00068 0.00018 0.00007 0.00014 0.00007 0.00016 0.00034 0.0005 0.00066
CH2‐SB15 45 ‐ 47 0.00016 < 0.002 < 0.002 < 0.002 < 0.002 0.00016 0.00027 0.00035 0.00035
CH2‐SB15 50 ‐ 52 0.00006 < 0.002 < 0.002 < 0.002 < 0.002 0.00005 0.00012 0.00015 0.00014
CH2‐SB15 55 ‐ 57 0.0013 0.00019 < 0.002 0.00002 < 0.002 0.00008 0.00006 0.00014 0.00009
CH2‐SB15 60 ‐ 62 0.00012 0.00003 < 0.002 0.00003 < 0.002 0.00008 0.00032 0.00026 0.00035
CH2‐SB16 5 ‐ 7 0.00035 0.00015 0.00004 0.00008 < 0.002 0.00011 0.00027 0.00049 0.00044
CH2‐SB16 10 ‐ 12 0.00003 0.00003 < 0.002 < 0.002 < 0.002 0.00013 0.00039 0.00062 0.00055
CH2‐SB16 15 ‐ 17 0.00012 < 0.002 < 0.002 < 0.002 < 0.002 0.0001 0.00017 0.00028 0.0002
CH2‐SB16 20 ‐ 22 0.00009 0.00002 < 0.002 < 0.002 < 0.002 0.00006 0.00007 0.00024 0.00021
CH2‐SB16 25 ‐ 27 0.00084 0.00039 0.00012 0.00023 0.00032 0.00023 0.00047 0.00101 0.00076
1999 (cont'd)
EN1214151012MGM Page 5 of 9

TABLE 3‐5Soil Sample Results
Technical Work Plan‐‐DEAP, Montgomery, Alabama
Station ID
Sample Depth
Interval
(ft bgs)
PCE
PSV: 0.48
TCE
PSV: 0.053
cis‐1,2‐DCE
PSV: 4.3
trans‐1,2‐DCE
PSV: 6.9
Vinyl chloride
PSV: 0.079
Benzene
PSV: 0.64
Toluene
PSV: 520
Ethyl‐
benzene
PSV: 400
total Xylenes
PSV: 27
CH2‐SB16 30 ‐ 32 0.00009 0.00001 < 0.002 < 0.002 < 0.002 0.00009 0.00024 0.00044 0.00035
CH2‐SB16 35 ‐ 37 0.00007 0.00003 < 0.002 < 0.002 < 0.002 0.00011 0.00026 0.00041 0.00033
CH2‐SB16 40 ‐ 42 0.00045 0.00028 0.00009 0.0002 0.00017 0.00016 0.00031 0.00056 0.00043
CH2‐SB16 45 ‐ 47 0.0013 0.00059 0.00018 0.00043 0.0002 0.00029 0.00066 0.00085 0.00097
CH2‐SB16 50 ‐ 52 0.00049 0.00026 0.0001 0.00019 0.00004 0.00019 0.00036 0.00051 0.00061
CH2‐SB16 55 ‐ 57 0.00007 < 0.002 < 0.002 < 0.002 < 0.002 0.00009 0.00021 0.00034 0.0005
CH2‐SB16 60 ‐ 62 0.00008 0.00004 < 0.002 < 0.002 < 0.002 0.00006 0.00019 0.00017 0.00012
CH2‐SB16 65 ‐ 67 0.00004 0.00001 < 0.002 < 0.002 < 0.002 0.00007 0.0002 0.00018 0.00021
CH2‐SB17 5 ‐ 7 0.00001 0.00003 < 0.002 < 0.002 < 0.002 0.00001 0.00015 0.00002 0.00034
CH2‐SB17 10 ‐ 12 < 0.002 0.00044 < 0.002 < 0.002 < 0.002 0.00053 0.00044 0.00092 0.00018
CH2‐SB17 15 ‐ 17 < 0.002 0.00044 < 0.002 < 0.002 < 0.002 0.00053 0.00042 0.00077 0.00003
CH2‐SB17 20 ‐ 22 < 0.002 0.00045 < 0.002 < 0.002 < 0.002 0.00051 0.00048 0.00069 0.00022
CH2‐SB17 25 ‐ 27 0.0001 0.00002 < 0.002 0.00001 < 0.002 0.00006 0.00008 0.00022 0.00019
CH2‐SB17 30 ‐ 32 0.00006 < 0.002 < 0.002 < 0.002 < 0.002 0.00006 0.00006 0.00015 0.00014
CH2‐SB17 35 ‐ 37 < 0.002 0.00059 < 0.002 < 0.002 < 0.002 0.0006 0.00082 0.00184 0.00117
CH2‐SB17 40 ‐ 42 0.0002 0.00006 < 0.002 < 0.002 < 0.002 0.00012 0.00036 0.00016 0.00026
CH2‐SB17 45 ‐ 47 0.00003 0.00003 < 0.002 < 0.002 < 0.002 0.00007 0.00021 < 0.002 0.00009
CH2‐SB18 5 ‐ 7 0.00012 0.00001 < 0.002 < 0.002 < 0.002 0.00021 0.00034 0.00044 0.00039
CH2‐SB18 10 ‐ 12 0.00008 < 0.002 < 0.002 < 0.002 < 0.002 0.0001 0.00016 0.00035 0.00019
CH2‐SB18 15 ‐ 17 < 0.002 0.00001 < 0.002 < 0.002 < 0.002 0.00008 0.00015 0.00011 0.00016
CH2‐SB18 20 ‐ 22 < 0.002 < 0.002 < 0.002 < 0.002 < 0.002 0.00042 0.01661 0.00824 0.01941
CH2‐SB18 25 ‐ 27 0.00003 0.00002 < 0.002 < 0.002 < 0.002 0.00007 0.00012 0.00023 0.00026
CH2‐SB18 30 ‐ 32 0.00007 0.00001 < 0.002 < 0.002 < 0.002 0.00009 0.00022 0.00019 0.00019
CH2‐SB18 35 ‐ 37 0.00022 0.0001 0.00004 0.00007 < 0.002 0.00012 0.00032 0.00029 0.00032
CH2‐SB18 40 ‐ 42 < 0.002 0.00027 < 0.002 < 0.002 < 0.002 0.00035 0.00022 0.00011 0.00011
SB‐01I 8 ‐ 9 < 0.011 < 0.011 < 0.011 < 0.011 < 0.011 < 0.011 < 0.011 < 0.011 < 0.011SB‐01I 25 ‐ 26 < 0.011 < 0.011 < 0.011 < 0.011 < 0.011 < 0.011 < 0.011 < 0.011 < 0.011SB‐01I 31 ‐ 32 < 0.011 < 0.011 < 0.011 < 0.011 < 0.011 < 0.011 < 0.011 < 0.011 < 0.011SB‐01I 41 ‐ 42 < 0.012 < 0.012 < 0.012 < 0.012 < 0.012 < 0.012 < 0.012 < 0.012 < 0.012SB‐01I 55 ‐ 56 < 0.013 < 0.013 < 0.013 < 0.013 < 0.013 < 0.013 < 0.013 < 0.013 < 0.013SB‐01I 61 ‐ 62 < 0.013 < 0.013 < 0.013 < 0.013 < 0.013 < 0.013 < 0.013 < 0.013 < 0.013SB‐01I 71 ‐ 72 < 0.012 < 0.012 < 0.012 < 0.012 < 0.012 < 0.012 < 0.012 < 0.012 < 0.012SB‐01I 83 ‐ 84 < 0.012 < 0.012 < 0.012 < 0.012 < 0.012 < 0.012 < 0.012 < 0.012 < 0.012
1999 (cont'd)
2000
EN1214151012MGM Page 6 of 9

TABLE 3‐5Soil Sample Results
Technical Work Plan‐‐DEAP, Montgomery, Alabama
Station ID
Sample Depth
Interval
(ft bgs)
PCE
PSV: 0.48
TCE
PSV: 0.053
cis‐1,2‐DCE
PSV: 4.3
trans‐1,2‐DCE
PSV: 6.9
Vinyl chloride
PSV: 0.079
Benzene
PSV: 0.64
Toluene
PSV: 520
Ethyl‐
benzene
PSV: 400
total Xylenes
PSV: 27
SB‐01I 91 ‐ 92 < 0.012 < 0.012 < 0.012 < 0.012 < 0.012 < 0.012 < 0.012 < 0.012 < 0.012SB‐01I 101 ‐ 102 < 0.012 < 0.012 < 0.012 < 0.012 < 0.012 < 0.012 < 0.012 < 0.012 < 0.012SB‐01I 112 ‐ 113 < 0.012 < 0.012 < 0.012 < 0.012 < 0.012 < 0.012 < 0.012 < 0.012 < 0.012SB‐01I 122 ‐ 123 < 0.012 < 0.012 < 0.012 < 0.012 < 0.012 < 0.012 < 0.012 < 0.012 < 0.012SB‐01I 131 ‐ 132 < 0.012 < 0.012 < 0.012 < 0.012 < 0.012 < 0.012 < 0.012 < 0.012 < 0.012SB‐01I 140 ‐ 141 < 0.012 < 0.012 < 0.012 < 0.012 < 0.012 < 0.012 < 0.012 < 0.012 < 0.012SB‐04I 25 ‐ 26 < 0.01 < 0.01 < 0.01 < 0.01 < 0.01 < 0.01 < 0.01 < 0.01 < 0.01SB‐04I 137 ‐ 139 < 0.014 < 0.014 < 0.014 < 0.014 < 0.014 < 0.014 < 0.014 < 0.014 < 0.014SB‐05I 8 ‐ 10 < 0.011 < 0.011 < 0.011 < 0.011 < 0.011 < 0.011 < 0.011 < 0.011 < 0.011SB‐05I 24 ‐ 26 0.002 J < 0.012 < 0.012 < 0.012 < 0.012 < 0.012 < 0.012 < 0.012 < 0.012SB‐05I 28 ‐ 30 < 0.012 < 0.012 < 0.012 < 0.012 < 0.012 < 0.012 < 0.012 < 0.012 < 0.012SB‐05I 45 ‐ 47 < 0.012 < 0.012 < 0.012 < 0.012 < 0.012 < 0.012 < 0.012 < 0.012 < 0.012SB‐05I 55 ‐ 57 < 0.011 < 0.011 < 0.011 < 0.011 < 0.011 < 0.011 < 0.011 < 0.011 < 0.011SB‐05I 59 ‐ 61 < 0.012 < 0.012 < 0.012 < 0.012 < 0.012 < 0.012 < 0.012 < 0.012 < 0.012SB‐05I 74 ‐ 76 < 0.012 < 0.012 < 0.012 < 0.012 < 0.012 < 0.012 < 0.012 < 0.012 < 0.012SB‐05I 78 ‐ 80 < 0.012 < 0.012 < 0.012 < 0.012 < 0.012 < 0.012 < 0.012 < 0.012 < 0.012SB‐05I 95 ‐ 97 < 0.012 < 0.012 < 0.012 < 0.012 < 0.012 < 0.012 < 0.012 < 0.012 < 0.012SB‐05I 105 ‐ 107 < 0.012 < 0.012 < 0.012 < 0.012 < 0.012 < 0.012 < 0.012 < 0.012 < 0.012SB‐05I 109 ‐ 111 < 0.012 < 0.012 < 0.012 < 0.012 < 0.012 < 0.012 < 0.012 < 0.012 < 0.012SB‐05I 125 ‐ 127 < 0.012 < 0.012 < 0.012 < 0.012 < 0.012 < 0.012 < 0.012 < 0.012 < 0.012SB‐05I 129 ‐ 131 < 0.012 < 0.012 < 0.012 < 0.012 < 0.012 < 0.012 < 0.012 < 0.012 < 0.012SB‐05I 142 ‐ 144 < 0.012 < 0.012 < 0.012 < 0.012 < 0.012 < 0.012 < 0.012 < 0.012 < 0.012SB‐05I 155 ‐ 157 < 0.011 < 0.011 < 0.011 < 0.011 < 0.011 < 0.011 < 0.011 < 0.011 < 0.011SB‐05I 160 ‐ 162 < 0.013 < 0.013 < 0.013 < 0.013 < 0.013 < 0.013 0.002 J < 0.013 < 0.013SB‐06S 25 ‐ 27 < 0.011 < 0.011 < 0.011 < 0.011 < 0.011 < 0.011 < 0.011 < 0.011 < 0.011SB‐06S 65 ‐ 67 < 0.011 < 0.011 < 0.011 < 0.011 < 0.011 < 0.011 < 0.011 < 0.011 < 0.011SB‐07I 53 ‐ 55 < 0.013 < 0.013 < 0.013 < 0.013 < 0.013 < 0.013 < 0.013 < 0.013 < 0.013SB‐07I 127 ‐ 129 < 0.013 < 0.013 < 0.013 < 0.013 < 0.013 < 0.013 < 0.013 < 0.013 < 0.013SB‐08S 30 ‐ 31 < 0.011 < 0.011 < 0.011 < 0.011 < 0.011 < 0.011 < 0.011 < 0.011 < 0.011SB‐08S 39 ‐ 40 < 0.012 < 0.012 < 0.012 < 0.012 < 0.012 < 0.012 < 0.012 < 0.012 < 0.012SB‐08I 118 ‐ 119 < 0.013 < 0.013 < 0.013 < 0.013 < 0.013 < 0.013 < 0.013 < 0.013 < 0.013SB‐09S 58 ‐ 59 < 0.012 < 0.012 < 0.012 < 0.012 < 0.012 < 0.012 < 0.012 < 0.012 < 0.012
2000 (cont'd)
EN1214151012MGM Page 7 of 9

TABLE 3‐5Soil Sample Results
Technical Work Plan‐‐DEAP, Montgomery, Alabama
Station ID
Sample Depth
Interval
(ft bgs)
PCE
PSV: 0.48
TCE
PSV: 0.053
cis‐1,2‐DCE
PSV: 4.3
trans‐1,2‐DCE
PSV: 6.9
Vinyl chloride
PSV: 0.079
Benzene
PSV: 0.64
Toluene
PSV: 520
Ethyl‐
benzene
PSV: 400
total Xylenes
PSV: 27
SB‐10S 58 ‐ 59 < 0.012 < 0.012 < 0.012 < 0.012 < 0.012 < 0.012 < 0.012 < 0.012 < 0.012SB‐11S 15 ‐ 16 < 0.012 0.002 J < 0.012 < 0.012 < 0.012 < 0.012 < 0.012 < 0.012 < 0.012SB‐11S 33 ‐ 35 < 0.01 < 0.01 < 0.01 < 0.01 < 0.01 < 0.01 < 0.01 < 0.01 < 0.01SB‐11I 74 ‐ 75 < 0.011 < 0.011 < 0.011 < 0.011 < 0.011 < 0.011 < 0.011 < 0.011 < 0.011SB‐11I 99 ‐ 100 < 0.011 < 0.011 < 0.011 < 0.011 < 0.011 < 0.011 < 0.011 < 0.011 < 0.011SB‐11I 139 ‐ 140 < 0.011 < 0.011 < 0.011 < 0.011 < 0.011 < 0.011 < 0.011 < 0.011 < 0.011SB‐11I 180 ‐ 181 < 0.011 < 0.011 < 0.011 < 0.011 < 0.011 < 0.011 < 0.011 < 0.011 < 0.011SB‐11I 237 ‐ 238 < 0.012 < 0.012 < 0.012 < 0.012 < 0.012 < 0.012 < 0.012 < 0.012 < 0.012
SB‐06 34 ‐ 36 < 0.011 < 0.011 < 0.011 < 0.011 < 0.011 < 0.011 < 0.011 < 0.011 < 0.011SB‐07 28 ‐ 30 < 0.012 < 0.012 < 0.012 < 0.012 < 0.012 < 0.012 < 0.012 < 0.012 < 0.012SB‐08 35 ‐ 36 < 0.012 < 0.012 < 0.012 < 0.012 < 0.012 < 0.012 < 0.012 < 0.012 < 0.012SB‐09 34 ‐ 39 < 0.013 < 0.013 < 0.013 < 0.013 < 0.013 0.003 J 0.002 J < 0.013 < 0.013SB‐10 48 ‐ 49 < 0.011 < 0.011 < 0.011 < 0.011 < 0.011 < 0.011 < 0.011 < 0.011 < 0.011SB‐11 37 ‐ 38 < 0.013 < 0.013 < 0.013 < 0.013 < 0.013 < 0.013 < 0.013 < 0.013 < 0.013SB‐12 33 ‐ 34 < 0.015 < 0.015 < 0.015 < 0.015 < 0.015 < 0.015 0.002 J < 0.015 < 0.015SB‐13 33 ‐ 36 < 0.011 < 0.011 < 0.011 < 0.011 < 0.011 < 0.011 < 0.011 < 0.011 < 0.011TW‐01 45 ‐ 50 < 0.011 < 0.011 < 0.011 < 0.011 < 0.011 < 0.011 < 0.011 < 0.011 < 0.011TW‐02 50 ‐ 52 < 0.013 < 0.013 < 0.013 < 0.013 < 0.013 < 0.013 < 0.013 < 0.013 < 0.013TW‐03 50 ‐ 52 < 0.013 < 0.013 < 0.013 < 0.013 < 0.013 < 0.013 < 0.013 < 0.013 < 0.013TW‐04 36 ‐ 38 < 0.012 < 0.012 < 0.012 < 0.012 < 0.012 < 0.012 < 0.012 < 0.012 < 0.012TW‐05 28 ‐ 30 < 0.011 < 0.011 < 0.011 < 0.011 < 0.011 < 0.011 < 0.011 < 0.011 < 0.011
MW‐12S 131 ‐ 131 < 0.0017 < 0.0017 < 0.0017 < 0.0017 < 0.0084 < 0.0017 < 0.0017 < 0.0017 < 0.0033
TW‐14 0 ‐ 1 < 0.0013 < 0.0013 < 0.0013 < 0.0013 < 0.0063 < 0.0013 < 0.0013 < 0.0013 < 0.0025
TW‐15 32 ‐ 33.6 < 0.001 < 0.001 < 0.001 < 0.001 < 0.0052 < 0.001 < 0.001 < 0.001 < 0.001
TW‐16 0 ‐ 1 < 0.0013 < 0.0013 < 0.0013 < 0.0013 < 0.0066 0.0028 J 0.0016 J < 0.0013 < 0.0026
ESA‐MW1 30 ‐ 35 < 0.005 N/A N/A N/A N/A < 0.005 < 0.005 < 0.005 < 0.005ESA‐MW1 60 ‐ 65 < 0.005 N/A N/A N/A N/A < 0.005 < 0.005 < 0.005 < 0.005ESA‐MW2 0 ‐ 5 < 0.005 N/A N/A N/A N/A < 0.005 < 0.005 < 0.005 < 0.005ESA‐MW2 25 ‐ 30 < 0.005 N/A N/A N/A N/A < 0.005 < 0.005 < 0.005 < 0.005ESA‐MW3 35 ‐ 40 < 0.005 N/A N/A N/A N/A < 0.005 < 0.005 < 0.005 < 0.005ESA‐MW3 55 ‐ 60 < 0.005 N/A N/A N/A N/A < 0.005 < 0.005 < 0.005 < 0.005
2003
2001
2002
2000 (cont'd)
EN1214151012MGM Page 8 of 9

TABLE 3‐5Soil Sample Results
Technical Work Plan‐‐DEAP, Montgomery, Alabama
Station ID
Sample Depth
Interval
(ft bgs)
PCE
PSV: 0.48
TCE
PSV: 0.053
cis‐1,2‐DCE
PSV: 4.3
trans‐1,2‐DCE
PSV: 6.9
Vinyl chloride
PSV: 0.079
Benzene
PSV: 0.64
Toluene
PSV: 520
Ethyl‐
benzene
PSV: 400
total Xylenes
PSV: 27
ESA‐SB1 10 ‐ 10 < 0.005 N/A N/A N/A N/A < 0.005 < 0.005 < 0.005 < 0.005ESA‐SB4 10 ‐ 10 < 0.005 N/A N/A N/A N/A < 0.005 < 0.005 < 0.005 < 0.005ESA‐SB5 10 ‐ 10 < 0.005 N/A N/A N/A N/A < 0.005 < 0.005 < 0.005 < 0.005ESA‐SB6 10 ‐ 10 < 0.005 N/A N/A N/A N/A < 0.005 < 0.005 < 0.005 < 0.005ESA‐SB7 10 ‐ 10 < 0.005 N/A N/A N/A N/A < 0.005 < 0.005 < 0.005 < 0.005ESA‐SB8 10 ‐ 10 < 0.005 N/A N/A N/A N/A < 0.005 < 0.005 < 0.005 < 0.005ESA‐SB9 10 ‐ 10 < 0.005 N/A N/A N/A N/A < 0.005 < 0.005 < 0.005 < 0.005
SB1 9 ‐ 11 < 0.005 < 0.005 < 0.005 < 0.005 < 0.005 < 0.005 < 0.005 < 0.005 < 0.005
SB1 14 ‐ 16 < 0.005 < 0.005 < 0.005 < 0.005 < 0.005 < 0.005 < 0.005 < 0.005 < 0.005
SB2 9 ‐ 11 < 0.005 < 0.005 < 0.005 < 0.005 < 0.005 < 0.005 < 0.005 < 0.005 < 0.005
SB2 14 ‐ 16 < 0.005 < 0.005 < 0.005 < 0.005 < 0.005 < 0.005 < 0.005 < 0.005 < 0.005
SB3 9 ‐ 11 < 0.005 < 0.005 < 0.005 < 0.005 < 0.005 < 0.005 < 0.005 < 0.005 < 0.005
SB3 14 ‐ 16 < 0.005 < 0.005 < 0.005 < 0.005 < 0.005 < 0.005 < 0.005 < 0.005 < 0.005
Notes: Concentrations are in milligrams per kilogram (mg/kg).
PCE ‐ tetrachloroetheneTCE ‐ trichloroetheneDCE ‐ dichloroethene
J ‐ the concentration is estimated
< not detected above the laboratory detection limit
2 ‐ River Front Phase II ESA (CWA Group, 1998), laboratory report did not provide the detection limit3 ‐ Phase 2: Montgomery Urban Garden (ADEM, 2010), only detected values presented in reportN/A ‐ not analyzedTotal xylene results are italicized when results are based on individual isomer concentrations.ADEM ‐ Alabama Department of Environmental Quality
2003 (cont'd)
1 ‐ not detected (ND) or not reported (NR), analyte may or may not have been analyzed, (Phase I Site Assessment [ADEM, 1996], laboratory reports not provided)
2005
PSV ‐ Residential Preliminary Screening Value from Alabama Risk‐based Corrective Action Guidance Manual (ADEM, 2008), direct contact exposure pathway
EN1214151012MGM Page 9 of 9

TABLE 3‐6Soil Vapor Sample Results
Technical Work Plan‐‐DEAP, Montgomery, Alabama
PCE
VISL: 360TCE
VISL: 16cis‐1,2‐DCE
VISL: NA
trans‐1,2‐
DCE
VISL: NABenzene
VISL: 12Toluene
VISL: 37Ethylbenzene
VISL: 170,000m,p‐Xylenes
VISL: 3,500o‐Xylenes
VISL: 3,500
Annex Building, November 2010 (Summa Canisters), units in ppbv
3082‐01 < 0.5 < 0.5 < 0.5 < 0.5 < 0.5 3.5 < 0.5 < 0.5 < 0.53082‐12 < 0.5 < 0.5 < 0.5 < 0.5 < 0.5 2 < 0.5 < 0.5 < 0.5
Phytoremediation Site, April 2011 (Gore Modules), units in ug
660513 0.16 < 0.02 < 0.02 < 0.5 < 0.01 0.27 < 0.02 < 0.02 < 0.01660514 0.43 < 0.02 < 0.02 < 0.5 < 0.01 0.05 < 0.02 < 0.02 < 0.01660515 < 0.02 < 0.02 < 0.02 < 0.5 < 0.01 < 0.01 < 0.02 < 0.02 < 0.01660516 < 0.02 < 0.02 < 0.02 < 0.5 < 0.01 0.04 < 0.02 < 0.02 < 0.01660517 < 0.02 < 0.02 < 0.02 < 0.5 < 0.01 < 0.01 < 0.02 < 0.02 < 0.01660518 < 0.02 < 0.02 < 0.02 < 0.5 < 0.01 0.05 < 0.02 < 0.02 < 0.01660519 < 0.02 < 0.02 < 0.02 < 0.5 < 0.01 < 0.01 < 0.02 0.02 < 0.01660520 < 0.02 < 0.02 < 0.02 < 0.5 < 0.01 < 0.01 < 0.02 < 0.02 < 0.01660521 < 0.02 < 0.02 < 0.02 < 0.5 < 0.01 < 0.01 < 0.02 < 0.02 < 0.01660522 0.08 < 0.02 < 0.02 < 0.5 < 0.01 < 0.01 < 0.02 < 0.02 < 0.01660523 < 0.02 < 0.02 < 0.02 < 0.5 < 0.01 < 0.01 < 0.02 < 0.02 < 0.01660524 < 0.02 < 0.02 < 0.02 < 0.5 < 0.01 < 0.01 < 0.02 < 0.02 < 0.01
670798 < 0.18 < 0.26 < 0.56 < 2.92 < 0.14 < 0.09 < 0.15 0.15 < 0.08670799 < 0.18 < 0.26 < 0.56 < 2.92 < 0.14 0.11 < 0.15 0.16 0.09
670800 2.92 < 1.41 < 3.06 < 16.01 1.04 < 0.47 < 0.82 < 0.82 < 0.43670801 2.3 < 1.41 < 3.06 < 16.01 < 0.76 1.02 < 0.82 < 0.82 < 0.43670803 4.6 < 1.41 < 3.06 < 16.01 < 0.76 < 0.47 < 0.82 < 0.82 < 0.43670804 6.78 < 1.41 < 3.06 < 16.01 < 0.76 2.58 < 0.82 < 0.82 < 0.43
670807 2.11 < 1.41 < 3.06 < 16.01 < 0.76 14.45 < 0.82 < 0.82 < 0.43670808 < 0.97 < 1.41 < 3.06 < 16.01 < 0.76 0.63 < 0.82 < 0.82 < 0.43670809 1.84 < 1.41 < 3.06 < 16.01 3.1 17.68 < 0.82 < 0.82 0.44
670810 20.3 < 1.41 < 3.06 < 16.01 < 0.76 3.22 < 0.82 < 0.82 < 0.43670811 57.78 < 1.41 < 3.06 < 16.01 < 0.76 < 0.47 < 0.82 < 0.82 < 0.43670813 < 0.18 < 0.26 < 0.56 < 2.92 < 0.14 0.11 < 0.15 0.16 < 0.08670814 < 0.97 1.53 < 3.06 < 16.01 < 0.76 2.92 < 0.82 < 0.82 < 0.43670815 < 0.18 < 0.26 < 0.56 < 2.92 < 0.14 < 0.09 < 0.15 0.31 0.17
670816 1.51 < 1.41 < 3.06 < 16.01 < 0.76 < 0.47 < 0.82 < 0.82 < 0.43
684996 0.64 290.85 2.45 < 1.94 < 0.46 < 0.28 < 0.25 < 0.25 < 0.26684997 5.83 > 3697.09 203.4 2.34 < 0.46 < 0.28 < 0.25 < 0.25 < 0.26684998 4.18 > 3124.05 192.02 2.57 < 0.46 < 0.28 < 0.25 < 0.25 < 0.26684999 20.55 > 4521.86 87.53 < 1.94 < 0.46 < 0.28 < 0.25 < 0.25 < 0.26685000 30.03 > 4596.01 39.41 < 1.94 < 0.46 < 0.28 < 0.25 < 0.25 < 0.26
685009 0.33 143.98 1.06 < 1.94 < 0.46 < 0.28 < 0.25 < 0.25 < 0.26685010 2.75 > 1168.74 45.15 < 1.94 < 0.46 < 0.28 < 0.25 < 0.25 < 0.26685011 2.79 > 1777.25 83.71 < 1.94 < 0.46 < 0.28 < 0.25 < 0.25 < 0.266850112 21.41 > 2307.67 37.28 < 1.94 < 0.46 < 0.28 < 0.25 < 0.25 < 0.266850113 27.58 > 2198.33 16.93 < 1.94 < 0.46 < 0.28 < 0.25 < 0.25 < 0.26
Annex Building, August 2011 (Gore Modules), units in µg/m3*
Alabama Attorney General's Building, August 2011 (Gore Modules), units in µg/m 3*
VIMS, 24 hour sample collection, February 2012 (Gore Modules), units in µg/m 3*
VIMS, 72 hour sample collection, February 2012 (Gore Modules), units in µg/m 3*
EN1214151012MGM Page 1 of 2

TABLE 3‐6Soil Vapor Sample Results
Technical Work Plan‐‐DEAP, Montgomery, Alabama
PCE
VISL: 360TCE
VISL: 16cis‐1,2‐DCE
VISL: NA
trans‐1,2‐
DCE
VISL: NABenzene
VISL: 12Toluene
VISL: 37Ethylbenzene
VISL: 170,000m,p‐Xylenes
VISL: 3,500o‐Xylenes
VISL: 3,500
Right‐of‐Way for Attorney General's, Wallace, and Folsom Buildings, February 2012 (Gore Modules), units in µg/m 3*
685001 < 0.86 < 1.25 < 2.71 < 5.68 < 1.34 < 0.83 < 0.73 < 0.72 < 0.77685002 < 0.86 < 1.25 < 2.71 < 5.68 < 1.34 < 0.83 < 0.73 < 0.72 < 0.77685003 < 0.86 < 1.25 < 2.71 < 5.68 < 1.34 < 0.83 < 0.73 < 0.72 < 0.77685004 < 0.86 < 1.25 < 2.71 < 5.68 < 1.34 < 0.83 < 0.73 < 0.72 < 0.77685005 < 0.86 < 1.25 < 2.71 < 5.68 < 1.34 < 0.83 < 0.73 < 0.72 < 0.77685006 < 0.86 < 1.25 < 2.71 < 5.68 2.8 1.87 < 0.73 < 0.72 < 0.77685007 < 0.86 < 1.25 < 2.71 < 5.68 < 1.34 < 0.83 < 0.73 < 0.72 < 0.77685008 < 0.86 < 1.25 < 2.71 < 5.68 < 1.34 < 0.83 < 0.73 < 0.72 < 0.77Notes:
ppbv ‐ parts per billion vapor< not detected above the laboratory detection limit > Concentrations estimated; concentrations are likely higher than presentedBold values exceed EPA 2015 residential Vapor Intrusion Screening Level (VISL); NA ‐ no VISL availablePCE ‐ tetrachloroetheneTCE ‐ trichloroetheneDCE ‐ dichloroetheneVIMS ‐ vapor intrusion monitoring systemDEAP ‐ Downtown Environmental Assessment Project
*At locations where concentrations are provided in both micrograms and micrograms per cubic meter (µg/m3), results are presented in µg/m
3
EN1214151012MGM Page 2 of 2

TABLE 3‐7Indoor Air Sample Results
Technical Work Plan‐‐DEAP, Montgomery, Alabama
PCE
RSL: 11TCE
RSL: 0.48cis‐1,2‐DCE
RSL: NA
trans‐1,2‐
DCE
RSL: NABenzene
RSL: 0.36Toluene
RSL: 5,200Ethylbenzene
RSL: 1.1
m,p‐
Xylenes
RSL: 100o‐Xylenes
RSL: 100
3082‐02 < 0.5 < 0.5 < 0.5 < 0.5 < 0.5 4 < 0.5 < 1.0 < 0.53082‐03 < 0.5 < 0.5 < 0.5 < 0.5 < 0.5 2.3 < 0.5 < 1.0 < 0.53082‐04 < 0.5 < 0.5 < 0.5 < 0.5 < 0.5 4.1 < 0.5 < 1.0 < 0.53082‐05 < 0.5 < 0.5 < 0.5 < 0.5 < 0.5 3.3 < 0.5 < 1.0 < 0.53082‐06 < 0.5 < 0.5 < 0.5 < 0.5 < 0.5 3.4 < 0.5 < 1.0 < 0.53082‐07 < 0.5 < 0.5 < 0.5 < 0.5 < 0.5 4.6 < 0.5 < 1.0 < 0.53082‐08 < 0.5 < 0.5 < 0.5 < 0.5 < 0.5 2.7 < 0.5 < 1.0 < 0.53082‐09 < 0.5 < 0.5 < 0.5 < 0.5 < 0.5 2.2 < 0.5 < 1.0 < 0.53082‐10 13 < 0.5 < 0.5 < 0.5 < 0.5 4.4 6.3 16 3.4
3082‐11 4.8 < 0.5 < 0.5 < 0.5 < 0.5 4.5 < 0.5 5.5 < 0.5
667984 0.41 < 0.26 < 0.56 < 2.92 < 0.14 0.29 0.81 2.31 0.66
667985 0.4 < 0.26 < 0.56 < 2.92 < 0.14 0.28 0.76 2.25 0.68
667986 0.4 < 0.26 < 0.56 < 2.92 < 0.14 0.28 0.78 2.3 0.68
667987 0.37 < 0.26 < 0.56 < 2.92 < 0.14 0.26 0.71 2.07 0.61
667988 0.36 < 0.26 < 0.56 < 2.92 < 0.14 0.25 0.64 1.89 0.56
667989 1.74 < 0.26 < 0.56 < 2.92 < 0.14 0.22 1.24 3.29 0.86
667990 0.37 < 0.26 < 0.56 < 2.92 < 0.14 0.17 0.5 1.46 0.48
667991 0.7 0.99 < 0.56 < 2.92 < 0.14 0.32 1.16 3.42 1.03
667992 0.52 < 0.26 < 0.56 < 2.92 < 0.14 0.38 0.99 3.01 1.04
667993 1.6 < 0.26 < 0.56 < 2.92 < 0.14 0.32 1.64 4.56 1.16
667994 1.42 < 0.26 < 0.56 < 2.92 < 0.14 0.29 1.34 3.68 1.03
667995 1.23 < 0.26 < 0.56 < 2.92 < 0.14 0.27 1.72 5.02 1.37
670802 1.91 < 0.26 < 0.56 < 2.92 < 0.14 1.04 0.91 2.58 1.18
667998 < 0.18 < 0.26 < 0.56 < 2.92 < 0.14 0.2 0.29 0.68 0.27
667999 < 0.18 < 0.26 < 0.56 < 2.92 < 0.14 0.39 0.82 2.86 0.73
668000 < 0.18 < 0.26 < 0.56 < 2.92 < 0.14 0.4 0.81 2.84 0.73
668001 < 0.18 < 0.26 < 0.56 < 2.92 < 0.14 0.43 0.82 2.86 0.72
668002 < 0.18 < 0.26 < 0.56 < 2.92 < 0.14 0.4 0.85 3.03 0.78
668003 < 0.18 < 0.26 < 0.56 < 2.92 < 0.14 0.93 0.36 1.18 0.41
668004 < 0.18 < 0.26 < 0.56 < 2.92 < 0.14 0.55 0.65 2.15 0.61
684975 < 0.29 < 0.43 < 0.92 < 1.94 < 0.46 6.91 1.35 5.12 2.71
684976 < 0.29 < 0.43 < 0.92 < 1.94 < 0.46 10.31 1.33 5.86 3.54
684977 5.15 < 0.43 < 0.92 < 1.94 < 0.46 2.86 2.13 9.78 3.94
684978 4.65 < 0.43 < 0.92 < 1.94 < 0.46 2.66 2.34 11 4.51
684979 4.95 < 0.43 < 0.92 < 1.94 < 0.46 2.74 2.28 10.55 4.28
684980 4.18 < 0.43 < 0.92 < 1.94 < 0.46 2.43 1.98 9.14 3.71
684981 4.08 < 0.43 < 0.92 < 1.94 < 0.46 2.49 2.04 9.48 3.85
684982 9.96 < 0.43 < 0.92 < 1.94 < 0.46 2.37 3.57 17.08 7.02
684983 6.83 < 0.43 < 0.92 < 1.94 < 0.46 4.54 2.83 12.57 5.15
684984 7.3 < 0.43 < 0.92 < 1.94 < 0.46 4.7 3.29 14.99 6.32
684991 2.41 < 0.43 < 0.92 < 1.94 < 0.46 3.17 1.42 6.04 2.56
684992 13.44 < 0.43 < 0.92 < 1.94 < 0.46 3.46 4.59 21.03 8.44
684993 4.82 < 0.43 < 0.92 < 1.94 0.86 5.97 2.26 9.63 3.82
684994 < 0.29 < 0.43 < 0.92 < 1.94 < 0.46 1.66 0.6 2.29 0.99
684995 < 0.29 < 0.43 < 0.92 < 1.94 < 0.46 0.77 0.3 0.97 0.39
Annex Building, November 2010 (Summa Canisters), units in µg/m 3
Annex Building, August 2011 (Gore Modules), units in µg/m 3 *
Alabama Attorney General's Building, August 2011 (Gore Modules), units in µg/m 3 *
Annex Building, February 2012 (Gore Modules), units in µg/m 3 *
EN1214151012MGM Page 1 of 2

TABLE 3‐7Indoor Air Sample Results
Technical Work Plan‐‐DEAP, Montgomery, Alabama
PCE
RSL: 11TCE
RSL: 0.48cis‐1,2‐DCE
RSL: NA
trans‐1,2‐
DCE
RSL: NABenzene
RSL: 0.36Toluene
RSL: 5,200Ethylbenzene
RSL: 1.1
m,p‐
Xylenes
RSL: 100o‐Xylenes
RSL: 100
491200221‐1 < 0.50 < 0.50 < 0.50 < 0.50 < 0.50 16 < 0.50 4.8 2.4
491200221‐2 8.8 < 0.50 < 0.50 < 0.50 < 0.50 4.8 < 0.50 8.2 3
491200221‐3 14 < 0.50 < 0.50 < 0.50 < 0.50 8.5 2.8 14 5.3
491200221‐4 17 < 0.50 < 0.50 < 0.50 < 0.50 5.1 3.2 14 5.1
491200221‐5 8.0 < 0.50 < 0.50 < 0.50 < 0.50 8.7 < 0.50 6.4 2.5
685014 2.04 < 2.07 < 11.60 < 29.67 < 3.99 4.52 1.05 3.68 2.01
685015 1.77 < 2.07 < 11.60 < 29.67 < 3.99 3.88 0.86 2.87 1.58
685016 2.19 < 2.07 < 11.60 < 29.67 < 3.99 4.56 1.05 3.83 2.14
685017 1.72 < 2.07 < 11.60 < 29.67 < 3.99 4.11 0.80 3.00 1.54
685018 1.95 < 2.07 < 11.60 < 29.67 < 3.99 4.02 0.96 3.31 1.76
685019 2.88 < 2.07 < 11.60 < 29.67 < 3.99 4.28 1.36 4.92 2.61
685020 1.81 < 2.07 < 11.60 < 29.67 < 3.99 15.41 1.42 5.86 4.18
685021 1.18 < 2.07 < 11.60 < 29.67 < 3.99 67.93 5.34 26.10 18.10
685022 1.89 < 2.07 < 11.60 < 29.67 < 3.99 5.78 2.44 10.24 4.82
685025 3.76 < 2.07 < 11.60 < 29.67 < 3.99 5.85 1.82 7.26 3.97
685026 5.77 < 2.07 < 11.60 < 29.67 < 3.99 6.26 2.69 11.01 5.90
685029 5.87 < 2.07 < 11.60 < 29.67 < 3.99 7.68 2.73 11.50 5.48
685030 3.29 < 2.07 < 11.60 < 29.67 < 3.99 3.73 1.52 5.74 2.85
Notes:
< not detected above the laboratory detection limit Bold values exceed EPA regional screening level (RSL)PCE ‐ tetrachloroetheneTCE ‐ trichloroetheneDCE ‐ dichloroetheneEPA ‐ U.S. Environmental Protection AgencyNA ‐ no screening level availableDEAP ‐ Downtown Environmental Assessment Project
Annex Building, May 2012 (Gore Modules), units in µg/m 3 *
*At locations where concentrations are provided in both micrograms and micrograms per cubic meter (µg/m3), results are presented in µg/m3
Annex Building, February 2012 (Summa Canisters), units in µg/m 3
EN1214151012MGM Page 2 of 2

TABLE 5‐1Proposed Sampling by Media
Technical Work Plan‐‐DEAP, Montgomery, Alabama
Location ID Number of Samples Analyses Method
Shallow Groundwater
MW‐01S 1
MW‐02S 1
MW‐03S 1
MW‐07S 1
MW‐08S 1
MW‐09S 1
MW‐10S 1
MW‐12S 1
TMPZ‐1 1
Intermediate or Deep Groundwater
MW‐01I 1
MW‐05I 1
MW‐07I 1
MW‐08I 1
MW‐12I 1
PW‐9W 1
Soil Vapor Samples
VIMS‐10 and VIMS‐50 2 total (1 each)Alabama AG's Building 3 (around northern wing)County Annex III Building 4 (1 per side)Notes
VISL ‐ U.S. Environmental Protection Agency residential vapor intrusion screening levelsSW ‐ SW‐846 Test Methods for Evaluating Solid Waste Physical/Chemical Methods
VIMS ‐ vapor intrusion monitoring systemAG ‐ Attorney General
tetrachloroethene
trichloroethene
cis‐1,2‐dichloroethenetrans‐1,2‐dichloroethenevinyl chloride(COCs)
SW8260B
Two samples per shallow groundwater sample that exceeds one or more VISLs
SW8260BCOCs
To be determined
To be determined (up to 18)
COCs TO‐15
Soil ‐ Shelby tube
Bulk densitytotal porositysaturated porosity
ASTM D7263‐09co‐located with soil vapor sample locations
EN1214151012MGM Page 1 of 1

Figures

@A
@A
@A
@A
@A
@?
@A
@A
@A
@A
@A
@A
@A
@A
@A
Alabama River
Cypress Creek
RSATower
RSAEnergyPlant
AlabamaAG's Building
AnnexBuilding
MW-01S
MW-02SMW-03S
MW-04S
MW-07S
MW-08S
MW-09S
MW-10S
MW-12S
MW-01I
MW-05I
MW-07I
MW-08I
MW-12I
PW-09W
SCO \\galt\proj\CityOfMontgomery\464649\MapFiles\Fig1-1_SiteBoundary.mxd AESPEJO 12/21/2015
LEGEND@A Shallow Monitoring Well
@A Deep Monitoring Well
@? Former City Water Supply Well
RSA Building
Site Boundary 0 250 500
Feet$FIGURE 1-1Site BoundaryDowntown Environmental Assessment Project Montgomery, AL
Note:1. RSA - Retirement Systems of Alabama2. AG - Attorney General

!U!U!U!U
!U!U!U!U!U!U!U!U
!U!U!U!U !U!U!U!U
!U!U!U!U !U!U!U!U !U!U!U!U
!U!U!U!U !U!U!U!U
!U!U!U!U
!U!U!U!U
!U!U!U!U
!U!U!U!U
!U!U!U!U!U!U!U!U
!U!U!U!U
!.
!.
!.
!.
!.
!.
!.
!.
")")")")")")")")
")")")")
")
")")")")")
")
")")
")")")")")")")")")")")")
")")")
")")
")")
")")")")")")") ")
")")
")")
!(!(
!(
!(!( !(
!(!(!(!(!(!(
!(!(!(!(!(
!(!(!(!(
!(!(!(!(!(!(
!(!(!(
!(!(!(
!(!(!(!(!(!(!(!(
!(
!(!(
@A
@A
@A
@A
@A
@A")")")
")")
")")
")
") ")")
")
")
")
")
")") ")
")
")
")
")
")
")
")
")
")
")
")
")")
")")
")
")
")
") ")
")
")
")
")")
")
")
@A
Alabama River
Cypress Creek
RSAEnergyPlant
RSATower
SCO \\galt\proj\CityOfMontgomery\464649\MapFiles\Fig3-1_All_Samples.mxd AESPEJO 1/13/2016
LEGEND@A Shallow Monitoring Well
@A Deep Monitoring Well
!U Sewer Manhole
!( Soil Vapor Sample Location
") Indoor Air Sample Location
") One-time Groundwater Sample Location
!. Surface Water Sample
RSA Building
Site Boundary 0 500 1,000
Feet$FIGURE 3-1Historical Sample LocationsDowntown Environmental Assessment ProjectMontgomery, AL
Note:Refer to Figure 3-5 for soil sample locations.

")
")")")
")")
")")
")
") ")")
")
")
")
")
")") ")
")
")
")
")
")
")
")
")
")
")")
")
")
")
")")
")
")
")
")")
")")
")
")
")
") ")
")
")
")
")")
")
")
")
")
")
")
")
")
@A
@A
@A
@A
@A
@A
@?
@A
@A@A
@A
@A
@A
@A
@A
@A
@A
Alabama River
Cypress
Creek
RSAEnergyPlant
RSATower
MW-01I
MW-05I
MW-07I
MW-08I
MW-12I
MW-11I
MW-01S
MW-02SMW-03S
MW-04S
MW-07S
MW-08S
MW-09S
MW-10S
MW-12S
MW-11S
PW-09W
SCO \\galt\proj\CityOfMontgomery\464649\MapFiles\Fig3-2_Groundwater.mxd AESPEJO 11/30/2015
LEGEND@A Shallow Monitoring Well
@A Deep Monitoring Well
@? Former City Water Supply Well
") One-time Sample Location
RSA Building
Site Boundary 0 500 1,000
Feet$FIGURE 3-2Groundwater Sample LocationsDowntown Environmental Assessment ProjectMontgomery, AL
Note:RSA - Retirement Systems of Alabama

@A
@A
@A
@A
@A
@A
@A
@A
@A
@A
@A
@A
@A
@A
@A
Alabama River
Cypress Creek
RSATower
RSAEnergyPlant
135
140
150
145
155
155
150
145
140
135
MW-01I149.79
MW-05I152.67
MW-07I144.06
MW-08I136.41
MW-12I131.58
MW-01S150.13
MW-02S147.28
MW-03Sdry
MW-04S146.48
MW-07S143.99
MW-08S136.35
MW-09S158.26
MW-10S155.73
MW-12S131.38
SCO \\galt\proj\CityOfMontgomery\464649\MapFiles\Fig3-3_Potentiometric_Surface_Shallow.mxd AESPEJO 12/7/2015
LEGEND@A Shallow Monitoring Well
@A Deep Monitoring Well
Groundwater Elevation Contour(Dashed Where Inferred)
Generalized Groundwater Flow Direction
RSA Building
Site Boundary 0 225 450
Feet$FIGURE 3-3Potentiometric Surface - Shallow IntervalDowntown Environmental Assessment ProjectMontgomery, AL
Notes:1. RSA - Retirement Systems of Alabama2. Groundwater elevations presented in feet above mean sea level.3. Only shallow interval wells used in contouring.

!.
!.
!.
!.
!.
!.
!.
!.
Alabama River
Cypress
Creek
RSAEnergyPlant
RSATower
0241998802
0241998804
0241998805
0241998806
0241998807
0241998808
0241998809
0241998810
SCO \\galt\proj\CityOfMontgomery\464649\MapFiles\Fig3-4_SurfaceWater.mxd AESPEJO 12/11/2015
LEGEND!. Surface Water Sample
RSA Building
Site Boundary
0 500 1,000
Feet$FIGURE 3-4Historical Surface Water Sample LocationsDowntown Environmental Assessment ProjectMontgomery, AL
Note:RSA - Retirement Systems of Alabama

#* #*
#*#*#*#*
#*#*
#*
#* #*#*
#*
#*
#*
#*
#* #*
#*
#*
#*
#*
#*
#*
#*#*
#*#* #*#*#*#*#*#*
#*#*#*
#*#*
#*
#*#*#*
#*#*#*
#*#*
#*#* #*
#*
#*
#*
#*
#*
#*
#*
#*
#*
#*
#*#*
#*
#*
#*
#*
#*
#*
#*#*
#*
#*
#*
#*
#*#*
#*
Alabama River
Cypress Creek
RSAEnergyPlant
RSATower
SCO K:\CityOfMontgomery\464649\MapFiles\Fig3-5_SoilSample_Locs.mxd MD013761 1/5/2016
LEGEND#* Soil Sample Location
RSA Building
Site Boundary
0 250 500
Feet$FIGURE 3-5Historical Soil Sample LocationsDowntown Environmental Assessment ProjectMontgomery, AL

Alabama River
Cypress Creek
RSATower
RSAEnergyPlant
685002685004
685005
685006
685007685008
660513
660514660515
660516
660517660518
660519
660520660521
660522
660523
660524
AlabamaAG's
Building
AnnexBuilding
SCO \\galt\proj\CityOfMontgomery\464649\MapFiles\Fig3-6_SoilVapor.mxd AESPEJO 12/21/2015
LEGENDSoil Vapor Sample Location
RSA Building
Inset Area Sample Locations Shown in Figure 3-7
Site Boundary
0 250 500
Feet
FIGURE 3-6Historical Soil Vapor Sample LocationsDowntown Environmental Assessment ProjectMontgomery, AL
Note:1. RSA - Retirement Systems of Alabama2. AG - Attorney General3. Locations are approximate where text description were provided in lieu of coordinates.

!(
!(!(!(
!(
!(
!(
!(
!(
!(!(!(!(!(
Washington AveSLaw
rence St
3082-12
3082-01
56 indoor air samples
collected
670798
670799
670800670801
670803670804
668005
SCO \\galt\proj\CityOfMontgomery\464649\MapFiles\Fig3-7_Annex_AG_Bldgs.mxd AESPEJO 1/13/2016
LEGEND!( Soil Vapor Sample Location
Vapor Intrusion Monitoring System 0 25 50
Feet$FIGURE 3-7Annex and Alabama Attorney General's BuildingsHistorical Indoor Air and Soil Vapor Sample LocationsDowntown Environmental Assessment ProjectMontgomery, AL
Notes:1. AG - Attorney General2. Soil vapor locations are approximate where text description were
provided in lieu of coordinates.3. All indoor air samples were collected within the building under
the areas shaded in green.
!(
!(
!(
!(
!(
!(
!(
!(
!(
Dexter AveS
Bainbridge S
t
7 indoor air samples
collected
670807
670808
670809
670810
670811
670813
670814
670815
670816
Annex Building Alabama AG's Building

Alabama River
Cypress Creek
RSATower
RSAEnergyPlant
MW-01I
MW-07S
MW-08I
MW-10S
MW-12I
MW-01S
MW-02SMW-03S
MW-04S
MW-05I
MW-07I
MW-08S
MW-09S
MW-12S
PW-09W
SCO \\galt\proj\CityOfMontgomery\464649\MapFiles\Fig4-1_ConceptualSiteModel.mxd AESPEJO 12/14/2015
LEGENDMonitoring Well
Former City Water Supply Well
Generalized Flow Direction
PCE Plume
RSA Building
Site Boundary
Wells Color-coded Based on PCE data 2011 Results*Not Detected
Detected, Not Exceeded
Exceeded
0 225 450
Feet
FIGURE 4-1Conceptual Site ModelDowntown Environmental Assessment ProjectMontgomery, AL
Notes:1. Two plumes associated with the PCE discovered during RSA Chiller Plant construction - At the RSA Area - Downgradient of RSA Area2. Groundwater flows to surface water bodies (northwest)3. Exceedances are bound to the southwest; PCE not detected to the northeast, east, and south4. Plumes and future extent are within the boundary5. * MW-3S color-coded based on PCE data 2009 results6. PCE = tetrachloroethene7. RSA = Retirement Systems of Alabama

Alabama River
Cypress Creek
RSATower
RSAEnergyPlant
AlabamaAG's Building
AnnexBuilding
TMPZ-1Reach of
Cypress Creek
VIMS-10MW-09S
VIMS-50
MW-01S
MW-02SMW-03S
MW-04S
MW-07S
MW-08S
MW-10S
MW-12S
MW-01I
MW-05I
MW-07I
MW-08I
MW-12I
PW-09W
SCO \\galt\proj\CityOfMontgomery\464649\MapFiles\Fig5-1_SampleLocations.mxd AESPEJO 12/21/2015
LEGENDShallow Monitoring Well
Non-monitored Well
Deep Monitoring Well
Temporary Piezometer
Former City Water Supply Well
Vapor-Intrusion Monitoring System
RSA Building
Reach of Cypress Creek
Site Boundary
0 250 500
Feet
FIGURE 5-1Proposed Sample LocationsDowntown Environmental Assessment ProjectMontgomery, AL
Note:1. RSA - Retirement Systems of Alabama2. AG - Attorney General3. MW-04S not proposed to be sampled, as contamination in the well is not related to the PCE discovered at the RSA Building (see Figure 4-1).

Appendix A Sampling and Analysis Plan

A P P E N D I X A
Sampling and Analysis Plan – Downtown Environmental Assessment Project,
Montgomery, Alabama
Prepared for
Alabama Department of Environmental Management by the Downtown Environmental
Alliance
January 2016
CH2M HILL, Inc.
4121 Carmichael Rd. Suite 400
Montgomery, Alabama 36106

Contents Section Page
Acronyms and Abbreviations ............................................................................................................. iii
1 Introduction ....................................................................................................................... 1-1
2 Hydraulic Study Field Activities ............................................................................................ 2-1 2.1 Temporary Creek Gauge .................................................................................................. 2-1 2.2 Piezometer Installation .................................................................................................... 2-1
3 Sampling, and Analytical Requirements ............................................................................... 3-1 3.1 Groundwater Sampling .................................................................................................... 3-1 3.2 Geotechnical Soil Sampling .............................................................................................. 3-1 3.3 Soil Vapor Sampling ......................................................................................................... 3-2
3.3.1 Dual-Depth Soil Vapor Probe Installation and Abandonment Methodology ..... 3-2 3.3.2 Temporary Exterior Subslab Soil Vapor Probe Installation and Abandonment
Methodology ...................................................................................................... 3-2 3.3.3 Soil Vapor Sampling Methodology ..................................................................... 3-3
3.4 Analytical Requirements .................................................................................................. 3-4 3.5 Management of Investigation Derived Waste ................................................................. 3-4
4 Sample Implementation ...................................................................................................... 4-1 4.1 Sampling Personnel and Training .................................................................................... 4-1 4.2 Health and Safety ............................................................................................................. 4-1 4.3 Laboratory Coordination .................................................................................................. 4-1
Attachments
1 Final Standard Procedures for Logging of Soil Borings and Monitoring Wells
2 Standard Operating Procedure for Low-Flow Groundwater Sampling from Monitoring Wells
3 Standard Operating Procedure for Undisturbed Soil Sampling
4 Standard Operating Procedure for the Installation of Temporary Soil Vapor Probes
5 Standard Operating Procedure for Subslab Soil Vapor Sampling from Cox-Colvin Vapor Pins
6 Standard Operating Procedure for the Collection of Soil Vapor Samples from Temporary and Permanent Probes Using Canisters
Figure
1-1 Proposed Sample Locations .......................................................................................................... 1-2
EN1214151012MGM III

Acronyms and Abbreviations ADEM Alabama Department of environmental Management
AEIRG Alabama Environmental Investigation and Remediation Guidance
bgs below ground surface
COC chemical of concern
DEA Downtown Environmental Alliance
DPT direct-push technology
EPA U.S. Environmental Protection Agency
HSA hollow-stem auger
IDW investigation-derived waste
MS matrix spike
MSD matrix spike duplicate
PCE tetrachloroethene
PID photoionization detector
PRT post-run tubing
PVC polyvinyl chloride
QA quality assurance
QC quality control
SAP Sampling and Analysis Plan
SOP standard operating procedure
SSC site safety coordinator
RSA Retirement Systems of Alabama
TCLP toxicity characteristic leaching procedure
VIMS vapor intrusion monitoring system
VISL vapor intrusion screening level
VOC volatile organic compound
EN1214151012MGM IV

SECTION 1
Introduction The Downtown Environmental Alliance (DEA) retained CH2M HILL, Inc. (CH2M) to provide assistance to further evaluate tetrachloroethene (PCE) identified historically in public water supply well PW-9W and during the construction of the Retirement Systems of Alabama (RSA) energy plant located in downtown Montgomery, Alabama. Additional sampling needed to conduct the evaluation includes groundwater sampling for analyses of chemicals of concern (COCs), soil sampling for geotechnical evaluation, soil vapor sampling for analyses of COCs, and a hydraulic study to assess the interaction between groundwater and Cypress Creek (Figure 1-1). The purpose of this sampling and analysis plan (SAP) is to describe the recommended procedures and methods proposed for data collection. All work will be performed in accordance with the Alabama Environmental Investigation and Remediation Guidance (AEIRG; Alabama Department of Environmental Management [ADEM], 2008). The following CH2M Standard Operating Procedures (SOPs) are attached as part of this SAP:
1. Final Standard Procedures for Logging of Soil Borings and Monitoring Wells 2. Low Flow Groundwater Sampling from Monitoring Wells (SOP No. 7) 3. Undisturbed Soil Sampling (SOP FWSL-08) 4. Installation of Temporary Soil Vapor Probes (Rev 12/21/15) 5. Subslab Soil Vapor Sampling from Cox-Colvin Vapor Pins (Rev 12/21/15) 6. Collection of Soil Vapor Samples from Temporary and Permanent Probes using Canisters (Rev 12/21/15)
EN1214151012MGM 1-1

Alabama River
Cypress Creek
RSATower
RSAEnergyPlant
AlabamaAG's Building
AnnexBuilding
TMPZ-1Reach of
Cypress Creek
VIMS-10MW-09S
VIMS-50
MW-01S
MW-02SMW-03S
MW-04S
MW-07S
MW-08S
MW-10S
MW-12S
MW-01I
MW-05I
MW-07I
MW-08I
MW-12I
PW-09W
SCO \\galt\proj\CityOfMontgomery\464649\MapFiles\Fig5-1_SampleLocations.mxd AESPEJO 12/21/2015
LEGENDShallow Monitoring Well
Non-monitored Well
Deep Monitoring Well
Temporary Piezometer
Former City Water Supply Well
Vapor-Intrusion Monitoring System
RSA Building
Reach of Cypress Creek
Site Boundary
0 250 500
Feet
FIGURE 1-1Proposed Sample LocationsSampling and Analysis Plan - DEAP Montgomery, AL
Note:1. RSA - Retirement Systems of Alabama2. AG - Attorney General3. MW-04S not proposed to be sampled, as contamination
in the well is not related to the PCE discovered at theRSA Building (see Figure 4-1).

SECTION 2
Hydraulic Study Field Activities 2.1 Temporary Creek Gauge A temporary creek gauge will be installed within Cypress Creek to continuously monitor the Creek stage in the reach where the DEAP groundwater may be interacting with the Creek based on the conceptual site model. The Creek gauge will consist of a Level Troll transducer housed in a 2-inch inner-diameter Schedule 40 polyvinyl chloride (PVC) casing. The PVC casing serves to dampen the effects of short-term water level changes (i.e., waves), protect the transducer from damage, and fix the position of the transducer within the Creek.
Prior to installation of the temporary Creek gauge, the proposed location will be cleared of underground utilities. The Alabama One Call service will be notified to have the public utilities located and marked. Utility locations will be marked and recorded on a site map. To install the Creek gauge, the casing will be manually submerged several feet into the bed of Cypress Creek, with pre-drilled holes in the PVC to allow for water within the casing to reach equilibrium with the Creek stage. Care will be taken to install the temporary gauge in an area of the Creek where erosion is limited and where the transducer is guaranteed to remain submerged when the Creek is at its lowest stage (baseflow). If Creek dynamics require more stability than is provided by the PVC casing alone, a segment of rebar (or similar) may be driven into the Creek bed immediately adjacent to the PVC casing to be used as a brace.
Once installed, the casing will be surveyed to allow for calculation of Creek elevation. The transducer readings will be collected hourly and downloaded weekly. A separate transducer will be deployed in the vicinity of the temporary creek gauge and downloaded weekly; this second transducer will be exposed to the atmosphere and will be used to correct for barometric pressure.
2.2 Piezometer Installation A temporary piezometer (TMPZ-1) is proposed to be installed to monitor the water table elevation immediately adjacent to Cypress Creek (Figure 1-1). Prior to installation of the piezometer, the proposed location will be cleared of underground utilities at the same time as the temporary Creek gauge.
To ensure the groundwater elevation observed within the temporary piezometer accurately reflects the water table elevation, the temporary piezometer will be installed at a depth so that the water table intersects the screened interval. During drilling, soil will be logged continuously by the onsite geologist to ensure proper vertical placement of the well screen. Cores will be logged according to the Final Standard Procedures for Logging of Soil Borings and Monitoring Wells (Attachment 1). Once the appropriate depth has been reached, the piezometer will be installed as a standard ADEM Class II well.
A vertical well borehole will be drilled using the hollow-stem auger (HSA) method (or similar) to a depth sufficient to observe seasonal fluctuations of the water table. Once the final depth of the boring is reached, a minimum of 6 inches of filter sand material will be placed at the bottom of the borehole to serve as footing for the well screen. The piezometer will consist of 10-foot lengths of 2-inch inner diameter PVC. The screened segment will consist of a 10-foot long, 0.01-inch machine-slotted PVC screen. Above the screen, unslotted segments of PVC will be extended to above the ground surface. A filter pack consisting of 10/20 mesh quartz sand will be placed in the annular space around the well screen to a minimum height of 2 feet above the top of the screen. A minimum 2-foot-thick bentonite seal will then be placed directly on top of the filter pack and allowed to hydrate for a minimum of 8 hours. After hydration of the bentonite seal is completed, Portland Type II cement grout will be pumped via tremie method into the annular space around the casing from the top of the bentonite seal to within 2 feet of the ground surface.
EN1214151012MGM 2-1

SECTION 2 HYDRAULIC STUDY FIELD ACTIVITIES
After the grout is allowed to set a minimum of 24 hours, a protective casing with a locking cap will be installed around the piezometer. The piezometer will also be protected by a 2-foot by 2-foot square concrete surface pad. Following construction of the well completion, the piezometer will be developed using the surge block method until water is sufficiently clear and free of sediment. The piezometer will not be sampled for a minimum of 24 hours after development to allow the formation to stabilize to pre-well construction conditions.
Once installed, the temporary piezometer will be surveyed by a licensed Alabama surveyor. A transducer will be deployed, and readings will be collected and downloaded on the same schedule as the temporary Cypress Creek gauge data.
EN1214151012MGM 2-2

SECTION 3
Sampling, and Analytical Requirements This section outlines the procedures for collecting groundwater, soil, and soil vapor samples. In addition, it lists the parameters and analytical methods required for each sample matrix.
3.1 Groundwater Sampling Groundwater samples will be collected from 14 existing wells and proposed temporary piezometer (TMPZ-1; Figure 1-1) for the analysis of COCs listed in Table 3-1.
Groundwater sampling will be conducted in accordance with the CH2M standard operating procedure (SOP) for Low-Flow Groundwater Sampling from Monitoring Wells (Attachment 2).
Sample labels will include, at a minimum: the well identification number, sample identification, time, date, the sampler’s initials, container preservative, and the analytical method to be performed. Sample identification will include the well identification and sample month and year as follows – MW01S-MMYY where the well is MW-01S and MM represents the two-digit month and YY represents the two-digit year. For quality assurance (QA)/quality control (QC) samples, in lieu of the well identification, FD-01 will be substituted for the field duplicate sample, EB-0X will be substituted for the equipment blanks (where X will be numbered sequentially and the type of equipment will be documented in the field logbook), and TB-0X will be substituted for the trip blanks (where X will be sequentially numbered for each day that samples are shipped). The following field QA/QC samples will be collected during the groundwater sampling event:
• One field duplicate • One matrix spike/matrix spike duplicate (MS/MSD) • Equipment blanks (per sampling equipment) • Trip blanks (per shipping event)
The MS/MSD sample will be named the same as the native sample with MS or MSD appended to the sample identification.
3.2 Geotechnical Soil Sampling Undisturbed soil samples will be collected from up to 3 borings (co-located with soil vapor sampling) and submitted for geotechnical parameters listed in Table 3-1. One Shelby tube will be collected for each lithologic change identified in the available boring log (to be selected by the field geologist). For estimating purposes, one sample is assumed every 10 feet in the vadose zone to an estimated 70 feet at each boring.
Soil sampling will be conducted in accordance with the CH2M SOP for Undisturbed Soil Sampling (Attachment 3). Sample labels will include, at a minimum:
• Sample identification • Date and time • Sampler’s initials • Geotechnical test to be performed
Sample identification will include sample location (GT-X, where X is numbered sequentially and the location identified in the field logbook) and sample month and year as MMYY where the MM represents the two-digit month and YY represents the two-digit year.
EN1214151012MGM 3-1

SECTION 3 SAMPLING, AND ANALYTICAL REQUIREMENTS
3.3 Soil Vapor Sampling Temporary dual-depth soil vapor probes will be installed, sampled, and subsequently abandoned near each shallow groundwater monitoring well where COC concentrations exceed one or more vapor intrusion screening levels (VISLs) (up to 9 locations for a total of up to 18 soil vapor samples). Temporary exterior subslab soil vapor probes will be installed, sampled, and subsequently abandoned adjacent to the County Annex III (four) and Alabama AG’s buildings (three adjacent to the northern wing). Additionally, soil vapor samples will be collected from two of the existing vapor intrusion monitoring systems (VIMS) (10- and 50-foot depths) located across Washington Avenue from the County Annex III Building.
The proposed temporary soil vapor sampling locations will be cleared of underground utilities prior to installing soil vapor probes. The Alabama One Call service will be notified to have the public utilities located and marked. A third-party utility locate subcontractor will locate private utilities near the proposed soil vapor probe locations, if needed. Utility locations will be marked and recorded on a site map.
No soil vapor sampling will take place within 48 hours after a rainfall event of 1 inch or greater or in standing or ponded water areas.
3.3.1 Dual-Depth Soil Vapor Probe Installation and Abandonment Methodology Temporary soil vapor probes will be installed in accordance with the CH2M SOP for Standard Operating Procedure for the Installation of Temporary Soil Vapor Probes (Attachment 4).
A soil core will be collected from each proposed soil vapor sampling location prior to soil vapor probe installation to determine lithology and the depth to groundwater. The soil core will be collected using a direct-push technology (DPT) drill rig in an acetate sleeve. General descriptions of the soil type, and the depth at which soils become saturated will be recorded in the field book. Geotechnical sampling will be performed at three of soil core locations, as discussed in Section 3.2. The soil and acetate sleeves will be disposed of as solid investigation-derived waste (IDW), as discussed in Section 3.5.
The shallower depth probe, 6 to 8 feet below ground surface (bgs), will be installed and sampled first. The deeper depth probe will then be installed in a separate hole. Each of the borings will be located at least 5 feet away from the monitoring well and each other. The deeper depth probe will be within several feet of the groundwater table as determined from the soil core, which ranges from approximately 25 to 60 feet bgs throughout the site.
Temporary soil vapor probes will be installed by a DPT drill rig utilizing the post-run tubing (PRT) method. Each temporary soil vapor probe will be constructed with an expendable drive point, PRT point holder and adapter, and 1.25-inch outer diameter drive rods. Quarter-inch outer diameter Teflon tubing will be connected to the PRT system. The PRT system will be pushed by the DPT drilling rig to the target depth and the probe will be retracted approximately 6 to 12 inches to create an annular space.
The DPT drive rods and PRT equipment will be decontaminated between each soil vapor probe by either steam cleaning or washing with a phosphate-free, non-ionic detergent and rinsing twice with distilled water. The decontamination water will be disposed of as liquid IDW, as discussed in Section 3.5. Dedicated tubing will be used for sampling each probe.
The temporary probes, and soil core boreholes will be abandoned by removing the DPT rods and filling the holes with bentonite chips while hydrating in lifts. The ground cover will be restored to its original condition.
3.3.2 Temporary Exterior Subslab Soil Vapor Probe Installation and Abandonment Methodology
Temporary exterior subslab soil vapor probes will be installed and abandoned in accordance with the CH2M SOP for Subslab Soil Vapor Sampling from Cox-Colvin Vapor Pins (Attachment 5).
EN1214151012MGM 3-2

SECTION 3 SAMPLING, AND ANALYTICAL REQUIREMENTS
The temporary subslab soil vapor probes will be installed in large intact concrete pads located near each building. The probes will be installed by drilling through the concrete and securing a Cox Colvin brand Vapor Pin into the hole with a silicon sleeve.
Once sampling is completed, the probes will be abandoned by removing the Vapor Pin and patching the hole with concrete.
3.3.3 Soil Vapor Sampling Methodology Soil vapor sampling from the temporary dual-depth soil vapor probes and the VIMS will be performed in accordance with the CH2M SOP for Collection of Soil Vapor Samples from Temporary and Permanent Probes Using Canisters (Attachment 6). Soil vapor sampling from the temporary exterior subslab soil vapor probes will be performed in accordance with the CH2M SOP for Subslab Soil Vapor Sampling from Cox-Colvin Vapor Pins (Attachment 5).
Following installation of the temporary soil vapor probes, each probe will be allowed to equilibrate for 30 minutes. The soil vapor probes will be helium-leak checked and purged prior to sample collection. Three dead volumes of soil vapor will be purged with a vacuum pump at 200 milliliters per minute. The dead volume of the dual-depth exterior soil vapor probes will include the annular space created by retracting the rod, and the probe tubing. The dead volume of the temporary exterior subslab soil vapor probes will include the hole in the concrete beneath the installed probe. Prior to sampling, the dead volume of the VIMS will be determined upon further evaluation of the VIMS construction.
A helium enclosure surrounding the probe at the ground surface will be flooded with at least 10 percent ultra-high purity helium during purging. The purged soil vapor will be screened in the field with a photoionization detector (PID) for total volatile organic compounds (VOCs) and a helium detector. The probe will pass the leak test if less than 1 percent of the helium concentration measured in the enclosure is detected in the purged soil vapor. Once the probe passes the leak test, and purging is completed, a soil vapor sample will be collected into a 1-liter evacuated stainless steel canister (such as a SUMMA canister) equipped with a flow controller set to regulate the sampling flow rate to 180 milliliters per minute (for an approximate 5-minute sample collection time). One duplicate sample will be collected per 10 soil vapor samples; a T-connector will be used to collect both samples using one flow controller at the same time.
The PID and helium detector will be operated, calibrated, and maintained according to the manufacturers’ guidelines. The PID will be calibrated before beginning work each day, and the calibration data will be recorded in the field logbook along with the equipment serial number.
Canisters for soil vapor sampling will be supplied by the contracted laboratory. Each individual canister must be certified clean by the contract laboratory and the certification analysis provided for the project record. Canisters must be used within 15 days from the date they were shipped from the laboratory. Sample labels will include, at a minimum: sample identification, time, date, the sampler’s initials, and the analytical method to be performed. Sample identification will include sample location and sample month and year as MMYY where the MM represents the two-digit month and YY represents the two-digit year. Sample location for dual-depth samples collected adjacent to monitoring wells will be identified as SV-XXS-SD-DD where XXS is the corresponding well number and SD-DD is the sample interval in feet bgs (SD is the shallow depth and DD is the deep depth). Samples location for the VIMS will be identified as VIMS10 and VIMS50 for the 10- and 50-foot sample depths, respectively. Sample locations adjacent to each building with be identified as SV-BB0# where BB represent the associated building as:
• AG – Alabama AG’s Building, and • CA – County Annex III Building.
The remainder, 0#, will be numbered sequentially and the location identified in the field logbook.
EN1214151012MGM 3-3

SECTION 3 SAMPLING, AND ANALYTICAL REQUIREMENTS
The canisters will be shipped under standard chain-of-custody procedures to the contracted laboratory for analysis by U.S. Environmental Protection Agency (EPA) Method TO-15; COCs will be analyzed as detailed in Table 3-1.
3.4 Analytical Requirements The parameters requiring analysis for the DEAP investigation are presented in Table 3-1. The laboratory should provide all sample containers as described in Table 1 of Appendix G of the AEIRG (ADEM, 2005), preservatives, chain-of-custody forms, shipping coolers, packing material, and absorbent necessary to properly collect and ship the samples to the laboratory. Arrangements should be made with the laboratory so that sample kits are received at the site before sampling.
Samples should be shipped to the laboratory on the day of collection for overnight delivery. Advance notification should be provided to the laboratory by the field team in the event that samples are shipped on a Friday for receipt by the laboratory on a Saturday.
3.5 Management of Investigation Derived Waste IDW generated during investigation of the DEAP will include both solid and liquid waste. Solid IDW will include both soils and acetate liners. Liquid IDW will include both decontamination fluids and purged groundwater. IDW will be contained in 55-gallon U.S. Department of Transportation-approved drums upon generation, rated for liquids (such as, water and wet soils) or solids (such as, soils with minimal liquid). Each drum will bear a label that identifies the contents as solid or liquid IDW from the DEAP project, including the start date (when material is first placed in the drum), and will identify the contents as “pending analysis.” The drums will be stored in a secure area within the DEAP boundary and managed as non-hazardous waste. Based on historical knowledge and sampling data, the IDW is not a listed hazardous waste and is expected to be a non-hazardous waste. To confirm that the IDW is non-hazardous, CH2M will collect one representative sample of the solid waste and one representative sample of the liquid waste, and analyze each sample for the VOCs and SVOCs (total analysis only) included in Table 1 of ADEM Admin. Code R. 335-14-2-.05. For profiling purposes, the pH will also be analyzed for both samples, and the percent liquids will be analyzed for the solid sample. Once the IDW is characterized, it will be appropriately labeled, managed, manifested, and disposed per the ADEM Administrative code.
TABLE 3-1 Groundwater, Soil, and Soil Vapor Sample Numbers, Methods, and Collection Requirements Sampling and Analysis Plan—DEAP, Montgomery, Alabama
Parameter
Number of Native
Samples Sample Location Method Container Preservative Holding
Time
Groundwater Samples
VOC: PCE, TCE, DCE, vinyl chloride
15a MWs-01S, -01I, -02S, -03S, -05I, -07S, -07I, -08S, -08I, 09S, -10S, -12S, -12I, PW-9W, and TMPZ-1
SW8260B 3x40-mL vials with Teflon lined caps
Hydrochloric Acid to pH<2, <6 °C
14 Days
Soil Samples
Bulk Density, Total Porosity, Saturated Porosity
21b Co-located with soil vapor sample locations
ASTM D7263-09 Shelby Tube None NA
EN1214151012MGM 3-4

SECTION 3 SAMPLING, AND ANALYTICAL REQUIREMENTS
TABLE 3-1 Groundwater, Soil, and Soil Vapor Sample Numbers, Methods, and Collection Requirements Sampling and Analysis Plan—DEAP, Montgomery, Alabama
Parameter
Number of Native
Samples Sample Location Method Container Preservative Holding
Time
Soil Vapor Samples
VOC: PCE, TCE, DCE, vinyl chloride
27c Site wide and adjacent to the County Annex III and Alabama AG buildingsc
TO-15 1-liter SUMMA Canister
None 30 daysd
Notes: VOC = volatile organic compounds PCE = tetrachloroethene TCE = trichloroethene DCE = dichloroethene (cis and trans isomers) EPA = U.S. Environmental Protection Agency SW = SW-846 Test Methods for Evaluating Solid Waste Physical/Chemical Methods °C = degrees Celsius a Groundwater sample count will included 15 native samples plus 1 field duplicate sample, 1 matrix spike/matrix spike duplicate sample set, 1 equipment blank sample, and 1 trip blank sample. b Number of samples estimated based on samples every 10 feet at three borings to 70 feet total depth. c Two soil vapor samples will be collected adjacent to each shallow well where COC concentrations exceed one or more VISLs (up to nine locations). Soil vapor samples will also be collected adjacent to the County Annex III (6 samples including 2 from the VIMS) and Alabama AG’s buildings (3 samples). Estimated number assumes each shallow well will report 1 or more exceedance. One duplicate sample will be collected per 10 soil vapor samples for a total of up to 3 duplicate samples. d There is a 15-day holding time from the date the canisters leave the laboratory to the date of sample collection. The holding time from the date of sample collection to analysis is 30 days.
EN1214151012MGM 3-5

SECTION 4
Sample Implementation This section outlines the basic guidelines for sampling implementation by discussing personnel and training requirements, safety precautions, and laboratory coordination for those who are responsible for the sampling.
4.1 Sampling Personnel and Training Samples for the DEAP investigation will be collected under the oversight of CH2M. Samples should be collected by a person experienced in collecting groundwater, Shelby tube, and soil vapor samples. The sampling team should be familiar with the following:
• Identification of sampling locations • Equipment needed and proper use • Sampling parameters, associated container types, and volume requirements • Method for delivering analytical samples to the laboratory • Forms to be completed during the sampling event
All sample containers must be marked before each sample is collected. The date, time, sample identification, and preservative (if required) must be marked on each sample bottle.
4.2 Health and Safety Precautions should be taken to ensure the safety of the sampling team members. A site safety coordinator (SSC) will be designated prior to the sampling event. Tailgate health and safety meetings will be held daily and documented in the logbooks. Any health and/or safety related issues that arise in the field should be directed to the SSC; the SSC will be responsible for contacting additional personnel (i.e., project manager or Health and Safety Manager) as required.
4.3 Laboratory Coordination Sampling kits will be pre-assembled at the contracted laboratory before the actual sampling event. These kits should contain the necessary number and type of containers to analyze samples for the parameters listed in Table 3-1. Any changes to the analytical methods, sample containers, or preservation must be approved by the project chemist prior to sample collection. The volume, preservative requirements, and types of containers to be used in transporting the samples should be provided by the contract laboratory.
EN1214151012MGM 4-1

Attachment 1 Final Standard Procedures for Logging
of Soil Borings and Monitoring Wells

P o l i c i e s , P r o c e d u r e s , a n d G u i d e l i n e s
Standard Procedures for Logging of Soil Borings and
Monitoring Wells
January 2016


Contents
Page
Standard Procedures for Logging of Soil Borings ...................................................................... 1 Introduction .............................................................................................................................. 1 Policy .......................................................................................................................................... 1 Instructions for Completing Soil Boring Logs ..................................................................... 1
Heading Information .................................................................................................... 2 Technical Data ................................................................................................................ 5
Field Classification of Soil ....................................................................................................... 6 Soil Name ........................................................................................................................ 6 Group Symbol ................................................................................................................ 8 Color 9 Moisture Content ......................................................................................................... 10 Relative Density or Consistency ................................................................................ 10 Soil Structure, Mineralogy, and Other Descriptors ................................................ 10 Potentially Impacted Subsurface Media ................................................................... 10
Standard Penetration Test Procedures ................................................................................ 11 Equipment and Calibration ........................................................................................ 12 Procedures .................................................................................................................... 12 General Considerations .............................................................................................. 12
Sample Labeling and Packaging .......................................................................................... 13 Field Equipment Checklist .................................................................................................... 14 Relevant Literature ................................................................................................................ 15
Tables
1 Example Soil Descriptions ....................................................................................................... 7 2 Criteria for Describing Moisture Conditions ...................................................................... 10 3 Relative Density of Coarse-Grained Soil ............................................................................. 11 4 Consistency of Fine-Grained Soil .......................................................................................... 11
Figures
1 Example of the WinLog CH2M HILL Soil Boring Log Template ...................................... 3 2 Example of a Completed WinLog CH2M HILL Soil Boring Log Form ............................ 4 3 Flow Chart for Identifying Coarse-Grained Soils ................................................................. 8 4 Flow Chart for Identifying Inorganic Fine-Grained Soils ................................................... 9
III


Standard Procedures for Logging of Soil Borings
Introduction The purpose of this document is to establish soil classification and logging procedures for CH2M HILL. The document will guide CH2M HILL staff in recording and presenting the field data that are necessary to adequately describe, label, and package soil samples recovered from borings. Adherence to a standard format for recording data will help streamline project efforts and allow a consistent presentation of subsurface data.
Policy These soil boring procedures should be followed for CH2M HILL projects in which soil boring techniques are used during field exploration. These procedures establish the minimum standards for information that should be recorded in the field to adequately characterize recovered soil samples. In environmental work, there can be instances in which soil borings are advanced solely to collect soil or water samples for analytical results. The project manager and senior technical consultant should determine the level of soil logging required for a project. Geotechnical engineers should refer to this link:
http://wwwtest.int.ch2m.com/intrnl/voffice/dc/WebManuals/GeotechDesign/GeoTechDesign.htm
for CH2M HILL’s policy on soil logging for geotechnical exploration. Because job requirements can vary widely, the minimum standards presented might need to be supplemented with additional technical descriptions or field test results.
The boring log should be completed in the field according to the instructions that follow. Forms should be filled out neatly and completely. Forms may also be filled out electron-ically in the field. Laboratory testing, if required, should be initiated immediately after completion of the field work. For geotechnical projects, it is important to check field classifications against laboratory test results. Corrections should be noted in red, initialed, and dated on the field boring log. For environmental projects, the decision to check against laboratory results will be determined on a case-by-case basis. However, if laboratory tests are run, boring log descriptions should be double checked against the lab classifications.
Instructions for Completing Soil Boring Logs CH2M HILL currently uses several forms on which to record soil logging information. Two forms often used are (1) the WinLog form formatted specifically for CH2M HILL, which is similar to the previous CH2M HILL Standard Form D1586 (Soil Boring Log Form), and (2) the GINT form, which is used on many federal projects. Whichever form is selected for a project, the form should, at a minimum, contain space for the information specified in this
Page 1 of 18

STANDARD PROCEDURES FOR LOGGING OF SOIL BORINGS AND MONITORING WELLS
document. Instructions follow for completing the log forms in the field. See Figures 1 and 2 for examples of blank and completed field logs (the WinLog form).
The heading information should be completely filled out on each log sheet, and the technical items in each column must be addressed in the field. Field personnel should review com-pleted logs for accuracy, clarity, and thoroughness. It is important that information be correctly recorded on both the sample container and the log sheets.
Heading Information Project Number. Use the standard six-digit project number and appropriate point numbers.
Boring Number. Enter the boring number. A numbering system should be chosen that does not conflict with information recorded for previous exploratory work done at the site. Number the sheets consecutively for each boring. If rock core log sheets are also used, continue the consecutive numbering.
Project. Fill in the name of the project or client.
Location. If stationing, coordinates, mileposts, or similar project layout information is avail-able, indicate the position of the boring to that system by means of modifiers, such as approximate or estimated, as appropriate. If this information is not available, identify the client facility (e.g., Richland STP, center of Clarifier No. 2 site), or the town and state.
Elevation. Enter the elevation. If it was estimated from a topographic map, or roughly determined using a hand level, use the modifier approximate. It is important to tie the boring elevation to a recoverable reference point (e.g., fire hydrant, floor slab), if no other elevation data are available. Such points can be picked up later in a site survey, and boring elevations can be determined. Or, if no survey is done, at least the relative boring elevation with respect to pertinent project facilities will be known.
Drilling Contractor. Enter the name of the drilling company and the city and state where the company is based.
Drilling Method and Equipment. Identify the bit size and type, drilling fluid (if used), and method of drilling (e.g., rotary, hollow-stem auger, sonic, direct push). In addition, enter information on the drilling equipment (e.g., CME 55, Mobile B61, GeoProbe).
Water Level and Date. Enter the depth below ground surface (bgs) to the static water level in the borehole, if encountered. If multiple water level measurements are taken for the boring, this field should list the last or most representative measurement. Frequent water measurements are recommended to capture differences between water-bearing zones, and to capture the stable water level. Record the information in the Comments column. If free water is not encountered during drilling, or cannot be detected because of the drilling method, make a note of this information. Generally, water levels should be measured each morning before resuming drilling and at the completion of each boring. Record the date and time of day (for tides, river stage) of each water level measurement.
Date of Start and Finish. Enter the dates the boring was begun and completed. Add the time of day, if several borings are performed on the same day.
Logger. Enter the full name.
Page 2 of 18

STANDARD PROCEDURES FOR LOGGING OF SOIL BORINGS AND MONITORING WELLS
.
FIGURE 1 Example of the WinLog CH2M HILL Soil Boring Log Template
Page 3 of 18

STANDARD PROCEDURES FOR LOGGING OF SOIL BORINGS AND MONITORING WELLS
FIGEURE 2 Example of a Completed CH2M HILL Soil Boring Log Form
Page 4 of 18

STANDARD PROCEDURES FOR LOGGING OF SOIL BORINGS AND MONITORING WELLS
Technical Data Depth Below Surface. Use a depth scale that is appropriate for the sample spacing and for the complexity of subsurface conditions.
Sample Interval. Draw horizontal lines at the top and bottom depth of each sample interval. These lines should extend to the soil description column. For a very short sample interval, the bottom line can be lowered after the interval column to provide room for writing the information (see Figure 2). Enter the depth at the top and bottom of the sample interval.
Sample Type and Number. Enter the sample type and number. For instance, 1-S or SS 1 equals first sample, split spoon. Number samples consecutively, regardless of type. Enter a sample number, even if no material was recovered in the sampler.
Sample Recovery. Enter the length to the nearest 0.1 foot of soil sample recovered from the sampler. Often, there will be some wash or caved material above the sample; do not include the wash material in the measurement.
Standard Penetration Test Results. In this column, enter the number of blows required for each 6 inches of sampler penetration and the “N” value, which is the sum of the blows in the last two 6-inch penetration intervals, if the standard penetration test is being used. A typical standard penetration test involving successive blow counts of 2, 3, and 4 is recorded as 2-3-4 and (7). The standard penetration test is terminated if the sampler encounters refusal. Refusal is a penetration of more than 6 inches, but less than 12 inches, with a blow count of 100, or a penetration of less than 6 inches with a blow count of 50. A partial penetration of 50 blows for 4 inches is recorded as 50’4”. See the subsection, “Standard Penetration Test Procedures,” for additional discussion. In order for the standard penetration test to be useful, the hammer weight and split spoon size must be recorded.
Soil Description. The soil classification should follow the format described in the subsection, “Field Classification of Soil.”
Comments. Include all pertinent observations (changes in drilling fluid color, rod drops, drilling chatter, rod bounce, as in driving on a cobble, damaged Shelby tubes, and equip-ment malfunctions). If casing was used, record the sizes and depths installed, and make a note if drilling fluid was added or changed. You should instruct the driller to alert you to any significant changes in drilling (changes in material, occurrence of boulders, and loss of drilling fluid). Attribute such information to the driller and record it in this column.
Specific information might include the following:
• Date and the time drilling began and ended each day • Depth and size of casing and the method of installation • Date, time, and depth of water level measurements • Depth of rod chatter • Depth and percentage of drilling fluid loss • Depth of hole caving or heaving • Depth of change in material • Drilling interval through a boulder
Page 5 of 18

STANDARD PROCEDURES FOR LOGGING OF SOIL BORINGS AND MONITORING WELLS
• The results of pocket penetrometer or torvane test reported as: “PP = _____ TSF” or “TV = _____ TSF,” respectively
Record the depth of piezometers and the results of in situ tests in the Comments column.
Field Classification of Soil This section describes the format for the field classification of soil. In general, the approach and format for classifying soils should conform to ASTM International (ASTM) D 2488-year (use the most current version of the ASTM standard), Visual-Manual Procedure for Description and Identification of Soils, which is available through ASTM.
The Unified Soil Classification System is based on numerical values of certain soil properties measured by laboratory tests (ASTM D 2487). It is possible, however, to estimate these values in the field reasonably accurately with visual-manual procedures (ASTM D 2488). Also, some elements of a complete soil description, such as the presence of cobbles or boulders, changes in strata, and the relative proportions of soil types in a bedded deposit, can be obtained only in the field. Corrections and additions to the field classification can be provided, when necessary, through laboratory testing of the soil samples.
Soil descriptions should be precise and comprehensive without being verbose. The correct overall impression of the soil should not be distorted by excessive emphasis on insignificant details. In general, similarities between consecutive samples, rather than differences, should be stressed.
Soil descriptions must be recorded in the Soil Description column for every soil sample collected. The format and order for soil descriptions should be as follows:
1. Soil name (synonymous with ASTM D 2488 Group Name) with appropriate modifiers 2. Group symbol 3. Color 4. Moisture content 5. Relative density or consistency 6. Soil structure, mineralogy, or other descriptors
This order follows, in general, the format described in ASTM D 2488. Examples of soil descriptions are provided in Table 1.
Soil Name The basic name of a soil should be identical to the ASTM D 2488-84 Group Name, based on visual estimates of gradation and plasticity. The soil name should be capitalized. The only acceptable soil names are those listed in Figures 3 and 4, from ASTM D 2488-84.
Examples of acceptable soil names are illustrated by the following descriptions:
• A soil sample is visually estimated to contain 15 percent gravel, 55 percent sand, and 30 percent fines (passing No. 200 sieve). The fines are estimated as either low or highly plastic silt. This visual classification is SILTY SAND WITH GRAVEL, with a Group Symbol of (SM).
Page 6 of 18

STANDARD PROCEDURES FOR LOGGING OF SOIL BORINGS AND MONITORING WELLS
• Another soil sample has the following visual estimate: 10 percent gravel, 30 percent sand, and 60 percent fines (passing the No. 200 sieve). The fines are estimated as low plastic silt. This visual classification is SANDY SILT. The gravel portion is not included in the soil name because the gravel portion was estimated as less than 15 percent. The Group Symbol is (ML).
TABLE 1 Example Soil Descriptions POORLY GRADED SAND (SP), light brown, moist, loose, fine sand size
FAT CLAY (CH), dark gray, moist, stiff
SILT (ML), light greenish gray, wet, very loose, some mica
WELL-GRADED SAND WITH GRAVEL (SM), reddish brown, moist, dense, sub-angular gravel to 0.6 inches max
POORLY GRADED SAND WITH SILT (SP-SM), white, wet, medium dense
ORGANIC SOIL WITH SAND (OH), dark brown to black, wet, firm to stiff but spongy undisturbed, becomes soft and sticky when remolded, many fine roots, trace of mica
SILTY GRAVEL WITH SAND (GM), brownish red, moist, very dense, sub-rounded gravel to 1.2 inches maximum
INTERLAYERED SILT (60 percent) AND CLAY (40 percent): SILT WITH SAND (ML), medium greenish gray, non-plastic, sudden reaction to shaking, layers mostly 1.5 to 8.3 inches thick; LEAN CLAY (CL), dark gray, firm and brittle undisturbed, becomes very soft and sticky when remolded, layers 0.2 to 1.2 inches thick
SILTY SAND WITH GRAVEL FILL(SM), light yellowish brown, moist, medium dense, weak gravel to 1.0 inches max, very few small particles of coal
SANDY ELASTIC SILT (MH), very light gray to white, wet, stiff, weak calcareous cementation
LEAN CLAY WITH SAND (CL/MH), dark brownish gray, moist, stiff
WELL-GRADED GRAVEL WITH SILT (GW-GM), brown, moist, very dense, rounded gravel to 1.0 inches max
The gradation of coarse-grained soil (more than 50 percent retained on No. 200 sieve) is included in the specific soil name in accordance with ASTM D 2488-84. For a coarse-grained soil, note whether the soil is well-graded or poorly graded. If poorly graded, note whether it is fine-, medium-, or coarse-graded. Also record the maximum size and angularity or roundedness of gravel and sand-sized particles. For fine-grained soil (50 percent or more passing the No. 200 sieve), modify the name by the appropriate plasticity/ elasticity term, in accordance with ASTM D 2488-84.
For interlayered soils, describe each, starting with the predominant type. Use an introduc-tory name, such as Interlayered Sand and Silt. Also indicate the relative proportion of each soil type and layer thickness (see Table 1 for example).
Where helpful, the evaluation of plasticity/ elasticity can be justified (in the Comments section of the log) by describing results from any of the visual-manual procedures for
identifying fine-grained soils, such as reaction to shaking, toughness of a soil thread, or dry strength, as described in ASTM D2488-84
Page 7 of 18

STANDARD PROCEDURES FOR LOGGING OF SOIL BORINGS AND MONITORING WELLS
Group Symbol The appropriate group symbol from ASTM D 2488-84 (see Figure 3) must be given after each soil name. Place the group symbol in parentheses to indicate that the classification has been estimated.
In accordance with ASTM D 2488-84, dual symbols (e.g., GP-GM or SW-SC) can be used to indicate that a soil is estimated to have about 10 percent fines. Borderline symbols (e.g., GM/ SM or SW/SP) can be used to indicate that a soil sample has been identified as having properties that do not distinctly place the soil into a specific group. Generally, the group name assigned to a soil with a borderline symbol should be the group name for the first symbol. Borderline symbols should not be used indiscriminately. Every effort should be made to first place the soil into a single group.
Fill is often encountered when drilling. Fill comprises any materials that people have placed on the naturally occurring ground surface. Fill material can be determined from historical
FIGURE 3 Flow Chart for Identifying Coarse-Grained Soils (less than 50% fines); Unified Soil Classification System (American Society for Testing and Materials, 1985)
Page 8 of 18

STANDARD PROCEDURES FOR LOGGING OF SOIL BORINGS AND MONITORING WELLS
information or from the discovery of human-made materials, such as concrete, brick, glass, plastic, and wood. If the soil being described is determined to be fill material, “fill” should be included in the soil description. If appropriate, provide additional details in the comment column.
Color The basic color of a soil, such as brown, gray, or red, must be given. The color term can be modified, if necessary, by adjectives such as light, dark, or mottled. Especially note staining, iron staining, or mottling. This information might be useful for establishing water table fluctuations or contamination. As an alternative, consider using the Munsell soil color chart designation in addition to the color designation.
FIGURE 4 Flow Chart for Identifying Inorganic Fine-Grained Soils (50% or more fines); Unified Soil Classification System (American Society for Testing and Materials, 1985)
Page 9 of 18

STANDARD PROCEDURES FOR LOGGING OF SOIL BORINGS AND MONITORING WELLS
Moisture Content The degree of moisture present in a soil sample should be defined as dry, moist, or wet. Moisture content can be estimated from the criteria listed in Table 2.
TABLE 2 Criteria For Describing Moisture Conditions
Description Criteria
Dry Absence of moisture, dusty, dry to the touch
Moist Damp, but no visible water
Wet Visible free water, usually soil is below water table
Relative Density or Consistency Relative density of a coarse-grained (cohesionless) soil is based on N-values (ASTM D 1586; use the most current ASTM 1586 standard). If the presence of large gravel or disturbance of the sample makes determining the in situ relative density or consistency difficult, then omit this item from the description and explain it in the Comments column of the soil boring log.
Consistency of fine-grained (cohesive) soil is properly based on results of pocket penetrometer or torvane results. In the absence of this information, consistency can be estimated from N-values. Relationships for determining relative density or consistency of soil samples are given in Tables 3 and 4.
Soil Structure, Mineralogy, and Other Descriptors Discontinuities and inclusions are important and should be described. Such features include joints or fissures, slickensides, bedding or laminations, veins, root holes, and wood debris.
Significant mineralogical information should be recorded. Describe cementation, abundant mica, or unusual mineralogy, as well as other information, such as organic debris or odor.
Other descriptors can be included if they are important for the project or for describing the sample. These descriptors include particle size range and percentages, particular angularity, particle shape, maximum particle size, hardness of large particles, plasticity of fines, dry strength, dilatancy, toughness, reaction to HCl, and cementation.
Residual soils have characteristics of both rock and soil and can be difficult to classify. Relict rock structure should be described and the parent rock identified, if possible.
Potentially Impacted Subsurface Media Record observations of any potentially impacted subsurface media in the soil description or as comments. Make a note about odor, but do not try to guess what chemical you smell. Also describe non-aqueous phase liquids (NAPL) if they are present. Describe how they are present, such as sheen, staining along joints or root casts, residual, or free NAPL seeping from the sample. Do not try to guess what fluid is present. Use terms such as phase-separated hydrocarbons if you know a fluid is a fuel, but do not use terms such as diesel,
Page 10 of 18

STANDARD PROCEDURES FOR LOGGING OF SOIL BORINGS AND MONITORING WELLS
unless you have tested and know that the fluid is diesel. For larger investigation projects, it is advisable to prepare guidelines for describing site contamination in the soil samples.
TABLE 3 Relative Density of Coarse-Grained Soil (Developed from Sowers, 1979)
Blows/Ft Relative Density Field Test
0-4 Very loose Easily penetrated with 12-in. steel rod pushed by hand
5-10 Loose Easily penetrated with 1/2-in. steel rod pushed by hand
11-30 Medium Easily penetrated with 1/2-in. steel rod driven with 5-lb. hammer
31-50 Dense Penetrated a foot with 1/2-in. steel rod driven with 5-lb. hammer
50 Very Dense Penetrated only a few inches with 12-in. steel rod driven with 5-lb. hammer
TABLE 4 Consistency of Fine-Grained Soil (Developed from Sowers, 1979)
Blows/Ft Consistency Pocket Penetrometer
(TSF) Torvane
(TSF) Field Test
<2 Very soft <0.25 <0.12 Easily penetrated several inches by fist
2-4 Soft 0.25-0.50 <0.12-0.25 Easily penetrated several inches by thumb
5-8 Firm 0.50-1.0 0.25-0.5 Can be penetrated several inches by thumb with moderate effort
9-15 Stiff 1.0-2.0 0.5-1.0 Readily indented by thumb, but penetrated only with great effort
16-30 Very stiff 2.0-4.0 1.0-2.0 Readily indented by thumbnail
30 Hard >4.0 >2.0 Indented with difficulty by thumbnail
Standard Penetration Test Procedures Standard Penetration Tests (SPT) are conducted to obtain a measure of the resistance of the soil to penetration of the sampler and to recover a disturbed soil sample. They should be conducted in accordance with ASTM D 1586, Penetration Test and Split Barrel Sampling of Soils. These tests are most commonly performed on geotechnical projects. On environmental projects, a larger split spoon often must be used to collect the amount of soil required for analytical sampling. Recording blow counts can be useful for understanding variations in soil density or consistency on environmental projects, but typically is not done for an SPT.
Page 11 of 18

STANDARD PROCEDURES FOR LOGGING OF SOIL BORINGS AND MONITORING WELLS
Equipment and Calibration Before testing is started, equipment should be inspected for compliance with the require-ments of ASTM D 1586-84. The split-barrel sampler outer diameter (O.D.) should measure 2 inches; the inner diameter (I.D.) should measure 13/8 inches; the split tube should be at least 18 inches long. The dimensions should conform to those shown in Figure 1 of ASTM D 1586-84. The minimum size sampler rod allowed is the “A” rod (15/8-inch O.D.). A stiffer rod, such as the “N” rod (25/8-inch O.D.), is required for depths greater than 50 feet. The drive weight assembly should consist of a 140-pound hammer weight, a drive head, and a hammer guide that permits a free fall of 30 inches.
Procedures Standard Penetration Tests ideally should be conducted at every change of stratum, or within a continuous stratum, at intervals not exceeding 5 feet. Before driving the split-barrel sampler, loose and foreign material should be removed from the bottom of the borehole. It might be helpful to measure the rod stickup to ensure that the sampler is being driven from the bottom of the borehole. Perform the SPT by driving a standard split-barrel sampler 18 inches into undisturbed soil at the bottom of the borehole with a 140-pound guided hammer or ram that falls freely from a height of 30 inches.
Observe the number of blows required to drive the sampler for three 6-inch intervals, for a total of 18 inches, and record that number on the soil boring log. The sum of the number of blows required to drive the sampler for the second and third 6-inch intervals is considered the Standard Penetration Resistance (N) or the blow count. If the sampler is driven less than 18 inches, but more than 1 foot, the penetration resistance (N) is the blow count for the last 1 foot of penetration. If less than 1 foot is penetrated, the log must state the number of blows and the fraction of 1 foot penetrated. It is important that the field logger observe the sampler being driven and count the blows for each sample attempt.
General Considerations Consider the following suggestions when you perform Standard Penetration Tests:
1. The borehole should be cleaned out before every sample attempt. Because a minor amount of caving can be expected, the borehole can be considered adequately clean if no more than 4 inches of loose or foreign material has collected at the bottom. If there is a greater amount of caving, clean the borehole again.
2. The ball check valve in the split-barrel sampler should be cleaned and working properly for each sample. Bent, chipped, or damaged shoes should be replaced. The split-barrel halves should not be warped. In case of zero sample recovery (i.e., if the sample is lost during the first attempt), a spring catcher should be used during subsequent attempts to facilitate recovery.
3. During SPT sampling, it is important that all rod connections be tight and that the hammer guide be connected securely to the drill rods. If the hammer guide connection becomes loose, much of the hammer energy can be lost because of deflection of the hammer coupling. The lifting rope should not rub against the mast. Each hammer fall should be 30 inches.
Page 12 of 18

STANDARD PROCEDURES FOR LOGGING OF SOIL BORINGS AND MONITORING WELLS
4. During SPT sampling, it is important that the drill rods be positioned at the center of the drill hole to preclude the development of friction between drill rods and the walls of the borehole or casing.
5. If the hammer weight is raised by means of a cathead, generally two wraps on the cathead should be used. The optimal number of wraps varies with the condition of the rope and cathead, and with the weather. Most importantly, the driller should exercise care to prevent friction of the rope on the cathead during the fall of the hammer.
6. Nonstandard procedures or equipment occasionally are used for obtaining samples (e.g., 3-inch O.D. split-barrel samplers, or 300-pound hammers). Any nonstandard practice should be described on the boring log form. Also, the blow counts should be clearly marked as not conforming to SPT values.
Sample Labeling and Packaging This section addresses only those sample labeling and packaging requirements that apply to physical testing of soil samples. For guidance on requirements for samples destined for chemical testing, refer to the project sampling and analysis plan. If the work is being conducted at a site containing hazardous waste (not simply hazardous constituents, but either listed or characteristic hazardous waste) or toxic waste (e.g., polychlorinated biphenyls), contact the project manager regarding appropriate sample handling procedures consistent with hazardous or toxic waste management regulations.
The samples recovered from the borehole are an important part of the boring record and must be properly packaged and labeled, if further testing is required. The following description outlines the minimum requirements for packaging and labeling the samples.
1. Place disturbed samples in zip-locked bags or jars. If you use jars, mark the jar lids and affix labels to the sides of the jars. Labels are usually available from the analytical laboratory. Mark the following information clearly on the bags or jars:
a. Job number b. Boring number c. Sample number d. Sample depth e. Date
Use a permanent marker. If moisture content tests are anticipated, use jars, which should be tightly sealed, then sent to the laboratory. Testing should be initiated as soon as possible (within 1 week).
2. Label boxes containing the jars, on top and on one end, with the following information:
a. Job name b. Job number c. Boring number d. Sample numbers e. Sample depths f. Date
Page 13 of 18

STANDARD PROCEDURES FOR LOGGING OF SOIL BORINGS AND MONITORING WELLS
g. Name
It is helpful to start a new box for each new boring if the boxes are at least half full.
3. Clean Shelby tubes of mud and moisture. When they are dry, use a permanent marker to label them with the following information:
a. Arrow indicating which way is up b. Job number c. Boring number d. Sample number e. Sample depth f. Amount of recovery g. Date
Circumscribe the top and bottom of the sample on the outside of the tube with a marker.
4. Waxing of Shelby tubes is essential if sample testing is not to occur within a few days. In all cases, place lids on the ends and tape them with airtight tape. Be sure to seal the holes in the top of the tube. Pack the open portion of the tube above the sample to prevent shifting of the soil. Dampened newspaper is generally adequate for this purpose, but it should be separated from the soil sample with a wax seal or an inverted cap.
Field Equipment Checklist The following equipment and supplies are necessary or useful for soil boring exploration.*
Siting
____ Lath, flagging, orange spray paint, Lumber crayon
____ 100-foot tape
____ Brunton or Silva compass
Logging Equipment
____ Soil Boring Guideline - Clipboard
____ Form D1586 on all-weather paper - Pens/pencils
____ Engineer’s pocket tape measure with tape lock
____ Field notebook on all-weather paper
____ Squirt bottle with water, Spatula
____ HCl, 10 percent solution
Sampling and Packaging
____ Jars with lids and labels (Form #131)
____ Shelby tubes and plastic end caps
Page 14 of 18

STANDARD PROCEDURES FOR LOGGING OF SOIL BORINGS AND MONITORING WELLS
____ Airtight tape (e.g., electrical)
____ Newspaper
____ Wax, stove, melting pot, and matches
____ Indelible fine felt-tipped markers (e.g., Sharpie brand)
Test Equipment
____ Pocket penetrometer
____ Torvane
____ Well sounder
Other
____ Camera, film
____ Hand lens
____ Rags
____ Ear protectors
____ Screwdrivers
____ Hard hat
____ Sunscreen
____ Insect repellent
* For potentially contaminated projects, follow the site-specific sampling and analysis plan for field monitoring and personal protective equipment.
Relevant Literature ASTM International (ASTM). Formerly American Society for Testing and Material. 2000. ASTM D 1586, Standard Method for Penetration Test and Split-Barrel Sampling of Soils. Annual Book of ASTM Standards, Section 4, Vol. 04.08.
ASTM International (ASTM). Formerly American Society for Testing and Material. 2000. ASTM D 1587, Standard Method for Thin-Walled Tube Sampling of Soils. Annual Book of ASTM Standards, Section 4, Vol. 04.08.
_____. 2000. ASTM D 2487, Standard Test Method for Classification of Soils for Engineering Purposes. Annual Book of ASTM Standards, Section 4, Vol. 04.08.
_____. 2000. ASTM D 2488, Standard Practice for Description of Soils (Visual-Manual Procedure). Annual Book of ASTM Standards, Section 4, Vol. 04.08.
Page 15 of 18

STANDARD PROCEDURES FOR LOGGING OF SOIL BORINGS AND MONITORING WELLS
American Society of Civil Engineers. 1976. Subsurface Investigation for Design and Construction of Foundations of Buildings. American Society of Civil Engineers Manual on Engineering Practice, No. 56, 53 pp.
Bell, F. G. 1981. Engineering Properties of Soils and Rocks. London: Butterworth Publishers, Inc.
Burmister, D. M. 1949. Principles and Techniques of Soil Identification. Proceedings of the Highway Research Board, pp. 402-433.
Casagrande, A. 1947. Classification and Identification of Soils. American Society of Civil Engineers Transactions, pp. 901-991.
Kovacs, W. D., L. A. Salomone, and F. Y. Yokel. 1981. Energy Measurement in the Standard Penetration Test. U.S. Dept. Commerce, National Bureau of Standards, Building Science Series 135.
Matula, M. 1981. Rock and Soil Description and Classification for Engineering Geological Mapping. Report by the IAEG Commission on Engineering Geological Mapping. Bulletin of the International Association of Engineering Geology, No. 24, pp. 235-274.
Sowers, G. F. 1979. Introductory Soil Mechanics and Foundations: Geotechnical Engineering. MacMillan Publishing Co., New York, 4th edition. 621 pp.
U.S. Bureau of Reclamation. 1974. Earth Manual. 2nd ed. Washington, D.C.: U.S. Government Printing Office.
Page 16 of 18

Attachment 2 Standard Operating Procedure for Low-
Flow Groundwater Sampling from Monitoring Wells

S t and ard Op e ra t in g Proc ed u re N o . 7
Low-Flow Groundwater Sampling from Monitoring
Wells
January 2016

STANDARD OPERATING PROCEDURE NO. 7
Low-Flow Groundwater Sampling from Monitoring Wells
I. Purpose and Scope This procedure presents general guidelines for the collection of groundwater samples from monitoring wells using a low-flow purging and sampling procedure. This method will allow for the collection of representative groundwater samples from monitoring wells, while minimizing the amount of purge water generated. This procedure is applicable for monitoring wells that are 2 inches in diameter or greater, and is considered to be appropriate for collections of volatile organic compounds (VOCs), semivolatile organic compounds (SVOCs), pesticides, polychlorinated biphenyls (PCBs), and metals. This procedure is not appropriate for the collection of light or dense non-aqueous phase liquids (LNAPLs or DNAPLs). Operations manuals should be consulted for specific calibration and operating procedures.
II. Equipment and Materials • Flow-through cell with inlet/outlet ports for purged groundwater, watertight ports for each
probe, and inlet/outlet port sizes to match tubing diameter (3/8 inch and ½ inch diameter is most common)
• pH/Eh meter: Orion Model SA250 or equivalent
• Temperature/conductivity meter: YSI Model 33 or equivalent
• Dissolved oxygen meter: YSI Model 57 or equivalent
• Water-level indicator
• In-line disposable 0.45-micron (µm) filters (for collection of dissolved metal samples): QED FF8100 or equivalent
• Bailer, teflon or stainless steel
• Adjustable-rate, positive-displacement, bladder pump
• Generator
• Disposable polyethylene or Teflon tubing of a diameter to match the port on the adjustable-rate, positive-displacement pump, and the inlet/outlet ports of the flow-through cell, and, where required, in-line disposable 0.45-µm filters (3/8 inch and ½ inch diameter is most common)
• Plastic sheeting
• Well construction data
Page 1 of 4

SOP 7— LOW-FLOW GROUNDWATER SAMPLING FROM MONITORING WELLS
• Photoionization detector (PID)
• Field notebook, sample bottles, sample cooler with ice
• Groundwater Sampling Forms
• Sample labels and chain-of-custody form
Note that the groundwater sampling equipment and reusable materials will be decontaminated between sampling locations in accordance with the Decontamination of Personnel and Equipment SOP No. 2. If used, dedicated tubing will either remain in the wells, or it will be stored in dedicated plastic bags for future groundwater sampling events.
III. Procedures and Guidelines A. Setup and Purging 1. Sampling should begin at the well that is least contaminated, based on previous information (if
available) or well location, and proceed systematically to well that is most contaminated.
2. For the well to be sampled, information is obtained on well location, diameter(s), depth, screened interval(s), and the method for disposal of purged water.
3. Instruments are calibrated according to manufacturer's instructions. Instrument calibration will occur a minimum of one time per sampling day.
4. The well number, site, date, and condition are recorded in the field notebook.
5. Inspect the well head, lock, and locking cap for evidence of tampering or damage. Record these observations in the field notebook.
6. Unlock the well cap and open the well. Monitor the well headspace for the presence of volatile compounds using a PID and record the readings in the field notebook.
7. Using an electronic water level probe graduated to the nearest 0.01 foot, measure the depth to water from the surveyor’s mark located on the top of the well casing. If a surveyor’s mark is not indicated, measure the depth to water from the highest point on top of the well casing. Record this information on the Groundwater Sampling Form. Clean the tip of the water level probe after completing the measurements. Do not measure the depth to the bottom of the well at this time (to avoid disturbing accumulated sediment at the bottom of the well). Obtain well depth information from well construction log or specification table.
8. Compute the volume of water in the well and record this information on the Groundwater Sampling Form. The volume (in gallons of water) in the well casing or in sections of telescoping well casing is calculated as follows:
Vol. of cylinder/column of water = (π r2h)(7.480519 gallons/cubic foot),
where: π = 3.1415927
r = radius of the well pipe in feet
h = height of water in well in feet
Page 2 of 4

SOP 7— LOW-FLOW GROUNDWATER SAMPLING FROM MONITORING WELLS
The volume of water in typical well casings may be calculated as follows:
• 2-inch diameter well: 0.163 gal/ft × ___ (linear feet of water) = gallons
• 4-inch diameter well: 0.653 gal/ft × ___ (linear feet of water) = gallons
• 6-inch diameter well: 1.469 gal/ft × ___ (linear feet of water) = gallons
9. Install the pump in the well. Slowly lower the pump (with the attached tubing and safety line) into the well to the desired depth. The pump will be set near the middle of the well screen, if possible. At a minimum, the pump intake will not be positioned lower than 2 feet from the bottom of the well. The depth to the pump intake will be recorded on the Groundwater Sampling Form. If there is less than 3 feet of available water, the groundwater well will be purged and sampled using a bottom-loading bailer.
10. Measure the water level in the well after pump insertion. Leave the water level probe in the well to facilitate continued water level monitoring during purging activities.
11. Start purging the well at a low flow rate between 0.2 and 0.5 liters per minute. Measure the purge rate using a container of known volume, and record this information on the Groundwater Sampling Form.
12. The water level should be monitored during purging, and ideally, the purge rate should equal the well recharge rate so there is little to no drawdown in the well. (The water level should stabilize for the specific purge rate). The purge rate may be increased as long as a constant water level in the well can be maintained. There should be at least 1 foot of water over the pump intake. This assures that there is no risk of the pump suction being broken, or of entrainment of air in the sample. Record adjustments in the purge rate and changes in depth to water in the logbook. Purge rates should, if needed, be decreased to the minimum capabilities of the pump (0.1 to 0.2 liters per minute) to avoid affecting well drawdown. The well should not be purged dry. If the recharge rate of the well is so low that the well is purged dry using the lowest operational flow rate, then allow the well to recharged to a sufficient level and collect the appropriate volume of water for the sample with the pump.
13. During purging, the water quality parameters will be measured periodically (every 3 to 5 minutes) until the parameters have stabilized. These parameters will be considered stabilized when pH measurements agree within 0.1 units, temperature measurements agree within 1degree Celsius (°C), specific conductance measurements agree within 3 percent, and dissolved oxygen and turbidity measurements agree within 10 percent. If parameter stabilization has not occurred after 4 hours, purging activities will be considered complete.
B. Sample Collection Once purging has been completed, the well is ready to be sampled. The elapsed time between the completion of purging and the collection of the groundwater sample from the well should be minimized. Typically, the sample is collected immediately after the well has been purged, but this may also be dependent on well recovery.
After disconnection from the flow-through cell, samples will be collected directly from the discharge tubing into the appropriate sample bottles. During sample collection, the pump flow rate should be reduced to minimize drawdown. Samples for VOC analysis shall be collected first, and they should be filled to the top leaving no headspace. After capping the VOC sample bottle, the bottle shall be
Page 3 of 4

SOP 7— LOW-FLOW GROUNDWATER SAMPLING FROM MONITORING WELLS
inverted to check for visible air bubbles. If air bubbles are present, either water should be added to the sample or another sample should be collected.
If the turbidity measurements are not below 10 NTU at stabilization (or after 4 hours) a total metals sample will not be collected (if planned at that particular location). However, a dissolved metals sample will still be collected.
Samples for dissolved metals analysis may be filtered in the field during sample collection. The recommended method for field filtering is through the use of a disposable in-line filtration module (0.45-µm filter) attached to the discharge tubing. The water sample is collected as the water is pumped through the filter by the pressure provided using the pumping device. Samples for total metals analysis are not filtered during sample collection.
Immediately upon collection, the sample bottles should be labeled and placed in an ice-filled cooler for transport to the laboratory. The sample designation, preservation, sample date, and sample time will be recorded on the sample label, the Groundwater Sampling Form, and the chain-of-custody record. The sample preservation, bottle requirements, and holding times for the analytical parameters are summarized in the QAPP.
In addition, the following information, at a minimum, will be recorded in the log book:
1. Sample identification (site name, location, and project number; sample name/number and location; sample type and matrix; time and date; sampler's identity)
2. Sample source and source description
3. Field observations and measurements (appearance, volatile screening, field chemistry, sampling method), volume of water purged prior to sampling, number of well volumes purged
4. Sample disposition (preservatives added; laboratory sent to with the date and time sent; laboratory sample number, chain-of-custody number)
IV. Attachments • Low-Flow Well Sampling Field Data Sheet
V. Key Checks and Preventative Maintenance Maintain field equipment in accordance with the manufacturer’s recommendations. This will include, but is not limited to:
• Inspect sampling pump regularly and replace as warranted. • Inspect air/sample line quick-connects regularly and replace as warranted.
Verify battery charge, calibration, and proper working order of field measurement equipment prior to initial mobilization and daily during field efforts. Verify that all ports and tubing sizes are of compatible diameters.
Page 4 of 4

Attachment 3 Standard Operating Procedure for
Undisturbed Soil Sampling

S T A N D A R D O P E R A T I N G P R O C E D U R E( FW S L-0 8)
Undisturbed Soil Sampling
January 2016

STANDARD OPERATING PROCEDURE (FWSL-08)
Undisturbed Soil Sampling
I. Purpose and Scope This Standard Operating Procedure (SOP) provides guidance for the collection and handling of undisturbed soil samples using the split tube technique. The method described for undisturbed soil sampling is applicable for soil sampling below the surface and is used to collect representative samples.
II. Equipment and Materials The following materials are required to undertake this procedure:
• Thin wall tube or Shelby Tube Sampler • Impervious disks • Wax plugs • Shipping material (Styrofoam Plug) Xylene free permanent marker pen or indelible pen • Chain-of-custody forms • Sample Register • Cooler/Esky • Ice Packs/Ice • Sample jars. • Nitrile gloves
Reference is also made to: • SOP FWGN-02 Decontamination of Personnel and Non-specific Equipment.
III. Procedures and Guidelines Undisturbed soil samples are collected using a thin-walled tube, or split tube, sampler which is driven into the soil profile either by hand or pneumatically to recover relatively undisturbed soil samples suitable for geotechnical laboratory tests, soil logging and chemical laboratory testing. The thin-walled sampler is usually used to collect soil samples for physical soil tests such as porosity, permeability, or grain size.
A split tube is a one-piece hollow tube that is usually 5 to 15 centimeters in outside diameter and 5 to 10 times the diameter in length. The sample tube is placed in the boring on the bottom of the hole. The tube is pushed into the soil with a continuous and rapid
Page 1 of 2

UNDISTURBED SOIL SAMPLING
motion without impact or twisting to a depth of 0.5 to 0.8 meters. The sampling tube is retrieved and the disturbed material is removed from the top of the tube.
For geotechnical and or physical testing a 2-3cm plug of soil is removed from the base of the tube. An impervious disk is placed at both ends of the tube and sealed with a wax plug prior to shipment to the laboratory. The tube is labeled and positioned such that it is cushioned and remains undisturbed. It is packed in Styrofoam plugs or other cushioning material and shipped to the laboratory.
For chemical analysis the tube is carefully split lengthways, a physical description of the soil appearance and sampling depth is logged in the CH2M soil boring log sheet. Using nitrile gloved hand and stainless steel spatula the undisturbed soil is transferred into appropriate laboratory prepared sampling jars.
The following information, at a minimum, will be recorded in the field sample register during sample collection:
• Sample identification (site name, location, project number; sample ID/number; depth, sample type/matrix; time/date; analyses and sampler's identity).
All reusable equipment should be cleaned and decontaminated before and between each sampling location in accordance with SOP FWGN-02.
IV. References ASTM International (ASTM) D1587-94 Standard Practice for Thin-Walled Tube Geotechnical Sampling of Soils.
V. Key Checks and Preventative Maintenance None
Page 2 of 2

Attachment 4 Standard Operating Procedure for the
Installation of Temporary Soil Vapor Probes

Standard Operating Procedure for the Installation of
Temporary Soil Vapor Probes
January 2016

Standard Operating Procedure for the Installation of Temporary Soil Vapor Probes
1.0 Scope and Application
This standard operating procedure (SOP) is recommended as a practical approach for the installation of temporary soil vapor probes where the intent is to collect soil vapor samples only on a single occasion. A common use of this SOP is during vapor intrusion assessments associated with subsurface volatile organic compound (VOC) contamination. This SOP should be used when its application is consistent with the project’s data quality objectives (DQOs) and in conjunction with the SOP for the Collection of Soil Vapor Samples from Temporary Probes and Permanent Implants Using Canisters. The project team is responsible for ensuring this procedure meets all applicable regulatory standards and receives approval/concurrence from the leading regulatory agency for the project. Only persons trained in the installation of soil vapor probes should attempt this procedure.
2.0 Project-Specific Considerations
2.1 As with all intrusive site work, a utility clearance should be performed prior to mobilization. It may also be necessary to acquire permits and site access.
2.2 Soil vapor sampling should not be performed until 48 hours after a significant rain event (defined as >1 inch of rainfall).
2.3 Temporary soil vapor probes are typically installed with a drive point method, where the probe is pushed into the ground without creating a hole beforehand. The probe may either be advanced with a hand tool method (e.g., the AMS Retract-A-Tip system), or a drill rig (e.g., Geoprobe® post-run tubing [PRT] method). Equipment specifically designed for temporary soil vapor sampling is available for either method. Operation of direct-push machinery shall be performed only by trained and licensed personnel. The hand tool installation method is only applicable to relatively shallow sampling (e.g., up to 10 to 15 feet below ground surface [bgs] depending on the soil type).
2.4 Prior to attempting installing soil vapor probes there should be an understanding of subsurface conditions at the site.
2.4.1 Depth to Groundwater – soil vapor samples must be collected in the vadose zone (and above the capillary fringe).
2.4.2 Soil permeability - It may not be feasible to collect soil vapor from finer-grained or tight soils with little pore volume, such as clays; if there are clay layers present in the subsurface, these intervals should be avoided. For sampling in these soils, using permanent soil vapor implants with a wider borehole is recommended. Care should be taken during purging and sampling so that the vacuum in the sampling system never exceeds 7 inches mercury (inches Hg) or approximately 100 inches water.
2.4.3 Gravel or dense clay layers may make hand installation methods impracticable.
2.5 Select the probe interval length – typically probe sample intervals are 2 inches to 1 foot; however, smaller or larger intervals may be selected depending on the project’s DQOs.
2.6 Selecting the probe depth interval
2.6.1 The top of the soil vapor probe should be at least 5 feet bgs to avoid short circuiting with outdoor air. If there is impermeable ground cover (e.g., concrete, asphalt), shallower sampling depths may be considered.
2.6.2 The bottom of the soil vapor probe must be above the capillary fringe.
Vapor Intrusion – Best Practices Page 1 of 6 Rev. 12/21/2015

STANDARD OPERATING PROCEDURE FOR THE INSTALLATION OF TEMPORARY SOIL VAPOR PROBES 2.6.3 As the depth of the sampling interval increases, the difficulty of installing the probe also
increases, with the primary challenges being pushing the rods down with a hand tool and threading the post-run tubing (PRT) adapter into the PRT point holder.
2.6.4 It is advisable to collect a soil core from the proposed sampling area prior to installing the soil vapor probe to identify the exact depth of the capillary fringe and determine where the most permeable soil layers are located.
2.6.5 Sampling at multiple depths at each sample location (or a subset of the locations) should be considered to obtain a vertical profile of soil vapor conditions if the vadose zone height is long enough; typically the bottom of a probe should be at least 5 feet from the top of the probe beneath it. Multi-depth sampling can be performed in one hole by starting with the shallowest depth first and then continuing downward.
2.7 Temporary soil vapor probes can be installed either with or without the sample tubing in place. The sample tubing is attached after the probe is pushed to depth in the PRT method. However, the probe can be pushed with the tubing attached by using a slotted drive cap and slotted pull cap. This method is better for deeper sampling intervals.
3.0 Materials
3.1 Geoprobe PRT Method (the equipment below is typically supplied by the drilling subcontractor) • Drive rods – 1- to 1.5-inch outer diameter drive rods• Expendable drive points – steel or aluminum expendable drive points• PRT expendable point holder• PRT adapters• Post-run point popper
3.2 AMS Retract-A-Tip Method (the equipment may be rented or purchased from AMS; they offer several different “Gas Vapor Probe Kits,” which may be customized with additional pieces of equipment) • Slide hammer or hammer drill for driving the probe (will need power supply for the hammer
drill) • Drive rods – 5/8-inch outer diameter hollow drive rods• Removal jack• Retract-A-Tip assembly
3.3 Probe tubing - 1/4-inch outer diameter (OD) Teflon tubing (may be supplied by the drilling subcontractor)
3.4 Probe cap (to seal the tubing during equilibration) – Swagelok part number SS-400-C
3.5 Multi-gas meter for health and safety monitoring during drilling.
3.6 Electrical tape
3.7 Leather work gloves, vice grips, and a large adjustable wrench are necessary for the AMS method
4.0 Temporary Soil Vapor Probe System Set-Up
4.1 Obtain soil vapor sampling probes in sufficient quantity to carry out the assessment. These systems and their installation can be obtained from geotechnical firms that provide direct-push supplies and services or from AMS for the hand tool method. Their basic installation procedures can be followed as long as the details below are included.
4.2 Manufactured soil vapor probes (such as the Geoprobe PRT system, and AMS Retract-A-Tip) are specifically manufactured for soil vapor collection and facilitate installation, improve sampling, are easily decontaminated between each use, and offer consistency and ease of use.
Vapor Intrusion – Best Practices Page 2 of 6 Rev. 12/21/2015

STANDARD OPERATING PROCEDURE FOR THE INSTALLATION OF TEMPORARY SOIL VAPOR PROBES 4.3 It is necessary to coordinate the hardware (i.e., size of tubing, fittings, sampling interface assembly,
etc.) that mates the soil vapor probe sampling line to the sampling system (e.g., Tedlar bags, SUMMA canisters). Appropriate hardware is critical to achieving a leak-free system. All connections should be inert gas-tight compression fittings (i.e., Swagelok or equivalent), and all sample transfer lines should be made of Teflon or inert nylon tubing. Typically, all tubing and fittings should be 1/4-inch OD. These fittings will match up with the sampling manifold specified in the soil vapor sampling SOP.
4.4 The soil vapor probes and equipment must be decontaminated prior to use. Steam cleaning is the preferred method of decontamination; however, a three-stage decontamination process consisting of a wash with a non-phosphate detergent, a rinse with tap water and a final rinse with distilled water may be used. The equipment should be allowed to dry before use. Once decontaminated, the probes must be shown to be free of contaminants. At a minimum, a suitably sensitive organic vapor meter should be used for this purpose. Any probe that does not pass decontamination should not be used.
4.5 New tubing must be used for each soil vapor probe; the tubing cannot be decontaminated.
4.6 Handle and store decontaminated soil vapor probes in a manner that prevents contamination.
4.7 Inspect all probe parts for wear before each use. Replace probe tips, o-rings, adapters, and probe rods as needed. New parts and parts in good working condition greatly reduce the chances of ambient air leaking into the soil vapor sample and reduce the need for re-pushing probes. Ideally, the expendable point holder will be a single piece (as opposed to two or more).
5.0 Soil Vapor Probe Installation & Removal for the Geoprobe® PRT Method
5.1 Assemble the probe as shown in Figure 1. The PRT adaptor and tubing may be attached to the PRT point holder so that the tubing is pushed down instead of post-run if a slotted drive cap is used.
5.2 Push the probe to the desired depth. Ensure that the final depth of the drive point includes extra depth to include the length of the tip and the sampling interval when retracted (e.g., for a depth of 5 feet bgs with a 6-inch screen, push the probe to 5 feet 6 inches bgs).
5.3 Retract the probe to create an annular space. The retraction length is equal to the selected sampling interval length. It is advisable to check that the tip detached during retraction. This can be done by poking a small-diameter rod down the inside of the probe. Note: Sometimes an o-ring may be used between the tip and tip holder. If so, the tip is more likely to stay attached to the holder when the probe is retracted. Since a leak-check procedure will be utilized prior to collecting soil vapor samples, it is not necessary to use an o-ring on the tip. The force of the direct push will hold the tip against the tip holder during the push. In other words, there is no need to create a leak-free seal at this connection, as the tip will be removed before sampling.
5.4 Attach the PRT adapter to the 1/4-inch OD Teflon tubing and secure in place by wrapping the connection with about 2 inches of electrical tape. This prevents the tubing from slipping on the nipple while tightening. Double check that the o-ring on the PRT adapter is new and undamaged.
5.5 Feed the PRT adapter and tubing down the probe. When it reaches the point holder, cut the tubing so that an additional 2 to 3 feet of tubing remains above ground.
5.6 While pushing down on the tubing, twist in a counter-clockwise direction until the probe adapter and tubing seat. Test the connection by lightly tugging on the tubing.
5.7 Install the probes in a manner that creates a leak-free seal between the above-ground atmosphere and the probe tip, while minimizing the impact on ground surface covers (e.g., asphalt, concrete, driveways, lawns). Achieving a leak-free seal may require placement of an inert sealing material (i.e., hydrated bentonite) at the point where the probe penetrates the ground surface. See Figure 2.
Vapor Intrusion – Best Practices Page 3 of 6 Rev. 12/21/2015

STANDARD OPERATING PROCEDURE FOR THE INSTALLATION OF TEMPORARY SOIL VAPOR PROBES 5.8 In the event the direct-push installation technique does not work, and a pre-drilled pilot hole is
needed, this procedure must be coordinated with the project engineer. Use of pre-drilled holes will require careful control as to not over-drill and may also create the need for back-grouting to overcome leakage from the aboveground ambient atmosphere.
5.9 Wait 30 minutes after the probe is installed and sealed properly to begin sampling, so that the subsurface has time to equilibrate. The probe cap should be tightened on the end of the tubing during the equilibration period. Follow the proper procedures as presented in the SOP for the Collection of Soil Vapor Samples from Temporary Probes and Permanent Implants Using Canisters, and be sure that leak-check procedures are employed.
5.10 Removal of the probes is to be carried out by trained personnel using the direct-push machinery. The probe will be removed in a manner that minimizes disruption of ground surface covers (e.g., asphalt, concrete, driveways, lawns). Abandon the borehole by filling with a hydrated bentonite slurry or concrete.
5.11 Replace ground surface covers and repair to original condition.
6.0 Soil Vapor Probe Installation & Removal for the AMS Retract-A-Tip Method
6.1 Assemble the probe as shown in Figure 2 and attach the tubing. Thread the tubing through the hollow rod and attach the drive end to the top of the rod. Electrical tape may be used to secure the tubing to the tip, and protect the tubing from the drive end.
6.2 Push the probe to the desired depth with either the slide hammer or hammer drill. Attach extra rods to achieve the desired depth. Ensure that the final depth of the drive point includes extra depth to include the length of the retracted tip.
6.3 Retract the rod with the removal jack to expose the screen within the probe tip.
6.4 Install the probes in a manner that creates a leak-free seal between the above-ground atmosphere and the probe tip, while minimizing the impact on ground surface covers (e.g., asphalt, concrete, driveways, lawns). Achieving a leak-free seal may require placement of an inert sealing material (i.e., hydrated bentonite) at the point where the probe penetrates the ground surface.
6.5 In the event the installation technique does not work, and a pre-drilled pilot hole is needed, this procedure must be coordinated with the project engineer. Use of pre-drilled holes will require careful control as to not over-drill and may also create the need for back-grouting to overcome leakage from the aboveground ambient atmosphere.
6.6 Wait 30 minutes after the probe is installed and sealed properly to begin sampling, so that the subsurface has time to equilibrate. The probe cap should be tightened on the end of the tubing during the equilibration period. Follow the proper procedures as presented in the SOP for the Collection of Soil Vapor Samples from Temporary Probes and Permanent Implants Using Canisters, and be sure that leak-check procedures are employed.
6.7 Remove the probe with the removal jack. The probe will be removed in a manner that minimizes disruption of ground surface covers (e.g., asphalt, concrete, driveways, lawns). Abandon the borehole by filling with a hydrated bentonite slurry or concrete.
6.8 Replace ground surface covers and repair to original condition.
Vapor Intrusion – Best Practices Page 4 of 6 Rev. 12/21/2015

STANDARD OPERATING PROCEDURE FOR THE INSTALLATION OF TEMPORARY SOIL VAPOR PROBES
Vapor Intrusion – Best Practices Page 5 of 6 Rev. 12/21/2015

STANDARD OPERATING PROCEDURE FOR THE INSTALLATION OF TEMPORARY SOIL VAPOR PROBES
FIGURE 2 AMS Retract-A-Tip probe assembly
Vapor Intrusion – Best Practices Page 6 of 6 Rev. 12/21/2015

Attachment 5 Standard Operating Procedure for
Subslab Soil Vapor Sampling from Cox-Colvin Vapor Pins

Standard Operating Procedure for Subslab Soil Vapor Sampling
from Cox-Colvin Vapor Pins
January 2016

Standard Operating Procedure for Subslab Soil Vapor Sampling from Cox-Colvin Vapor Pins
1.0 Scope and Application
This standard operating procedure (SOP) describes the approach for subslab soil vapor sampling from Cox-Colvin & Associates, Inc., Vapor Pins using evacuated canisters (such as Summa canisters or equivalent); methods for purging and leak-checking the Vapor Pins are also included in this SOP. This procedure should be used in conjunction with project-specific data quality objectives. The project team is responsible for ensuring this procedure meets all applicable regulatory standards and receives approval/concurrence from the leading regulatory agency for the project. Vapor intrusion (VI) subject-matter experts should be consulted to address technical, regulatory, and/or field implementation issues associated with the use of this SOP. Only persons trained in subslab soil vapor sampling techniques should attempt this procedure.
2.0 Project-Specific Considerations
2.1 Information should be made available to building occupants prior to the sampling event that informs occupants about the sampling activities and equipment. This may be done in conjunction with a larger community outreach program associated with the site.
2.2 The Swagelok parts (quarter-turn plug valves and nuts) and Vapor Pins may be re-used if they are decontaminated. Options for decontamination include: 1) purging with air (only acceptable if there was no contact with contaminated soil or groundwater); 2) washing with Liqui-nox (do not use Alconox) followed by hot water rinse; or 3) rinsing with methanol followed by hot water rinse. The parts must be completely dry before reuse. It is advisable to heat the parts in an oven to a temperature of 130 degrees Celsius (266 degrees Fahrenheit) after rinsing with water. The appropriate decontamination process should be selected during the work-planning phase for each project. Typically, subslab soil vapor sampling does not generate investigation-derived waste (IDW) other than items that can be disposed of as solid waste; however, decontaminating with liquids will generate IDW. Compare the cost of buying new parts to the cost of managing and disposing of the IDW. The Teflon tubing cannot be reused or decontaminated.
3.0 Health and Safety
There are several health and safety topics to consider when sampling Vapor Pins:
3.1 Field teams should work in pairs at residential buildings or at industrial/commercial buildings where a relationship with the building occupant has not yet been established. A field team member should never enter a building alone for the first time.
3.2 Common hazards encountered during subslab soil vapor sampling include low ceilings, slip, trip, and fall hazards (from installation equipment and items stored in sampled areas), wet surfaces, biological hazards (spiders, rodents, residential pets, and so forth), sanitary hazards (animal feces), and low lighting levels.
3.3 Have a properly calibrated multi-gas meter (including lower explosive limit meter) and photoionization detector (PID) (as required by the project Health and Safety Plan) ready to screen the breathing zone during sampling. Potentially combustible atmospheres and hazardous volatile organic compound (VOC) concentrations may be present in subslab soil vapor.
3.4 Beware of pinch points and use the correct hand tools to avoid hand injuries.
VAPOR INTRUSION – BEST PRACTICES REV. 12/21/2015 PAGE 1 OF 15

STANDARD OPERATING PROCEDURE FOR SUBSLAB SOIL VAPOR SAMPLING FROM COX-COLVIN VAPOR PINS 4.0 Canister Security
4.1 Field teams should ensure that sampling canisters are not disturbed by building occupants. The necessary measures to accomplish this will vary by site/project.
4.2 Each sampling canister should be clearly marked with a sign that includes contact information for a point of contact.
4.3 In commercial or industrial buildings, orange cones, barricades, chairs, padlock and chain, and/or caution tape can be used to protect sampling canisters from disturbance and tampering.
5.0 Materials
5.1 Water Leak Check (standard Vapor Pin Leak Check) • Vacuum pump with rotometer to control flow to 200 milliliter per minute (ml/min); there should
also be a Swagelok filter (#SS-4-7) on the influent side of the pump to prevent concrete dust and/or dirt from getting into the pump
• Non-chlorinated (de-ionized or distilled) water • Water dam (provided in Vapor Pin kit, or a short length of polyvinyl chloride pipe) • VOC-free modeling clay (like Play-Doh) • Paper towels • Turkey baster (for removing water from the water dam)
5.2 Helium Leak Check (Some regulatory and state agencies may not accept water leak checks. MAKE SURE TO CHECK WITH AGENCY GUIDANCE BEFORE SAMPLING!) • Vacuum pump described in 5.1 • Helium canister containing high-purity 99.999 percent helium (NOT balloon grade) and regulator
for the canister • Enclosure, which may be constructed from a small bowl or container. • Helium detector (such as a Dielectric MGD-2002), which can be rented from an equipment rental
company.
5.3 Subslab Soil Vapor Purging and Sampling The subslab soil vapor sampling set up is shown on Figure 1.
• Vacuum pump described in 5.1 • Sampling manifold consisting of Swagelok gas-tight fittings with three valves and one vacuum
gauge to attach the probe to the air pump and the sample canister. See Figure 6. This manifold must be clean, free of oils, and flushed free of VOCs before use. This is accomplished by pulling three or four volumes of ambient air through the manifold and associated tubing.
• Swagelok quarter-turn plug valve (only necessary for extended sampling periods (for example, 8 or 24 hours) so that the sampling manifold can be disconnected without introducing indoor air into the probe) (part # SS-4P4T).
• Teflon tubing, 1/4-inch outer diameter (DO NOT use any other tubing material, such as nylon or polyethelyene).
• Flexible silicon tubing (3/8-inch inner diameter to connect Teflon tubing from Vapor Pin). See Figure 2.
• Tedlar bag (1-liter [L]) to collect the purged soil vapor so: (1) it is not discharged into the building; (2) the volume of purged soil vapor can be accurately measured; and (3) field screening with a PID or four-gas meter can be performed on the purged gas.
• Multi-gas meter – optional for field measurements of biodegradation parameters and health and safety monitoring.
VAPOR INTRUSION – BEST PRACTICES REV. 12/21/2015 PAGE 2 OF 15

STANDARD OPERATING PROCEDURE FOR SUBSLAB SOIL VAPOR SAMPLING FROM COX-COLVIN VAPOR PINS FIGURE 1 Subslab Soil Vapor Sampling Diagram
• Photoionization Detector for health and safety to ensure breathing zone VOC concentrations and combustible atmospheres remain below levels specified by the Health and Safety Plan. It is also to collect field measurements of total VOCs from the probe or purged soil vapor; may warn the lab if high concentrations are detected so they can dilute the sample before analysis.
• Canister, stainless steel, polished, certified clean, and evacuated. These are typically cleaned, evacuated, and provided by the laboratory.
• Flow controller or critical orifice, certified clean, and set at desired sampling rate. These are typically cleaned, set, and provided by the laboratory. Common sampling rates for subslab soil vapor sampling are provided in Table 1. TABLE 1 Common Sampling Rates for Subslab Soil Vapor Sampling
Can Size Length of Sampling Time Sampling Flow Rate (ml/min)
6 L 1 hour 90
6 L 8 hours 11.25
6 L 24 hours 3.75
1 L 5 minutes 180
1 L 1 hour 15
VAPOR INTRUSION – BEST PRACTICES REV. 12/21/2015 PAGE 3 OF 15

STANDARD OPERATING PROCEDURE FOR SUBSLAB SOIL VAPOR SAMPLING FROM COX-COLVIN VAPOR PINS TABLE 1 Common Sampling Rates for Subslab Soil Vapor Sampling
Can Size Length of Sampling Time Sampling Flow Rate (ml/min)
850 ml 5 minutes 150
850 ml 1 hour 12
Note: ml - milliliter
• Negative pressure (vacuum) gauge, oil-free and clean, to check canister vacuum. The vacuum
gauges are typically provided by the laboratory. The laboratory may either provide one vacuum gauge to be used with all of the canisters, or a vacuum gauge for each canister to be left on during sample collection. If the lab only provided one external analog vacuum gauge, don’t bother using it to measure the canister vacuums; only the digital vacuum readings are necessary. Sometimes the canisters are fitted with built-in vacuum gauges that are not removable. Gauges sent by the laboratory are for field use only, and are an approximate measure of the actual vacuum.
• Miscellaneous fittings (Swagelok nut and ferrule, part #SS-400-NFSET or equivalent) to connect tubing to canister, and sampling tee (Swagelok union tee, part #SS-400-3 or equivalent) for duplicate sample collection.
• Digital vacuum gauge with 0.25 percent accuracy at the -30 to 0 inches of mercury (inches Hg) range to accurately measure the initial and final Summa canister vacuum.
5.4 Miscellaneous • Teflon tape for use on leaky connections. Note: Never use Teflon tape on the Swagelock fittings.
They are compression fittings and the tape can actually make a leak worse. • Wrenches and screwdrivers (clean and free of contaminants) of various sizes as needed for
connecting fittings and making adjustment to the flow controller. 9/16-inch and ½-inch wrenches fit the 1/4-inch Swagelok fittings, which most canisters and flow controllers have.
• Power extension cord and ground fault current interrupter. • Shipping container suitable for protection of canister(s) during shipping. Typically, strong
cardboard boxes are used for canister shipment. The canisters should be shipped to the laboratory in the same shipping container(s) in which they were received.
6.0 Vapor Pin Sampling System Setup Procedure
6.1 For flush mount installations, first remove the secure cover or flush mount cap (whichever was installed). Remove the white cap on the Vapor Pin. Attach a new piece of flex tubing, approximately an inch long, to the barbed fitting at the top of the Vapor Pin. Then attach 1/4-inch Teflon tubing to the flex tubing. See Figure 2.
VAPOR INTRUSION – BEST PRACTICES REV. 12/21/2015 PAGE 4 OF 15

STANDARD OPERATING PROCEDURE FOR SUBSLAB SOIL VAPOR SAMPLING FROM COX-COLVIN VAPOR PINS
6.2 For flush mount installations, a water dam is not necessary because the larger 1.5-inch hole can be filled with water. For stick-up installations, place the water dam over the subslab probe by threading the Teflon tubing through the hole of the water dam. Press the water dam down so it seals on the concrete slab using VOC-free modeling clay (Figure 3). The top of the water dam should be higher than the top of the flex tubing when attached to the Vapor Pin barbed connector, so that the water level inside the dam during the leak check can be higher than the connection of the flex tubing and the ¼ -inch Teflon tubing. Fill with water. Continue with Step 6.4.
6.3 OPTIONAL - Place the helium leak-check enclosure over the subslab probe by threading the Teflon tubing through the hole of the enclosure. Slide the enclosure down so it seals on the concrete slab. Attach the other end of the sample tube to the sampling manifold with the use of a nut and ferrule set. See Figures 4 and 5.
FIGURE 2 Vapor Pin™ Tubing Set-up
FIGURE 3 Vapor Pin Water Dam Set-up for Stick-up Installations
VAPOR INTRUSION – BEST PRACTICES REV. 12/21/2015 PAGE 5 OF 15

STANDARD OPERATING PROCEDURE FOR SUBSLAB SOIL VAPOR SAMPLING FROM COX-COLVIN VAPOR PINS
6.4 Attach the other end of the sample tube to the sampling manifold with the use of a nut and ferrule
set. See Figure 6.
6.4.1 If the sample will be collected over a period of time greater than 30 minutes, a quarter-turn plug valve (Swagelok part# SS-4P4T) should be placed in-line between the Vapor Pin and the manifold above the water dam (or under the helium leak-check enclosure, if applicable). Once purging has been completed, the quarter-turn plug valve can be turned to the off position, allowing disconnection of the manifold and vacuum pump for use at another location, without the loss of purge integrity.
6.4.2 Adjust the vacuum pump to achieve the desired flow rate of 200 ml/min. This should be performed at the outlet of the vacuum pump before purging by using a suitable flow meter or calculating the amount of time required to fill a 1-L Tedlar bag.
6.5 Attach the air pump to the sampling manifold and the Tedlar bag to the air pump exhaust.
FIGURE 5 Helium leak check assembly
Sample Line
Helium In Helium Out
Leak Check Enclosure
FIGURE 4 Installing the helium leak check assembly
VAPOR INTRUSION – BEST PRACTICES REV. 12/21/2015 PAGE 6 OF 15

STANDARD OPERATING PROCEDURE FOR SUBSLAB SOIL VAPOR SAMPLING FROM COX-COLVIN VAPOR PINS
7.0 Canister Preparation
7.1 Clean sampling protocols must be followed when handling and collecting samples. This requires care in the shipping, storage, and use of sampling equipment. The cleanliness of personnel who come in contact with the sampling equipment is also important; smoking, wearing of perfumes or deodorants, and dry-cleaned clothing should be avoided. Canisters should not be transported in vehicles with gas-powered equipment or fuel cans. Sharpie-type markers should not be used for labeling or note-taking during sampling.
7.2 When unpacking the canisters, check that the canister cap is wrench tight and knob is firmly hand tight. Newer canisters with the blue knobs are prone to opening during handling if the valve is not tightly closed. Ensure that the knob is tightened shut before removing the canister cap.
7.3 The air sampling canisters are certified clean and evacuated by the laboratory to approximately 29 to 30 inches Hg vacuum. Initial canister vacuums that are less than certified by the laboratory are a potential indication of leakage that could affect the accuracy of analytical results. Care should be used at all times to prevent inadvertent loss of canister vacuum. Always keep the canister cap on and wrench-tight when not connected to the sample train. Never open the canister knob unless the intent is to collect a sample or check the canister vacuum with an attached gauge.
7.4 Verify that the canister has sufficient initial vacuum for sampling. Measure the initial canister vacuum using an external digital vacuum gauge in the manner described as follows:
FIGURE 6 Sampling Manifold
Valve 1 to Probe
In-Line Gauge
Manifold
Flow Controller Canister Valve
Canister
Valve 3 to Vacuum Pump
Valve 2 to Sample
Vacuum Pump
VAPOR INTRUSION – BEST PRACTICES REV. 12/21/2015 PAGE 7 OF 15

STANDARD OPERATING PROCEDURE FOR SUBSLAB SOIL VAPOR SAMPLING FROM COX-COLVIN VAPOR PINS 7.4.1 Remove the protective cap from the knob on the canister. Make sure the canister knob is
closed!
7.4.2 Attach the digital vacuum gauge to the canister and tighten with a wrench. Open the canister knob and measure the initial canister pressure. After taking the reading, close the canister knob and remove the gauge.
7.4.3 Do not sample using a canister without sufficient initial vacuum. Be advised that sampling data may be flagged or rejected from canisters with low initial vacuum (less than 28 inches Hg). Low initial vacuum could create a low bias in analytical results due to air leakage. While there is also a smaller risk that air leakage could introduce contaminants into the canister, the primary concern is the low bias to analytical results; this bias is within the range of analytical variability allowed with the U.S. Environmental Protection Agency (EPA) Method TO-15 (±30 percent) for initial vacuums greater than 24 inches Hg. The table presented in Paragraph 7.4.4 identifies the field team’s response based on the initial vacuum reading for a canister. In addition, this table also identifies the potential bias to results at different initial canister vacuums.
7.4.4 Use the following table to determine when to use canisters based on initial vacuum readings.
Initial Vacuum Reading
Potential Error in Analytical Results Due
to Leakage
Field Team Response
Greater than 30 to 28 inches Hg
Up to -10% error Use canister for sampling – no limitations on use.
Greater than 26 to 28 inches Hg
Up to -21% error Use canister for sampling if necessary; replace canister with a spare if spares are available.
Greater than 24 to 26 inches Hg
Up to -30% error Sampling with canister is not advisable.
Contact Project Manager/Senior VI Technical Advisor and obtain direction before sampling with this canister.
Be advised that qualifiers may be applied to analytical results sampled with canisters with vacuums less than 26 inches Hg.
Less than 24 inches Hg
Greater than -30% error
Do not use this canister for sampling. Analytical results will be rejected.
7.5 Attach the dedicated external analog vacuum gauge to the canister (if provided by the laboratory) and tighten with a wrench. (The analog pressure gauge should be installed between the canister and flow controller.) If the laboratory only provided one external analog vacuum gauge, do not bother using it to measure the canister vacuums; only the digital vacuum readings are necessary.
7.6 Attach the flow controller to the canister, via the analog vacuum gauge if one is being used. Place the canister cap on the flow controller influent point if the canister will not be attached to the sampling manifold immediately to prevent potential leakage.
8.0 Subslab Soil Vapor Sampling System Leak Checking and Purging Procedure
8.1 Physical Leak Check - Perform a leak check of the sampling manifold (Figure 6):
8.1.1 Attach the canister to the sampling manifold (Figure 6). (The connections between the sample valve [Valve #2] and the flow controller, as well as the flow controller and the canister, will be checked in the physical leak check. This step should be included to check the latter connection even if the sampling manifold will not be in-place during sample collection.) Open the sample valve (Valve #2) and make sure the valve on the canister is closed.
VAPOR INTRUSION – BEST PRACTICES REV. 12/21/2015 PAGE 8 OF 15

STANDARD OPERATING PROCEDURE FOR SUBSLAB SOIL VAPOR SAMPLING FROM COX-COLVIN VAPOR PINS 8.1.2 For sample trains without a quarter-turn plug valve placed in-line between the probe and
the manifold, make sure the probe valve (Valve #1) is closed. For sample trains with a quarter-turn plug valve, make sure the probe valve (Valve #1) is open and the quarter-turn plug valve is closed.
8.1.3 Open the purge valve (Valve #3) and start the vacuum pump.
8.1.4 Purge until a vacuum gauge reading of 10 inches Hg is achieved, or to a vacuum that will be encountered during sampling, whichever is greater. (This should happen relatively quickly.) Then close the purge valve (Valve #3) and turn off the pump.
8.1.5 Observe the vacuum gauge for 30 seconds. A leak-free system will be evident if there is no loss of vacuum within the sampling manifold system during this time.
8.1.6 Repair any leaks prior to sample collection by tightening the fittings on the manifold, flow controller, and the quarter-turn plug valve if present. Re-test to make the sure the sampling system passes the physical leak check before proceeding.
8.1.7 Record the physical leak check date and time, and results on the Subslab Soil Vapor Sampling Log.
8.1.8 Close the sample valve (Valve #2). Detach the canister (including the flow controller) if the sampling manifold will not be in place during the sample collection period. Secure the cap onto the flow controller to prevent leakage.
8.2 Vapor Pin Purge and Leak Check - A purge of the subslab soil vapor probe and sampling manifold system and a leak test (using either water or helium) of the probe is required prior to sampling every subslab probe each time sampling is performed. This leak check will verify the integrity of the probe seal. This is accomplished by doing the following:
8.2.1 Water Leak Check
8.2.1.1 For flush mount installations, fill the entire 1 ½-inch depression containing the Vapor Pin, flex tubing, and the ¼-inch Teflon tubing with non-chlorinated (deionized or distilled) water. For stick-up installations, fill the water dam with non-chlorinated (de-ionized or distilled) water. Make sure the water level inside the dam is higher than the connection of the flex tubing and the ¼-inch Teflon tubing.
8.2.1.2 To start the Vapor Pin purge, open the probe valve (Valve #1) and start the pump. The sample valve (Valve #2) should be closed. Verify that the flow rate is still 200 ml/min.
8.2.1.3 If there is shallow groundwater in the area, carefully watch the tubing as the pump is turned on. If water is observed in the sample tubing, shut the pump off immediately. Subslab soil vapor collection will not be feasible if the probe is in contact with water.
8.2.1.4 Purge for approximately 5 minutes into a 1-L Tedlar bag. At the end of the purge time, close and remove the Tedlar bag from the pump. Proceed to Step 8.2.3.
8.2.1.5 Observe the water level in either the water dam or the flush mount depression. If there is a sudden drop in the water level, the appearance of water in the sample tubing (when groundwater is not suspected), or other indications of water entering the subslab (bubbles), then the Vapor Pin failed the leak check and corrective action is required. The leak test must be performed again after corrective actions are taken until the Vapor Pin passes the leak test. Note: Water level might drop slightly due to absorption into the concrete.
VAPOR INTRUSION – BEST PRACTICES REV. 12/21/2015 PAGE 9 OF 15

STANDARD OPERATING PROCEDURE FOR SUBSLAB SOIL VAPOR SAMPLING FROM COX-COLVIN VAPOR PINS 8.2.1.5.1 There are five corrective action options (first remove the water from
the water dam or depression with a turkey baster):
8.2.1.5.1.1 Remove the Vapor Pin, clean out the drilled hole thoroughly, replace the silicone sleeve with a new one, and reinstall.
8.2.1.5.1.2 Fill in any visible concrete cracks inside the dam and drilled hole with quick-setting cement and, after allowing the cement to cure, retest.
8.2.1.5.1.3 Try fortifying the Vapor Pin seal by adding modeling clay to the base of the Vapor Pin.
8.2.1.5.1.4 Add Teflon tape to the barbed connector and the Teflon tubing, reattach the flex tubing and the Teflon tubing, make sure that all the fittings are tight and repeat the purge and leak-check procedure.
8.2.1.5.1.5 If the previous options fail, then the Vapor Pin should be abandoned.
8.2.2 OPTIONAL Helium Leak Check
8.2.2.1 Place the helium leak-check enclosure around the Vapor Pin to achieve a buildup of helium in the leak-check enclosure. The enclosure should not be so tightly sealed; there should be an exhaust for the helium so pressure does not build up in the enclosure.
8.2.2.2 Start the flow of helium to the leak-check enclosure at 200 ml/min. Let the helium fill the enclosure for approximately 30 seconds depending on the enclosure size.
8.2.2.3 To start the purge, open the probe valve (Valve #1) and start the pump. The sample valve (Valve #2) should be closed. Verify that the flow rate is still 200 ml/min.
8.2.2.4 If there is shallow groundwater in the area, carefully watch the tubing as the pump is turned on. If water is observed in the sample tubing, shut the pump off immediately. Subslab soil vapor collection will not be feasible if the probe is in contact with water.
8.2.2.5 Connect the helium detector to the enclosure exhaust to confirm that helium is present in the enclosure during purging. It is optional to measure the helium concentration within the enclosure (see Step 8.2.2.7). Make sure that the helium detector is exposed to ambient air and “zeros out” before measuring the purged soil vapor in Step 8.2.2.7.
8.2.2.6 Purge for approximately 5 minutes into a 1-L Tedlar bag. At the end of the purge time, close and remove the Tedlar bag from the pump.
8.2.2.7 At the end of the purge, remove the Tedlar bag from the pump and connect it to the helium detector. The helium concentration in the purged soil vapor must be less than 1 percent of what it was in the helium enclosure during purging to pass the leak test (10,000 parts per million by volume [ppmv] if the helium concentration was 100 percent) (verify that this limit is consistent with appropriate project-specific regulatory guidance). Calculate what 1 percent of the helium concentration was in the enclosure from the measured concentration in Step 8.2.2.6. If the Vapor Pin fails the leak check then
VAPOR INTRUSION – BEST PRACTICES REV. 12/21/2015 PAGE 10 OF 15

STANDARD OPERATING PROCEDURE FOR SUBSLAB SOIL VAPOR SAMPLING FROM COX-COLVIN VAPOR PINS corrective action is required. The leak test must be performed again after corrective actions are taken until the Vapor Pin passes the leak test.
8.2.2.7.1 There are five corrective action options:
8.2.2.7.1.1 Make sure that all the fittings are tight and/or add Teflon tape to them.
8.2.2.7.1.2 Remove the Vapor Pin, clean out the drilled hole thoroughly, replace the silicone sleeve with a new one, and reinstall.
8.2.2.7.1.3 Try fortifying the Vapor Pin seal by adding modeling clay to the base of the Vapor Pin.
8.2.2.7.1.4 Fill in any visible concrete cracks inside the dam and drilled hole with quick-setting cement and, after allowing the cement to cure, retest.
8.2.2.7.1.5 If the previous options fail, then the Vapor Pin should be abandoned.
Note: Helium leak detectors may be sensitive to high concentrations of methane or other atmospheric gasses. If these are expected to be present in the subslab soil vapor, then caution should be used with this technique, as false-positive readings may be encountered during leak testing. Use a multi-gas meter to determine whether methane is present in subslab soil vapor. The false-positive “helium” concentration should be measured in the soil vapor prior to applying helium in the enclosure so it can be compared with the helium concentration in the purged soil vapor during the leak test.
8.2.3 At the end of the purge and after the system is verified to be leak-free, close the purge valve (Valve #3) or the quarter-turn plug valve if it is being used. Do not open it again. Doing so will result in loss of the purge integrity and will require re-purging.
8.2.4 The purged subslab soil vapor in the Tedlar bag can be screened with the field meters described in Section 5.3. Note: Be sure to do this outdoors so that it does not introduce VOCs from beneath the slab to the indoor air that may pose as a health and safety risk and can also influence concurrent indoor air samples (if applicable).
8.2.5 Record the purge and leak check information on the Subslab Soil Vapor Sampling Log.
8.2.6 Proceed to the sampling phase. The probe may be left with the closed quarter-turn plug valve in place for several hours prior to sampling; however, purging/leak testing should occur on the same day as sampling.
9.0 Subslab Soil Vapor Sample Collection Procedure
9.1 The canister (with attached flow controller) should be attached to the probe via the sampling manifold or quarter-turn plug valve. The initial canister vacuum should have already been measured.
9.2 Slowly open (counter-clockwise) the canister’s knob approximately one full turn.
9.3 After sampling for the appropriate amount of time (determined from project instructions; see Table 1), close the sample valve (Valve #2) or the quarter-turn plug valve and the canister knob. If the canister has a built-in or assigned vacuum gauge, allow the canister to fill until the vacuum reaches 2 to 10 inches Hg. Remove the canister from the sampling manifold or the quarter-turn plug valve.
VAPOR INTRUSION – BEST PRACTICES REV. 12/21/2015 PAGE 11 OF 15

STANDARD OPERATING PROCEDURE FOR SUBSLAB SOIL VAPOR SAMPLING FROM COX-COLVIN VAPOR PINS 9.3.1 If sampling for extended periods of time (such as 8 or 24 hours), check the samples at some
point several hours before the expected completion time (for example, at 18 to 20 hours for a 24-hour sample) to make sure the canister is collecting at the expected rate. It may also be a good idea to check the canister several hours into the sampling period (for example, 2 or 4 hours for a 24-hour sample). The flow controllers are rarely set to the exact sampling period.
9.4 Measure the final canister pressure using the same digital vacuum gauge used to measure initial canister pressure. Open the canister knob and record the reading. Close the canister knob again and remove the digital vacuum gauge. Use this reading on the chain of custody and sample labels.
9.5 Consult with the project manager before submitting the sample to the laboratory if a final vacuum greater than -10 inches Hg, or less than -2 inches Hg are encountered. Use the following table for guidance to determine how to address final vacuum measurements:
Final Vacuum Reading Field Team Response
Less than 2 inches Hg
Contact Project Manager/Senior VI Technical Advisor before submitting sample. Notify analytical laboratory to report their laboratory-measured pressure and to get direction from the Project Manager before analyzing sample.
Greater than 2 inches Hg
and less than 10 inches Hg
Submit sample for analysis - no limitations on data use.
Greater than 10 inches Hg
Contact Project Manager/Senior VI Technical Advisor before submitting sample. Verify final vacuum with the analytical laboratory before analysis.
9.6 Canisters with no vacuum left (that is, 0 inch Hg) should not be analyzed. Contact the Project Manager/Senior VI Technical Advisor before submitting a sample with a final vacuum of 0 inches Hg to determine the appropriate course of action. One option is to verify the final vacuum with the analytical laboratory. If there is vacuum remaining in the canister according to the laboratory vacuum gauge, the Project Manager may direct the analytical laboratory to analyze the sample.
9.7 The analytical laboratory should be directed to not analyze a sample showing a final vacuum of 0 inch Hg (as measured by the laboratory), and to notify the Project Manager/Senior VI Technical Advisor and obtain further guidance regarding that sample.
9.8 Record the sampling date, times, canister identification (ID), flow controller ID, vacuum gauge ID(s), and any other observations pertinent to the sampling event on the Subslab Soil Vapor Sampling Log. Also record the weather conditions (temperature, barometric pressure, precipitation, and so forth) during sampling.
9.9 Fill out all appropriate documentation (sampling forms, sample labels, chain of custody, sample tags, and so forth).
9.10 Disassemble the sampling system.
9.11 Replace the white silicone cap on the Vapor Pin.
9.12 For permanent probes, replace the flush mount cover or secure cap and make sure it is securely in place.
9.13 Evacuate the Tedlar bags outside of the building.
VAPOR INTRUSION – BEST PRACTICES REV. 12/21/2015 PAGE 12 OF 15

STANDARD OPERATING PROCEDURE FOR SUBSLAB SOIL VAPOR SAMPLING FROM COX-COLVIN VAPOR PINS 10.0 Altitude/Temperature Correction
10.1 Air pressure decreases with elevation. Therefore, a canister evacuated at a laboratory located at sea level will show a lower vacuum measurement at a higher altitude. Generally, a 1,000-foot rise in elevation corresponds to a 1-inch Hg drop in pressure OR a 1-inch Hg decrease in measured vacuum. For example, a canister evacuated to 30 inches at sea level and used at 3,000 feet would show an initial vacuum of 27 inches Hg.
10.2 If you plan to sample at altitude, be sure to inform the laboratory ahead of time so they adjust the flow controllers accordingly.
10.3 If sampling is being conducted at higher elevations, verify the elevation difference between the analytical laboratory and field location and determine the associated decrease in measured vacuum.
10.3.1 Calculate the pressure difference between the laboratory and field location as follows: Difference from Sea Level (field) – Difference from Sea Level (laboratory). Use the Altitude Correction Table attached to this SOP.
10.3.2 Subtract the pressure difference determined in Section 10.3.1 from allowable initial vacuum levels (Section 9.4.) and final vacuum levels (Section 9.5) to determine appropriate initial and final vacuum levels.
10.4 Observed final canister vacuum changes with significant temperature change. If canister vacuums are measured in an environment when the temperature is significantly different from 20 degrees Celsius (greater than 10 degrees different), then the vacuum may appear to change on the way to the laboratory. Be sure to communicate the temperature at which the final vacuums were measured to the project chemist so appropriate corrections can be included in the data validation. Note: Temperature difference only affects final canister vacuum measurements and only if the measurements are made in that environment (that is, a canister that is a sampled at 5 degrees Celsius, then brought into a warm 20-degree-Celsius trailer for the vacuum check won’t have an issue).
11.0 Sample Handling and Shipping Procedure
11.1 Fill out all appropriate documentation (chain of custody, sample tags) and return canisters and equipment to the laboratory
11.2 The canisters should be shipped back to the laboratory in the same shipping container in which they were received. The samples should not be cooled during shipment. DO NOT put ice in the shipping container.
11.3 When packing the canisters for shipment, verify that the valve (just past finger-tight) and valve caps are snug (1/4 turn past finger-tight), and use sufficient clean packing to prevent the valves from rubbing against any hard surfaces. Never pack the canisters with other objects or materials that could cause them to be punctured or damaged. Ensure that flow controllers and gauges are separately and adequately wrapped to prevent damage.
11.4 Do not place sticky labels or tape on any surface of the canister.
11.5 Place a custody seal over the openings to the shipping container.
11.6 Make sure to insure the package for the value of the sample containers and flow controllers if corporate card policy does not cover this.
11.7 Ship canisters for overnight delivery if possible. This is not critical, but does reduce the amount of time in transit and potentially reduce the chance of slight leaks becoming significant before laboratory receipt. NOTE: If sampling on a Friday, ensure the laboratory accepts samples on Saturdays (you do not want the canisters sitting on a loading dock [or worse] for 3 days).
VAPOR INTRUSION – BEST PRACTICES REV. 12/21/2015 PAGE 13 OF 15

STANDARD OPERATING PROCEDURE FOR SUBSLAB SOIL VAPOR SAMPLING FROM COX-COLVIN VAPOR PINS 12.0 Quality Control
12.1 Laboratories supplying canisters must follow the performance criteria and quality assurance prescribed in EPA Method TO-14/15 for canister cleaning, certification of cleanliness, and leak checking. SOPs are required.
12.2 Laboratories supplying flow controllers must follow the performance criteria and quality assurance prescribed in EPA Method TO-14/15 for flow controller cleaning and adjustment. SOPs are required.
13.0 Attachments
13.1 Subslab Soil Vapor Probe Installation and Sampling Log - Canister Method
13.2 Altitude correction table
VAPOR INTRUSION – BEST PRACTICES REV. 12/21/2015 PAGE 14 OF 15

STANDARD OPERATING PROCEDURE FOR SUBSLAB SOIL VAPOR SAMPLING FROM COX-COLVIN VAPOR PINS
Altitude Correction Table
Elevation (feet)
Pressure (inches Hg)
Difference from Sea-
Level (inches Hg)
Elevation (feet)
Pressure (inches Hg)
Difference from Sea-
Level (inches Hg)
0 29.92 0 1500 28.37 1.553 50 29.87 0.053 1550 28.32 1.603
100 29.81 0.106 1600 28.27 1.653 150 29.76 0.159 1650 28.22 1.703 200 29.71 0.212 1700 28.17 1.753 250 29.66 0.265 1750 28.12 1.803 300 29.60 0.317 1800 28.07 1.853 350 29.55 0.370 1850 28.02 1.903 400 29.50 0.422 1900 27.97 1.953 450 29.45 0.474 1950 27.92 2.002 500 29.39 0.527 2000 27.87 2.052 550 29.34 0.579 2050 27.82 2.101 600 29.29 0.631 2100 27.77 2.151 650 29.24 0.683 2150 27.72 2.200 700 29.19 0.735 2200 27.67 2.249 750 29.13 0.787 2250 27.62 2.298 800 29.08 0.838 2300 27.57 2.347 850 29.03 0.890 2350 27.52 2.396 900 28.98 0.941 2400 27.47 2.445 950 28.93 0.993 2450 27.43 2.494
1000 28.88 1.044 2500 27.38 2.543 1050 28.82 1.095 2550 27.33 2.591 1100 28.77 1.147 2600 27.28 2.640 1150 28.72 1.198 2650 27.23 2.688 1200 28.67 1.249 2700 27.18 2.736 1250 28.62 1.299 2750 27.14 2.785 1300 28.57 1.350 2800 27.09 2.833 1350 28.52 1.401 2850 27.04 2.881 1400 28.47 1.452 2900 26.99 2.929 1450 28.42 1.502 2950 26.94 2.977
Note: use the following equation to calculate atmospheric for altitudes not shown on this table:
P = Po exp (-35.523 x 10⁻⁶ y), where P is the pressure at the desired elevation, Po is the atmospheric pressure at sea level, and y is the desired elevation. Source: NASA, 1996. Elevation Correction Factor for Absolute Pressure Measurements. NASA Technical Memorandum 107240.
VAPOR INTRUSION – BEST PRACTICES REV. 12/21/2015 PAGE 15 OF 15

Vapor Intrusion Best PracticesSubslab Soil Vapor Probe Installation and Sampling Log - Canister Method
Project # :Date:
Identification: Address:Slab Information:
Condition of slab
Describe material under the slab (gravel, sand, etc.)
Is water present in the soil?
Subslab Soil Vapor Probe Installation, Probe Purging, Leak Checking, & Sampling Log
Field Analysis (optional)
Probe Installation
Canister Sampling
Manifold Leak Check
Probe Purge
Weather conditions during sampling:
Observations and Comments:
* The subslab soil vapor probe passes the helium leak check if the measured helium concentration in the purged soil vapor is less than 1% of the measured helium concentration in the shroud. Do NOT collect a soil vapor sample if the probe fails the helium leak test. (multiply % by 10,000 to convert to ppm)
Final canister pressure (" Hg)
H2S (ppm)
Helium Leak Check*
Helium concentration in purged soil vapor (%)
Sample location (describe and show in diagram)
Probe and Sample Identification (field ID)
Depth of hole drilled (inches below slab surface)
Canister ID
Purge rate (mL/min)
Total VOCs measure in hole with PID (ppmv)
Sample start date and time
Leak check (sampling manifold) - Pass/No Pass
Purge completion time
Helium concentration in shroud (%)
Sampling rate or period (mL/min or hours)
Sample completion date and time
CH4 or LEL (%)
Total VOCs (ppmv)
Initial canister pressure (" Hg)
CO2 (%)
Flow controller ID
CO (ppm)
Sampler Name:
Thickness of slab (inches)
O2 (%)
Sampling vacuum (" Hg)
Pressure gauge ID (optional)
Project Info
Project Name:
Structure
Pass or Fail?
Depth of installed probe (inches below slab surface)
Date and time
Purge vacuum (" Hg)
Purge start time

Attachment 6 Standard Operating Procedure for the Collection of Soil Vapor Samples from
Temporary and Permanent Probes Using Canisters

Standard Operating Procedure for the Collection of Soil Vapor
Samples from Temporary and Permanent Probes Using
Canisters
January 2016

Standard Operating Procedure for the Collection of Soil Vapor Samples from Temporary and Permanent Probes Using Canisters
1.0 Scope and Application
This procedure offers a practical approach for the collection of soil vapor samples from temporary soil vapor probes [e.g., Geoprobe direct-push system with post-run tubing (PRT) adapters or the AMS Retract-A-Tip system], or from permanently installed soil vapor probes, into evacuated canisters (such as Summa canisters or equivalent). Soil vapor sample integrity is verified by using a real-time leak checking procedure before taking each sample. This must be done after probe installation and prior to sampling, as well as before each subsequent soil vapor sample from permanent probes. This standard operating procedure (SOP) should be used when its application is consistent with the project’s data quality objectives (DQOs) and in conjunction with the SOP for the Installation of Temporary Soil Vapor Sampling Probes or the SOP for the Installation of Permanent Soil Vapor Sampling Probes. It is the responsibility of the project team to make sure this procedure meets all applicable regulatory standards and receives approval/concurrence from the leading regulatory agency for the project. Vapor intrusion (VI) subject-matter experts (SMEs) should be consulted as needed to address technical, regulatory or field implementation issues associated with the use of this SOP. Only persons trained in the collection of soil vapor samples should attempt this procedure.
2.0 Project-Specific Considerations
2.1 Soil vapor sampling should not be performed until 48 hours after a significant rain event (defined as >1 inch of rainfall).
2.2 It is common practice to both install and remove soil vapor probes by the direct push method using equipment specifically designed for this purpose (Geoprobe or equivalent drill rig). Operation of direct-push machinery shall be performed only by trained and licensed personnel. Soil vapor probes can also be advanced with a hand tool method (e.g., the AMS Retract-A-Tip system). The hand tool installation method is only applicable to relatively shallow sampling [e.g., up to 10 to 15 feet below ground surface depending on the soil type].
2.3 Methane and carbon dioxide (CO2) can cause positive bias with a helium leak detector, if a helium leak-check procedure is used as detailed in this SOP. If methane or CO2 are expected or encountered at a site, then it may be necessary to explore different strategies to determine probe integrity.
2.4 The subsurface needs time to equilibrate after probe installation; 30 minutes for temporary probes and 24 hours for permanent probes.
2.5 Prior to attempting sampling of soil vapor probes, there should be an understanding of subsurface conditions at the site.
2.5.1 Depth to Groundwater – soil vapor samples must be collected in the vadose zone (and above the capillary fringe).
2.5.2 Soil permeability - It may not be feasible to collect soil vapor from finer-grained or tight soils with little pore volume, such as clays; if there are clay layers present in the subsurface, these intervals should be avoided. For sampling in these soils, using permanent soil vapor probes with a wider borehole is recommended. Care should be taken during purging and sampling so that the vacuum in the sampling system never exceeds 7 inches mercury (inches Hg) or approximately 100 inches water.
3.0 Materials
3.1 Teflon tubing 1/4-inch outside diameter (OD) sample tubing. Ensure there is enough tubing to use new tubing at each sample location.
3.2 Swagelok 1/4-inch nut and ferrule sets for connecting the probe tubing to the sampling manifold (part #SS-400-NFSET).

STANDARD OPERATING PROCEDURE FOR THE COLLECTION OF SOIL VAPOR SAMPLES FROM TEMPORARY AND PERMANENT PROBES USING CANISTERS
3.3 The helium leak-check equipment (or equivalent), including the enclosure, helium cylinder (high purity helium [NO BALLOON HELIUM]), and helium detector (such as a Dielectric MGD-2002 meter). The enclosure may be provided by the driller or can be constructed from polyvinyl chloride (PVC) pipe or a plastic container. The helium detector can be rented from an equipment rental company.
3.4 Multi-gas meter. (Optional if on-site atmospheric gas analysis is required).
3.5 Vacuum pump with rotometer to control flow to 200 milliliter per minute (ml/min); there should also be a Swagelok filter (#SS-4-7) on the influent side of the pump to prevent dirt from getting into the pump
3.6 Electric supply for the pump (either battery pack, generator, or power inverter with adapter for car battery).
3.7 Sampling manifold consisting of Swagelok gas-tight fittings with three valves and one vacuum gauge to attach the probe to the air pump and the sample canister. See Figure 1. This manifold must be clean, free of oils, and flushed free of VOCs before use. This is accomplished by pulling three or four volumes of ambient air through the manifold and associated tubing.
3.8 Swagelok valve (only necessary for extended sampling periods [i.e., greater than 30 minutes] so that the sampling manifold can be disconnected without introducing ambient air into the probe) (part # SS-4P4T).
3.9 Wrenches (clean and free of contaminants), various sizes as needed for connecting fittings and making adjustments to the flow controller (if field-adjustable). A 9/16-inch wrench fits the ¼-inch Swagelok fittings, which most canisters and flow controllers have.
3.10 Gas sampling bag (e.g., Tedlar bag) (1-L or 3-L) to collect the purged soil vapor, so the volume of purged soil vapor can be measured and field screening with a photoionization detector (PID) or GEM2000 meter can be performed on the purged vapor.
3.11 Multi-gas meter – optional for field measurements of biodegradation parameters and health and safety monitoring.
3.12 Canister, stainless steel, polished, certified-clean, and evacuated. These are typically cleaned, evacuated, and provided by the laboratory.
3.13 Flow controller or critical orifice, certified-clean, and set at desired sampling rate. These are typically cleaned, set, and provided by the laboratory. Soil vapor samples are typically collected in 1 or 6 liter canisters at a flow rate of 200 mL/min; however, lesser flow rates may be used in finer grainer soils.
3.14 Negative pressure (vacuum) gauge—oil-free and clean—to check canister vacuum. The vacuum gauges are typically provided by the laboratory. The laboratory may either provide one vacuum gauge to be used with all of the canisters, or a vacuum gauge for each canister to be left on during sample collection. Sometimes the canisters are fitted with built-in vacuum gauges that are not removable. Gauges sent by the laboratory are for field use only, and are an approximate measure of the actual vacuum. Regularly calibrated – and less rugged – vacuum gauges are used at the laboratory to measure vacuum before shipment and again after sample receipt.
3.15 Digital vacuum gauge with 0.25 percent accuracy at the -30 to 0 inches of mercury (inches Hg) range to accurately measure the initial and final Summa canister vacuum.
3.16 Shipping container, suitable for protection of canister(s) during shipping. Typically, strong cardboard boxes are used for canister shipment. The canisters should be shipped to the laboratory in the same shipping container(s) in which they were received.
VAPOR INTRUSION – BEST PRACTICES REV. 12/21/2015 PAGE 2 OF 12

STANDARD OPERATING PROCEDURE FOR THE COLLECTION OF SOIL VAPOR SAMPLES FROM TEMPORARY AND PERMANENT PROBES USING CANISTERS
4.0 System Set Up
4.1 Acquire all the necessary hardware and sampling equipment shown in Figure 1. Be sure to place the helium leak-check enclosure over the probe, remove the probe cap, and push the sample tubing through the hole in the enclosure cap before attaching the sampling manifold. It may be necessary to cut off the probe cap with tubing cutters if the hole in the enclosure cap is not large enough to accommodate the ferrule set. The nut and probe cap can be reused once sampling is complete. The ferrule set must be replaced. Do not connect the canister at this time.
4.2 Adjust the purge system evacuation pump sampling rate to achieve the desired flow rate of 200 milliliters per minute (ml/min) or less. Flow rate measurements should be performed at the outlet of the vacuum pump prior to purging, either by using a suitable flow meter or by determining the amount of time required to fill a 1-liter gas sampling bag.
4.3 If the sample will be collected over a period of time greater than 30 minutes a flow diversion valve (Swagelok® part# SS-4P4T) should be placed in-line between the probe and the manifold. Once purging has been completed, the flow diversion valve can be turned to the off position, allowing disconnection of the manifold and vacuum pump for use at another location, without the loss of purge integrity at the purged location.
4.4 Sampling canisters are evacuated prior to shipment by the laboratory. The vacuum will need to be verified in the field with the Digital Pressure Gauge AND the laboratory supplied vacuum gauge and properly recorded prior to use.
4.5 Attach the air pump to the sampling manifold and the Tedlar® bag to the air pump exhaust. See Figure 2. Do not attach the canister at this time.
VAPOR INTRUSION – BEST PRACTICES REV. 12/21/2015 PAGE 3 OF 12

STANDARD OPERATING PROCEDURE FOR THE COLLECTION OF SOIL VAPOR SAMPLES FROM TEMPORARY AND PERMANENT PROBES USING CANISTERS
5.0 Soil Vapor Sampling System Leak Checking and Purging Procedure
5.1 Physical Leak Check - Perform a leak check of the sample manifold system (Figure 1):
5.1.1 Make sure the vapor probe valve (valve #1) is closed and the sample valve (valve #2) is open.
5.1.2 Open the purge valve (valve #3) and start the vacuum pump. Verify that the flow is set to 200 ml/min.
5.1.3 Close the sample valve (valve #2) and achieve a vacuum gauge reading of 10 inches of mercury (inches Hg) or to a vacuum that will be encountered during sampling, whichever is greater.
5.1.4 A leak-free system will be evident by closing off the purge valve (valve #3), turning off the vacuum pump, and observing no loss of vacuum within the sampling manifold system for a period of 30 seconds. Repair any leaks prior to sample collection by tightening the fittings on the manifold. Re-test to make the sure the manifold passes the physical leak check before proceeding.
5.1.5 Record the leak check date and time on the Soil Vapor Sampling Log.
FIGURE 1 Sampling Manifold
Valve 1 to Probe
In-Line Gauge
Manifold
Flow Controller Canister Valve
Canister
Valve 3 to Vacuum Pump
Valve 2 to Sample
Vacuum Pump
VAPOR INTRUSION – BEST PRACTICES REV. 12/21/2015 PAGE 4 OF 12

STANDARD OPERATING PROCEDURE FOR THE COLLECTION OF SOIL VAPOR SAMPLES FROM TEMPORARY AND PERMANENT PROBES USING CANISTERS
5.2 System Purge and Helium Leak Check - A purge of the soil vapor probe and sampling manifold system is required before taking each sample. The helium leak-check procedure is also performed during this step. This helium leak check will verify the integrity of the sampling adapter (or PRT adapter if using the Geoprobe® system) seal as well as the probe and ground interface. This is accomplished by doing the following steps:
5.2.1 Place the helium leak-check enclosure around the soil vapor probe to achieve a buildup of helium in the leak-check enclosure. The enclosure should not be tightly sealed and there should be an exhaust for the helium so pressure doesn’t build up in the enclosure. Where the ground surface is soft, the helium leak-check enclosure is pressed down slightly into the ground surface. In situations where the ground surface is hard (for example, asphalt), apply a slight downward pressure to achieve a buildup of helium in the leak-check enclosure.
5.2.2 Start the flow of helium under the leak-check enclosure at 200 ml/min. Try to position the tube so the helium is directed at the interface between the probe and the ground. Let the helium fill the enclosure for a couple of minutes.
5.2.3 Turn the helium leak detector on while in outdoor air and ensure that the detector is not reading any helium before proceeding. Verify that the helium concentration inside the leak-check enclosure is >10 percent by placing the probe of the helium detector into the hole where the sample tubing comes out or under the enclosure wall. It is not necessary to verify that the helium concentration is 100%, as this may damage the detector.
5.2.4 Purging is carried out by pulling soil vapor through the system at a rate of 200 ml/min for a time period sufficient to achieve a purge volume that equals 3 to 5 dead volumes (internal volume) of the in-ground annular space, sample line, and sampling manifold system. When calculating the dead volume, be sure to take into account the inside diameter and length of the Teflon sample tubing, as well as the probe outside diameter and retraction distance for the annular space of temporary probes. For permanent probes, calculate the volume of the annular space using a nominal 30 percent porosity for the sand or glass bead pack. If, during the purge (or sampling), the vacuum exceeds 7 inches Hg, then reduce the pump flow rate. The system vacuum must stay below this level at all times to minimize the risk of inducing leaks or altering conditions in the subsurface.
5.2.5 Open the sample valve (valve #2) and the purge valve (valve #3) and start the purge pump. Verify that the flow rate is still 200 ml/min.
5.2.6 To start the soil vapor probe purge, simultaneously open the vapor probe valve (valve #1) and close the sample valve (valve #2), and start timing.
5.2.7 If there is shallow groundwater in the area, carefully watch the tubing as the pump is turned on. If water is observed in the sample tubing, shut the pump off immediately. Soil vapor collection will not be feasible if the probe is in contact with water.
5.2.8 Connect the helium detector to the enclosure exhaust to confirm that helium is present in the enclosure during purging. It is optional to measure the helium concentration within the enclosure (see Step 5.2.12). Make sure that the helium detector is exposed to ambient air and “zeros out” before measuring the purged soil vapor in Step 5.2.12.
5.2.9 During the last 5 minutes of the purge (or the entire purge time if less than 5 minutes), attach a gas sampling bag to the purge pump exhaust and open the bag’s valve. This bag/sample will be used for analysis of helium using the leak detector.
5.2.10 If the vacuum gauge reads >7 inches Hg during the purge, then close the purge valve (valve #3) and monitor the vacuum in the manifold and probe. If there is no noticeable change in vacuum after a minute, then there is an insufficient amount of soil vapor to
VAPOR INTRUSION – BEST PRACTICES REV. 12/21/2015 PAGE 5 OF 12

STANDARD OPERATING PROCEDURE FOR THE COLLECTION OF SOIL VAPOR SAMPLES FROM TEMPORARY AND PERMANENT PROBES USING CANISTERS
collect a sample and the vacuum is too great to collect a soil vapor sample. Several factors can cause this situation. Consult with the project manager and take corrective action.
5.2.10.1 The soil formation is too “tight” (i.e., high clay or moisture content). Try using a lower flow rate. (temporary or permanent probe)
5.2.10.2 The soil formation is too tight. Try a different depth or location. (temporary probe)
5.2.10.3 With a temporary probe system, the expendable tip may not have released when the drive rod was retracted. Try retracting the probe a little further, or use a long, thin rod to poke the tip loose.
5.2.10.4 If water is visible in the flexible soil vapor tubing, stop the purging immediately. It is not possible to take a soil vapor sample at that depth or location.
5.2.11 At the end of the calculated purge time and after the system is verified to be leak free, close the purge valve (valve #3), close the valve to the gas sampling bag, and turn off the pump. Do not open the purge valve again. Doing so will result in loss of the purge integrity and will require re-purging.
5.2.12 Attach the gas sampling bag to the helium detector using a piece of flexible silicone or rubber tubing and open the valve. The helium concentration in the purged soil vapor must be less than 1 percent of what it was in the helium enclosure during purging to pass the leak test (10,000 parts per million by volume [ppmv] if the helium concentration was 100 percent) (verify that this limit is consistent with appropriate project-specific regulatory guidance). Calculate what 1 percent of the helium concentration was in the enclosure from the measured concentration in Step 7.2.6. If the probe fails the leak check then corrective action is required. This includes first checking the fittings and connections and trying another purge and leak check. It may also be necessary to remove the soil vapor probe and re-install it in a nearby location.
Note: Helium leak detectors may be sensitive to high concentrations of methane or other atmospheric gasses. If these are expected to be present in the subslab soil vapor, then caution should be used with this technique, as false-positive readings may be encountered during leak testing. Use a multi-gas meter to determine whether methane is present in subslab soil vapor. The false-positive “helium” concentration should be measured in the soil vapor prior to applying helium in the enclosure so it can be compared with the helium concentration in the purged soil vapor during the leak test.
5.2.13 At the end of the purge and after the system is verified to be leak-free, close the purge valve (valve #3). Do not open it again. Doing so will result in loss of the purge integrity and will require re-purging. Turn off the helium leak detector.
5.2.14 The purged soil vapor in the Tedlar bag can be screened with the field meters.
5.2.15 Record the purge and leak check information on the Soil Vapor Sampling Log.
6.0 Sample Collection
6.1 Clean sampling protocols must be followed when handling and collecting samples. This requires care in the shipping, storage, and use of sampling equipment. Cleanliness of personnel who come in contact with the sampling equipment is also important: for example, no smoking, eating, or drinking; no perfumes or deodorants; and no dry-cleaned clothing. Canisters should not be transported in vehicles with gas-powered equipment or fuel cans. Sharpie-type markers should not be used for labeling or note-taking during sampling.
VAPOR INTRUSION – BEST PRACTICES REV. 12/21/2015 PAGE 6 OF 12

STANDARD OPERATING PROCEDURE FOR THE COLLECTION OF SOIL VAPOR SAMPLES FROM TEMPORARY AND PERMANENT PROBES USING CANISTERS
6.2 The air sampling canisters are certified clean and evacuated by the laboratory to approximately 29 to 30 inches Hg vacuum. Initial canister vacuums that are less than certified by the laboratory are a potential indication of leakage that could affect the accuracy of analytical results. Care should be used at all times to prevent inadvertent loss of canister vacuum. Never open the canister’s valve unless the intent is to collect a sample or check the canister vacuum with an attached gauge.
6.3 Verify that the canister has sufficient initial vacuum for sampling. Measure the initial canister vacuum using an external vacuum gauge as described below:
6.3.1 Remove the protective cap from the valve on the canister. Make sure the canister knob is closed!
6.3.2 Measure the initial canister pressure using a digital vacuum gauge. Open the canister knob and record the reading. Close the canister knob and remove the digital vacuum gauge.
6.3.3 If using assigned analog vacuum gauges (one for each canister), attach the vacuum gauge to the canister, and then attach the flow controller.
6.3.4 Do not sample using a canister without sufficient initial vacuum. Be advised that sampling data may be flagged or rejected from canisters with low initial vacuum (less than 28 inches Hg). Low initial vacuum could create a low bias in analytical results due to air leakage. While there is also a smaller risk that air leakage could introduce contaminants into the canister, the primary concern is the low bias to analytical results; this bias is within the range of analytical variability allowed with the EPA Method TO-15 (±30 percent) for initial vacuums >24 inches Hg. The table presented in Paragraph 6.3.5 identifies the field team’s response based on the initial vacuum reading for a canister. In addition, this table also identifies the potential bias to results at different initial canister vacuums.
6.3.5 Use the following table to determine when to use canisters based on initial vacuum readings.
Initial Vacuum Reading
Potential Error in Analytical Results
Due to Leakage Field Team Response >30 to 28 inches
Hg Up to -10% error Use canister for sampling – no limitations on use.
>26 to 28 inches Hg
Up to -21% error Use canister for sampling if necessary; replace canister with a spare if spares are available.
>24 to 26 inches Hg
Up to -30% error Sampling with canister is not advisable.
Contact project manager and obtain direction before sampling with this canister.
Be advised that qualifiers may be applied to analytical results sampled with canisters with vacuums less than 26 inches Hg.
<24 inches Hg >-30% error Do not use this canister for sampling. Analytical results will be rejected.
6.4 Attach the canister to the flow controller and then connect the flow controller to the sample valve
(valve #2) on the sampling manifold. Open the sample valve (valve #2).
6.5 Before collecting the sample, confirm that the sampling system valves are set as follows: (1) the purge valve (valve #3) is confirmed to be closed; (2) the vapor probe valve (valve #1) is open; and (3) the sample valve (valve #2) is open.
VAPOR INTRUSION – BEST PRACTICES REV. 12/21/2015 PAGE 7 OF 12

STANDARD OPERATING PROCEDURE FOR THE COLLECTION OF SOIL VAPOR SAMPLES FROM TEMPORARY AND PERMANENT PROBES USING CANISTERS
6.6 Slowly open (counter-clockwise) the canister’s knob approximately one full turn.
6.7 Each sampling canister that is left unattended should be clearly marked with a sign that includes contact information for a point of contact.
6.8 After sampling for the appropriate amount of time (determined from project instructions), close the sample valve (valve #2) and the canister’s knob. If the canister has a built-in or assigned vacuum gauge, allow the canister to fill until the vacuum reaches 2 to 10 inches Hg for 6-liter canisters and 2 to 5 inches Hg for 1-liter canisters and record the final pressure. Remove the canister from the sampling manifold.
6.9 Measure the final canister pressure using the same digital vacuum gauge used to measure initial canister pressure. Open the canister knob and record the reading. Close the canister knob and remove the digital vacuum gauge.
6.10 If using a single laboratory provided external vacuum gauge, re-attach it, open the canister knob, and record the final vacuum. Close the valve, remove the gauge, and replace and tighten the cap on the canister. Ideal final vacuum in the canister is between 2 and 10 inches Hg. More than 10 inches Hg of vacuum can greatly increase reporting limits; however, a small amount of vacuum should be left in the canister so the laboratory can confirm that the canister was not opened during shipment.
6.11 Consult with the project manager and the project specific VI senior technical consultant (STC) before submitting the sample to the laboratory if a final vacuum greater than 10 inches Hg, or less than 2 inches Hg are encountered. Use the following table for guidance to determine how to address final vacuum measurements:
Final Vacuum Reading Field Team Response
< 2 inches Hg
Contact Project Manager and project VI STC before submitting sample. Notify analytical laboratory to report their laboratory-measured pressure and to get direction from the Project Manager before analyzing sample.
> 2 inches Hg and <10
inches Hg Submit sample for analysis - no limitations on data use
>10 inches Hg
Contact Project Manager and project VI STC before submitting sample. Verify final vacuum with the analytical laboratory before analysis.
6.12 Canisters with no vacuum left (i.e., 0 inches Hg) should not be analyzed. Contact the Project Manager and project VI STC before submitting a sample with a final vacuum of 0 inches Hg to determine the appropriate course of action. One option is to verify the final vacuum with the analytical laboratory. If there is vacuum remaining in the canister according to the laboratory vacuum gauge, the Project Manager and/or project VI STC may direct the analytical laboratory to analyze the sample.
6.13 The analytical laboratory should be directed to not analyze a sample showing a final vacuum of 0 inches Hg (as measured by the laboratory), and to notify the Project Manager and obtain further guidance regarding that sample.
6.14 Record the sampling date, times, canister identification (ID), flow controller ID, vacuum gauge ID(s), and any other observations pertinent to the sampling event on the Soil Vapor Sampling Log. Also
VAPOR INTRUSION – BEST PRACTICES REV. 12/21/2015 PAGE 8 OF 12

STANDARD OPERATING PROCEDURE FOR THE COLLECTION OF SOIL VAPOR SAMPLES FROM TEMPORARY AND PERMANENT PROBES USING CANISTERS
record the weather conditions (temperature, barometric pressure, precipitation, etc.) during sampling.
6.15 Fill out all appropriate documentation (sampling forms, sample labels, chains of custody, sample tags, etc.).
6.16 Disassemble the sampling system.
6.17 For permanent probes, replace the probe cap and make sure it is securely in place. For temporary probes, remove the probe and abandon the bore hole.
7.0 Altitude Correction
7.1 Air pressure decreases with elevation. Therefore, a canister evacuated at a laboratory located at sea level will show a lower vacuum measurement at a higher altitude. Generally, a 1,000-foot rise in elevation corresponds to a 1 inch Hg drop in pressure OR a 1 inch Hg decrease in measured vacuum. For example, a canister evacuated to 30 inches at sea level and used at 3,000 feet would show an initial vacuum of 27 inches Hg.
7.2 If you plan to sample at altitude, be sure to inform the laboratory ahead of time so they adjust the flow controllers accordingly.
7.3 If sampling is being conducted at higher elevations, verify the elevation difference between the analytical laboratory and field location and determine the associated decrease in measured vacuum.
7.3.1 Calculate the pressure difference between the laboratory and field location as follows: Difference from Sea Level (field) – Difference from Sea Level (laboratory). Use the Altitude Correction Table attached to this SOP.
7.3.2 Subtract the pressure difference determined in Section 7.3.1 from allowable initial vacuum levels (Section 6.3.5) and final vacuum levels (Section 6.11) to determine appropriate initial and final vacuum levels.
8.0 Sample Handling and Shipping Procedure
8.1 Fill out all appropriate documentation (chain of custody, sample tags) and return canisters and equipment to the laboratory
8.2 The canisters should be shipped back to the laboratory in the same shipping container in which they were received. The samples should not be cooled during shipment. DO NOT put ice in the shipping container.
8.3 When packing the canisters for shipment, verify that the valve (just past finger-tight) and valve caps are snug (1/4 turn past finger tight), and use sufficient clean packing to prevent the valves from rubbing against any hard surfaces. Never pack the canisters with other objects or materials that could cause them to be punctured or damaged. Ensure that flow controllers and gauges are separately and adequately wrapped to prevent damage.
8.4 Do not place sticky labels or tape on any surface of the canister.
8.5 Place a custody seal over the openings to the shipping container.
8.6 Make sure to insure the package for the value of the sample containers and flow controllers if corporate card policy does not cover this.
VAPOR INTRUSION – BEST PRACTICES REV. 12/21/2015 PAGE 9 OF 12

STANDARD OPERATING PROCEDURE FOR THE COLLECTION OF SOIL VAPOR SAMPLES FROM TEMPORARY AND PERMANENT PROBES USING CANISTERS
8.7 Ship canisters for overnight delivery. NOTE: If sampling on a Friday, ensure the laboratory accepts samples on Saturdays (you do not want the canisters sitting on some loading dock (or worse) for 3 days).
9.0 Quality Control
9.1 Laboratories supplying canisters must follow the performance criteria and quality assurance prescribed in U.S. Environmental Protection Agency (EPA) Method TO-14/15 for canister cleaning, certification of cleanliness, and leak checking. SOPs are required.
9.2 Laboratories supplying flow controllers must follow the performance criteria and quality assurance prescribed in EPA Method TO-14/15 for flow controller cleaning and adjustment. SOPs are required.
10.0 Attachments
10.1 Exterior Soil Vapor Probe Installation and Sampling Log - Canister Method
10.2 Altitude correction table
VAPOR INTRUSION – BEST PRACTICES REV. 12/21/2015 PAGE 10 OF 12

STANDARD OPERATING PROCEDURE FOR THE COLLECTION OF SOIL VAPOR SAMPLES FROM TEMPORARY AND PERMANENT PROBES USING CANISTERS
Figure 2 Soil Vapor Sampling System
VAPOR INTRUSION – BEST PRACTICES REV. 12/21/2015 PAGE 11 OF 12

STANDARD OPERATING PROCEDURE FOR THE COLLECTION OF SOIL VAPOR SAMPLES FROM TEMPORARY AND PERMANENT PROBES USING CANISTERS
Altitude Correction Table
Elevation (ft)
Pressure (in Hg)
Difference from Sea-
Level (in Hg) Elevation
(ft) Pressure (in Hg)
Difference from Sea-
Level (in Hg)
0 29.92 0 1500 28.37 1.553 50 29.87 0.053 1550 28.32 1.603
100 29.81 0.106 1600 28.27 1.653 150 29.76 0.159 1650 28.22 1.703 200 29.71 0.212 1700 28.17 1.753 250 29.66 0.265 1750 28.12 1.803 300 29.60 0.317 1800 28.07 1.853 350 29.55 0.370 1850 28.02 1.903 400 29.50 0.422 1900 27.97 1.953 450 29.45 0.474 1950 27.92 2.002 500 29.39 0.527 2000 27.87 2.052 550 29.34 0.579 2050 27.82 2.101 600 29.29 0.631 2100 27.77 2.151 650 29.24 0.683 2150 27.72 2.200 700 29.19 0.735 2200 27.67 2.249 750 29.13 0.787 2250 27.62 2.298 800 29.08 0.838 2300 27.57 2.347 850 29.03 0.890 2350 27.52 2.396 900 28.98 0.941 2400 27.47 2.445 950 28.93 0.993 2450 27.43 2.494
1000 28.88 1.044 2500 27.38 2.543 1050 28.82 1.095 2550 27.33 2.591 1100 28.77 1.147 2600 27.28 2.640 1150 28.72 1.198 2650 27.23 2.688 1200 28.67 1.249 2700 27.18 2.736 1250 28.62 1.299 2750 27.14 2.785 1300 28.57 1.350 2800 27.09 2.833 1350 28.52 1.401 2850 27.04 2.881 1400 28.47 1.452 2900 26.99 2.929 1450 28.42 1.502 2950 26.94 2.977
Note: use the following equation to calculate atmospheric for altitudes not shown on this table:
P = Po exp (-35.523 x 10⁻⁶ y), where P is the pressure at the desired elevation, Po is the atmospheric pressure at sea level, and y is the desired elevation. Source: NASA, 1996. Elevation Correction Factor for Absolute Pressure Measurements. NASA Technical Memorandum 107240.
VAPOR INTRUSION – BEST PRACTICES REV. 12/21/2015 PAGE 12 OF 12

Sheet ___ of ___
Vapor Intrusion Best PracticesExterior Soil Vapor Probe Installation and Sampling Log - Canister Method
Project # :Date:
Identification: Address:Site Information:
Describe ground cover
Depth to groundwater (feet below ground surface)
Describe vadose zone soil type(s)
Was a soil boring log completed? Was a probe diagram completed?
Soil Vapor Probe Installation, Purging, Leak Checking, & Sampling Log
Field Analysis (optional)
Probe Installation
Canister Sampling
Manifold Leak Check
Probe Purge
Weather conditions during sampling:
Observations and Comments:
Final canister pressure (" Hg)
Pass or Fail?
Sample completion date and time
Sample start date and time
Date and time CO (ppm)
H2S (ppm)
Flow controller ID
Pressure gauge ID (optional)
Purge rate (mL/min)
Leak check (sampling manifold) - Pass/No Pass
Canister ID
Sampling rate or period (mL/min or hours)
Dead volume - including screen, sand pack, and tubing (mL)
CH4 or LEL (%)
CO2 (%)
Total VOCs (ppmv)
Project Info
Project Name:
Site
O2 (%)Sample location (describe and show in diagram)
Sampler Name:
Depth of hole drilled (feet below ground surface)
Width of probe screen (inches)
Probe and Sample Identification (field ID)
Bottom of probe screen (feet below ground surface)
Length of probe screen (inches)
Purge completion time
Initial canister pressure (" Hg)Helium concentration in shroud (%)
Purge start time
Purge vacuum (" Hg)
Helium Leak Check* Helium concentration in purged soil
vapor (%)
* The soil vapor probe passes the helium leak check if the measured helium concentration in the purged soil vapor is less than 1% of the measured helium concentration in the shroud. Do NOT collect a soil vapor sample if the probe fails the helium leak test. (multiply % by 10,000 to convert to ppm)
Sampling vacuum (" Hg)