Embed Size (px)
Citation preview

Technical Support Document for the 2004 Effluent Guidelines Program Plan
EPA-821-R-04-014
Mike Leavitt Administrator
Ben Grumbles Assistant Administrator, Office of Water
Geoffrey H. Grubbs Director, Office of Science and Technology
Mary Smith Director, Engineering and Analysis Division
Tom Wall Chief, Chemical Engineering Branch
Jan Goodwin Technical Coordinator
Carey Johnston Jan Matuszko
Project Managers
U.S. Environmental Protection AgencyOffice of Water (4303T)
Engineering and Analysis DivisionOffice of Science and Technology
Washington, DC 20460 August 2004

7.1
Section 7 - Petroleum Refining
SECTION 7 PETROLEUM REFINING
Introduction
The petroleum refining industry corresponds to Standard Industrial Classification (SIC) code 2911 - Petroleum Refining, defined as establishments engaged in producing gasoline, kerosene, distillate fuel oils, residual fuel oils, and lubricants, through fractionation or straight distillation of crude oil, redistillation of unfinished petroleum derivatives, cracking, or other processes. EPA is also considering including operations in SIC code 5171 - Petroleum Bulk Stations and Terminals as a new subcategory in the Petroleum Refining Point Source Category.
EPA selected the Petroleum Refining category for further review because it ranked fourth highest among all point source categories for toxic and nonconventional pollutant discharges for 2000 in the screening-level analysis (see the December 31, 2003 Notice of the Preliminary Effluent Guidelines Program Plan, FRN [FRL-7604-7]). The effluent guidelines, limitations, and standards (ELGs) for the Petroleum Refining category are codified at 40 CFR Part 419 (last revised in 1982). In the screening-level analysis, EPA found that the toxic and nonconventional pollutant loadings are driven by three groups of pollutants: polycyclic aromatic compounds (PACs), polychlorinated dibenzo-para (p)- dioxins and polychlorinated dibenzofurans (referred to as “dioxins” in this report), and metals (specifically vanadium, mercury, and selenium). EPA analyzed the reported discharges and specific process sources discharging these pollutants.
For the detailed review of the Petroleum Refining category, EPA verified Toxic Release Inventory (TRI) and Permit Compliance System (PCS) data, analyzed additional industry data, reviewed current regulations affecting this industrial category, and identified pollution prevention and treatment technologies for wastewater discharges.
EPA also analyzed data from petroleum bulk stations and terminals (PBSTs) to determine if a new subcategory of the Petroleum Refining category should be identified and further studied. Currently, states determine whether process discharges from PBST operations are regulated. Section 7.12 discusses EPA’s findings on this investigation.
This section discusses EPA’s analysis of the Petroleum Refining category and conclusions in the following order:
C Section 7.2 discusses data sources used, EPA’s verification of the data, and the data source limitations;
C Section 7.3 discusses the petroleum refining industry profile and discharge status;
C Section 7.4 discusses the current petroleum refining ELGs (40 CFR Part 419) and other major regulations affecting petroleum refineries;
7-1

Section 7 - Petroleum Refining
C Section 7.5 discusses wastewater sources, pollutant loadings, and current treatment in place at refineries;
C Section 7.6 discusses EPA’s analysis and findings for PACs discharges from petroleum refineries;
C Section 7.7 discusses EPA’s analysis and findings for dioxin discharges from petroleum refineries;
C Section 7.8 discusses EPA’s analysis and findings for metals discharges from petroleum refineries;
C Section 7.9 discusses EPA’s analysis and findings for other nonconventional and conventional pollutant discharges from petroleum refineries;
C Section 7.10 discusses control of wastewater discharges from petroleum refineries, including pollution prevention and wastewater treatment technologies;
C Section 7.11 lists references for the petroleum refining detailed study; and
C Section 7.12 discusses EPA’s findings on PBSTs.
7.2 Data Sources
This section describes the data sources used for the petroleum refining industry detailed study, as well as data quality limitations and data verification activities performed. Sections 4.2.1, 4.2.2, and 4.1.3 of this document describes TRI, PCS, and U.S. Economic Census data sources, respectively. This section discusses data sources as they pertain specifically to the petroleum refining industry detailed review.
7.2.1 Toxic Release Inventory (TRI)
All petroleum refineries that meet the employee criteria (i.e., 10 or more employees) and the chemical threshold(s) must submit reports to EPA’s TRI program. Of the 163 petroleum refineries operating in the U.S. in 2000, 154 (94 percent) reported to TRI in 2000. EPA used 2000 TRI data, as reported, to estimate pollutant loadings, determine if stormwater discharges were an industry issue, and identify treatment in place.
To estimate pollutant loadings and toxic-weighted pound equivalents (TWPEs), EPA developed the TRIReleases2000 database (35); this database includes all data as reported to TRI in 2000. The pollutant loadings estimated by TRIReleases2000 uses pollutant releases and transfers to publicly-owned treatment works (POTWs), taking POTW removals into account.
7-2

Section 7 - Petroleum Refining
Section 4.2.1 discusses the TRIReleases2000 database in further detail. Section 4.2.4 discusses TWPE calculations.
For the petroleum refining industry detailed review, EPA verified data as reported to TRI in 2000, particularly for those facilities and pollutants with high TWPEs. For example, refineries may estimate TRI-reported releases in a number of ways: monitoring data, emissions factors, mass balances, and other engineering calculations. If a chemical is not detected in the effluent, refineries may estimate the discharge by using one-half of the detection limit. By using one-half the detection limit, refineries may overestimate the amount of chemical discharged, which particularly affected PACs and dioxin discharges reported for petroleum refineries.
The list of chemicals reportable to TRI includes individual chemicals and chemical categories (i.e., group of similar chemicals). The TRI chemical categories commonly reported by petroleum refineries include the PACs category (21 individual chemicals; see Section 7.6 for more detail), dioxins and dioxin-like chemicals category (17 individual chemicals; see Section 7.7 for more detail), and metal compound categories (e.g., mercury compounds, vanadium compounds).
Refineries are required to report the combined mass of PACs and dioxins released. To calculate the TWPE of PACs as reported to TRI in 2000, EPA calculated a toxicity weighting factor (TWF) specific to the petroleum refining industry (see Section 7.6.2).
For dioxins, refineries are given the opportunity to report a refinery-specific congener distribution. To calculate the TWPE of dioxins as reported to TRI in 2000, EPA calculated a TWF specific to a petroleum refinery based on the reported congener distribution (see Section 7.2). Note that the dioxin congener distribution for a refinery may not accurately reflect the distribution across all media. See also Section 4.2.4.2 for a more detailed discussion on dioxins and the calculation of TWPE for dioxin discharges.
Refineries report only the elemental metal portion of discharges for metal compounds (e.g., a refinery reports only the pounds discharged of vanadium for all vanadium compounds). Therefore, EPA used the metal TWFs to calculate the TWPE.
To verify the data reported to TRI, EPA performed the following activities:
C Verified that facilities reporting as SIC code 2911 were petroleum refineries and linked each refinery’s data with data from the PCS and the Energy Information Administration (EIA), discussed in Section 7.2.1.1;
C Verified data reported to TRI for two refineries, discussed in Section 7.2.1.2;
C Met with representatives of a refinery and industry trade associations to discuss pollutant loadings estimated using TRI and PCS data, discussed in Section 7.2.1.3; and
7-3

Section 7 - Petroleum Refining
C Reviewed comments submitted in response to the December 31, 2003 Notice of the Preliminary Effluent Guidelines Program Plan, FRN [FRL-7604-7], discussed in Section 7.2.1.4.
7.2.1.1 Identification of Petroleum Refineries Operating in 2000
EPA linked refineries reporting to TRI and PCS with EIA’s list of refineries operating in 2000. See Section 7.2.4 for a brief description of EIA’s Refinery Capacity Data (21), used in this review. For refineries not included in EIA’s list, EPA investigated whether the facilities were actually petroleum refineries. EPA found that eight facilities that reported to TRI, nine facilities that reported to PCS, and one that reported to both, were not operating refineries. A number of these facilities were closed in or prior to year 2000. Others turned out to be chemical manufacturers, PBSTs, or other nonrefinery operations. Table 7-1 lists these facilities and the rationale for excluding each facility from the list of existing petroleum refineries in this detailed review. The 18 facilities listed in Table 7-1 were excluded from the petroleum refining industry detailed review and reclassified in TRIReleases2000.
7.2.1.2 Refinery-Specific Verification of TRI Data
EPA contacted the Lyondell-Citgo refinery in Houston, TX to verify the data as reported to TRI in 2000. Lyondell-Citgo representatives confirmed that the refinery discharged 2,380 pounds of PACs to a POTW in 2000. In addition, the refinery submitted the individual PAC concentrations in the refinery effluent (untreated wastewater and stormwater) (15). The refinery discharges the wastewater to the Gulf Coast Waste Disposal Authority’s Washburn Tunnel Facility for biological treatment. EPA also received effluent data from the Washburn Tunnel Facility’s 2003 Peak Performance Award Application (9).
The Marathon Ashland Petroleum LLC refinery in Detroit, MI submitted a request-for-withdrawal form to EPA to correct the reported releases of dioxins in 2000. The refinery incorrectly reported 8.0613 grams of dioxins discharged to a POTW. The request-for-withdrawal stated that the refinery discharged zero grams of dioxins in 2000. EPA updated the TRIReleases2000 database to reflect this reporting change.
7-4

Section 7 - Petroleum Refining
Table 7-1. Facilities Reporting to TRI and PCS Under SIC Code 2911 that are Not Operating Refineries
7-5
Facility Name Facility Location Database Rationale for Exclusion as Refinery
Buckeye Refining Co. L.L.C. Indianola, PA TRI Facility is a petroleum bulk terminal.
Pennzoil-Quaker State Co. Rouseville Refinery & Rouseville, PA TRI Facility should be classified as SIC code 2999 and was shut down Packaging in January 2000.
Calumet Lubricants Co. Rouseville Plant Rouseville, PA TRI Facility should be classified as SIC code 2999 and was shut down in 2001.
International Petroleum Corp. Plant City, FL TRI Facility is a waste oil recycling plant.
Merichem Chemicals & Refinery Services L.L.C. Tuscaloosa, AL TRI Facility is a chemical processing plant.
Two Wastewater Treatment Unit Oregon, OH TRI Facility is a wastewater treatment facility for Sunoco Inc. (R&M): NPDES Permit Number 43616SNRFN1819W.
Golden West Refining Co. Santa Fe Springs, CA
TRI Facility ceased operations in 1992.
Chevron Products Co. Richmond Beach Asphalt Refinery
Seattle, WA TRI Facility is an asphalt plant.
Total Petroleum Inc. Arkansas City, KS PCS Facility was closed in 1996.
Penreco Karns City, PA PCS Facility is a petrochemical manufacturing facility.
American Western Refining Lawrenceville, IL PCS Facility was closed in 1995.
Longview Refining Assoc. Inc. Longview, TX PCS Facility is closed and is a Superfund site.
Gulf Chemical Corporation Penuelas, PR PCS Facility is a chemical processing plant.
Commonwealth Oil Petrochemical Penuelas, PR PCS Facility is not an active refinery; currently a petroleum bulk terminal.
Cenco Refining Company Santa Fe Springs, CA
PCS Facility was shut down.
The Carbide/Graphite Group Inc. Seadrift, TX PCS Facility manufactures calcium and graphite.
Berry Petroleum Co. - Stephens Stephens, AR PCS Facility was shut down in February 2000 and last operated in July 1999.
Neches River Treatment Corporation Lower Neches Valley
Beaumont, TX TRI, PCS Facility is a centralized waste treatment facility.

Section 7 - Petroleum Refining
7.2.1.3 Meetings with Representatives from Refinery and Trade Associations
EPA met with representatives of the American Petroleum Institute (API) and National Petrochemical and Refiners Association (NPRA) on February 11, 2004. Prior to the meeting, API and NPRA sent a list of questions concerning the petroleum refining detailed review to EPA. These questions and topics discussed during the meeting included the detailed review work plan (Section 3.06, DCN 00701, EPA Docket OW-2003-0074), factors considered for the review, use of the 1996 Preliminary Data Summary, dioxin TWFs, pollutant loading estimates, and the review of PBSTs. See the memorandum entitled Meeting Between EPA and Representatives of American Petroleum Institute and National Petrochemical and Refiners Association (5).
EPA met with representatives of Lyondell-Citgo Refining, LP on March 12, 2004 to discuss the operation and wastewater discharges of their Houston, TX refinery. Representatives from the refinery presented an overview of the refinery and its wastewater discharges. The refinery discharges to the Washburn Tunnel facility, a POTW operated by the Gulf Coast Waste Disposal Authority. The Lyondell-Citgo refinery and one other refinery contribute about 50 percent of the wastewater flow to the Washburn Tunnel. Gulf Coast Waste Disposal Authority has never detected PACs in the effluent from the Washburn Tunnel facility. EPA explained how the TRIReleases2000 database estimates the refinery’s pollutant discharge of PACs by assuming the POTW (Washburn Tunnel) removes 92 percent of mass as reported to TRI. See the memorandum entitled Meeting Between EPA and Representatives of Lyondell-Citgo Refining, LP (6).
7.2.1.4 Comments Received in Response to the Federal Register Notice of the 2004/2005 Preliminary Effluent Guidelines Program Plan
EPA received comments specific to petroleum refining from NPRA, API, and the County Sanitation Districts of Los Angeles County. The comments are summarized below.
NPRA submitted comments regarding EPA’s use of data as reported to TRI for screening purposes. NPRA stated that an investigation of TRI reporting basis should be performed before using the values in a screening assessment. NPRA submitted refinery-specific comments on TRI data that EPA used to estimate TWPE for PACs and dioxins. Based on EPA’s TRI Reporting Forms and Instructions, refineries may estimate releases of nondetected pollutants using one-half the detection limit to avoid under-reporting. See Sections 7.6.5 and 7.7.4.4 for specific industry comments on PACs and dioxins.
API submitted comments regarding EPA’s use of TRI data for screening purposes and provided information on how its member refineries estimated the discharges of PACs and dioxins for TRI. Most refineries do not detect PACs and dioxins in the effluent, but use the detection limit (or other methods) to estimate the mass of pollutant releases to wastewaters. See Sections 7.6.5 and 7.7.4.4 for specific comments on PACs and dioxins. API agreed with EPA that using the benzo(a)pyrene TWF for TWPE calculations (used for the screening-level analysis) is a worst-case scenario. In its comments, API used EPA’s revised TWF (based on
7-6

Section 7 - Petroleum Refining
distribution of PACs in refinery products) to recalculate PAC loadings. API also submitted effluent data from 10 refineries performing activated sludge treatment that were collected during 1993-1994 in conjunction with EPA Office of Solid Waste (see Section 7.6.4.3).
The County Sanitation Districts of Los Angeles County (a group of 27 Districts) provided comments regarding the questions posed by EPA in the December 31, 2003 FRN. Thirteen refineries discharge wastewater to District facilities. The Districts’ comments include a discussion of its analytical data for PACs, dioxins, and metals (selenium and vanadium). As noted in the comments, the Districts submitted analytical data (1984-1993) to EPA as part of the 1996 Preliminary Data Summary. Since the 1996 Preliminary Data Summary, the Districts have found that refinery wastewater quality has not varied greatly, except for a decrease in the concentrations of methyl tertiary-butyl ether (MTBE) and benzene, toluene, ethylene, and xylene (BTEX). The MTBE concentration decrease can be attributed to the ban of MTBE in gasoline in the state of California. The BTEX concentration decrease can be attributed to the promulgation of the Clean Air Act (CAA) National Emission Standards for Hazardous Air Pollutants (NESHAP) regulations in 1992 (3).
The Gulf Coast Waste Disposal Authority submitted comments on the December 31, 2003 FRN concerning the PACs TWPE discharges calculated by EPA (10). The comments note that PACs have never been detected in the effluent from the Washburn Tunnel Facility (which receives petroleum refining wastewater from the Lyondell-Citgo Refinery in Houston, TX and the Crown-Central Petroleum Refinery in Pasadena, TX). Gulf Coast Waste Disposal Authority submitted PAC discharge concentrations for 2000 through 2003. EPA verified the TRI discharges reported by the Lyondell-Citgo Refinery (see Section 7.2.1.2). For both refineries, EPA estimated the TWPE discharged to surface waters using its standard percent removal calculation (discussed in Section 4.2.4).
7.2.2 Permit Compliance System (PCS)
PCS is a computerized management information system maintained by EPA’s Office of Enforcement and Compliance Assurance (OECA). This system contains only permit-required monitoring data for direct-discharging facilities. States may submit data from refineries’ discharge monitoring reports (DMRs) to PCS. The data from each DMR will vary depending on the refinery’s NPDES permit requirements. Refineries that discharge to a POTW, or that transfer their wastewater to a private waste treater, do not submit DMRs; therefore, their data are not in PCS. In addition, PCS typically does not include data for refineries that states classify as “minor sources.”
The Effluent Data Statistics System (EDSS) is a system that EPA developed to estimate mass loadings based on data stored in PCS. EDSS uses PCS-reported mass loading values or calculates loadings using concentration and flow rate data, taking into account the various units of concentration and flow rates. EDSS and PCS are the major sources of data for the PCSLoads2000 database. EPA selected permit facility data, parameter limits data, and measurement/violation data for major facilities to develop PCSLoads2000 (34). Section 4.2.2 discusses the PCSLoads2000 database in further detail.
7-7

Section 7 - Petroleum Refining
The 2000 PCS includes data from 104 (63 percent) of the 163 refineries operating in the U.S. in 2000. To verify the data reported to PCS, EPA performed the following activities:
C Verified that facilities reporting as SIC code 2911 were petroleum refineries and linked each refinery’s data with data from TRI and EIA, discussed in Section 7.2.1.1;
C Met with representatives of industry trade associations to discuss pollutant loadings estimated using data as reported to TRI and PCS, discussed in Section 7.2.1.3; and
C Reviewed comments submitted in response to the December 31, 2003 Federal Register notice of the Preliminary Effluent Guidelines Program Plan, FRN [FRL-7604-7], discussed in Section 7.2.1.4.
7.2.3 The U.S. Economic Census
The U.S. Economic Census of 1997, described in Section 4.1.3, provides data on the number of facilities by SIC code, but does not include a list of the facilities. The U.S. Economic Census of 1997 includes refineries that by 2000 were shut down or no longer operating and might also include nonproduction facilities. In contrast, EIA, which is part of the U.S. Department of Energy (DOE), publishes annual updates of the number of operating refineries, their capacities, and operations. EPA used EIA data for this detailed review, because the data provide more accurate and detailed data on each refinery. Consequently, EPA did not use census data in its analysis of the petroleum refining industry.
7.2.4 Data Sources Specific to the Petroleum Refining Industry
EPA used the following data sources specific to the petroleum refining industry in its detailed study.
C Energy Information Administration (EIA) - EIA tracks the number of operating refineries, their capacities, and operations. EPA downloaded capacity data from the EIA web site (21) and linked each refinery’s crude petroleum operating capacity to the discharges reported to TRI and PCS. EPA also used data from EIA to identify the types of catalytic reforming at each refinery.
C Oil & Gas Journal - Provides general information about the petroleum industry and publishes worldwide refinery-specific capacities each year (12).
C Washington Department of Ecology - EPA reviewed dioxin study reports DOE required from four Washington State refineries (18, 36) and Water
7-8

Section 7 - Petroleum Refining
Pollution Prevention Opportunities in Petroleum Refineries (37), a report of a state-funded study.
C Dioxin Source Investigation Pursuant to Cease and Desist Order No. 95151, Final Report - Study prepared by Tosco Refining Company Avon Refinery to identify all sources of dioxins contributing to refinery’s final effluent dioxin load (19). The report, based on 150 samples collected in 1996, provides source information and granulated activated carbon (GAC) treatment system percent removals for dioxins. The report does not provide detailed treatment performance data (e.g., influent and effluent concentrations).
C EPA/EAD 1996 Preliminary Data Summary for the Petroleum Refining Category (24) - Report describes the industry, pollutant discharges, environmental issues, regulatory standards, treatment technologies, and economic profile using data collected during 1992 and 1993.
C Contacts with treatment technology vendors - EPA contacted treatment technology vendors to gather information on new options to reduce pollutant concentrations in petroleum refining wastewater.
C Industry-provided information/comments - Discussed in Section 7.2.1.4.
7.3 Industry Description
The petroleum refining industry purifies (or refines) crude petroleum into various petroleum products. Products include gasoline, kerosene, distillate fuel oils, residual fuel oils, and lubricants. Refineries use various processes, such as fractionation, distillation, and cracking, to refine the crude petroleum. The industry is classified by SIC code 2911 (North American Industry Classification System (NAICS) code 32411).
7.3.1 Number of Refineries
In 2000, there were 163 petroleum refineries operating in the United States. EIA lists the industry capacity on January 1, 2001 as 16.6 million barrels of crude petroleum per day, with individual refinery capacities ranging from 880 to 508,000 barrels per day. EIA’s Refinery Capacity Data as of January 1, 2001 and the Oil and Gas Journal’s “2001 Worldwide Refining Survey” list all the petroleum refineries, along with their capacities and other pertinent process information. (12, 21)
Refineries are located in 31 states, with most (43 percent) located in Texas, Louisiana, and California.
7-9

Section 7 - Petroleum Refining
7.3.2 Discharge Status for Petroleum Refineries
EPA determined the discharge status of all petroleum refineries using data reported to TRI and PCS in 2000. Table 7-2 lists the discharge status for the 163 petroleum refineries operating in the U.S. during 2000.
In the PCS data system, facilities may be classified as major1 or minor dischargers. States are not required to provide discharge data for minor facilities to PCS, and so reports for minor facilities are incomplete. For this reason, EPA did not use data from minor facilities in this review. Thirty two petroleum refineries are identified as minor dischargers in PCS.
Table 7-2. 2000 Discharge Status for Petroleum Refineries
EIA TRI 2000 PCS 2000
Number No Water of Direct Indirect Discharge Majors Minor
Refineries Dischargers Dischargers Both Reported Dischargers Dischargers
163 94 21 13 26 103 32 Sources: TRIReleases2000 and PCSLoads2000.
7.3.3 Overview of Refinery Operations
To refine the crude petroleum, refineries begin by desalting the crude and distilling it into its various components (or fractions). The next step is to convert the distillation fractions into petroleum products. These processes include cracking, coking (term refers to by-product coke (solid carbon with varying impurities) formed during the process), reforming, and alkylation. Other support operations include reformer catalyst regeneration, sulfur recovery, additive production, and product blending. This section presents descriptions of these operations, as detailed in EPA’s Industry Sector Notebook: Profile of the Petroleum Refining Industry (32).
All refineries perform distillation operations; however, the extent and variety of processes used to convert distilled fractions into petroleum products varies greatly by refinery. “Topping” refineries perform only distillation operations – some perform only atmospheric distillation.
Many refinery operations generate sour waters. Sour waters generally result from water brought into direct contact with a hydrocarbon stream (e.g., when water is used as a washing medium or steam is used as a stripping or mixing medium). Sour waters contain sulfides, ammonia, phenols, and other organic chemical constituents of the crude oil.
1Facilities are classified as “major” based on many factors, including effluent design flow, physical and chemical characteristics of the waste stream, and location of discharge.
7-10

Section 7 - Petroleum Refining
7.3.3.1 Crude Petroleum Processing
The first steps in the petroleum refining process are to desalt the crude petroleum and separate the crude into its various petroleum fractions (i.e., unrefined product streams) using distillation. Each of these processes and resulting wastewater streams is discussed below.
Desalting
Petroleum refineries remove corrosive salts from the crude petroleum by mixing heated crude with water. The salt, along with some metals, suspended solids, and other water-soluble compounds, dissolves in the water. The refinery then separates the crude petroleum and desalter water using electrostatic separation and demulsification to break the emulsion and separate the two phases (oil/water separation). The desalter water is then discharged to the refinery treatment system. The raw water used for desalting is often untreated or partially treated wastewater from elsewhere at the refinery.
Distillation
Petroleum refineries use two types of distillation towers: 1) atmospheric distillation separates the lighter petroleum fractions, and 2) vacuum distillation separates the heavier petroleum fractions. Petroleum fractions separated using atmospheric distillation include naphtha, gasoline, kerosene, light fuel oil, diesel oils, gas oil, lube distillate, and heavy bottoms (further separated by steam strippers or vacuum distillation). The uncondensed refinery fuel gas, or sour gas, leaving from the top of the distillation tower contains primarily methane and ethane, along with hydrogen sulfide and ammonia. The refinery will treat the sour gas to recover the methane and ethane which is then used to heat furnaces at the refinery. Most refineries performing vacuum distillation use vacuum pumps and surface condensers; however, they may also use barometric condensers. The wastewater from distillation includes condensed steam from the tower (called oily sour water), which contains hydrogen sulfate and ammonia, and oily wastewater if barometric condensers are used for vacuum distillation.
7.3.3.2 Refining of Petroleum Fractions - Cracking, Coking, Hydrotreating/ Hydroprocessing, Alkylation, Polymerization, and Isomerization
The petroleum fractions from the distillation step might be further refined at the refinery using a variety of processes. These processes modify the hydrocarbon molecular structure either by breaking them into smaller molecules, joining them into large molecules, or reshaping the molecules for higher quality. Process types include thermal cracking (visbreaking), catalytic cracking, catalytic hydrocracking, coking, hydrotreating, alkylation, isomerization, polymerization, and catalytic reforming (discussed on Section 7.3.3.3). Refineries might use multiple operations, discussed below.
Thermal cracking (visbreaking) breaks heavy gas oils and residues from distillation into smaller, lighter molecules using heat and pressure. Operations include preheating, reactor, cooling to stop the cracking reaction, flasher chamber (reduces pressure and
7-11

Section 7 - Petroleum Refining
draws off lighter products), and fractionating tower (separates various petroleum fractions). The cooling step uses part of the heavy bottoms from the fractionating tower to cool the incoming process stream. Wastewater includes sour water from the fractionating tower.
Catalytic cracking breaks light and heavy oils from distillation into smaller, lighter molecules (primarily gasoline with some fuel oil and light gases) using heat, pressure, and a catalyst. Because catalytic cracking produces higher octane gasoline and less heavy fuel oils and light gases, it has largely replaced the thermal cracking process at petroleum refineries. The most common reactor types used for catalytic cracking are fluidized beds and moving beds (both with continuous catalyst regeneration); other types include fixed-bed reactors and once-through units. Catalysts are mixtures of crystalline, synthetic silica-alumina (zeolites) and amorphous, synthetic silica-alumina. Wastewater includes sour water from the fractionating tower.
During catalytic cracking, coke collects on the catalyst surface. To maintain catalyst properties, refineries need to regenerate the catalyst (either continuously or periodically). Catalyst regeneration involves burning the coke off the catalyst. Steam used to purge and regenerate catalysts might become wastewater contaminated with metal impurities from the feed stream.
Refineries use catalytic hydrocracking for petroleum fractions that are most difficult to crack (middle distillates, cycle oils, residual fuels oils, and reduced crudes) to produce gasoline. Catalytic hydrocracking typically uses a fixed-bed reactor under high pressure (1,200 to 2,000 psig) in the presence of hydrogen (increases gasoline yield). Prior to hydrocracking, feedstocks typically undergo hydrotreatment to remove impurities (hydrogen sulfide and ammonia) that might foul the catalyst during the process and water removal using silica gel or a molecular sieve dryer. The catalyst is typically a mixture of zeolites with small amounts of rare earth metals. Sour gas and sour water are both generated from the fractionating tower; however, hydrotreating the feedstock prior to cracking results in relatively low levels of impurities in both waste streams. Hydrocracking catalyst regeneration is typically performed off site.
Coking is a cracking process that breaks residual fuel oils into gasoline and diesel. A by-product of the process is petroleum coke (solid carbon with varying impurities). Refineries use two types of coking operations: 1) delayed coking and 2) fluid coking. The delayed coking process steps are the same as thermal cracking except the feed stream reacts longer without cooling. The heavy materials from the fractionating tower are fed into a coke drum (insulated vessel) to form petroleum coke. The coking process includes steam injection to the coke drum to remove hydrocarbon vapors (lighter products, hydrogen sulfide, and ammonia) and cooling water injection to cool the coke. The hydrocarbon vapors are fed back to the fractionating tower where they are removed as product streams or part of the sour gas. Wastewater from the coking drum includes any condensed steam, cooling water, and water used to remove the coke (high-pressure water jets).
Hydrotreating and hydroprocessing remove impurities (e.g., sulfur, nitrogen, oxygen, halides, and trace metals) from the feedstock to prevent fouling of the catalyst during
7-12

Section 7 - Petroleum Refining
cracking and assist in forming higher-quality or lighter products in a fixed-bed reactor. Using catalysts, high pressure, high temperature, and hydrogen, the processes separate the treated product stream from the light fuel gas stream, hydrogen sulfide, and ammonia. The treated product stream is then cooled and the hydrogen-rich gas is recycled back to the reactor. The refinery treats the light fuel gas stream with the sour gas and the hydrogen sulfide at the sulfur recovery unit. Catalysts are cobalt or molybdenum oxides on alumina that might also contain nickel and tungsten; these are regenerated off site.
Alkylation forms a high octane gasoline blending stock (alkylates such as propane and butane) from isobutane. The isobutane feedstock is formed primarily during catalytic cracking and coking operations. The process uses either a sulfuric acid or hydrofluoric acid catalyst. A solution of potassium hydroxide is used to extract hydrofluoric acid catalyst from the hydrocarbon stream. Hydrofluoric acid might be regenerated on site, resulting in a waste oil containing dissolved polymerization products. The sulfuric acid must be regenerated in a sulfuric acid plant, usually located off site.
Polymerization (similar to alkylation) converts propene and butene to high octane gasoline blending stock using high pressure and a phosphoric acid catalyst. The catalyst is typically not regenerated. Prior to the reactor, the feedstock undergoes a caustic wash to remove mercaptans, which contain sulfur; an amine solution wash to remove hydrogen sulfide; a water wash to remove caustics and amines; and drying. Sulfur, bases, and oxygen can negatively impact the reaction. The wastewater generated includes caustic wash and sour water containing amines and mercaptans.
Isomerization alters the arrangement of the hydrocarbon molecules using high temperatures (200-400°F) and a platinum-based catalyst in a hydrogen environment. Typically, isomerization converts paraffins (butane or pentane) to isoparaffins with higher octane. Catalysts are replaced approximately every two to three years. The platinum in the spent catalyst is recovered off site. Sour gas and sour water are generated from the process.
One catalyst type requires the continuous addition of organic chlorides. The organic chlorides are converted to hydrogen chloride. The refinery uses caustic to neutralize any entrained hydrochloric acid in the light fuel gas stream. This results in a caustic wash waste stream, containing calcium chloride (or other salts).
7.3.3.3 Refining of Petroleum Fractions - Catalytic Reforming and Reformer Catalyst Regeneration
In December 1988, the Ontario Ministry of the Environment confirmed that dioxins were present in internal wastewater from Ontario petroleum refineries. The Ministry determined that catalyst regeneration operations for the catalytic reforming process were the source of the dioxins (24, Page G-1). Additional work by EPA confirmed that reformer catalyst regeneration wastewater was the major source of dioxins in refinery process wastewater (24).
7-13

Section 7 - Petroleum Refining
Catalytic Reforming
Catalytic reforming units are designed to reform naphthas into higher octane aromatics, varying temperature and pressure to promote dehydrogenation, isomerization, and hydrogenolysis reactions.
The reforming process uses a platinum or bimetallic (platinum and rhenium) catalyst material. The catalyst is designed to be highly active and selective, and to promote dehydrogenation reactions with maximum surface area exposed to the feedstock. Ideally, the platinum ions are dispersed on the surface of an alumina or silica-alumina support. Chlorine promotes the activity of a platinum-alumina catalyst, and is stripped from the surface of the catalyst as hydrogen chloride during the reactions. As these reactions occur, the activity of the catalyst slows until it needs to be regenerated or replaced to be effective.
Dehydrogenation reactions are favored by low pressure and high temperature. However, coke is also formed at low pressure, which also tends to deactivate the catalyst and reduce yields. Coke formation can be reduced by operating under high hydrogen pressure.
Catalyst Regeneration
There are three general types of catalytic reforming processes, distinguished by the way in which catalyst is regenerated: semi-regenerative, cyclic, and continuous. A refinery might have more than one reformer, using different processes. Table 7-3 presents the number of refineries performing each type of regeneration. Because a refinery might have more than one reformer, using different processes, the sum of the refineries with each type of process exceeds the total number of refineries with catalytic reforming.
Table 7-3. Reformer Catalyst Regeneration Processes in 2000
Type of Regeneration Process Number of Refineries Percentage of Refineries
With Catalytic Reforming
Semi-regenerative 33 27%
Cyclic 21 17%
Continuous 74 61%
Not specified 10 8%
Total 122 Source: U.S. Department of Energy, Petroleum Supply Annual 2000, Volume 1. Energy Information Administration; and Oil & Gas Journal, “2001 Worldwide Refining Survey.” Volume 99.52, December 24, 2001.
The following description of the three types of catalytic reforming processes is taken from Appendix G of the 1996 Preliminary Data Summary.
The semi-regenerative process generally has three reactors. After the catalyst’s activity is depleted, all three reactors are taken out of service and undergo one of several
7-14

Section 7 - Petroleum Refining
regeneration processes. Figure 7-1 shows a typical schematic for this type of regeneration. In 2000, 27 percent of U.S. catalytic reforming units used the semi-regenerative process (20).
1 2 3 Reactor
Chlorine
Preheater 2 Preheater 1
Reactor
Preheater 3
Reactor Separator
Chlorine
Air
Caustic
Makeup Wa ter
Effluent to Wastewate r Treat ment
Step 1. N2 Step 2. Air
Compressor
Figure 7-1. Semi-Regenerative Catalytic Reforming Process
The reactors are purged with nitrogen, the reactor bed temperature is raised to 750 to 850N F and the coke is burned off the catalyst with controlled oxygen concentration and pressures. Hydrogen chloride, chlorine, catalyst particles, carbon dioxide, oxides of sulfur and nitrogen, and organic compounds (including dioxins) might make up the composition of the off-gases. Scrubbing these acidic off-gases in the separator to neutralize the gases to protect the equipment generates wastewaters. Caustic or water might be used in scrubbing the off-gases, or, in some cases, the off-gases may be vented directly to the atmosphere. When the burn is complete, the catalyst is reactivated with either chlorine gas or chlorinated organic compounds.
The cyclic catalytic reforming process is similar to the semi-regenerative process except an additional reactor is available to replace one that is ready for regeneration. This allows for continued production during regeneration. While the semi-regenerative reformers are designed for long on-stream periods by using higher hydrogen pressure to reduce coke build-up, cyclic reformers are designed for lower operating pressure. Yields are much higher, but these cyclic reformers must be regenerated more frequently (daily to monthly). Figure 7-2 shows the regeneration process, which consists of the same operations as those used in the semi-regenerative process. In 2000, 17 percent of U.S. catalytic reforming units used the cyclic catalytic reforming process (20).
7-15

Section 7 - Petroleum Refining
Offline Reactor
Chlorine
Preheater
Cooler
Separator
Gases to Stack
Effluent to Wastewater Treatment
Step 1. N2 Step 2. Air
Compressor
HTX
Makeup Water
Figure 7-2. Cyclic Catalytic Reforming Process
The continuous catalytic reforming process is designed to operate at lower hydrogen pressures, which increases yield. However, operating at these low pressures results in more rapid coke buildup. To maintain performance, the unit is designed for continuous catalyst regeneration. Figure 7-3 shows a schematic of this process. In 2000, 61 percent of U.S. catalytic reforming units used the continuous process (20).
Regenera tor
Spent Ca talyst Low Pressure Separator
Stacked Reactors
High Pressure Separator
Feed
Regenerated Catalyst
Heat Exchangers
Reformate
Net Gas
Recycle Gas
Figure 7-3. Continuous Catalytic Reforming Process
7-16

Section 7 - Petroleum Refining
The only wastewater sources from the continuous reforming process are from scrubbing the off-gases; usually, the off-gases are vented and/or flared directly to the atmosphere. The regeneration off-gas vent might have a bag filter to capture catalyst fines, which are reprocessed to recover valuable catalyst material (platinum). In its 1990-91 study, EPA did not identify any facilities scrubbing off-gases from continuous regeneration reformers; therefore, the Agency did not include the continuous regeneration process in the wastewater sampling program.
7.3.3.4 Refining of Petroleum Product Properties
Petroleum refineries use further refining operations to enhance certain product properties. This subsection describes these operations (solvent extraction, chemical treating, dewaxing, and propane deasphalting).
To improve viscosity, oxidation resistance, color, and gum formation, refineries remove aromatics from the lube oil feedstock. Solvent extraction is the dissolving of the aromatics within a packed tower or rotating disc contactor, usually with furfural and phenol solvents. Solvents are recovered through distillation and steam stripping. The wastewater stream from the solvent recovery step contains oil and solvents.
To remove or modify properties associated with certain impurities (sulfur, nitrogen, or oxygen), refineries perform one of two chemical treating processes: 1) extraction or 2) oxidation (or sweetening). For example, refineries may remove sulfur, which gives the products an offensive odor. A possible waste stream is an oily disulfide stream.
To alter viscosity properties, refineries might dewax lubricating oil base stocks. Dewaxing processes include solvent dewaxing and selective hydrocracking. Solvents used include propane and mixtures of methyl ethyl ketone (MEK) with methyl isobutyl ketone (MIBK), or MEK with toluene. Wastewater is generated from solvent recovery. Selective hydrocracking uses one or two zeolite catalysts to selectively crack the wax paraffins. See Section 7.3.2.2 for more details on catalytic hydrocracking.
Propane deasphalting is an extraction process using propane to produce lubricating oil base stocks from vacuum distillation residuals. During propane recovery, wastewater contaminated with propane is produced.
7.3.3.5 Supporting Operations at Petroleum Refineries
Supporting operations at petroleum refineries include sulfur recovery, additive production, and product blending. Petroleum refineries recover sulfur from the sour gas to meet air emission limits of sulfur oxides (SOx) and to sell elemental sulfur. Sulfur recovery includes the following steps: 1) separating fuel gases (methane and ethane) from the hydrogen sulfide and 2) removing sulfur from the hydrogen sulfide. To either improve performance or meet environmental requirements, refineries might produce additives for motor fuels, such as MTBE and tertiary amyl methyl ether (TAME). Product blending consists of mixing petroleum
7-17

Section 7 - Petroleum Refining
products to meet customer specifications (e.g., vapor pressure, specific gravity, sulfur content, viscosity, octane rating).
7.4 Regulatory Background
Effluent limitations guidelines and pretreatment standards found in 40 CFR Part 419 are applicable to discharges from the petroleum refining industry. Sections 7.4.1 through 7.4.4 discuss these regulations in detail. In addition, Section 7.4.5 summarizes the Clean Water Act (CWA) stormwater requirements and Spill Prevention, Control, and Countermeasure (SPCC) requirements and two other major statutes with which petroleum refineries must comply: 1) the Resource Conservation and Recovery Act (RCRA) and 2) the Clean Air Act (CAA).
7.4.1 Effluent Guidelines History
In 1974, EPA promulgated standards for Best Practicable Control Technology Currently Available (BPT), Best Available Technology Economically Available (BAT), New Source Performance Standards (NSPS), Pretreatment Standards for Existing Sources (PSES) and Pretreatment Standards for Existing Sources (PSNS) for the Petroleum Refining category. BAT was remanded after legal challenge in 1976, and EPA continued to study BAT. This study included a survey of 1976 industry treatment practices. In 1982, EPA repromulgated BAT, setting it equal to BPT (i.e., the 1976 level of control). In 1985, EPA revised BAT for phenol and chromium, based on additional flow reduction and lower attainable concentrations for these two pollutants.
EPA conducted a review of the petroleum refining industry from 1992 to 1996 to determine whether revisions to the ELGs were warranted. For this evaluation, EPA reviewed data primarily from TRI and PCS. In addition, EPA collected sampling data during visits to six refineries. The Agency published the results of this review in the Preliminary Data Summary for the Petroleum Refining Category, April 1996 (24). The study provides a general description of the industry, treatment technologies used, water usage, analysis of dioxins in catalytic reformer wastewater, estimated pollutant discharges, environmental issues, and economic profile.
7.4.2 Subcategorization and Applicability
The effluent guidelines for the Petroleum Refining category are divided into five subcategories, described below:
C Topping Refineries (Subcategory A) - The effluent guidelines for this subcategory apply to discharges from any facility that produces petroleum products using topping and catalytic reforming, whether or not the facility includes any process in addition to topping and catalytic reforming. This subcategory does not apply to facilities that include thermal processes (coking, thermal cracking (visbreaking), etc.) or catalytic cracking. Topping refineries separate crude oil by atmospheric and/or vacuum distillation, solvent deasphalting, and catalytic reforming. Existing
7-18

Section 7 - Petroleum Refining
guidelines for the topping subcategory include allowances for ballast water. Ballast is defined as the flow of waters, from a ship, that is treated along with refinery wastewaters in the main treatment system.
C Cracking Refineries (Subcategory B) - The effluent guidelines for this subcategory apply to all discharges from any facility that produces petroleum products using topping and cracking, whether or not the facility includes any process in addition to topping and cracking. However, this subcategory is not applicable to facilities that meet the definition of Subcategories C, D, or E.
C Petrochemical Refineries (Subcategory C) - The effluent guidelines for this subcategory apply to all discharges from any facility that produces petroleum products using topping, cracking, and petrochemical operations whether or not the facility includes any process in addition to topping, cracking, and petrochemical operations. However, this subcategory is not applicable to facilities that meet the definition of Subcategories D or E. Petrochemical operations meet one of the two following definitions:
— Produce of second-generation petrochemicals (e.g., alcohols, ketones, cumene, and styrene), or
— Produce of first-generation petrochemicals and isomerization products (e.g., benzene, toluene, xylenes, olefins, and cyclohexane) when 15 percent or more of the total refinery production is as first-generation petrochemicals and isomerization products.
C Lube Refineries (Subcategory D) - The effluent guidelines for this subcategory apply to all discharges from any facility that produces petroleum products using topping, cracking, and lube oil manufacturing processes, whether or not the facility includes any process in addition to topping, cracking, and lube oil manufacturing processes. However, this subcategory is not applicable to facilities that meet the definition of Subcategories C or E.
C Integrated Refineries (Subcategory E) - The effluent guidelines for this subcategory apply to all discharges resulting from any facility that produces petroleum products using topping, cracking, lube oil manufacturing processes, and petrochemical operations, whether or not the facility includes any process in addition to topping, cracking, lube oil manufacturing processes, and petrochemical operations.
7-19

Section 7 - Petroleum Refining
7.4.3 Technical Basis of Regulation
The BPT basis includes the following in-plant controls:
C Sour water strippers to reduce sulfide and ammonia entering thewastewater treatment plant;
C Elimination of once-through barometric condenser water;
C Sewer segregation, to keep unpolluted stormwater run-off and once-through cooling water separate from process wastewater (and out of the wastewater treatment plant); and
C Elimination of polluted once-through cooling water by properly maintaining surface condensers or using wet and dry recycle systems.
The BPT and NSPS basis includes the following end-of-pipe treatment:
C Equalization and stormwater diversion;
C Oil and solids removal (API separator and/or baffle plate separator);
C Dissolved air flotation (DAF) to remove additional oil;
C Biological treatment to reduce biochemical oxygen demand (BOD) and chemical oxygen demand (COD) (activated sludge, aerated lagoons, oxidation ponds, or trickling filter); and
C Effluent polishing (polishing ponds or sand, dual-media, or multimedia filters).
In 1982, EPA confirmed the above technology basis for setting BAT effluent limitations. EPA based PSES and PSNS on oil/water gravity separators and in-plant sour water stripping for ammonia control.
7.4.4 Regulated Pollutants
BPT, BAT, and NSPS established production-based mass limitations for the following pollutants based on the treatment technologies described in Section 7.4.3:
C Ammonia as nitrogen;C 5-day BOD;C COD (or total organic compounds (TOC) for high-chloride effluents);C Hexavalent chromium;C Oil and grease;
7-20

Section 7 - Petroleum Refining
C pH; C Phenolic compounds; C Sulfide; C Total chromium; and C Total suspended solids (TSS).
In 1982, EPA used new data to revise its BAT flow model and developed more stringent limitations for chromium and total phenolics. The limitations for these pollutants are listed in 40 CFR Part 419. The mass limitations are based on feedstock production (pounds pollutant per 1,000 barrel feedstock), and specific refinery limitations are based on size factors (1,000 barrels feedstock per stream day), process configuration factors, and processes.
EPA established the following daily maximum pretreatment standards for existing sources in all subcategories:
C Oil and grease: 100 milligrams per liter (mg/L); and C Ammonia as nitrogen: 100 mg/L.
EPA established the following daily maximum pretreatment standards for new sources in all subcategories:
C Oil and grease: 100 mg/L;C Ammonia as nitrogen: 100 mg/L; andC Total chromium for cooling tower discharge: 1 mg/L.
7.4.5 Other Regulations Affecting Petroleum Refineries
In addition to the effluent limitations guidelines and standards at 40 CFR Part 419, petroleum refineries are also subject to other regulations. This subsection describes a few of the major regulations also affecting the petroleum refining industry. These include solid and hazardous waste regulations (RCRA), hazardous air pollutant regulations (CAA), and CWA stormwater regulations and SPCC requirements.
7.4.5.1 RCRA
RCRA addresses solid (Subtitle D) and hazardous (Subtitle C) waste management activities. Subtitle C (40 CFR Parts 260-299) governs the handling of hazardous waste from the point of generation to disposal. Regulations for hazardous waste include waste accumulation, manifesting, and record-keeping standards. Permits under Subtitle C include facility contingency plans, emergency procedures, and unit-specific standards. Petroleum refineries typically generate the following listed and characteristic hazardous wastes:
C K051 - API separator sludge;C K049 - Slop oil emulsion solids;C K048 - Dissolved air flotation floats;
7-21

Section 7 - Petroleum Refining
C F037 - Other primary oil/water separator sludge, bar screen debris; C F038 - All other sludge, floats, and used filter bags; C D004 - Wastes containing arsenic; C D007 - Wastes containing chromium; C D008 - Wastes containing lead; C D009 - Wastes containing mercury; and C D010 - Wastes containing selenium.
To meet land disposal restrictions, facilities typically incinerate these wastes.
7.4.5.2 CAA National Emission Standards for Hazardous Air Pollutants (NESHAPs)
Refineries are subject to NESHAP if they are a major source of hazardous air pollutants (HAP) and emit 10 tons per year of a single HAP or 25 tons per year of a combination of HAPs. The 1995 Petroleum Refinery NESHAP requires controls for wastewater streams containing benzene above specified threshold amounts (e.g., 10 parts per million (ppm) by weight). By August 1998, refineries were required to comply with the benzene NESHAP 40 CFR Part 61 Subpart FF, which requires reducing benzene mass emissions by 99 percent using suppression followed by another treatment process (e.g., steam stripping or biotreatment); and reducing emissions from vents from stream strippers, other waste management, or treatment units by 95 percent with a control device or to 20 ppm (by volume) at the outlet of the control device. Suppression includes “hard piping” and using enclosed tanks and oil/water separators, vented to vapor collection.
7.4.5.3 Other CWA Requirements
Under the CWA, EPA developed stormwater regulations to control the discharge of stormwater associated with an industrial activity (i.e., stormwater discharge directly related to manufacturing, processing, or raw material storage areas) (40 CFR Part 122.26(b)(14)). These regulations apply to stormwater from Category ii - Manufacturing, one of the 11 industrial activity categories defined at 40 CFR Part 122.26. This category specifically lists facilities classified as SIC code 29, which includes petroleum refineries.
The stormwater regulations require regulated refineries to obtain coverage under a NPDES stormwater permit and implement stormwater pollution prevention plans (SWPPPs) or stormwater management programs to effectively reduce or prevent the discharge of pollutants into receiving waters. Both the SWPPPs and stormwater management programs use best management practices (BMPs).
The SPCC requirements were also developed under the CWA. SPCC requires refineries meeting applicability requirements to prepare and implement spill prevention plans to avoid oil spills into navigable waters or adjoining shorelines of the United States. The SPCC plan must identify operating procedures in place and control measures installed to prevent oil spills, and countermeasures to contain, clean up, or mitigate the effects of any oil spills that occur.
7-22

Section 7 - Petroleum Refining
7.5 Wastewater Characterization
As detailed in the U.S. Department of Energy’s Water Use in Industries of the Future: Petroleum Industry, the petroleum refining industry consumes approximately 65 to 90 gallons of water for every barrel of crude petroleum it refines. Most of this water is used for steam production and cooling towers. Approximately 10 percent of this supply water (plus additional blowdown flows from the steam production and cooling tower systems) is used for process units, where it might be contaminated with pollutants (22). The process water is either evaporated or treated (on or off site) as wastewater. This section describes the wastewater generated, treated, and discharged from the petroleum refining industry, including wastewater sources, types of pollutants, treatment, discharge volumes, and pollutant loadings.
7.5.1 Wastewater Sources
The major wastewaters from petroleum refineries are sour water from multiple processes, scrubber water from reformer catalyst regeneration, spent potassium hydroxide stream from alkylation, desalting wastewater, and caustic wash water from isomerization. Table 7-4 lists the major refining processes, types of wastewaters, and wastewater flow estimates as reported in the U.S. DOE’s Water Use in Industries of the Future: Petroleum Industry. The table does not include the following wastewaters (described below):
Reformer Catalyst Regeneration Wash Water - Regeneration of spent catalyst from the reforming process is a potential source of dioxins. Catalyst burning generates dioxins (along with other combustion products). In addition to dioxins, the off-gases from the regeneration reactor contain hydrogen chloride, chlorine, catalyst particles, carbon dioxide, sulfur oxides, nitrogen compounds, and organic compounds. A caustic or water wash neutralizes the acidic off-gases (i.e., scrubs the off-gas). Some refineries directly vent the off-gases to the atmosphere. The wash stream is recycled with a blowdown of spent caustic (24). As shown in Table 7-20, the volume of wastewater generated during catalyst regeneration at three Washington State refineries ranged from 2,200 to 360,000 gallons per cycle.
Quench Wastewater - Petroleum refineries use direct contact “quench” water to cool products quickly. The quench water is recirculated, and to maintain water quality, a blowdown stream is sent to wastewater treatment (22).
Leaks - Includes any cooling water leaking into the hydrocarbon stream of the heat exchanger (22).
7-23

Section 7 - Petroleum Refining
Table 7-4. Process Wastewater at Petroleum Refineries
Process Wastewater Description (Possible
Pollutants)
Wastewater Flow Rate (gallon/barrel of crude
petroleum)
Percentage of Total Wastewater
Flow Rate Distillation Sour water (hydrogen sulfide, ammonia,
suspended solids, chlorides, mercaptans, and phenol)
26.0 44%
Fluid catalytic cracking
Sour water (hydrogen sulfide, ammonia, suspended solids, oil, phenols, and cyanides)
15.0 26%
Catalytic reforming Sour water (hydrogen sulfide, ammonia, suspended solids, mercaptans, oil)1
6.0 10%
Alkylation Spent potassium hydroxide stream (hydrofluoric acid)
2.6 4%
Crude desalting Desalting wastewater (salts, metals, solids, hydrogen sulfide, ammonia, and phenol)
2.1 4%
Thermal cracking/ Visbreaking
Sour water (hydrogen sulfide, ammonia, suspended solids, dissolved solids, and phenol)
2.0 3%
Catalytic hydrocracking
Sour water (hydrogen sulfide, ammonia, and suspended solids)
2.0 3%
Coking2 Sour water (hydrogen sulfide, ammonia, and suspended solids)
1.0 2%
Isomerization Sour water (hydrogen sulfide and ammonia) and caustic wash water (calcium chloride or other chloride salts)
1.0 2%
Additive production: ethers manufacture
Pretreatment wash water (nitrogen contaminants)
<1.0
Catalytic hydrotreating
Sour water (hydrogen sulfide, ammonia, suspended solids, and phenol)
1.0 2%
Chemical treating: sweetening/Merox process
3
Sulfur removal/Claus process
Sour water (hydrogen sulfide and ammonia)
<1.0
Lubricating oil manufacture
Steam stripping wastewater (oil and solvents) and solvent recovery wastewater (oil and propane)
<1.0
TOTAL 58.7 100% Source: U.S. DOE. Water Use in Industries of the Future: Petroleum Industry. July 2003.1Additional pollutants identified in EPA’s Industry Sector Notebook: Petroleum Refining, September 1995.2Fluid coking produces little or no effluents.3Little or no wastewater generated.
7-24

Section 7 - Petroleum Refining
7.5.2 Discharge Volumes
7.5.2.1 Discharge Volumes from the 1996 Preliminary Data Summary
Refinery process wastewater flow rates reported in EPA’s 1996 Preliminary Data Summary range from 0.4 to 8.1 million gallons per day (MGD) (150 to 3,000 million gallons per year (MGY)). The median flow rate for a refinery was 1.5 MGD (average: 2.3 MGD). (24)
7.5.2.2 Discharge Volumes from All Refineries Reported to 2000 PCS
EPA reviewed the discharge volumes from all refineries reported to PCS in 2000; however, the total flow rates reported to PCS might include stormwater and noncontact cooling water, as well as process wastewater. In some cases, the PCS database identifies the type of wastewater being discharged; however, most reported flow rates do not indicate the type of wastewater. Total wastewater flow rates reported to PCS in 2000 range from 0.15 to 1,240 MGD (54 to 454,000 MGY). The median flow rate was 4.26 MGD (1,560 MGY) (34).
To isolate the process wastewater flow rate in the values reported to PCS, EPA calculated the refinery discharge volume for only those outfalls where the refinery must monitor for five-day BOD (BOD5). Refinery permits include limitations for BOD5 and/or ammonia for process wastewater, but not for stormwater or noncontact cooling water. EPA calculated the wastewater flow rates from outfalls with nonzero discharges of BOD5 or ammonia. These flow rates range from 0.09 to 1,240 MGD (33 to 454,000 million gallons per year). The median flow rate is 2.1 MGD (765 million gallons per year) (34). These flows are significantly greater than the range and median refinery wastewater flow rates reported in the 1996 Preliminary Data Summary. Since EPA has not received or obtained any information during this detailed review to indicate process flows have increased since the 1996 Preliminary Data Summary, EPA concludes that the higher volumes reflect EPA’s inability to completely distinguish between process wastewater discharges and nonprocess wastewater discharges in PCS.
7.5.3 Pollutant Loadings
For its screening-level analysis, EPA estimated current discharges (as TWPE) to surface water from 56 industries currently covered by existing effluent guidelines. EPA used data reported to TRI and PCS to estimate direct discharges, and used data reported to TRI, reduced by a typical POTW percent removal, to estimate indirect discharges. EPA applied TWFs to the TRI and PCS data to calculate the TWPE for each pollutant reported discharged by petroleum refineries. The petroleum refining industry ranked fourth in pollutant discharges based on 2000 TRI data and fourteenth in pollutant discharges based on 2000 PCS data. See the Federal Register notice on the December 31, 2003 Preliminary Effluent Guidelines Program Plan, FRN [FRL-7604-7]. See 4.2.4 for more discussion of EPA’s calculation of TWPE.
Based on further review of the available data for this detailed study and comments submitted in response to the December 31, 2003 Federal Register notice on the Preliminary Effluent Guidelines Program Plan, EPA revised the list of refineries, the calculation of PACs and
7-25

Section 7 - Petroleum Refining
dioxin TWPEs, and estimates of the current discharges to surface water from the petroleum refining industry. EPA used these pollutant loadings to compare the Petroleum Refining category to other industrial point source categories, and identify trends in wastewater discharges.
7.5.3.1 Pollutant Loadings Calculated Using TRI Data
Refineries report both direct discharges (i.e., mass of pollutant released directly to receiving streams) and indirect discharges before treatment (i.e., mass of pollutant transferred to POTWs) to TRI. For direct discharges, EPA used the reported mass to calculate TWPEs. For indirect discharges, EPA first estimated pollutant mass removed by the POTW (i.e., pollutant percent removal) and then used the resulting mass of pollutant after treatment to calculate TWPEs discharged to the POTW’s receiving stream. EPA calculated the reduction in pollutant mass for indirect discharges using average POTW removal efficiencies (see DCN 00618, Evaluation of RSEI Model Runs).
Using data as reported to TRI in 2000, the reported releases of PACs, dioxins, and metals (predominantly vanadium) comprise 90 percent of the petroleum refining industry’s toxic releases. Refineries reporting to TRI discharge 328,000 TWPEs. Table 7-5 presents the pounds (and TWPE) discharged by direct and indirect dischargers as reported to TRI for dioxins, PACs, and metals.
Table 7-5. Discharges Reported to the 2000 TRI for the Petroleum Refining Industry Pollutants Comprising Approximately 90 Percent of the TWPE
Pollutant
Total Pounds
Discharged Total TWPE Discharged
Percentage of Total TWPE
Discharged
TWPE Range per Reporting
Refinery
Average TWPE per Reporting Refinery
Number of Reporting Refineries
Dioxins1 0.02 139, 000 37% 42 - 52,000 8,200 17
PACs2 487 112,000 30% 460 - 40,400 5,900 19
Metals (Top 5)3 98,200 76,000 20% 0.96 - 25,076 1316 42 (Vanadium Only) (55,000) (15%) (3.7 - 25,076) (3,946) (14)
TOTAL 139,000 328,000 87% 53 Source: TRIReleases2000.1See Section 7.7.2 for a discussion on the calculation of TWPE.2See Section 7.6.2 for a discussion on the calculation of TWPE.3Top 5 metals include: vanadium, mercury, selenium, chromium, and lead.
EPA reviewed whether stormwater discharges are commonly reported to TRI. When reporting discharges to surface water for TRI, facilities may report the percentage of the pollutant discharge attributed to stormwater. Based on a review of the data reported to the 2000 TRI, all reported discharges of dioxins and PACs are from process wastewater (not stormwater). Most vanadium discharges are also from process wastewater. Table 7-6 presents the stormwater data reported to the 2000 TRI for petroleum refining.
7-26

Section 7 - Petroleum Refining
Table 7-6. Stormwater Discharges Reported to the 2000 TRI
Pollutant
Number of Refineries Reporting
Pollutant
Number of Refineries Reporting Percent
Stormwater for Direct Discharges
Number of Refineries Reporting All Discharges as
Process Wastewater (0 Percent Stormwater)
Dioxins 17 7 7
PACs 19 14 14
Vanadium 14 8 7 Source: TRIReleases2000.
7.5.3.2 Pollutant Loadings Calculated Using PCS Data
Refineries report direct discharges to PCS. For direct discharges, EPA used the reported mass to calculate TWPEs. As discussed in Section 7.2.2, PCS includes only results of permit-required monitoring for direct discharging facilities. Even though toxic pollutants may be present in a refinery’s discharge, they will not be reported unless required by permit.
Using PCS data, the reported releases of sulfide comprise over 50 percent of the petroleum refinery industry’s toxic releases. Refineries reporting to PCS discharge 193,000 TPWEs. PCS has little discharge data for PACs and dioxins, and sulfide is not reportable to TRI. Table 7-7 presents the pounds (and TWPE) discharged by direct dischargers as reported to PCS for the 10 most toxic discharged pollutants (by TWPE). These pollutants compose over 90 percent of the total industry TWPE.
Table 7-7. Discharges Reported to the 2000 PCS for the Petroleum Refining Industry Top 10 Pollutants Composing 91 Percent of the TWPE
Pollutant
Total Pounds
Discharged
Total TWPE
Discharged
Percentage of Total TWPE
Discharged
TWPE Range per Reporting
Refinery
Median TWPE per Reporting
Refinery
Number of Reporting Refineries
Sulfide, Total1 35,969 100,734 52% 3 - 12341 521 70
Chlorine, Total Residual2 52,069 25,357 13% 14 - 12323 130 13
Fluoride, Total (as F) 462,807 16,198 8% 8 - 6069 1092 11
Selenium, Total (as Se) 7,856 8,802 4% 1 - 3291 303 13
Aluminum, Total (as AL) 120,235 7,754 4% 64 - 7115 241 5
Phenolics, Total Recoverable
261,985 7,336 4% 0.07 - 6954 2 68
Arsenic, Total (as As) 1,277 4,430 2% 4 - 2122 257 7
Nitrogen, Ammonia Total (as N)
1,917,492 3,509 2% 0.16 - 772 14 86
Cyanide, Total (as CN) 1,956 2,107 1% 3 - 801 89 10
7-27
Section 7 - Petroleum Refining
Table 7-7 (Continued)
Pollutant
Total Pounds
Discharged
Total TWPE
Discharged
Percentage of Total TWPE
Discharged
TWPE Range per Reporting
Refinery
Median TWPE per Reporting
Refinery
Number of Reporting Refineries
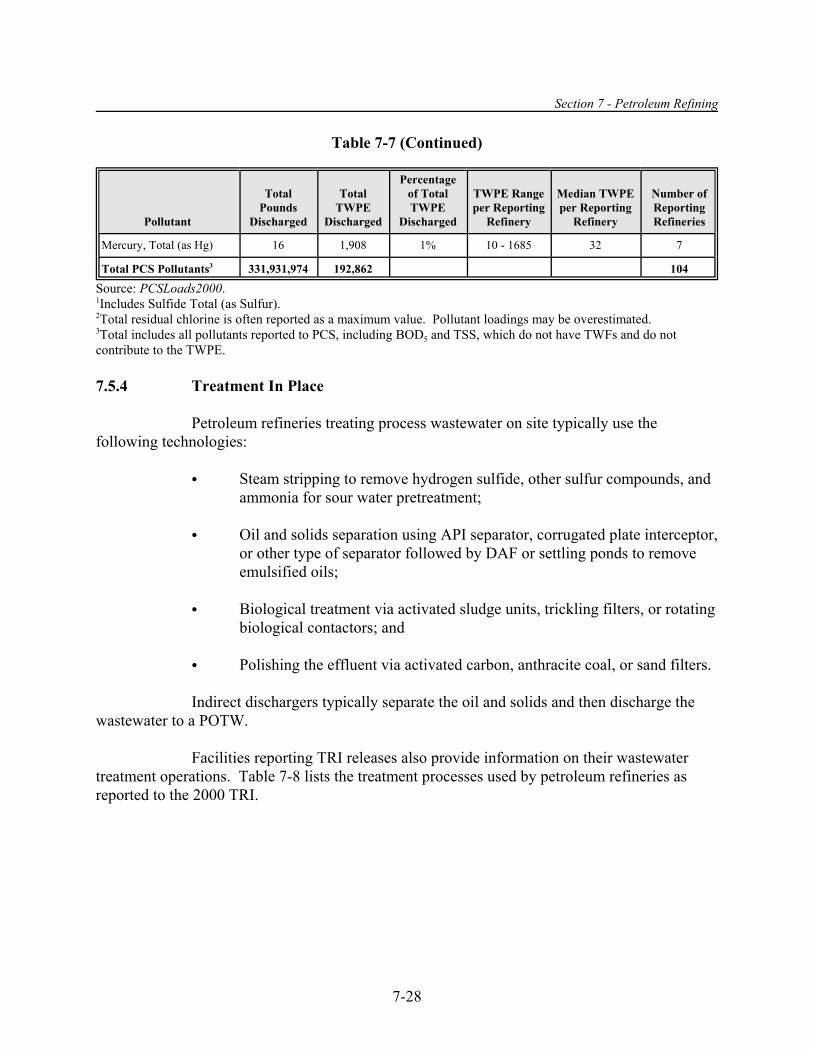
Mercury, Total (as Hg) 16 1,908 1% 10 - 1685 32 7
Total PCS Pollutants3 331,931,974 192,862 104
Source: PCSLoads2000.1Includes Sulfide Total (as Sulfur).2Total residual chlorine is often reported as a maximum value. Pollutant loadings may be overestimated.3Total includes all pollutants reported to PCS, including BOD5 and TSS, which do not have TWFs and do notcontribute to the TWPE.
7.5.4 Treatment In Place
Petroleum refineries treating process wastewater on site typically use the following technologies:
C Steam stripping to remove hydrogen sulfide, other sulfur compounds, and ammonia for sour water pretreatment;
C Oil and solids separation using API separator, corrugated plate interceptor, or other type of separator followed by DAF or settling ponds to remove emulsified oils;
C Biological treatment via activated sludge units, trickling filters, or rotating biological contactors; and
C Polishing the effluent via activated carbon, anthracite coal, or sand filters.
Indirect dischargers typically separate the oil and solids and then discharge the wastewater to a POTW.
Facilities reporting TRI releases also provide information on their wastewater treatment operations. Table 7-8 lists the treatment processes used by petroleum refineries as reported to the 2000 TRI.
7-28

7.6
Section 7 - Petroleum Refining
Table 7-8. Wastewater Treatment Operations Reported By Petroleum Refineries, TRI Reporting Year 2000
Number of Refineries Reporting Use
Direct1 Indirect1
Wastewater Treatment Technology (93 refineries) (18 refineries)
Steam stripping - in-process treatment that removes ammonia and 30 6 mercaptans from sour waters.
API separator - operated for oil recovery. Considered process step. 86 23 Separator effluent is the influent to the end-of-pipe wastewater treatment (count is for P15 oil skimming).
Dissolved air flotation - removes oils and particulate material prior to 66 17 biological treatment. DAF float is a listed hazardous waste.
Biological treatment - most refineries use aerobic biological treatment (activated sludge or aerated basins) to reduce wastewater organic carbon (BOD and COD) load. Biological treatment can also remove phenolic compounds.
1001 9
Sedimentation - always follows activated sludge basins. Separate 78 13 clarification might also follow aerated basins (count is for P11 settling/ clarification).
Polishing - sand, dual media, or multimedia filtration removes fine 33 6 particulate (count is for P12 filtration).
Activated carbon adsorption - removes soluble organic material and 14 1 some metals.
Source: TRIReleases2000. 1In TRIReleases2000, of the refineries that provided information on their wastewater treatment operations, 93 reported direct releases, 18 reported transfers to POTWs, and 9 reported both direct releases and transfers to POTWs. Therefore, the total refineries reporting a treatment technology might exceed the total number of direct or indirect dischargers.
Polycyclic Aromatic Compounds
PACs, sometimes known as polycyclic aromatic hydrocarbons (PAHs), are a class of organic compounds consisting of two or more fused aromatic rings. This section includes the following subsections:
C Section 7.6.1 - Identification and description of PACs;
C Section 7.6.2 - Estimation of TWPE for petroleum refineries;
C Section 7.6.3 - PAC sources at petroleum refineries;
C Section 7.6.4 - Reported PAC discharges;
7-29

Section 7 - Petroleum Refining
C Section 7.6.5 - Further analysis of PACs (including release estimation methods for TRI reporting and PAC concentrations in refinery final effluents);
C Section 7.6.6 - PAC control technologies; and
C Section 7.6.7 - Detailed study findings on PACs.
7.6.1 Identification and Description of PACs
Table 7-9 lists the 21 individual compounds in the PAC category for TRI reporting, Chemical Abstract Service (CAS) number, and related data.
Table 7-9. Individual Polycyclic Aromatic Compounds
PAC Compound CAS
Number
Toxic Weighting
Factor Potential
Carcinogen?1 Priority
Pollutant? Properties2
Benzo(a)anthracene 56-55-3 180.9752 T T Solubility: 0.0000014 g/100 mL Partition Coefficient: 5.61
Benzo(a)phenanthrene (chrysene)
218-01-9 2.1038 T Solubility: 0.00000018 g/100 mL
Benzo(a)pyrene 50-32-8 4283.5600 T T Solubility: 0.00000038 g/100 mL Partition Coefficient: 6.04
Benzo(b)fluoranthene 205-99-2 421.3560 T T Solubility: 0.00000012 g/100 mL Partition Coefficient: 6.12
Benzo(j)fluoranthene 205-82-3 T
Benzo(k)fluoranthene 207-08-9 42.1356 T T Solubility: 0.000000055 g/100 mL Partition Coefficient: 6.84
Benzo(j,k)fluorene (fluoranthene)
206-44-0 0.8030 T Solubility: 0.0000265 g/100 mL
Benzo(r,s,t)pentaphene 189-55-9 T
Dibenz(a,h)acridine 226-36-8 T
Dibenz(a,j)acridine 224-42-0 T
Dibenzo(a,h)anthracene 53-70-3 1693.0160 T T Solubility: 0.00000005 g/100 mL Partition Coefficient: 6.5
Dibenzo(a,e)fluoranthene 5385-75-1
Dibenzo(a,e)pyrene 192-65-4 T
Dibenzo(a,h)pyrene 189-64-0 T
Dibenzo(a,l)pyrene 191-30-0 T
7H-Dibenzo(e,g)carbazole 194-59-2 T
7,12-Dimethylbenz(a)anthracene 57-97-6 Solubility: <0.1 g/100 mL at 18 C
Indeno(1,2,3-cd)pyrene 193-39-5 1.1388 T T Solubility: 0.0000062 g/100 mL Partition Coefficient: 6.58
7-30

Section 7 - Petroleum Refining
Table 7-9 (Continued)
PAC Compound CAS
Number
Toxic Weighting
Factor Potential
Carcinogen?1 Priority
Pollutant? Properties2
3-Methylcholanthrene 56-49-5 Solubility: <0.01 g/100 mL at 18
5-Methylchrysene 3697-24-3 T
1-Nitropyrene 5522-43-0 Solubility: <0.1 g/100 mL at 18 C 1Source: U.S. Department of Health and Human Services. Report on Carcinogens, Tenth Edition. Public Health Service, National ToxicologyProgram, December 2002.2For comparison, benzene’s solubility is 0.18 g/100 mL and partition coefficient is 2.13.The partition coefficient is presented as log Kow.Source for solubilities: http://www.chemfinder.com.
7.6.2 Estimation of TWPE
For TRI, facilities must report the combined mass of PACs released, not releases of individual compounds. To calculate the TWPE for PAC discharges, EPA developed a refinery-specific PAC TWF based on the concentration of individual PACs in petroleum products and amount of products. The calculated TWF equals 230.43. See the Memorandum: Toxic Weighting Factor for Petroleum Refining Polycyclic Aromatic Compounds, 12/11/2003, DCN 00646 for further details (33).
Some petroleum refineries are required to report the discharge of individual PACs as a condition of their NPDES permits. These reported discharges are included in the PCS database. In these cases, EPA used the TWFs for the individual PACs to calculate their TWPE. Petroleum refineries are also sometimes required by permit to report discharges of “Polynuclear Aromatic Hydrocarbons per Method 610.” Method 610 is a wastewater analytical method for 16 compounds, eight of which are included on the TRI list of PACs. EPA does not have a TWF for PAHs, and therefore did not include Method 610 discharges in the TWPE calculation.
7.6.3 Sources at Petroleum Refineries
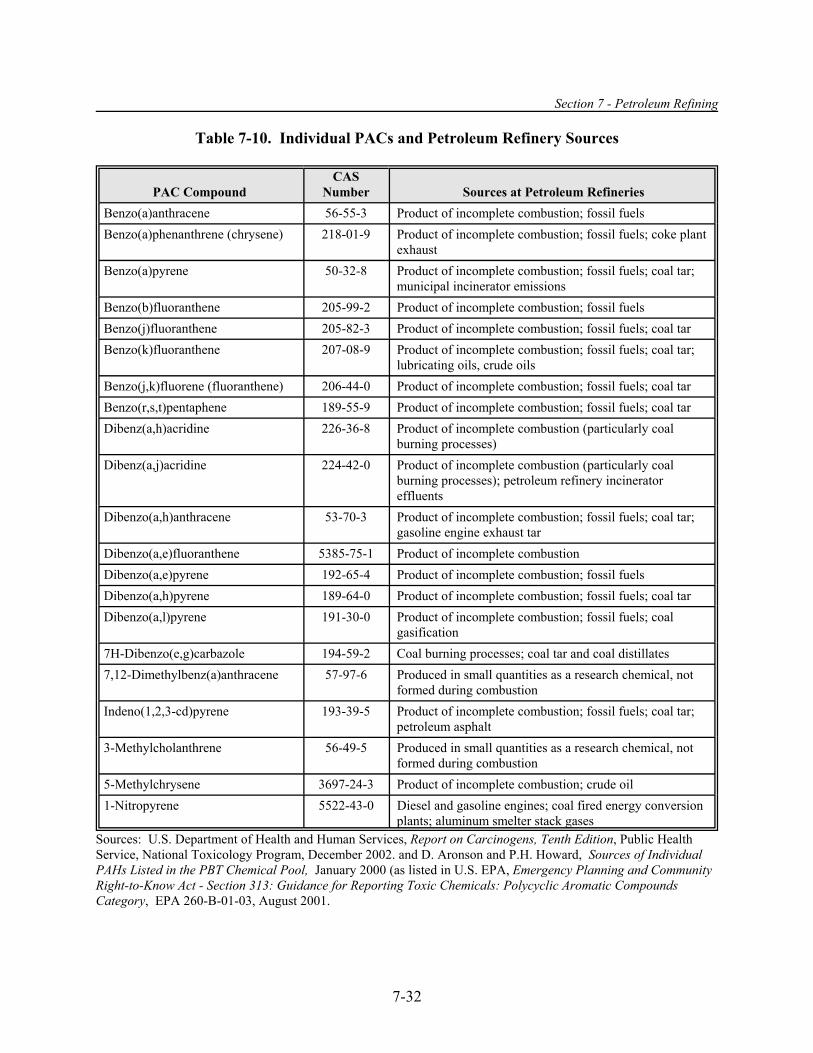
PACs are likely present in petroleum products such as crude oil, fuel oil, diesel fuel, gasoline, and paving asphalt (bituminous concrete) and refining by-products such as heavy oils, crude tars, and other residues. PAHs form due to incomplete combustion of organic compounds. PACs might be generated during the production of synthetic fuels and products from coal, petroleum, and other feedstocks at refineries (23, 30). Refinery process sources of PACs include cracking operations (thermal and catalytic) and crude petroleum storage when refineries remove PAC-containing water from tanks (37). Table 7-10 lists individual PACs and sources from petroleum refinery operations.
7-31
Section 7 - Petroleum Refining
Table 7-10. Individual PACs and Petroleum Refinery Sources
PAC Compound CAS
Number Sources at Petroleum Refineries Benzo(a)anthracene 56-55-3 Product of incomplete combustion; fossil fuels Benzo(a)phenanthrene (chrysene) 218-01-9 Product of incomplete combustion; fossil fuels; coke plant
exhaust Benzo(a)pyrene 50-32-8 Product of incomplete combustion; fossil fuels; coal tar;
municipal incinerator emissions Benzo(b)fluoranthene 205-99-2 Product of incomplete combustion; fossil fuels Benzo(j)fluoranthene 205-82-3 Product of incomplete combustion; fossil fuels; coal tar Benzo(k)fluoranthene 207-08-9 Product of incomplete combustion; fossil fuels; coal tar;
lubricating oils, crude oils Benzo(j,k)fluorene (fluoranthene) 206-44-0 Product of incomplete combustion; fossil fuels; coal tar Benzo(r,s,t)pentaphene 189-55-9 Product of incomplete combustion; fossil fuels; coal tar Dibenz(a,h)acridine 226-36-8 Product of incomplete combustion (particularly coal
burning processes) Dibenz(a,j)acridine 224-42-0 Product of incomplete combustion (particularly coal
burning processes); petroleum refinery incinerator effluents
Dibenzo(a,h)anthracene 53-70-3 Product of incomplete combustion; fossil fuels; coal tar; gasoline engine exhaust tar
Dibenzo(a,e)fluoranthene 5385-75-1 Product of incomplete combustion Dibenzo(a,e)pyrene 192-65-4 Product of incomplete combustion; fossil fuels Dibenzo(a,h)pyrene 189-64-0 Product of incomplete combustion; fossil fuels; coal tar Dibenzo(a,l)pyrene 191-30-0 Product of incomplete combustion; fossil fuels; coal
gasification 7H-Dibenzo(e,g)carbazole 194-59-2 Coal burning processes; coal tar and coal distillates 7,12-Dimethylbenz(a)anthracene 57-97-6 Produced in small quantities as a research chemical, not
formed during combustion Indeno(1,2,3-cd)pyrene 193-39-5 Product of incomplete combustion; fossil fuels; coal tar;
petroleum asphalt 3-Methylcholanthrene 56-49-5 Produced in small quantities as a research chemical, not
formed during combustion 5-Methylchrysene 3697-24-3 Product of incomplete combustion; crude oil 1-Nitropyrene 5522-43-0 Diesel and gasoline engines; coal fired energy conversion
plants; aluminum smelter stack gases Sources: U.S. Department of Health and Human Services, Report on Carcinogens, Tenth Edition, Public Health Service, National Toxicology Program, December 2002. and D. Aronson and P.H. Howard, Sources of Individual PAHs Listed in the PBT Chemical Pool, January 2000 (as listed in U.S. EPA, Emergency Planning and Community Right-to-Know Act - Section 313: Guidance for Reporting Toxic Chemicals: Polycyclic Aromatic Compounds Category, EPA 260-B-01-03, August 2001.
7-32

Section 7 - Petroleum Refining
7.6.4 Reported PAC Discharges
The estimated PACs loadings for the petroleum refining industry are based on data as reported to TRI for 2000. Nineteen refineries2 reported wastewater releases of PACs to TRI. Seven refineries reported discharges of individual PACs to PCS, but none of them reported detecting concentrations above analytical detection limits. As stated in Section 7.2.1, 94 percent of the refineries report to TRI; however, refineries report the releases of PACs only if they r exceed the reporting threshold. Refineries report PAC discharges to PCS only if required by their permits. This subsection discusses the following:
C Section 7.6.4.1 - TRI discharges reported by petroleum refineries;
C Section 7.6.4.2 - PCS discharges reported by petroleum refineries; and
C Section 7.6.4.3 - PAC data, including measurement data from activated sludge units and POTW final effluents, provided in comments regarding the Preliminary Plan.
7.6.4.1 TRI Discharges
As noted in Section 7.6.2, refineries report PAC discharges as a total category amount, not by individual compound. Table 7-11 presents the data reported to TRI and the calculated TWPE. Note that current guidance for reporting to TRI suggests using one-half the detection limit to estimate releases based on “nondetects”; therefore, the total discharges may be overestimated. This is confirmed by discussions with staff from EPA’s Office of Environmental Information (16) and comments from API and NPRA (1, 11).
7.6.4.2 PCS Discharges
For six California refineries, listed in Table 7-12, discharges of PAHs were included in PCS (see discussion in Section 7.6.2). For two of these six refineries, reported PAH concentrations were above the method detection limit. Because EPA does not have a TWF for this parameter, it did not calculate TWPEs for these discharges.
In addition, American Western Refining, Lawrenceville IL (NPDES IL0004219), is required to report polynuclear aromatics (polyram), but did not detect the pollutant in 2000.
2Two additional refineries, Calcasieu (Lake Charles, LA) and Frontier (El Dorado, KS) each reported releases to surface water of 1.1 pounds of PACs in 2000. However, these refinery releases were not included in TRIReleases2000.
7-33

-- -- --
-- -- --
-- --
-- -- --
-- -- --
-- -- --
-- -- --
-- -- --
-- -- --
-- -- --
-- -- --
-- -- --
-- -- --
-- -- --
-- -- --
-- --
-- --
-- --
Section 7 - Petroleum Refining
Table 7-11. Petroleum Refineries Reporting Releases of PACs to the 2000 TRI1
7-34
TRI ID Number Refinery Refinery Location
Direct Discharge
(lb/yr)
Direct Discharge (TWPE)
To POTW (lb/yr)
After POTW (lb/yr)2
After POTW (TWPE)
77592TXSCTLOOP1 Valero Refining Co. Texas Texas City, TX 64 14,748
94572NCLSNOLDHI Tosco San Francisco Refinery Rodeo, CA 57 13,135
70037LLNCRHIGHW Tosco Refining Co. Alliance Refinery Belle Chasse, LA 40 9,217
70669CNCLKOLDSP Conoco Lake Charles Refinery Westlake, LA 22 5,069
96707CHVRN91480 Chevron Prods. Co. Hawaii Refinery Kapolei, HI 20 4,609
99611TSRLSMILE2 Tesoro Alaska Co. Kenai Refinery Kenai, AK 19 4,378
39567CHVRNPOBOX Chevron Prods. Co. Pascagoula Refinery Pascagoula, MS 17 3,917
62454MRTHNMARAT Marathon Ashland Petroleum LLC Robinson, IL 15 3,456
62084SHLLLRTE11 Tosco Wood River Refinery Roxana, IL 10 2,304
74603CNCPN1000S Conoco Inc. Ponca City Refinery Ponca City, OK 9 2,074
84116CHVRN2351N Chevron USA Prods. Co Salt Lake City, UT 8 1,843
80022CNCDN5801B Conoco Denver Refinery Commerce City, CO 5 1,152
70047TRNSM14902 Orion Refining Corp. New Sarpy, LA 4 922
90744TXCRF2101E Equilon Enterprises LLC Los Angeles Refining Wilmington, CA 2 461 16 1 270
00851HSSLVLIMET Hovensa L.L.C. Christiansted, VI 2 461
77017LYNDL12000 Lyondell-Citgo Refining L.P. Houston, TX 2,380 175 40,360
77506CRWNC111RE Crown Central Petroleum Corp. Houston Refinery Pasadena, TX 97 7 1,644
48217MRTHN1300S Marathon Ashland Petroleum L.L.C. Detroit, MI 81 6 1,374
79905CHVRN6501T Chevron USA El Paso Refinery El Paso, TX 55 4 932 Source: TRIReleases2000.1Two additional refineries, Calcasieu, Lake Charles, LA and Frontier, El Dorado, Kansas each reported 1.1 lb/year PAC released to surface water. However, EPA did not include these releases inTRIReleases2000. 2Mass transferred to POTW that is ultimately discharged to surface waters. Accounts for POTW removals.

Section 7 - Petroleum Refining
Table 7-12. California Refineries Reporting PAH Discharges
NPDES Permit Number Refinery Name Location
Table 7-13 Refinery Number PAHs, lb/yr
CA0000051 Conoco Arroyo Grande, CA 61 0
CA0004961 Tesoro Refining & Marketing Co. Martinez, CA 0.13
CA0005053 Tosco Refining Company Rodeo, CA 0
CA0005134 Chevron Products Company Richmond, CA 12 1.5
CA0005789 Shell Oil Products US Martinez, CA 0
CA0055387 Mobil Oil Corp. Torrance, CA 73 0 Source: PCSLoads2000.1Refinery also monitors for the individual PAC, benzo(j,k)fluorene (fluoranthene). See Table 7-13.2Refinery also monitors for eight individual PACs (see Table 7-13), none of which were detected in 2000.
Table 7-13 lists the PACs that each of the seven refineries shown in the table must monitor as required by their NPDES permits. However, none of the refineries reported discharge concentrations above method detection limits in 2000.
Table 7-13. Individual PACs Reported in 2000 PCS
Pollutant Refinery Number (see bottom of table)
1 2 3 4 5 6 7
Benzo(a)pyrene T T T T T
Dibenzo(a,h)anthracene T T T
Benzo(b)fluoranthene T T T T
Benzo(a)anthracene T T T T
Benzo(k)fluoranthene T T T T T
Benzo(a)phenanthrene (chrysene) T T T T T
Indeno(1,2,3-cd)pyrene T T T
Benzo(j,k) fluorene (fluoranthene) T T T T T T
1. Chevron (Richmond, CA) 2. Valero Refining (Benecia, CA) 3. Bayway Refinery (Linden, NJ) 4. Conoco Phillips (Borger, TX) 5. Murphy Oil (Superior, WI) 6. Conoco Phillips (Aroyo Grande, CA) 7. Mobil Oil (Torrance, CA)
NPDES Permit CA0005134 NPDES Permit CA0005550 NPDES Permit NJ0001511 NPDES Permit TX0009148 NPDES Permit WI0003085 NPDES Permit CA0000051 NPDES Permit CA0055387
7-35

Section 7 - Petroleum Refining
7.6.4.3 Data Provided in Comments Regarding Preliminary Plan
As discussed in Section 7.2.1.4, API provided effluent data for activated sludge units at 10 refineries. These data, collected from 1993 to1994, show that individual PACs were never measured above detection limits. Table 7-14 includes the PAC measurement data from API’s comment (1).
Table 7-14. PAC Measurement Data from Activated Sludge Units at 10 Refineries
PAC Compound Number of
Samples Minimum Median Maximum
Number of Samples > Detection
Limit
Benzo(a)anthracene 26 <0.1 <10 <11 0
Benzo(a)phenanthrene (chrysene) 26 <0.2 <10 <11 0
Benzo(a)pyrene 26 <0.2 <10 <11 0
Benzo(b)fluoranthene 26 <0.2 <10 <11 0
Benzo(k)fluoranthene 26 <0.2 <10 <11 0
Benzo(j,k)fluorene (fluoranthene) 26 <0.6 <10 <11 0
Dibenz(a,h)acridine 1 <0.1 <0.1 <0.1 0
Dibenzo(a,h)anthracene 26 <0.3 <10 <11 0
Dibenzo(a,e)pyrene 1 <25 <25 <25 0
7,12-Dimethylbenz(a)anthracene 2 <10 <10 <10 0
Indeno(1,2,3-cd)pyrene 25 <0.2 <10 <11 0
3-Methylcholanthrene 24 <10 <10 <11 0 Source: American Petroleum Institute, Comments Re. Notice of Preliminary Effluent Guidelines Program Plan, March 18, 2004.
The County Sanitation Districts of Los Angeles County (the Districts) provided sampling results (1984-1993) from 13 refineries for EPA’s 1996 Preliminary Data Summary. EPA published the results of the sampling in Table 6-2 of the 1996 Preliminary Data Summary. Benzo(a)phenanthrene (chrysene) was detected once, slightly above the method detection level, at a concentration of 10.5 ug/L (24).
The Districts’ comments (3) also state that currently no PACs are found in the final effluent or biosolids from the Joint Water Pollution Control Plant (JWPCP). The JWPCP currently receives wastewater from 10 refineries. The Districts’ NPDES permit requires monitoring for the following 13 individual PAHs (five included in the PAC category):
7-36

Section 7 - Petroleum Refining
C Acenaphthylene; C Benzo(a)phenanthrene (chrysene) C Anthracene; (PAC chemical); C 1,2-benzanthracene; C Dibenzo(a,h)anthracene (PAC C 3,4-benzofluoranthene; chemical); C Benzo(k)fluoranthene (PAC C Flourene;
chemical); C Indeno (1,2,3-cd) pyrene (PAC C 1,12-benzoperylene; chemical); and C Pyrene; C Phenanthrene C Benzo(a)pyrene (PAC chemical);
The Districts also reviewed the data reported to TRI in 2000 for the 10 refineries discharging to the JWPCP and found that none reported releases of PACs. The Districts noted that the refinery discharges have little particulate matter. Since PACs tend to accumulate in the solids, the low discharges of particulate matter may explain the absence of PACs in releases to the POTW. The Districts have not performed any screening analysis for trace quantities of PAHs.
7.6.5 Further Analysis of PACs
EPA performed further analysis of PAC discharges to determine if effluent limitations and guidelines would be appropriate for this pollutant. As discussed in Section 7.2.1.4, EPA received comments from NPRA and API concerning the TRI estimates of PACs discharges. The comments explained that 2000 was the first year industry was required to report releases of PACs to TRI. The comments further noted that even if refineries do not detect PACs in the effluent, they may estimate the mass released based on one-half the detection limit, and thus over-report PAC discharges to TRI. Table 7-15 summarizes the refinery-specific comments concerning PAC discharge estimates reported to the 2000 TRI. Table 7-15 also presents the basis for the facility estimate of PAC releases reported to TRI. EPA confirmed that PACs were measured above method detection limits in Lyondell Citgo’s discharge to the Washburn Tunnel Facility (part of the Gulf Coast Waste Disposal Authority); however, PACs are not detected in the Washburn Tunnel Facility’s discharge to surface water (10, 14). EPA could not confirm that PACs were measured in the discharges of any other refinery reporting PACs releases to TRI in 2000.
EPA estimated the concentration of PACs in refinery effluents using the discharges reported to TRI and process wastewater flow rate reported to PCS3, and compared these estimated concentrations to Method 1625 analytical detection limits for individual PACs. If a refinery reporting to TRI did not report a flow rate to PCS, or if the reported flow rate
3EPA calculated the wastewater flow rates from outfalls discharging BOD5 and/or ammonia to estimate refinery process wastewater flows, because PCS does not consistently identify which discharges are process wastewater. Effluent limitations guidelines apply to BOD5 and ammonia in refinery process wastewater discharges, but not cooling water and stormwater.
7-37

Section 7 - Petroleum Refining
Table 7-15. NPRA and API Comments on PAC Discharge Estimates Reported to the 2000 TRI
7-38
Basis of TRI1 PAC Estimate for
TRI ID Refinery Refinery Location Discharge
(lb/yr) Measured
PACs? TRI Releases
20002 NPRA and API Comments on PAC Discharge
Estimate
77592TXSCTLOOP1 Valero Refining Co. Texas Texas City, TX 64 No M Estimate based on ½ the detection limit. One sample contained PACs.
94572NCLSNOLDHI Tosco San Francisco Refinery Rodeo, CA 57 No M Estimate based on ½ the detection limit.
70037LLNCRHIGHW Tosco Refining Co. Alliance Refinery
Belle Chasse, LA 40 No O Estimate based on ½ the detection limit.
70669CNCLKOLDSP Conoco Lake Charles Refinery Westlake, LA 22 No O No comments.
96707CHVRN91480 Chevron Prods. Co. Hawaii Refinery
Kapolei, HI 20 Unknown M No comments.
99611TSRLSMILE2 Tesoro Alaska Co. Kenai Refinery Kenai, AK 19 No O No change to estimate.
39567CHVRNPOBOX Chevron Prods. Co. Pascagoula Refinery
Pascagoula, MS 17 No O No comments.
62454MRTHNMARAT Marathon Ashland Petroleum LLC Robinson, IL 15 No O No comments.
62084SHLLLRTE11 Tosco Wood River Refinery Roxana, IL 10 No O Estimate based on ½ the detection limit.
74603CNCPN1000S Conoco Inc. Ponca City Refinery Ponca City, OK 9 No O Refinery estimated discharge using API data for PACs in petroleum products.
84116CHVRN2351N Chevron USA Prods. Co Salt Lake City, UT 8 No O No comments.
16344PNNZL2MAIN Calumet Lubricants Co. Rouseville Plant
Rouseville, PA 5 No O Closed January 1, 2002. Not a refinery (SIC code 2999 Petroleum Products NEC).
80022CNCDN5801B Conoco Denver Refinery Commerce City, CO
5 No O Estimate based on internally generated factors.
70047TRNSM14902 Orion Refining Corp. New Sarpy, LA 4 No C Estimate based on ½ the detection limit.
90744TXCRF2101E Equilon Enterprises LLC Los Angeles Refining
Wilmington, CA 3 No O No comments.
00851HSSLVLIMET Hovensa L.L.C. Christiansted, VI 2 No O Discharge from accidental spill; monitoring data indicate zero discharge of PACs.
77017LYNDL12000 Lyondell-Citgo Refining L.P. Houston, TX 2,380 Yes NA Indirect discharger - PACs were not detected in the POTW effluent.
77506CRWNC111RE Crown Central Petroleum Corp. Houston Refinery
Pasadena, TX 97 Unknown NA Indirect discharger - PACs were not detected in the POTW effluent.

Section 7 - Petroleum Refining
Table 7-15 (Continued)
TRI ID Refinery Refinery Location
TRI1 PAC Discharge
(lb/yr) Measured
PACs?
Basis of Estimate for TRI Releases
20002 NPRA and API Comments on PAC Discharge
Estimate
48217MRTHN1300S Marathon Ashland Petroleum L.L.C.
Detroit, MI 6 Unknown NA No comments.
79905CHVRN6501T Chevron USA El Paso Refinery El Paso, TX 56 No NA Estimate based on ½ the detection limit.
70606CLCSRWESTE Calcasieu Lake Charles, LA 1.1 Unknown M Not in TRIReleases2000: 1.1 lb/yr discharge PACs reported to TRI.
67042TXCRF1401S Frontier El Dorado, KS 1.1 Unknown O Not in TRIReleases2000: 1.1 lb/yr discharge PACs based on discharges at similar refinery reported to TRI.
1Mass transferred to POTW that is ultimately discharged to surface waters. Accounts for POTW removals.2Refineries reported basis of estimate in 2000 TRI as: M - Monitoring data/measurements; C - Mass balance calculations; E - Published emission factors; and O - Other approaches (e.g., engineeringcalculations). NA means the refinery did not report the basis of its estimate.7-39

Section 7 - Petroleum Refining
seemed unreasonably high, EPA did not calculate PAC concentrations for that refinery. To compare concentrations to detection limits, EPA had to estimate concentrations for individual compounds, even though refineries report the total mass of PACs released to TRI. To do this, EPA assumed the distribution of individual PACs reported released was proportional to the concentration of individual PACs in petroleum products and the amount of the various products processed by the refining industry. EPA used this same distribution to calculate the PAC TWF for the petroleum refining industry (see Section 7.6.2). Table 7-16 lists the calculated concentrations of individual PACs in the refinery wastewater. The table also lists each compound’s detection limit for Method 1625 as a comparison. As shown in the table, the individual PAC concentrations in the effluent are much lower than individual PAC detection limits, suggesting that individual PACs are not present in treated refinery wastewater above method detection limits.
For some pollutants, one refining process may be the primary source of the pollutant loadings to the treatment system. The in-process wastewater stream from this one process may contain high concentrations of the pollutant before dilution occurs with other refinery wastewater. In these cases, dedicated pretreatment might be effective in removing the pollutant. Based on the data for the detailed review, EPA did not identify an in-process waste stream with high concentrations of PACs or an in-process PAC source that could be controlled.
Because of the low water solubility and high octanol water partition coefficient of PACs, they are likely to partition from water to oily and solids phases. Subsequently, PACs are removed with oils and solids from the refinery wastewater through existing on-site treatment (oil in oil/water separators, solids in biological treatment, and sludge in clarifiers and polishing units).
7.6.6 PAC Control Technologies
Based on the information collected to date, EPA concludes that the PAC concentration in refinery wastewater is typically below treatable levels; however, refineries can use pollution prevention opportunities to reduce the possible contamination of refinery wastewaters by PACs. The main pollution prevention steps that refineries can take are to identify and correct any leaks quickly and to have controls in place to prevent petroleum spills from reaching any sewers or other waters.
If a refinery identifies any oily wastewater streams with high levels of PACs, it can treat the wastewater in an oil/water separator. PACs generally partition into the oil phase. The oil may then be reused at the refinery or managed as waste. Refineries can also use granular activated to remove water-phase PACs from pretreated wastewater.
7-40

Section 7 - Petroleum Refining
Table 7-16. Estimated Concentration of PACs in Petroleum Refining Effluent
7-41
Refinery Information Estimated Individual PAC Concentration in Effluent (ug/L)
TRI Reported Pounds Flowb Fluoran- Benz(a) Benzo(b) Benzo(j) Benzo(k) Benzo(a) Indeno(1,2,3- Dibenz(a,h)
State Dischargeda (Mgal/yr) thene anthracene Chrysene fluoranthene fluoranthene fluoranthene pyrene cd)pyrene anthracene
Detection Limitsc (ug/L) 10 10 10 10 10 10 10 20 20
AK 19 138 4.00 2.88 7.62 0.45 0.06 0.12 0.69 <0.00 0.07
CA 57 850 1.95 1.40 3.72 0.22 0.03 0.06 0.34 <0.00 0.03
CO 5 727 0.20 0.14 0.38 0.02 <0.00 0.01 0.03 <0.00 <0.00
HI 20 1,171 0.50 0.36 0.95 0.06 0.01 0.01 0.09 <0.00 0.01
IL 10 2,439 0.12 0.09 0.23 0.01 <0.00 <0.00 0.02 <0.00 <0.00
IL 15 1,615 0.27 0.19 0.52 0.03 <0.00 0.01 0.05 <0.00 <0.00
LA 22 1,343 0.48 0.34 0.91 0.05 0.01 0.01 0.08 <0.00 0.01
MS 17 2,238 0.22 0.16 0.42 0.02 <0.00 0.01 0.04 <0.00 <0.00
OK 9 991 0.27 0.19 0.50 0.03 <0.00 0.01 0.05 <0.00 <0.00
TX 64 766 2.44 1.75 4.64 0.27 0.04 0.07 0.42 <0.00 0.04
UT 8 290 0.80 0.58 1.53 0.09 0.01 0.02 0.14 <0.00 0.01 Source: ERG. Memorandum: Estimated Concentrations for the Petroleum Refining Industry.1Total pounds reported by each refinery is distributed to individual compounds using PAC compositions obtained in the Memorandum: Toxic Weighting Factor for Petroleum Refining PolycyclicAromatic Compounds, 12/11/2003, DCN 00646.2Flow is obtained from PCS and is only for outfalls with nonzero discharges of ammonia or BOD5.3Source: EPA Method 1625, Semivolatile Organic Compounds by Isotope Dilution GC/MS.

C
Section 7 - Petroleum Refining
7.6.7 Detailed Study Findings on PACs
Below is a summary of the findings of EPA’s detailed study of refinery PACs.
PACs are a group of 21 individual compounds, some of which are present in petroleum products. U.S. industrial facilities were first required to report PAC releases to TRI for reporting year 2000. Using TRI data as reported (and accounting for POTW removals), EPA estimated that petroleum refineries released 487 pounds of PACs to surface water in 2000.
C EPA calculated the TWPE of PACs released from petroleum refineries using an industry-specific TWF, based on the concentration of individual PACs in petroleum products and the amount of products processed by the refining industry. Using TRI data, EPA estimated that refineries discharged 112,329 TWPE of PACs in 2000.
C For TRI reporting year 2000, 19 refineries reported PAC releases to wastewater. EPA determined that most of the reported releases were not based on measured concentrations in refinery effluents. Even where effluent concentrations were measured and individual PACs were not detected, refineries estimated releases using one-half the analytical detection limit and refinery effluent flow rate.
C EPA confirmed that PACs were measured above method detection limits in the discharge of Lyondell Citgo to the Washburn Tunnel Facility (part of the Gulf Coast Waste Disposal Authority); however, PACs are not detected in the Washburn Tunnel Facility’s discharge to surface water. EPA could not confirm that PACs were measured in the discharges of any other refinery reporting PACs releases to TRI in 2000.
C Ten refineries have NPDES permit limits for PAHs (16 compounds measured by Method 610) or individual PACs. Eight individual PAH compounds are also included in the PAC compounds category reportable to TRI. In 2000, none of the refineries reporting to PCS measured individual PACs above detection limits. Two of six refineries required to monitor for PAHs (Chevron Products Company in Richmond, CA and Tesoro Refining & Marketing Company in Martinez, CA) reported PAH concentrations above detection limits. The Chevron Products Company (Richmond, CA) also monitors for eight individual PACs, none of which were detected in 2000.
C In comments submitted on the 2003 annual review, API provided effluent data collected at 10 refineries in 1993-1994. These data show individual PACs were never measured above analytical detection limits.
7-42

Section 7 - Petroleum Refining
C EPA estimated concentrations of PACs using discharges as reported to TRI and process wastewater flow rate from PCS and compared these estimated concentrations to Method 1625 analytical detection limits for individual PACs. In all cases, estimated compound concentrations were much lower than Method 1625 detection limits.
C EPA did not identify an in-process wastestream with high concentrations of PACs, and so it similarly did not identify appropriate in-process treatment technology.
Based on these findings, EPA concludes that other than potential leaks and spills of crude oil and petroleum products, there is no obvious source of PAC releases to refinery wastewaters. EPA also concludes that there is little evidence that PACs are present in concentrations above the detection level in refinery wastewater discharges.
7.7 Dioxins
The term ‘dioxins’ refers to polychlorinated dibenzo-p-dioxins (CDDs) and polychlorinated dibenzofurans (CDFs). These groups of chemicals are termed ‘dioxin-like,’ because they have similar chemical structure, similar physical-chemical properties, and invoke a common battery of toxic responses. CDDs and CDFs must have chlorine substitution of hydrogen atoms at the 2, 3, 7, and 8 positions on the benzene rings (29). This section includes the following subsections:
C Section 7.7.1 - Identification and description of dioxins;
C Section 7.7.2 - Estimation of TWPE for petroleum refineries;
C Section 7.7.3 - Dioxin sources at petroleum refineries;
C Section 7.7.4 - Reported dioxin discharges;
C Section 7.7.5 - Compilation and discussion of measured effluent dioxinconcentrations;
C Section 7.7.6 - Dioxin control technologies; and
C Section 7.7.7 - Detailed study findings for dioxins.
7.7.1 Identification and Description of Dioxins
Table 7-17 lists the 17 individual compounds (congeners) included in the TRI dioxin and dioxin-like category, and their CAS numbers. See Section 4.2.4.2 for more discussion of dioxins.
7-43

Section 7 - Petroleum Refining
Table 7-17. Individual Dioxin Congeners
CAS Number Chemical Name Abbreviated Name
CDDs
1746-01-6 2,3,7,8-tetrachlorodibenzo-p-dioxin 2,3,7,8-TCDD
40321-76-4 1,2,3,7,8-pentachlorodibenzo-p-dioxin 1,2,3,7,8-PeCDD
39227-28-6 1,2,3,4,7,8-hexachlorodibenzo-p-dioxin 1,2,3,4,7,8-HxCDD
57653-85-7 1,2,3,6,7,8-hexachlorodibenzo-p-dioxin 1,2,3,6,7,8-HxCDD
19408-74-3 1,2,3,7,8,9-hexachlorodibenzo-p-dioxin 1,2,3,7,8,9-HxCDD
35822-46-9 1,2,3,4,6,7,8-heptachlorodibenzo-p-dioxin 1,2,3,4,6,7,8-HpCDD
3268-87-9 1,2,3,4,6,7,8,9-octachlorodibenzo-p-dioxin 1,2,3,4,6,7,8,9-OCDD
CDFs
51207-31-9 2,3,7,8-tetrachlorodibenzofuran 2,3,7,8-TCDF
57117-41-6 1,2,3,7,8-pentachlorodibenzofuran 1,2,3,7,8-PeCDF
57117-31-4 2,3,4,7,8-pentachlorodibenzofuran 2,3,4,7,8-PeCDF
70648-26-9 1,2,3,4,7,8-hexachlorodibenzofuran 1,2,3,4,7,8-HxCDF
57117-44-9 1,2,3,6,7,8-hexachlorodibenzofuran 1,2,3,6,7,8-HxCDF
72918-21-9 1,2,3,7,8,9-hexachlorodibenzofuran 1,2,3,7,8,9-HxCDF
60851-34-5 2,3,4,6,7,8-hexachlorodibenzofuran 2,3,4,6,7,8-HxCDF
67562-39-4 1,2,3,4,6,7,8-heptachlorodibenzofuran 1,2,3,4,6,7,8-HpCDF
55673-89-7 1,2,3,4,7,8,9-heptachlorodibenzofuran 1,2,3,4,7,8,9-HpCDF
39001-02-0 1,2,3,4,6,7,8,9-octachlorodibenzofuran 1,2,3,4,6,7,8,9-OCDF
Because of their extremely low water solubility and hydrophobicity, dioxins most often associate with particulate matter in wastewater matrices (24).
7.7.2 Estimation of TWPE
Facilities report to TRI the combined mass of dioxin-like compounds released to the environment. As discussed in 4.2.4.2, facilities also report the distribution of each individual chemical (congener) in the dioxin category. Facilities report only a single distribution to TRI, even though dioxins might be released to more than one medium, and may be distributed differently in different media. Lacking other information, EPA assumed the distribution reported applies to the wastewater discharges.
EPA has TWFs for each of the 17 dioxin congeners. Seventeen petroleum refineries reported water discharges of dioxins, but only five reported the distribution of the 17 congeners. For each refinery reporting congener distribution, EPA used the reported distribution to estimate the mass of each congener in the refinery’s wastewater releases. EPA calculated
7-44

Section 7 - Petroleum Refining
dioxin TWPEs by multiplying the estimated mass of each congener by its TWF4. If no congener distribution was reported, EPA used the refinery industry average distribution to calculate the mass of each congener.
7.7.3 Dioxin Sources at Petroleum Refineries
Dioxin and dioxin-like compounds are not manufactured, but are generated as by-products of certain chemical and combustion processes. As discussed in Section 7.3.3.3, EPA identified catalyst regeneration operations for the catalytic reforming process as the source of dioxins generated at petroleum refineries (24, page G-1). Smaller quantities of dioxins might be generated in isomerization units (37). See Section 7.3.3.3 for a detailed description of reforming catalyst wastewater generation.
7.7.4 Reported Dioxin Discharges
Seventeen refineries reported wastewater releases of dioxins to TRI in 2000, but PCS includes results of NPDES-permit-required monitoring for only three refineries (all three monitor for 2,3,7,8-TCDD, the most toxic form, or TCDD equivalents (TEQ)). EPA obtained additional information on refinery dioxin discharges from EPA’s 1996 Preliminary Data Summary, Washington State Department of Ecology sampling data, BP Amoco, Toledo Refinery, and Tosco Refining Company Avon Refinery’s Dioxin Source Investigation. Each of these sources is described below.
7.7.4.1 TRI Discharges
As noted in Section 7.7.2, refineries report the dioxin discharges as a total category amount with the option to also report a congener distribution. Sixteen petroleum refineries reported releases of dioxins to surface water in 2000. One refinery reported dioxin transfers to a POTW. Note that current guidance for reporting to TRI suggests using one-half the detection limit to estimate releases based on “nondetects”; therefore, the total discharges might be overestimated. Table 7-18 presents the data reported to TRI and the calculated TWPE.
4EPA revised the TWFs for dioxins in 2004. The memorandum entitled Revisions to TWFs for Dioxin and its Congeners and Recalculated TWPEs for OCPSF and Petroleum Refining (available in the docket) presents the estimated TWPE for petroleum refineries using the revised TWFs.
7-45
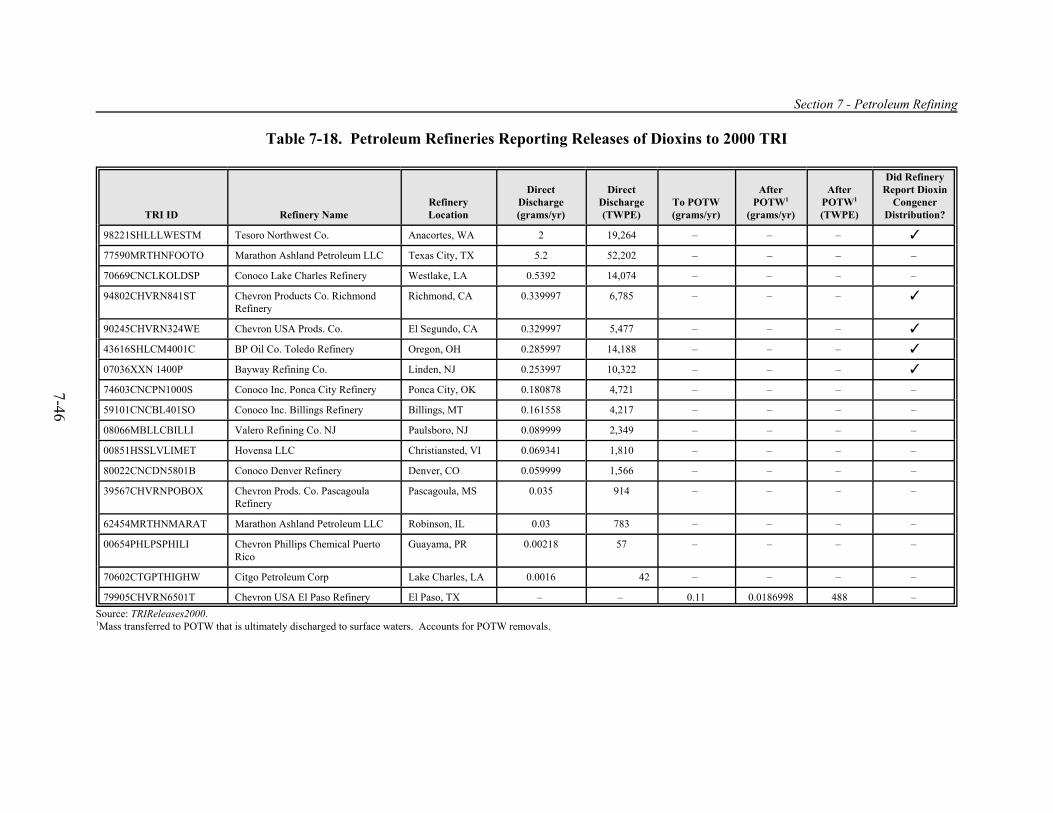
Section 7 - Petroleum Refining
Table 7-18. Petroleum Refineries Reporting Releases of Dioxins to 2000 TRI
7-46
TRI ID Refinery Name Refinery Location
Direct Discharge (grams/yr)
Direct Discharge (TWPE)
To POTW (grams/yr)
After POTW1
(grams/yr)
After POTW1
(TWPE)
Did Refinery Report Dioxin
Congener Distribution?
98221SHLLLWESTM Tesoro Northwest Co. Anacortes, WA 2 19,264 – – – T
77590MRTHNFOOTO Marathon Ashland Petroleum LLC Texas City, TX 5.2 52,202 – – – –
70669CNCLKOLDSP Conoco Lake Charles Refinery Westlake, LA 0.5392 14,074 – – – –
94802CHVRN841ST Chevron Products Co. Richmond Refinery
Richmond, CA 0.339997 6,785 – – – T
90245CHVRN324WE Chevron USA Prods. Co. El Segundo, CA 0.329997 5,477 – – – T
43616SHLCM4001C BP Oil Co. Toledo Refinery Oregon, OH 0.285997 14,188 – – – T
07036XXN 1400P Bayway Refining Co. Linden, NJ 0.253997 10,322 – – – T
74603CNCPN1000S Conoco Inc. Ponca City Refinery Ponca City, OK 0.180878 4,721 – – – –
59101CNCBL401SO Conoco Inc. Billings Refinery Billings, MT 0.161558 4,217 – – – –
08066MBLLCBILLI Valero Refining Co. NJ Paulsboro, NJ 0.089999 2,349 – – – –
00851HSSLVLIMET Hovensa LLC Christiansted, VI 0.069341 1,810 – – – –
80022CNCDN5801B Conoco Denver Refinery Denver, CO 0.059999 1,566 – – – –
39567CHVRNPOBOX Chevron Prods. Co. Pascagoula Refinery
Pascagoula, MS 0.035 914 – – – –
62454MRTHNMARAT Marathon Ashland Petroleum LLC Robinson, IL 0.03 783 – – – –
00654PHLPSPHILI Chevron Phillips Chemical Puerto Rico
Guayama, PR 0.00218 57 – – – –
70602CTGPTHIGHW Citgo Petroleum Corp Lake Charles, LA 0.0016 42 – – – –
79905CHVRN6501T Chevron USA El Paso Refinery El Paso, TX – – 0.11 0.0186998 488 – Source: TRIReleases2000.1Mass transferred to POTW that is ultimately discharged to surface waters. Accounts for POTW removals.

Section 7 - Petroleum Refining
7.7.4.2 PCS Discharges
Three petroleum refineries, listed in Table 7-19, have NPDES permits in 2000 that required them to monitor their effluent for 2,3,7,8-TCDD or TCDD equivalents. One refinery (Tesoro Refining, Martinez, CA) detected dioxins in its effluent in 2000. The Tesoro refinery reports dioxin concentrations as TCDD equivalents. See Section 7.7.4.4 for further discussion of dioxin concentrations measured in petroleum refinery final effluents.
Table 7-19. Petroleum Refineries Reporting 2,3,7,8-TCDD to the 2000 PCS
NPDES ID Refinery Name Refinery Location Direct Discharge (milligrams/yr)
Direct Discharge (TWPE/yr)
AL0055859 Shell Oil Mobile Saraland, AL 0 0
CA0004961 Tesoro Refining Martinez, CA 0.6641 617.24
WI0003085 Murphy Oil USA Inc Superior, WI 0 0 Source: PCSLoads2000.1Refinery reports TCDD equivalents.
7.7.4.3 In-Plant Monitoring
Washington State Department of Ecology Sampling
In NPDES permits it recently issued, Washington State Department of Ecology required four petroleum refineries to collect samples of catalytic reformer regeneration wastewaters, final effluent, and API separator sludge, and to analyze these samples for dioxins using EPA Method 1613b for wastewater and Method 8290 for sludge. Table 7-20 provides information on each of the refineries and samples.
EPA Sampling in Support of 1996 Preliminary Data Summary (PDS)
In the early 1990s, EPA conducted three sampling episodes at California petroleum refineries. Tables 6.8 through 6.9 of the 1996 Preliminary Data Summary (24) present chlorinated dioxin and furan analytical data obtained from this sampling program. The Agency collected samples of regeneration wastewater from Chevron (Richmond, CA); Tosco (Martinez, CA); and Unocal (Rodeo, CA). EPA conducted the study, in part, so that it could develop dioxin analytical methods for analyzing refinery wastewaters. The Chevron samples were analyzed for dioxins by Method 8290 and the samples from the other two refineries were analyzed by Method 1613.
7-47

Section 7 - Petroleum Refining
Table 7-20. Dioxin Sampling Data from Washington State Refineries (2000-2003)
7-48
Regeneration Time for Type of Capacity Discharge Discharge Regeneration
Refinery Location Regeneration (barrels/day) Regeneration Episode/Sample Name (gallons/min) (gallons) (hours)
Tesoro Northwest Co. Anacortes, WA Cyclic 24,300 Regeneration wastewater: Round 1 Regeneration wastewater: Round 2 Final effluent: Round 1
22 22 –
293,000 364,000
3,073,000
222 276 –
Final effluent: Round 2 – 2,088,000 – API sludge: Round 1 API sludge: Round 2
– –
116,000 dry lbs unavailable
– –
U.S. Oil & Refining Co. Tacoma, WA Semi-regenerative 5,750 Regeneration wastewater: CRU1-1 Regeneration wastewater: CRU1-2 Regeneration wastewater: CRU2-1 Regeneration wastewater: CRU2-2 Final effluent: CRU1
2,217 2,574 2,955 2,951
304,416
45 (CRU1-1 plus CRU1-2)
48 (CRU2-1 plus CRU2-2)
Final effluent: CRU2 419,184 API separator sludge: CRU1 API separator sludge: CRU12
37,000 dry lbs 40,000 dry lbs
ARCO Cherry Point Refinery (was BP)
Blaine, WA Semi-regenerative 60,480 Reformer #1 (May 2000) Reformer #1 (April 2001) Reformer #2 (Sept 2000) Reformer #2 (March 2001) Final effluent (May 2000) Final effluent (Oct 2000) Final effluent (Mar 2001) Final effluent (April 2001) API separator sludge (May 2000) API separator sludge (Oct 2000) API separator sludge (April 4, 2001) API separator sludge (April 11, 2001)
120 128 290 303 – – – – – – – –
226,800 215,000 470,250 618,100
31.5 28 27 34 – – – – – – – –
Shell Oil Products USA Anacortes, WA Semi-regenerative 32,200 Caustic Water Wash: CRU2 (Jan 2003) Caustic Water Wash: CRU1 (Mar 2003) Caustic Water Wash: CRU2 (Jan 2004) Caustic Water Wash: CRU1 (Mar 2004) Final Effluent: CRU2 (Jan 2003) Final Effluent: CRU1 (Jan 2003) Final Effluent: CRU2 (Jan 2004) API Sludge (Jan 2003) API Sludge (Mar 2003)
---------
22,860 26,670 22,860 26,670
---------
Source: Washington State Department of Ecology, Letter of Transmittal. December 11, 2003 (DCN 00711): Tesoro Northwest study, May 2001, Cherry Point Refinery study, July 2001, and U.S. Oil & Refining study, August 15, 2003; and Shell Oil Products U.S. Puget Sound Refinery, Dioxin Study Report (NPDES Permit WA-000294-1), June 2004.

Section 7 - Petroleum Refining
Table 7-21 summarizes in-plant sampling data obtained from Washington Department of Ecology and EPA’s 1990-91 sampling program reported in the 1996 Preliminary Data Summary. The table also includes the dioxin concentrations in API separator sludge and treated final effluent obtained from the Washington refineries. EPA converted all detected congeners to TCDD equivalents and assumed results reported as less than the analytical detection limit to equal zero.
Table 7-21. TCDD Equivalents in Petroleum Refinery Wastes
TCDD Equivalents (assuming nondetects = 0)
Median Range
Catalyst Reformer Regeneration Wastewater
Concentration pg/L 2,975 0 to 394,000
Loadings mg/cycle 5.64 0 to 84
API Separator Sludge
Concentration (mass based) ng/kg sludge 13.61 3 to 356
Treated Final Effluent
Concentration pg/L 0 0 to 15.5 Sources: Washington State Department of Ecology. Letter of Transmittal. December 11, 2003 (DCN 00711); U.S. EPA, 1996 Preliminary Data Summary; Shell Oil Products U.S. Puget Sound Refinery, Dioxin Study Report (NPDES Permit WA-000294-1), June 2004; and ERG, Toxic Equivalents for Dioxins Reported in 2000 to TRI (Calculation Sheet).
High concentrations of dioxins, including 2,3,7,8-TCDD and 2,3,7,8-TCDF, were detected in catalytic reformer regeneration wastewaters. EPA calculated the mass of TCDD equivalents discharged per regeneration cycle, using reported wastewater flows. The median loading was 5.64 milligrams per regeneration cycle.
In contrast to the catalytic reformer regeneration wastewater results, none of the Washington refineries detected either 2,3,7,8-TCDD or 2,3,7,8-TCDF in their treated final effluent. Two of the four Washington refineries detected no dioxins in their treated final effluent (see Table 7-23). The Tesoro Northwest sampling results included split samples taken in March 2000 and analyzed by two laboratories; five congeners were detected in the treated final effluent (by one or both laboratories). In the August 30, 2000 sampling episode for Tesoro Northwest, nine congeners were detected in the treated final effluent (by one or both laboratories). The congener, 1,2,3,4,6,7,8-HpCDF, was detected in both sampling episodes by both laboratories. Shell Oil Products Puget Sound Refinery detected one congener (OCDD) in its final effluent for the January 2003 sampling episode.
Catalytic reformer regeneration wastewaters are routed to the refinery wastewater treatment system through the API oil/water separator. Because of the low water solubility and extreme hydrophobicity of dioxins, at least some of the dioxins from catalytic reformer regeneration wastewaters partition to the oil and solids phases in the API separator and
7-49

Section 7 - Petroleum Refining
accumulate in the sludges. As expected, all of the Washington state refineries detected dioxins in their API separator sludge.
7.7.4.4 Industry Comments About Dioxins
As discussed in Section 7.2.1.4, EPA received comments from NPRA and API concerning the TRI estimates of dioxin discharges. The comments explained that 2000 was the first year industry was required to report releases of dioxins to TRI. NPRA and API noted that refineries may over-report dioxin discharges to TRI by using one-half the detection limit to estimate releases of dioxins when not detected in the effluent. Table 7-22 summarizes the refinery-specific comments concerning dioxin discharge estimates reported to the 2000 TRI. NPRA and API provided comments on 12 of the 15 refineries5 that reported discharging dioxins to TRI. Of those 12 refineries, four based their reported discharges on measurements of effluent dioxin concentration. Tesoro Northwest (Anacortes, WA) detected dioxins in multiple effluent samples, as discussed in Section 7.7.4.3. BP Oil Company Toledo Refinery (Oregon, OH) collected and analyzed one set of samples and measured nine dioxin congeners above detection limits. For the TRI reported releases in 2001 and 2002, the refinery set nondetects equal to zero; however, for 2002, the refinery modified its estimation method to set nondetects equal to one-half the detection limit. Bayway Refining (Linden, NJ) and Chevron (El Segundo, CA) did not detect dioxins in their effluent, but estimated the mass released based on one-half the detection limit.
7.7.5 Compilation and Discussion of Measured Effluent Dioxin Concentrations
Table 7-23 summarizes dioxin concentrations measured in final effluent from eight U.S. petroleum refineries. Data presented include concentrations reported in PCS, the Washington State permit-required dioxin study results (18, 36), a special report prepared by the Tosco Refinery in Martinez, CA (now owned by Tesoro) in April 1997 (19), data summarized in EPA’s 1996 Preliminary Data Summary (24), and data submitted to EPA by BP Oil Company Toledo Refinery (2). Data in these various sources have different nomenclature. For example, some sources provide results as TEQ; others only provide discharge information for 2,3,7,8-TCDD. See Section 4.2.4.2 for additional discussion on dioxin nomenclature. In order to compare these results, Table 7-23 also provides the associated TWPE. EPA did not include refinery TRI data in Table 7-23, because refineries do not report concentrations to TRI. However, as discussed above only two of the four facilities that based their TRI-reported dioxin discharges on actual measurements detected dioxin in their effluent. EPA has concentration data from these two facilities from other sources and has included those data in Table 7-23.
5A 16th refinery, Marathon Ashland Petroleum (Detroit, MI) originally reported discharging 8.06 grams of dioxins in 2000. The refinery submitted a TRI correction form, and EPA changed the reported discharge to 0 grams for this analysis.
7-50

Section 7 - Petroleum Refining
Table 7-22. NPRA and API Comments on Dioxin Discharge Estimates Reported to the 2000 TRI
7-51
TRI ID Number Refinery Refinery Location
TRI Releases 20001
Dioxin Discharge (gram/yr)
Basis of Estimate for TRI Releases
20002 NPRA and API Comment on
Dioxin Releases Reported to TRI
98221SHLLLWESTM Tesoro Northwest Co. Anacortes, WA 5.199947 M 2001 discharge = 1.6 grams, 2002 discharge = 1.7 grams
77590MRTHNFOOTO Marathon Ashland Petroleum LLC Texas City, TX 2 O No comment.
70669CNCLKOLDSP Conoco Lake Charles Refinery Westlake, LA 0.5392 E No comment.
94802CHVRN841ST Chevron Prods. Co. Richmond Refinery
Richmond, CA 0.339997 O Based on detection limit. Two samples analyzed (no values above detection limit).
90245CHVRN324WE Chevron USA Prods. Co. El Segundo, CA 0.329997 M Based on detection limit. Only OCDD was detected.
43616SHLCM4001C BP Oil Co. Toledo Refinery Oregon, OH 0.285997 M One set of samples collected and analyzed: 9 congeners above the detection limit.
07036XXN 1400P Bayway Refining Co. Linden, NJ 0.253997 M Based on ½ the detection limit. Treated effluent samples are all ND.
74603CNCPN1000S Conoco Inc. Ponca City Refinery Ponca City, OK 0.180878 O Estimated discharge using nonrefinery-specific data for dioxin in petroleum products.
59101CNCBL401SO Conoco Inc. Billings Refinery Billings, MT 0.161558 O Estimated discharge using nonrefinery-specific data for dioxin in petroleum products.
08066MBLLCBILLI Valero Refining Co. New Jersey Paulsboro, NJ 0.089999 O Reported wastewater release was 0.0002 grams.
00851HSSLVLIMET Hovensa LLC Christiansted, VI 0.069341 C Based on EPA discharge factors .
80022CNCDN5801B Conoco Denver Refinery Denver, CO 0.059999 O Internally generated factors per corporate policy.
39567CHVRNPOBOX Chevron Prods. Co. Pascagoula Refinery
Pascagoula, MS 0.035 O No comment.
62454MRTHNMARAT Marathon Ashland Petroleum LLC Robinson, IL 0.03 O No comment.
00654PHLPSPHILI Chevron Phillips Chemical Puerto Rico
Guayama, PR 0.00218 E No comment.

Section 7 - Petroleum Refining
Table 7-22 (Continued)
TRI ID Number Refinery Refinery Location
TRI Releases 20001
Dioxin Discharge (gram/yr)
Basis of Estimate for TRI Releases
20002 NPRA and API Comment on
Dioxin Releases Reported to TRI
70602CTGPTHIGHW Citgo Petroleum Corp Lake Charles, LA 0.0016 E Based on EPA discharge factors.
79905CHVRN6501T Chevron USA El Paso Refinery El Paso, TX 0.109999 O Based on ½ the detection limit.
Refineries Not in EPA’s Analysis: No Discharge of Dioxins
48217MRTHN1300S Marathon Ashland Petroleum LLC Detroit, MI 8.061218 NA Incorrect number reported: should be zero discharge. Refinery submitted TRI correction form.
1Mass transferred to POTW that is ultimately discharged to surface waters. Accounts for POTW removals.2Refineries reported basis of estimate in 2000 TRI as: M - Monitoring data/measurements; C - Mass balance calculations; E - Published emission factors; and O - Otherapproaches (e.g., engineering calculations).
7-52

Section 7 - Petroleum Refining
Table 7-23. Dioxin Concentrations Measured in U.S. Petroleum Refinery Final Effluent
7-53
2,3,7,8- Measured TCDD TEQ TWPE
Facility Source Results (pg/L) (pg/L) (lb-eq)
Tesoro Northwest Company
(1) March 8, 2000 - Split sample analyzed by two labs. Results shown average two results. Five congeners detected by at least one lab, including
<3 3.1 to 21.31 29.9 to 1962
Anacortes, WA 1,2,3,4,6,7,8-HpCDF by both labs. August 30, 2000 - split sample analyzed by two labs. Results shown
<4 15.5 to 37.91
average two results. Nine congeners detected by at least one lab, including 1,2,3,4,6,7,8-HpCDF by both labs.
ARCO Cherry Point (1) May 3, 2000 - No congeners detected. <10 0 0 Refinery October 1, 2000 - No congeners detected. <10 0 Blaine, WA April 6, 2001 - No congeners detected. <10 0
April 13, 2001- No congeners detected. <10 0
U.S. Oil & Refining Co. (1) July 16-17, 2002 - No congeners detected. ND 0 0 Tacoma, WA June 23 -24, 2002 - No congeners detected. ND 0
Shell Oil Products US (2) January 2003 - Only OCDD detected. ND 0.012 0.81 to Puget Sound Refinery March 2003 - No congeners detected. ND 0 7412
Anacortes, WA January 2004 - No congeners detected. ND 0
Shell Oil Mobile Saraland, AL
(3) 1998 to 2000 - permit requires yearly monitoring for 2,3,7,8-TCDD. Never detected.
ND 0 0
Murphy Oil USA Inc. Superior, WI
(3) February 29, 2000 - permit requires monitoring for 2,3,7,8-TCDD <2.7 0 0
Tesoro Refining (3) March 31, 2000 NR 0.00028 12.8 (Previously Tosco) June 30, 2000 NR 0.30 Avon Refinery October 31, 2000 NR 0.09 Martinez, CA permit requires quarterly reporting TCDD-equivalents.
Discharge is 98% nonprocess, 2% process.
(4) January - December, 1996- Outfall to bay - Results reported as TCDD NR 0.47 NC TEQ. Individual congeners not reported. Outfall includes process and nonprocess sources of dioxins. Result shown is 12 month average. June 1996 - GAC outlet. Treated process wastewater. August 1996 - GAC outlet. Treated process wastewater NR 0.012
NR 0.00

Section 7 - Petroleum Refining
Table 7-23 (Continued)
7-54
2,3,7,8- Measured TCDD TEQ TWPE
Facility Source Results (pg/L) (pg/L) (lb-eq)
Tesoro Refining (5) ca 1989 -Outfall to bay. 13 ppq TCDF detected; not found when sample ND 1.3 NC (Previously Tosco) reanalyzed. ND 0.12 Avon Refinery Re-analyzed sample. Only OCDD detected Martinez, CA
BP Oil Company Toledo Refining Oregon, OH
(6) 2000 - 9 congeners detected 0 to 0.843 0 to 4.293 0 to 24,8003
TOTAL MEASURED DIOXIN DISCHARGE: 43.5 to 25,800
Sources: (1) Washington State Department of Ecology. Letter of Transmittal. December 11, 2003 (DCN 00711). (2) Shell Oil Products U.S. Puget Sound Refinery. Dioxin Study Report (NPDES Permit WA-000294-1). June 2004. (3) U.S. EPA. PCSLoads2000. (4) Tosco Refining Company Avon Refinery. Dioxin Source Investigation Pursuant to Cease and Desist Order No. 95-151, Final Report. (5) U.S. EPA, 1996 Preliminary Data Summary, Table 6.9. (6) BP Oil Company. Water Samples for PCDD/PDCF for the BP Oil Company Toledo Refinery. Performed by Batelle. November 9, 2000.NC - Not calculated, reporting data for 2000 used to calculate TWPE for refinery.ND - Not detected, detection limit not reported.NR - Not reported.1Low value assumes ND = 0; high value assumes ND = detection limit.2Total year 2000 discharges. Low value assumes ND = 0; high value assumes ND = detection limit.3All concentrations reported by BP were less than low end of calibration curve. Low value assumes all results were ND, and ND = 0. High value assumesdetected results present at reported concentration and ND = detection limit.

Section 7 - Petroleum Refining
As shown in Table 7-23, only one refinery (BP Toledo Refinery) detected the most toxic form of dioxin, 2,3,7,8-TCDD, in its final effluent. Four of the eight refineries did not detect any dioxins in their final effluent. The four refineries that detected dioxins in their effluent were Tesoro (previously Tosco) (Martinez, CA); Tesoro Northwest (Anacortes, WA); Shell Puget Sound Refinery (Anacortes, WA); and BP Toledo Refinery (Oregon, OH).
Table 7-24 summarizes the petroleum refinery treated effluent data for individual dioxin and furan congeners measured at three of the four facilities that detected dioxins in their final effluent (Tesoro Northwest, Shell Puget Sound, and BP Toledo). All results are presented in picograms per liter (pg/L). EPA did not present the data for the fourth refinery because the refinery provided only summary results.
In 1997, the Tesoro (Martinez, CA) refinery completed an extensive study to find the source of dioxin in its wastewaters (see DCN 710) The study determined that stormwater is the largest source of dioxin in the final effluent (50 percent) with the coke pond and clean canal forebay as the second largest (45 percent) (19). The refinery reported that the wastewater treatment plant (i.e., treated process wastewater) contributed 2 percent of the dioxins in the final effluent (19). The facility collected and analyzed two samples of fully treated process wastewater for this study. The analytical results were 0.000 pg/L TCDD-equivalents and 0.012 pg/L TCDD-equivalents (19). These concentrations equate to 12.8 lb-equivalents. In comparison, the calculated TCDD-equivalents of the concentrations detected in the final effluent in 2000 were 0.00028, 0.30, and 0.09 pg/L (34).
The Tesoro Northwest Refinery (Anacortes, WA) sampled its effluent on two occasions, during batch discharges of treated wastewater generated during the regeneration of catalytic reformer spent catalyst. Each sample was analyzed by two independent analytical laboratories. Tesoro Northwest detected between 6 and 11 dioxin congeners in its final effluent (36). However, two compounds were present in the corresponding laboratory blank,. Several other compounds were detected below the lower calibration limit. OCDF and 1,2,3,4,6,7,8-HpCDF were detected about the method minimum level by both laboratories and in both samples. The most toxic dioxin forms (2,3,7,8 -TCDD and 2,3,7,8-TCDF) were not detected in any samples (36). The refinery has not done an additional study to identify the sources of dioxin in its final effluent (17). At this point, because the dioxin concentrations in the upstream source (catalytic reformer regeneration wastewaters) are also high, EPA assumes the spent caustic/wash water from catalytic reformer regeneration is the source of the dioxins in the final effluent. These effluent measurements equate to 29.9 to 196 TWPE (low value assumes nondetects equal zero and high value assumes nondetects equal the detection limit).
The Shell Puget Sound Refinery (Anacortes, WA) sampled its effluent on three occasions, corresponding to the regeneration of catalytic reformer spent catalyst. Shell Puget Sound detected OCDD at a concentration of 120 pg/L in its final effluent during the January 2003 sampling episode. For the March 2003 and January 2004 sampling episodes, the refinery
7-55
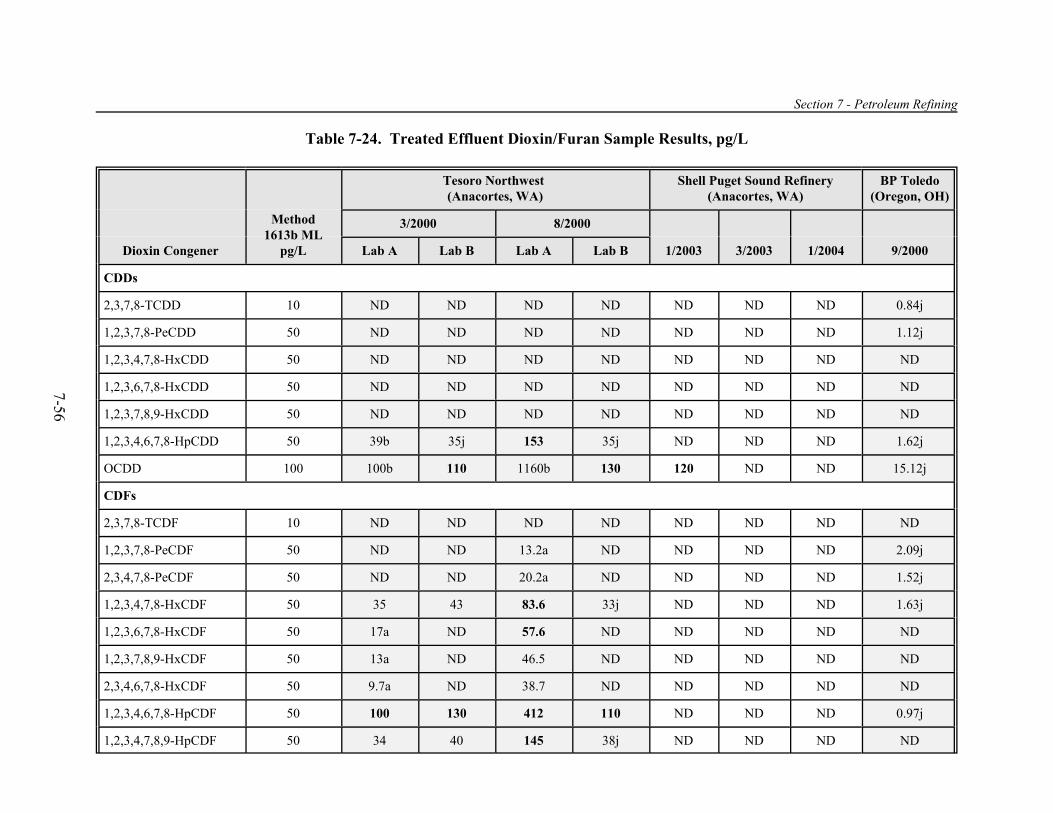
Section 7 - Petroleum Refining
Table 7-24. Treated Effluent Dioxin/Furan Sample Results, pg/L
7-56
Tesoro Northwest Shell Puget Sound Refinery BP Toledo
Dioxin Congener
Method 1613b ML
pg/L
(Anacortes, WA) (Anacortes, WA) (Oregon, OH)
3/2000 8/2000
1/2003 3/2003 1/2004 9/2000Lab A Lab B Lab A Lab B
CDDs
2,3,7,8-TCDD 10 ND ND ND ND ND ND ND 0.84j
1,2,3,7,8-PeCDD 50 ND ND ND ND ND ND ND 1.12j
1,2,3,4,7,8-HxCDD 50 ND ND ND ND ND ND ND ND
1,2,3,6,7,8-HxCDD 50 ND ND ND ND ND ND ND ND
1,2,3,7,8,9-HxCDD 50 ND ND ND ND ND ND ND ND
1,2,3,4,6,7,8-HpCDD 50 39b 35j 153 35j ND ND ND 1.62j
OCDD 100 100b 110 1160b 130 120 ND ND 15.12j
CDFs
2,3,7,8-TCDF 10 ND ND ND ND ND ND ND ND
1,2,3,7,8-PeCDF 50 ND ND 13.2a ND ND ND ND 2.09j
2,3,4,7,8-PeCDF 50 ND ND 20.2a ND ND ND ND 1.52j
1,2,3,4,7,8-HxCDF 50 35 43 83.6 33j ND ND ND 1.63j
1,2,3,6,7,8-HxCDF 50 17a ND 57.6 ND ND ND ND ND
1,2,3,7,8,9-HxCDF 50 13a ND 46.5 ND ND ND ND ND
2,3,4,6,7,8-HxCDF 50 9.7a ND 38.7 ND ND ND ND ND
1,2,3,4,6,7,8-HpCDF 50 100 130 412 110 ND ND ND 0.97j
1,2,3,4,7,8,9-HpCDF 50 34 40 145 38j ND ND ND ND

Section 7 - Petroleum Refining
Table 7-24 (Continued)
Dioxin Congener
Method 1613b ML
pg/L
Tesoro Northwest (Anacortes, WA)
Shell Puget Sound Refinery (Anacortes, WA)
BP Toledo (Oregon, OH)
3/2000 8/2000
1/2003 3/2003 1/2004 9/2000Lab A Lab B Lab A Lab B
OCDF 100 200 270 935 200 ND ND ND 1.28j Sources: Washington State Department of Ecology. Letter of Transmittal. December 11, 2003 (DCN 00711); Shell Oil Products U.S. Puget Sound Refinery.Dioxin Study Report (NPDES Permit WA-000294-1). June 2004; and BP Oil Company. Water Samples for PCDD/PDCF for the BP Oil Company ToledoRefinery. Performed by Batelle. November 9, 2000.ML - Minimum Level.a/j - Compound present, detected below the lower calibration limit.b - Detected in method blank.7-57

Section 7 - Petroleum Refining
detection no dioxins in its final effluent (18). These measurements equate to 0.81 to 741 TWPE (low value assumes nondetects equal zero and high value assumes nondetects equal the detection limit).
The BP Toledo Refinery (Oregon, OH) sampled its effluent once in September 2000. It has a continuous discharge of wastewater from its catalytic reforming regeneration. BP Toledo detected nine congeners, including the most toxic form, 2,3,7,8-TCDD, in its final effluent. However, no dioxins were detected above the lower calibration limit or the method minimum level. Although these compounds were below the lower calibration limit, they were probably present in the sample. EPA estimates treated effluent TWPE range from 0 to 25,800 (low value assumes nondetects equal zero and high value assumes nondetects equal the detection limit). (2)
EPA notes that many of the detected dioxin concentrations at these refineries are close to the analytical minimum level and that some sample-specific detection levels and detected concentrations are below the Method 1613b minimum level. Method 1613b is the analytical method EPA specifies for compliance when it establishes 2,3,7,8-TCDD limits in the effluent guidelines program. The minimum level is the is the smallest quantity that the method can reliably measure. Also, EPA has historically regulated dioxins as 2,3,7,8-TCDD and establishes the limit as below the minimum level. All of information from the eight facilities that measured for dioxins (including BP Toledo) indicates 2,3,7,8-TCDD is below the minimum level of 10 pg/L.
Data from these eight refineries indicate that while dioxins may be generated during catalyst regeneration operations, dioxin concentrations measured at the effluent are close to the minimum level or below the minimum level. This indicates that the dioxins are being removed from the wastestream prior to discharge. Because dioxins have a low water solubility and extreme hydrophobicity, EPA expects that the dioxins from catalytic reformer regeneration wastewaters partition to the oily and solids phases in the API separator and accumulate in the sludges.
Finally, EPA notes that the total TWPE based on measured discharged by refineries is 43.5 to 25,800 TWPE (low value assumes nondetects equal zero and high value assumes nondetects equal the detection limit) compared to the 139,258 TWPE calculated using the 2000 TRI data, as reported.
7.7.6 Dioxin Control Technologies
As described in the 1996 Preliminary Data Summary, after reviewing data collected in its 1990-91 refinery sampling program, EPA noted that greater than 90 percent of the TEQ were associated with solids-phase samples. This indicated that dioxins might be treated at the source by filtration technology prior to commingling the regeneration wastewater with wastewaters from other refinery operations (24, page G-22).
7-58

Section 7 - Petroleum Refining
To control dioxins in wastewater, Shell Canada (Sarnia, Ontario Canada) implemented carbon filtration pretreatment of spent caustic from the catalytic reformer. The pretreatment system consists of two carbon filters (165 pounds each) connected in series with a flow rate of five gallons per minute. After pretreatment, the refinery treats the wastewater in its end-of-pipe biological treatment system. The 1996 Preliminary Data Summary did not discuss the effectiveness of this treatment. (24)
As described in Dioxin Source Investigation Pursuant to CDO No. 95-151, Final Report (19), the Tesoro Avon Refinery (owned by Tosco at the time of the report) operates both a continuous catalytic reformer and a semi-regenerative catalytic reformer. Off-gases from the continuous catalyst regeneration pass through a caustic scrubbing solution. A slipstream of washwater is constantly purged to the oily sewer at a rate of four gallons per minute. In 1993, the refinery installed a granular activated carbon (GAC) treatment system that successfully removed 95 to 99 percent of the dioxins found in the washwater from this wastestream. The refinery analyzed two samples of GAC effluent and reported the results as 0.012 pg/L TEQ for one sample and 0.00 pg/L TEQ for the other sample.
Tesoro’s semi-regenerative catalytic reformer is shut down approximately once per year for regeneration. Washwater from this process contains dioxins. The refinery determined that allowing particulate in the catalyst regeneration wastewater to settle in tanks for a minimum of one week allows the dioxin concentrations in the liquid portion to drop to nearly zero. The settled liquid is pumped through a 1-micron filter sock prior to discharge to the oily sewer. The refinery disposes of the filter socks and collected particulate matter as dioxin-containing hazardous waste (19).
7.7.7 Detailed Study Findings for Dioxins
Below is a summary of the findings of EPA’s detailed study of refinery dioxins.
C The term “dioxins,” or polychlorinated dibenzo-p-dioxins (CDDs) and polychlorinated dibenzofurans (CDFs), refers to the 17 individual compounds (congeners) with chlorine substitution of hydrogen atoms at the 2, 3, 7, and 8 positions on the benzene rings. U.S. industrial facilities were first required to report dioxin releases to TRI in 2000. Facilities report the total mass of the 17 compounds released to the environment and the congener distribution of these releases. Using 2000 TRI data as reported (and accounting for POTW removals), EPA estimated that petroleum refineries released 9.60 grams of dioxins to surface water in 2000.
C EPA calculated the TWPE of dioxins released from petroleum refineries using facility-reported congener distributions. If a refinery did not report a congener distribution, EPA used the refining industry-specific average distribution to calculate the mass of each congener released. Using TWFs for each congener and 2000 TRI data (accounting for POTW removals),
7-59

Section 7 - Petroleum Refining
EPA estimated that refineries discharged 139,258 TWPE of dioxins in 2000.
C Using only final effluent data where dioxin discharges were measured analytically, EPA estimated that refineries discharged between 43.5 and 25,800 TWPE of dioxins in 2000 (over 80 percent less than the TWPE estimated using the TRI data as reported).
C In 1988, dioxins were identified in catalyst regeneration wastewater from Ontario petroleum refineries. In the early 1990s, EPA confirmed that reformer catalyst regeneration wastewater was the major source of dioxins in refinery process wastewater. In 2000, 122 refineries performed catalytic reformer regeneration.
C For this detailed study, EPA reviewed in-plant dioxin monitoring data from four sources:
— Washington Department of Ecology permit-required sampling: results of sampling and analysis provided by three Washington refineries from 2001-2003.
— Washington Department of Ecology permit-required sampling: results of sampling and analysis provided by Shell Oil Products U.S. Puget Sound Refinery from 2003 - 2004.
— EPA-conducted sampling in support of its 1996 Preliminary Data Summary: results of sampling at three California refineries in the early 1990s.
— BP Oil CompanyToledo Refinery sampling data from 2000.
C From the four sources above, high concentrations of dioxins, including 2,3,7,8-TCDD and 2,3,7,8-TCDF, were detected in catalytic reformer regeneration wastewaters at all eight refineries:
— 2,975 pg/L - Median TCDD-equivalent concentration, and — 5.64 mg/cycle - Median loading per regeneration cycle.
C From the four sources above, four of the eight refineries detected dioxins in their final effluent.
C One of three refineries with NPDES permit limits for TCDD or TCDD-equivalents detected dioxins in their final effluent in 2000:
7-60

Section 7 - Petroleum Refining
— Tesoro Refining (Martinez, CA) reported 0.00028, 0.09, and 0.3 pg/L in its final effluent.
— This refinery identified stormwater and coke pond water as contributing 95 percent of the mass discharged. Treated process wastewater contributed two percent of the mass. Sampling of treated process wastewater yielded 0.000 pg/L TCDD-equivalents and 0.012 pg/L TCDD-equivalents. This equates to 12.8 TWPE.
C For TRI reporting year 2000, 17 refineries reported wastewater dioxin releases.
— For 15 of the 17 dioxin-reporting refineries, reported releases were either not based on measured concentrations, or when dioxin congeners were not detected, releases were estimated using one-half the analytical detection limit and refinery effluent flow.
— For 2 of the 17 dioxin-reporting refineries, the reported releases appear to have been based on measured concentrations in refinery effluents.
C BP Oil Company Toledo Refinery (Oregon, OH) - EPA received the 2000 analytical data report from the refinery. All concentrations reported by BP were less than the low end of calibration curve. Although the concentrations of these compounds were below the method minimum level, they were probably present in the sample. EPA estimates treated effluent TCDD-equivalents concentrations range from 0 to 4.29 pg/L, or 0 to 24,800 TWPE.
C Tesoro Northwest (Anacortes, WA) - EPA received further data for this refinery as part of the Washington Department of Ecology permit requirements (see below).
C Four Washington refineries provided permit-required final effluent sampling results.
— Dioxins were not detected in the treated final effluent of two of these refineries.
— EPA estimates treated effluent TCDD-equivalent concentrations at Tesoro Northwest (Anacortes, WA) are between 3.1 and 37.9 pg/L. The process wastewater (spent caustic/wash water) from catalytic reformer regeneration contains high concentrations of dioxins. Most dioxins settle with the solids and become part of the API
7-61

Section 7 - Petroleum Refining
separator sludge; however, the refinery effluent still contains dioxins above detection limits. The most toxic form of dioxins were not detected in any effluent samples. Dioxin in treated effluent equate to 29.9 to 196 TWPE.
— EPA estimates treated effluent TCDD-equivalents concentrations at Shell Puget Sound Refinery (Anacortes, WA) are between 0 and 0.012 pg/L, or 0.81 to 741 TWPE. The process wastewater (caustic water wash) from catalytic reformer regeneration contains high concentrations of dioxins; however, almost all of the dioxins settle with the solids and become part of the API separator sludge. The refinery detected only one congener in the final effluent in one of the three sampling episodes.
C Four Washington refineries provided permit-required API separator sludge sampling results. Dioxins were detected in the sludge from all four of these refineries, including the two refineries with no dioxins in their final effluent.
C Tesoro Refinery in Martinez, CA practices in-plant treatment of segregated catalytic reforming catalyst regeneration wastewater.
— GAC removes 95 to 99 percent of the dioxins in continuous catalytic reformer off-gas scrubber blowdown.
— Settling and solids filtration removes dioxins from semi-regenerative catalytic reformer regeneration wash water.
Based on the information collected during the detailed review, EPA concludes that dioxins might be produced in high concentrations at petroleum refineries during reformer catalyst regeneration processes. While some dioxin congeners might be present in the treated effluent at some refineries, the most toxic congeners, 2,3,7,8-TCDD and 2,3,7,8-TCDF, have only been detected in the final effluent at one petroleum refinery at a concentration below the method minimum level. TWPE estimates from eight facilities that sampled their treated effluent for dioxins ranges from 43.5 to 25,800 TWPE. EPA notes that these TWPE estimates are based on dioxin concentrations close to the analytical minimum level. In addition, the highest estimated TWPE (24,800 TWPE at the BP Toledo Refinery) was calculated for an effluent sampled only once, with all detected congener concentrations below the Method 1613b minimum level.
Contamination of API separator sludge with dioxins suggests that at least some of the dioxins from catalytic reformer regeneration wastewater partition to the oily and solid phases in the API separator and accumulate in the sludge. API separator sludges are managed as hazardous wastes.
7-62

Section 7 - Petroleum Refining
In-process control technology effectively removes dioxins from segregated catalytic reforming catalyst regeneration wastewater. This control technology consists of solids removal and/or GAC adsorption. Permit writers should consider the use of these technologies as they develop permit limits that reflect their “Best Professional Judgement” (BPJ) of what constitutes BAT for an individual refinery.
7.8 Metals
Petroleum refinery wastewater contains a number of metal pollutants. In 2000, petroleum refineries reported wastewater releases of over 20 metals6 to TRI and refineries in PCS monitored their effluent for discharges of over 30 metals.
7.8.1 Identification and Description of the Metals Discharged in Petroleum Refinery Wastewater
Table 7-25 provides information on the metals commonly found in discharges from petroleum refineries, and identifies if the metal is reportable to TRI or is a CWA priority pollutant. Petroleum refinery effluent limitations guidelines found in 40 CFR Part 419 include limitations for hexavalent and trivalent chromium.
Table 7-25. Metals in Petroleum Refining Wastewater
Pollutant Reportable to TRI? Priority Pollutant? Limits in 40 CFR Part 419?
Aluminum 1
Arsenic T T
Chromium T T T
Copper T T
Lead T T
Mercury T T
Nickel T T
Selenium T T
Vanadium T –
Zinc T T 1Aluminum is only reportable to TRI in its fume or dust form.
7.8.2 Sources of Metals at the Petroleum Refinery
Crude petroleum is the major source of metals at petroleum refineries. Metals found in crude petroleum, and their concentrations, depend on the origin of the crude oil. For example, selenium is contained in some crude oils, particularly from parts of California (3).
6For this review, two nonmetallic elements, arsenic and selenium, are included with metals.
7-63

Section 7 - Petroleum Refining
Other sources of metals in refinery wastewater include pipe corrosion (e.g., chromium), catalyst additives, other refinery raw materials, cooling water biocide (e.g., chromium),and supply water (37).
Desalter wastewater will most likely have the largest concentration of metals, especially mercury. Another process wastewater source of metals is wash water from other refining steps (37).
7.8.3 Reported Metal Discharges
EPA estimated metal loadings for the petroleum refining industry using data reported to TRI and PCS in 2000. In addition, EPA used metals discharge data for 23 refineries from the 1996 Preliminary Data Summary (24) and for 10 refineries from API (1).
7.8.3.1 Mass Discharges: TRI and PCS
Table 7-26 presents the pollutant loadings for metals estimated using discharges reported to TRI for 2000. Metals account for 22 percent of the total industry TWPE discharge estimated with TRI data when PAC and dioxin discharges are included. However, as discussed in Sections 7.6 and 7.7, EPA has little evidence that PACs and dioxin releases reported to TRI reflect measurable concentrations in refinery effluents. Metals make up almost 70 percent of the TRI TWPE when PACs and dioxins are not included in the total, and 17 percent of the PCS TWPE.
Table 7-26. Metals Discharges as Percentage of Total TWPE
Pollutant Total TWPE Discharged Percentage of Total TWPE
Discharged
TRI Loads
Metals 84,368 22%1
Total 373,177
PCS Loads
Metals 33,547 17%
Total 192,862 Source: TRIReleases2000 and PCSLoads2000.1Metals compose 70 percent of the TRI TWPE if PACs and dioxins are excluded.
As shown in Table 7-27, based on data reported to both the TRI and PCS, a few metals contribute most of the TWPE. Table 7-28 presents information from TRIReleases2000, showing the five metals with the highest estimate of TWPE released to surface waters in 2000. Vanadium comprises most of the TWPE in releases reported to TRI in 2000; 14 refineries reported releasing more than 55,000 TWPE of vanadium, or 65 percent of the metal TWPE.
7-64

Section 7 - Petroleum Refining
Table 7-27. Top Five Metals as Percentage of Total Metal TWPE
Pollutant
PCS TRI
Total Pounds Discharged
Total TWPE Discharged
Total Pounds Discharged
Total TWPE Discharged
Total Metals 202,860 33,547 182,265 83,266
Top 5 Metals1 130,684 26,042 98,215 75,961
Top 5 as percentage of total metals
64% 78% 54% 91%
Source: TRIReleases2000 and PCSLoads2000.1Top five TRI metals include vanadium, mercury, selenium, chromium and lead. Top five PCS metals includeselenium, aluminum, arsenic, mercury and lead.
Table 7-28. Five Metals with Highest Estimated TWPE (TRI)
Pollutant
TRI
Number of Refineries Total Pounds Discharged
Total TWPE Discharged
Vanadium 14 88,778 55,240
Mercury 20 100 11,768
Selenium 2 2,655 2,975
Chromium 13 5,049 2,322
Lead 14 1,632 3,656 Source: TRIReleases2000.
The federal effluent limitations and guidelines for petroleum refineries include metal limits only for chromium (total and hexavalent); however, state and local permits may require refineries to monitor for other metal compounds. Table 7-29 presents information from PCSLoads2000, showing the five metals with the highest estimate of TWPE discharged to surface waters in 2000. Selenium comprises most of the TWPE in discharges calculated using PCS data; 18 refineries reported selenium discharges, accounting for more than 9,000 TWPE of selenium, or 27 percent of the metal TWPE.
7-65

Section 7 - Petroleum Refining
Table 7-29. Five Metals with Highest Estimated TWPE (PCS)
Pollutant
PCS
Number of Refineries Total Pounds Discharged
Total TWPE Discharged
Selenium 18 8,068 9,041
Aluminum 5 120,235 7,754
Arsenic 10 1,663 5,769
Mercury 7 16 1,908
Lead 10 701 1,571 Source: PCSLoads2000.
7.8.3.2 Additional Metals Data (Concentrations)
EPA reviewed additional petroleum refinery metals discharge data and compared these concentrations to baseline values and promulgated effluent guidelines. Each of the data sources is discussed below and Table 7-30 presents these data.
Preliminary Data Summary
As part of the study described in EPA’s 1996 Preliminary Data Summary (24), EPA visited and collected effluent data from six refineries. Table 7-30 presents the range of effluent metals concentrations collected from these refineries. No data on concentrations of arsenic, mercury, or vanadium were available for these refineries.
EPA also obtained one-year average concentration data collected during Ontario’s Seven Refineries Study, conducted in 1989 (24). Table 7-30 presents these average concentrations. No data on concentrations of mercury or vanadium were available for these refineries.
API Supplied Data
EPA received comments from API on the December 31, 2003 Notice of the Preliminary Effluent Guidelines Program Plan for 2004/2005. API provided a set of petroleum refining effluent data that were previously collected by its members in conjunction with EPA’s Office of Solid Waste (1). Data were collected from refineries following activated sludge treatment. Most of the metals with high TWPE discharges as reported to TRI were not detected above analytical detection limits. The exceptions were nickel, selenium, and vanadium. Table 7-30 presents the median of the analytical results.
7-66

Section 7 - Petroleum Refining
Calculated PCS Concentrations
As described in Section 7.2.2, EPA used data reported to PCS to estimate annual pollutant mass discharges. As further described in Section 7.5.2, EPA used PCS data to estimate annual process wastewater flow rates. EPA assumed that flows from effluent outfalls with limitations for BOD5 and/or ammonia (as nitrogen) were process-related. For each refinery discharging metals as reported to PCS (in pounds), EPA estimated the metal concentration by dividing the mass discharged by the flow rate (and correcting the units). Table 7-30 presents the median of estimated metal concentrations.
Baseline Values
Table 7-30 also presents baseline values for metal pollutants to compare to the metals concentrations measured at petroleum refineries. EPA develops method-specific “baseline values” for analyzing measurement data collected for effluent guidelines development. In most cases, the baseline value is the “nominal quantitation limit” stipulated for the specific method used to measure a particular pollutant. In general, the term “nominal quantitation limit” describes the smallest quantity of an analyte that can be measured reliably. The baseline values shown in Table 7-30 were taken from Chapter 15 of the Development Document for Centralized Waste Treaters (CWT) Point Source Category (26).
Comparison of Concentrations
As shown in Table 7-30, the concentrations of arsenic, copper, lead, mercury, and nickel did not exceed the baseline value or method detection level in any of the data sources. As a result, EPA concludes that TWPEs calculated for these pollutants reflect concentrations below the method detection level multiplied by the refinery effluent flow rate. Chromium, selenium, vanadium, and zinc, however, were detected above the baseline value/method detection level in at least one data source. Each of these metals is discussed in more detail below.
Chromium concentrations exceeded the baseline value for one or more of the six refineries visited for the 1996 Preliminary Data Summary. However, the highest concentration detected in samples taken for the 1996 Preliminary Data Summary was 0.02 mg/L, slightly greater than the baseline value (0.01 mg/L) but less than the long-term average of the BPT/BAT technology (0.25 mg/L). Concentrations from the other data sources were all less than the method detection level. These data collectively demonstrate that chromium is rarely discharged above the method detection level or the BAT treatment performance concentration.
7-67

Section 7 - Petroleum Refining
Table 7-30. Pollutant Discharge Concentrations for Metals at Petroleum Refineries
7-68
Pollutant
PDS Site Visit Data
(6 refineries) Range, mg/L
Canada Study Data (7 refineries)
Average, mg/L
1993/1994 Wastewater
Treatment Effluent Data
(10 refineries) Median, mg/L
2000 PCS Concentration Median, mg/L
Baseline Values (EPA Method Number 1620),
mg/L
Comparison to Concentration Basis of
Existing Regulation or Other Recently Promulgated
Regulations, mg/L
Source 1 2 3 4 5 –
Arsenic NA 0.009 < 0.1 (all ND) 0.0084 0.01 –
Chromium 0.015-0.02 0.0068 < 0.01 0.0067 0.01 0.251
Copper 0.01-.013 0.0048 < 0.01 (all ND) 0.0066 0.025 –
Lead 0.001-0.012 0.0041 < 0.05 (all ND) 0.0031 0.050 –
Mercury NA NA < 0.0002 (all ND)
0.00002 0.0002 –
Nickel 0.033-0.039 0.0034 0.04 0.023 0.040 –
Selenium 0.006-0.06 0.005 0.012 0.015 0.005 NA
Vanadium NA NA 0.26 0.015 0.05 NA
Zinc 0.04-0.147 0.29 < 0.02 0.04 0.020 1.48 (40 CFR Part 433) 0.42 (40 CFR Part 437) 0.26 (40 CFR Part 464 Ferrous Subcategory)
0.18 (40 CFR Part 464 Nonferrous Subcategory)2
Sources: 1. 1996 Preliminary Data Summary, Table 4-4. 2. 1996 Preliminary Data Summary, Table 4-5, taken from BAT for Ontario Petroleum Refining Sector, August 1991. 3. API Comment, Table 4, 1993-94 data collected in conjunction with EPA/OSW. 4. Calculated using BOD5-associated flow, and PCSLoads2000 estimated annual mass discharge. 5. Development Document for Centralized Waste Treaters (CWT) Point Source Category, Attachment 15-1.NA - Not available.ND - Not detected.1BPT/BAT-equivalent concentration for existing regulation (40 CFR Part 419) as listed in U.S. EPA’s Development Document for Effluent Limitations Guidelines and New SourcePerformance Standards for the Petroleum Refining Point Source Category, April 1974. 240 CFR Part 433; 40 CFR Part 437.31: Organics Treatment and Recovery Subcategory; and U.S. EPA Development Document for Final Effluent Limitations Guidelines andStandards for the Metal Molding and Casting (Foundry) Point Source Category (40 CFR Part 464).

Section 7 - Petroleum Refining
Selenium concentrations also exceeded the baseline value for one or more of the six refineries visited for the 1996 Preliminary Data Summary. In addition, the median concentrations provided in the API comments and calculated from PCS 2000 exceeded the baseline value. Selenium is present in crude petroleum, especially from parts of California. In the 1990's, California permitting authorities conducted a selenium treatability study. As a result of the study, many California refineries shifted their crude supplies so that they received low selenium crude. In addition, for five refineries in the Los Angeles Basin, the LA County Sanitation Districts began implementing source control requirements for selenium. The control requirements are driven by local requirements for the disposal of the Districts’ biosolids. The LA County Sanitation Districts commented that the General Pretreatment Regulations (40 CFR Part 403) and their local Wastewater Ordinance provides adequate control of selenium discharges by refineries (3).
EPA notes that it has historically not established national categorical limitations or standards for selenium in any existing ELGs. EPA did promulgate selenium limitations and standards in 40 CFR Part 437 based on primary chemical precipitation, liquid/solid separation, secondary precipitation, clarification, and sand filtration, but re-promulgated the regulation to delete these limitations. EPA found that selenium removal was achieved only on the last stage of the treatment technology basis, sand filtration, and that these removals were not consistent or predictable. See 68 FR 71014-71026.
The median concentration of vanadium provided in the API comments exceeded the baseline value; however, the more recent data from the 2000 PCS show concentrations below the baseline value. Vanadium is one of the metals that facilities are required to report to TRI. It is not limited in the existing effluent guideline. PCS contains little data on vanadium indicating that refinery discharge permits do not include vanadium requirements and that it has not been identified as a water quality issue.
For zinc, the median concentration calculated from PCS, the average concentration from the Canadian study, and the maximum of the range provided in the 1996 Preliminary Data Summary exceeded the baseline value. EPA compared the zinc concentrations from petroleum refineries to BAT limitations (or basis) for three promulgated regulations:
1) Metal Finishing (40 CFR Part 433) - EPA recently evaluated the Metal Finishing Category when developing the Metal Products and Machinery regulations (40 CFR Part 438). EPA decided not to revise the Metal Finishing limitations for zinc (1.48 milligrams per liter, monthly average). The concentrations of zinc in refinery effluents are well below the Metal Finishing standard.
2) Centralized Waste Treatment - Organics Treatment and Recovery Subpart C (40 CFR Part 437.31) - EPA based the BPT monthly average limitation for zinc (0.420 milligrams per liter) on biological treatment. The concentrations of zinc in refinery effluents are below the standard
7-69

Section 7 - Petroleum Refining
established for the Organics Treatment and Recovery Subcategory of the Centralized Waste Treatment regulations.
3) Metal Molding and Casting (40 CFR Part 464) - The treatment technology that serves as the basis for BAT limitations for Metal Molding and Casting is lime precipitation and sedimentation, followed by filtration. This effective metal control technology can achieve 30-day effluent concentrations of zinc equal to 0.26 milligrams per liter (ferrous subcategory) and 0.18 milligrams per liter (nonferrous subcategory). The median zinc concentrations for U.S. refineries are below even the concentrations achieved using lime precipitation and sedimentation, followed by filtration technology.
7.8.4 Metals Control Technologies
The metal concentrations in refinery final effluents are typically below treatable levels; however, permit writers may identify refinery-specific problems. Permit writers should use BPJ to evaluate available pollution prevention and treatment technologies when establishing NPDES permit limitations.
Metals are found in crude petroleum and petroleum products. The main pollution prevention steps that refineries can take are to quickly identify and correct any leaks and to maintain controls to prevent petroleum spills from reaching any sewers or other waters. In addition, refineries can monitor the amount of metals (especially mercury) present in incoming crude oil and reject shipments that exceed the refinery’s acceptable levels.
Selenium and vanadium are two metal pollutants that have been identified in some refinery discharges. Vanadium can be removed from wastewater through sulfide precipitation. Typically the reaction is carried out with a pH of 7.0 to 9.0 (38). Existing control of selenium generally consists of source control requirements. However, selenium has been demonstrated to be removed from wastewater through sulfide precipitation at a pH of 6.5 (8).
7.8.5 Detailed Study Findings for Metals
Below is a summary of findings of EPA’s detailed study of refinery metals.
C Metals that may be present in petroleum refining wastewater include aluminum, arsenic, chromium, copper, lead, mercury, nickel, selenium, vanadium, and zinc. Crude petroleum is the primary source of metals in refinery wastewater. The concentration of a metal in the crude depends on the source of the crude.
C Using TRI data as reported (and accounting for POTW removals), EPA estimated that refineries discharged 182,265 pounds (83,266 TWPE) of
7-70

Section 7 - Petroleum Refining
metals in 2000. Vanadium discharges from 14 refineries compose 65 percent of the TWPE (> 55,000 TWPE).
C Using PCS data as reported, EPA estimated that refineries discharged 202,860 pounds (33,547 TWPE) of metals in 2000. Selenium discharges from 18 refineries compose 27 percent of the TWPE (9,000 TWPE).
C EPA identified concentration data from the 1996 Preliminary Data Summary (from site visits and from the Canadian study BAT for Ontario Petroleum Refining Sector) and API comments. In addition, EPA calculated metals concentrations using PCS mass discharges and flow rates. Median concentrations of arsenic, copper, lead, mercury, and nickel did not exceed the baseline value or method detection level. This indicates that the refineries discharge these pollutants below detectable or treatable concentrations.
C The median concentrations of chromium, selenium, vanadium, and zinc exceed baseline values in at least one data source. These four metals are discussed below:
— The effluent guidelines at 40 CFR Part 419 include limitations for chromium. The concentrations of chromium in any refinery wastewater evaluated are well below the concentration upon which current limitations were based. In addition, chromium was detected in only one data source at a concentration slightly above the baseline value.
— Local limits are currently used to regulate selenium discharges from refineries.
— EPA has not historically regulated selenium and vanadium discharges in existing ELGs due to difficulties in obtaining optimal removals using traditional wastewater treatment technologies.
— In evaluated data, the zinc concentrations in U.S. refinery effluents are below previously promulgated limitations (Metal Finishing, 40 CFR Part 433 and Centralized Waste Treatment, 40 CFR Part 437) and BAT basis concentrations (Metal Molding and Casting, 40 CFR Part 464).
Based on data as reported to PCS and TRI, metals contribute 17 to 22 percent of the TWPE reported released by petroleum refineries in 2000. Based on the information for the detailed review, EPA concludes that the concentration of metal pollutants in refinery wastewaters is at or near treatable levels, leaving little to no opportunity to reduce metals discharges through conventional end-of-pipe treatment. Further, EPA did not identify an in-
7-71

Section 7 - Petroleum Refining
process waste stream with high concentrations of metals and, similarly, could not identify an appropriate in-process treatment technology.
7.9 Conventional and Nonconventional Pollutants
Conventional pollutants found in petroleum refinery wastewater include BOD5, total suspended solids (TSS), oil and grease, and pH. Nonconventional pollutants found in petroleum refining wastewater include ammonia as nitrogen (N), chemical oxygen demand (COD), cyanide, phenols, and sulfide. The current petroleum refining regulations (40 CFR Part 419) include limitations for all the conventional pollutants listed above, as well as ammonia as N, COD, phenols, and sulfide. 40 CFR Part 419 does not limit cyanide discharges from petroleum refineries.
7.9.1 Reported Conventional and Nonconventional Pollutant Discharges
The estimated conventional and nonconventional pollutant loadings for the petroleum refining industry are based on PCS data. In 2000, 104 refineries reported wastewater releases of conventional pollutants to PCS, and 102 refineries reported wastewater releases of nonconventional pollutants to PCS. In addition, EPA has discharge data for conventional and nonconventional pollutants for 138 refineries from the 1996 Preliminary Data Summary.
7.9.1.1 Mass Discharges: PCS
Table 7-31 presents the pollutant loadings for conventional and nonconventional pollutants (excluding metals), and, for comparison, the metal loadings, estimated using discharges reported to PCS in 2000. Nonconventional pollutants (excluding metals) account for 83 percent of the total TWPE discharged by the industry using PCS data.
Table 7-31. Conventional and Nonconventional Pollutant Discharges in PCS
Pollutant
PCS Loads
Conventional pollutants
Nonconventional pollutants (excluding metals)
Metals
Total
Total Pounds Discharged (millions)
287
0.202
332
Total TWPE Discharged
1
159,315
33,547
192,862
Percentage of Total TWPE Discharged
1
83%
17%
Source: PCSLoads2000.1EPA does not have TWFs for conventional pollutants, therefore, it cannot calculate TWPEs for these pollutants.
7-72

Section 7 - Petroleum Refining
Tables 7-32 and 7-33 present the pollutant loadings for certain conventional and nonconventional pollutants estimated using discharges reported in 2000. EPA does not assign TWF to conventional pollutants. The nonconventional pollutant, sulfide, accounts for 63 percent of the total TWPE using PCS data; 70 refineries reported discharging more than 100,000 TWPE of sulfide.
Table 7-32. Conventional Pollutants with Highest Estimated Pounds Discharged (PCS)
Pollutant
PCS Top 5 Conventional Pollutants
Number of Refineries
Total Million Pounds Discharged
Total TWPE Discharged
Total suspended solids 97 27 -
Oil and grease, freon extr-grav method 69 7.5 -
BOD, 5-day 93 6.7 -
BOD, carbonaceous 5-day 6 0.76 -
Oil and grease 21 0.63 -Source: PCSLoads2000.
Table 7-33. Nonconventional Pollutants with Highest Estimated TWPE (PCS)
PCS Top 5 Nonconventional Pollutants (except metals)
Pollutant Number of Refineries
Total Million Pounds Discharged
Total TWPE Discharged
Sulfide, total1 70 0.036 100,734
Chlorine, total residual 13 0.052 25,357
Fluoride, total (as F) 11 0.46 16,198
Phenolics, total recoverable 68 0.26 7,336
Nitrogen, ammonia, total2 87 2.0 3,581 Source: PCSLoads2000.1Sulfide, Total includes Sulfide, Total (as S).2Nitrogen, Ammonia Total includes “Nitrogen Ammonia Total (AS N)” and “Nitrogen Ammonia Total (AS NH4).”
7.9.1.2 Conventional and Nonconventional Pollutant Concentrations
EPA reviewed concentration data for petroleum refinery conventional and nonconventional pollutants and compared these concentrations to baseline values and promulgated effluent guidelines. The data sources for this data are discussed in the following section and Table 7-34 presents these data.
7-73

Section 7 - Petroleum Refining
Table 7-34. Pollutant Discharge Concentrations for Conventional and Nonconventional Pollutants at Petroleum Refineries
7-74
Pollutant
Preliminary Data Summary Site Visit Data (6 refineries) Range, mg/L
Canada Study Data (7
refineries) Average, mg/L
1993/1994 Wastewater
Treatment Effluent Data (10 refineries)
Median, mg/L
2000 PCS Concentration Median, mg/L
EPA Method Number
Baseline Values, mg/L
Comparison to Concentration Basis of Existing Regulation or
Other Recently Promulgated
Regulations, mg/L
Source 1 2 3 4 5 6
TSS 8.75-12 22 10 12.71 160.2 4.0 101
Oil and grease 2.7-4.2 2.17 NA 3.54 1664 5.0 51
Ammonia (as N) 0.94-1.43 1.7 NA 1.28 350.2 0.05 42
COD 51-59.5 49.2 55.2 71.50 410.1 5.0 86 - 8563
Phenols, total 0.005-0.012 0.0110 NA 0.018 420.2 0.05 0.11
Sulfide, total 0.018-0.14 0.08 0.08 0.026 D4658 1.0 0.11
Pollutants without Limitations at 40 CFR Part 419
Cyanide, total NA 0.007 0.01 0.014 335.2 0.02 NR
Fluoride, total NA NA NA 3.8 340.1 0.1 NR
Chlorine, total residual
NA NA NA 0.082 4500 0.1 NR
NA - Not available. NR - Not regulated. Sources: 1. U.S. EPA, 1996 Preliminary Data Summary, Table 4-4. 2. U.S. EPA, 1996 Preliminary Data Summary, Table 4-5, taken from BAT for Ontario Petroleum Refining Sector, August 1991. 3. API Comment, Table 4, 1993-94 data collected in conjunction with EPA/OSW.4. Calculated using BOD5-associated flow, and PCSLoads2000 estimated annual mass discharge.5 &6. U.S. EPA, Development Document for Centralized Waste Treaters (CWT) Point Source Category, Table 15-1. And for Total Residual Chlorine: U.S. EPA, AlternativeDisinfectants and Oxidants Guidance Manual (EPA 815-R-99-014). Office of Water. April 1999. 1BPT/BAT-equivalent concentration for existing regulation (40 CFR Part 419) as listed in U.S. EPA, Development Document for Effluent Limitations Guidelines and New SourcePerformance Standards for the Petroleum Refining Point Source Category, April 1974.2Monthly average ammonia limitation recently promulgated in Meats Subcategory (40 CFR Part 432).3Monthly average COD limitation promulgated in 1998 for the Pharmaceutical Manufacturing Category (40 CFR Part 439).

Section 7 - Petroleum Refining
Preliminary Data Summary
As part of the study described in EPA’s 1996 Preliminary Data Summary (24), EPA visited and collected effluent data from six refineries. Table 7-34 presents the range of effluent concentrations collected from these refineries for selected conventional and nonconventional pollutants. The data did not include cyanide concentrations.
EPA also obtained one-year average concentration data collected during Ontario’s Seven Refineries Study, conducted in 1989. Table 7-34 presents these average concentrations (24).
API Comments
EPA received comments from API on the December 31, 2003 Notice of the Preliminary Effluent Guidelines Program Plan for 2004/2005. API provided a set of petroleum refining effluent data that were previously collected by its members in conjunction with EPA’s Office of Solid Waste (1). Data were collected from refineries that use activated sludge treatment. Table 7-34 presents the median of the analytical results. The data did not include concentrations for oil and grease, ammonia, or phenol.
Calculated PCS Concentrations
As described in Section 7.2.2, EPA used data reported to PCS to estimate annual pollutant mass discharges. As further described in Section 7.5.2, EPA used PCS data to estimate annual process wastewater flow rates. EPA assumed that flows from effluent outfalls with limitations for BOD5 and/or ammonia (as nitrogen) were process-related. For each refinery discharging conventional and nonconventional pollutants as reported to PCS (in pounds), EPA estimated the pollutant concentration by dividing the mass discharged by the flow rate (and correcting the units). Table 7-34 presents the range of estimated pollutant concentrations.
Baseline Values
Table 7-34 also presents baseline values for the conventional and nonconventional pollutants to compare to the pollutant concentrations measured at petroleum refineries. Section 7.8.3.2 describes baseline values in further detail.
Comparison of Concentrations
As shown in Table 7-34, with the exception of total suspended solids (TSS), the median concentrations of conventional and nonconventional pollutants are below the concentrations used as the basis for the limitations in 40 CFR Part 419. Median concentrations of four pollutants (TSS, ammonia (as N),COD, and total fluoride) were above the baseline values. The existing petroleum BPT/BAT limitations are based on wastewater equalization and stormwater diversion, multistage oil and solids removal, biological treatment, and effluent
7-75

Section 7 - Petroleum Refining
polishing. EPA did not identify any additional treatment technologies to further reduce concentrations conventional and nonconventional pollutants in refinery wastewater.
Total Suspended Solids. Two of the six refineries visited as part of the 1996 Preliminary Data Summary had TSS concentrations in the final effluent above BPT/BAT levels. Ninety-one petroleum refineries reported TSS to the 2000 PCS and 54 (59 percent) had TSS concentrations in the final effluent above BPT/BAT levels.
Ammonia (as N). This pollutant contributes 3,581 TWPE to surface water discharges from petroleum refineries. The current concentrations of ammonia (as N) are below the monthly average ammonia limitation (4 mg/L) recently promulgated for the Meats and Poultry Products Category (40 CFR Part 432).
Total Phenols. This pollutant contributes 7,336 TWPE to surface water discharges from petroleum refineries. Petroleum refineries are currently achieving final effluent concentrations less than baseline values and less than existing limits at 40 CFR Part 419.
Total Sulfides. This pollutant contributes 100,734 TWPE to surface water discharges from petroleum refineries. Petroleum refineries are currently achieving final effluent concentrations less than baseline values and less than existing limits at 40 CFR Part 419. Only one of the six refineries visited for the 1996 Preliminary Data Summary exceeded the BPT/BAT basis concentration for total sulfide.
Total Fluoride. This pollutant contributes 16,198 TWPE to surface water discharges from petroleum refineries. Petroleum refineries are currently discharging concentrations of total fluoride above the baseline value. EPA currently does not regulate this pollutant for the petroleum refining industry.
Total Residual Chlorine. This pollutant contributes 25,357 TWPE to surface water discharges from petroleum refineries. Petroleum refineries are currently achieving final effluent concentrations less than the baseline value. EPA currently does not regulate this pollutant for the petroleum refining industry.
7.9.2 Detailed Study Findings for Conventional and Other Nonconventional Pollutants
Below is a summary of the findings of EPA’s detailed study of refinery conventional and nonconventional pollutants.
C Regulations at 40 CFR Part 419 establish limitations for all conventional pollutants, except fecal coliform. EPA also established limitations for the nonconventional pollutants ammonia as nitrogen, COD, total phenols, and total sulfide.
7-76

7.10
Section 7 - Petroleum Refining
C Using PCS data, EPA estimated that refineries discharged 45 million pounds of conventional pollutants and 287 million pounds (159,315 TWPE) of nonconventional pollutants in 2000. Sulfide discharges from 70 refineries compose 63 percent of the TWPE (> 100,000 TWPE).
C EPA identified concentration data for TSS, oil and grease, ammonia as N, COD, total cyanide, total phenols, and total sulfide from the 1996 Preliminary Data Summary (from EPA site visits and from the Canadian study BAT for Ontario Petroleum Refining Sector (13)) and from data supplied in API comments. In addition, EPA calculated concentrations using PCS mass discharges and flow rates. With the exception of total suspended solids, the median pollutant concentrations were below 40 CFR Part 419 limitations or pollutant baseline values. Although certain pollutants (e.g., sulfide) contribute the large majority of TWPE discharged by petroleum refineries, the data demonstrate that refineries are currently discharging nonconventional pollutants at concentrations at (or near) treatable levels.
Therefore, based on the information for the detailed review, EPA concludes that refineries are treating nonconventional pollutants to concentrations at or near treatable levels.
Pollution Control
Additional pollution reduction may include both pollution prevention and end-of-pipe treatment, although as highlighted in the EPA Office of Compliance sector notebook, Profile of the Petroleum Refining Industry: “Pollution prevention techniques are often more cost-effective than pollution reduction through end-of-pipe treatment” (32). Wastewater pollution prevention strategies are presented below. Additional opportunities in the area of general operating and maintenance practices and procedures, and design revisions and modifications to various refining processes are described in EPA’s Profile of the Petroleum Refining Industry (32), Washington Sate Department of Ecology’s Water Pollution Prevention Opportunities in Petroleum Refineries (37), and DOE Office of Energy Efficiency and Renewable Energy’s Water Use in Industries of the Future: Petroleum Industry (22).
C Process or equipment modifications:
— Reduce cooling tower blowdown by minimizing TDS in the cooling water. This can be achieved by removing calcium carbonate in the makeup water (or on a side stream of the cooling tower recycle system) by cold lime softening, reverse osmosis, or electrodialysis treatment. (32)
— Increase sensible heat transfer and therefore minimize evaporative losses using improved cooling tower designs (22).
7-77

Section 7 - Petroleum Refining
— Use high-pressure water to remove entrained solids from heat exchanger bundles. Separate the solids at the source or use antifoulants on the bundles to reduce scaling. (32)
— Limit surfactant use in cleaning operations; surfactants can increase the generation of emulsions and sludges (32).
— Destroy dioxins in flue gases in a furnace firebox, or capturing in a filter, rather than transferring them to scrubber water (37).
C Waste segregation:
— Segregate relatively clean runoff from process sewers, which results in more efficient process wastewater treatment (32).
— Control solids entering sewers to reduce generation of oily sludges (32).
C Material substitution:
— Use mercury-free caustic in FCC air emission scrubbers (32).
— Replace chromate-based anticorrosives with less toxic alternatives, such as phosphates, in cooling towers and heat exchangers (32).
C Re-use:
— Reuse steam-stripped sour water or other treated wastewater as desalter make-up (32). The steam-stripped sour water contains a high concentration of phenolic compounds that are returned to the crude when used as desalter water makeup (22).
— Blowdown from the steam systems including oily condensate may be used as desalter water makeup (22).
— Reuse boiler blowdown, treated wastewater or stormwater runoff as makeup water to the cooling tower (22).
— Use treated wastewater from off-site locations as makeup water.
Petroleum Refining References
1. American Petroleum Institute. Comments Re. Notice of Preliminary Effluent Guidelines Program Plan. March 18, 2004.
7-78
7.11

Section 7 - Petroleum Refining
2. BP Oil Company. Water Samples for PCDD/PDCF for the BP Oil Company Toledo Refinery, Performed by Batelle. November 9, 2000.
3. The County Sanitation Districts of Los Angeles County. Comments for the Preliminary Effluent Guidelines Program Plan for 2004/2005. James F. Stahl. Whittier, CA. March 5, 2004.
4. Eastern Research Group, Inc. Memorandum: Estimated PAC Concentrations for the Petroleum Refining Industry. July 12, 2004.
5. Eastern Research Group, Inc. Memorandum: Meeting Between EPA and Representatives of American Petroleum Institute and National Petrochemical & Refiners Association. DCN: 00809. February 16, 2004.
6. Eastern Research Group, Inc. Memorandum: Meeting Between EPA and Representatives of Lyondell-Citgo Refining, LP. March 12, 2004.
7. Eastern Research Group, Inc. Toxic Equivalents for Dioxins Reported in 2000 to TRI (Calculation Sheet). April 13, 2004.
8. Eckenfelder, W. Wesley, Jr. Principles of Water Quality Management. CBI Publishing Company, 1980. Page 491.
9. Gulf Coast Waste Disposal Authority (GCA). 2003 Peak Performance Award Application.
10. GCA. Comments on the Notice of the Preliminary Effluent Guidelines Program Plan for 2004/2005 (68 Fed. Reg. 75515, December 31, 2003), Docket Number OW-2003-0074.
11. National Petrochemical & Refiners Association. Comments by the National Petrochemical & Refiners Association (NPRA) on “Notice of Preliminary Effluent Guidelines Plan,” Published on December 31, 2003 (68 FR 75515). Norbert Dee. Washington, D.C. March 15, 2004.
12. Oil & Gas Journal. “2001 Worldwide Refining Survey.” Volume 99.52. December 24, 2001.
13. Ontario Ministry of the Environment. Best Available Technology Options for the Ontario Petroleum Refining Sector. Municipal/Industrial Strategy for Abatement (MISA) Program, ISBN 0-7729-9778-0. DCN 00398. August 1991.
7-79

Section 7 - Petroleum Refining
14. Personal Communication, Chris Matthews, Lyondell-Citgo Refining, Houston, Texas. February 26, 2004.
15. Personal Communication, Christopher Abshire, Lyondell-Citgo Refining, Houston, Texas. March 2004.
16. Personal Communication, Gail Froiman, EPA Office of Environmental Information. November 13, 2003.
17. Personal Communication, Nancy Kmet, Washington (State) Department of Ecology. June 30, 2004.
18. Shell Oil Products U.S. Puget Sound Refinery. Dioxin Study Report (NPDES Permit WA-000294-1). June 2004.
19. Tosco Refining Company Avon Refinery. Dioxin Source Investigation Pursuant to Cease and Desist Order No. 95-151, Final Report. April 1, 1997.
20. U.S. Department of Energy (DOE). Petroleum Supply Annual 2000, Volume 1. Energy Information Administration.
21. U.S. DOE. Refinery Capacity Data as of January 1, 2001. Data compiled from EIA-820, “Annual Refinery Report,” Energy Information Administration. http://www.eia.doe.gov/oil_gas/petroleum/data_publications/refinery_capacity_d ata/refcapacity.html
22. U.S. DOE. Water Use in Industries of the Future: Petroleum Industry. Office of Energy Efficiency and Renewable Energy. Washington, D.C. July 2003.
23. U.S. Department of Health and Human Services. Report on Carcinogens, Tenth Edition. Public Health Service, National Toxicology Program. December 2002.
24. U.S. EPA. 1996 Preliminary Data Summary for the Petroleum Refining Category. DCN 00402. Washington, D.C. April 1996.
25. U.S. EPA. Alternative Disinfectants and Oxidants Guidance Manual. EPA-815-R-99-014. Washington, D.C. April 1999.
26. U.S. EPA. Development Document for Centralized Waste Treaters (CWT) Point Source Category. EPA-821-00-020. Washington, D.C. August 2000.
27. U.S. EPA. Development Document for Effluent Limitations Guidelines and New Source Performance Standards for the Petroleum Refining Point Source Category. October 1982.
7-80

Section 7 - Petroleum Refining
28. U.S. EPA. Development Document for Final Effluent Limitations Guidelines and Standards for the Metal Molding and Casting (Foundry) Point Source Category. EPA-440-1-85-070. October 1985.
29. U.S. EPA. Emergency Planning and Community Right-to-Know Act Section 313 Guidance for Reporting Toxic Chemicals within the Dioxin and Dioxin-Like Compound Category. EPA-745-B-00-021. December 2000.
30. U.S. EPA. Emergency Planning and Community Right-to-Know Act - Section 313: Guidance for Reporting Toxic Chemicals: Polycyclic Aromatic Compounds Category. EPA-260-B-01-03. August 2001.
31. U.S. EPA. Exposure and Human Health Reassessment of 2,3,7,8-TCDD and Related Compounds. Draft Final Report. EPA-600-P-00-001Bb. September 2000.
32. U.S. EPA. Industry Sector Notebook: Profile of the Petroleum Refining Industry. EPA-310-R-95-013. September 1995.
33. U.S. EPA. Memorandum: Toxic Weighting Factor for Petroleum Refining Polycyclic Aromatic Compounds. DCN 00646. December 11, 2003.
34. U.S. EPA. PCSLoads2000. Engineering and Analysis Division, 2004.
35. U.S. EPA. TRIReleases2000. Engineering and Analysis Division, 2004.
36. Washington State Department of Ecology (WA DOE), Letter of Transmittal. December 11, 2003 (DCN 00711): Tesoro Northwest study, May 2001; Cherry Point Refinery study, July 2001; and U.S. Oil & Refining study, August 15, 2003.
37. WA DOE. Water Pollution Prevention Opportunities in Petroleum Refineries. DCN 00405. November 2002.
38. Palmer, Breton, Nunno, Sullivan, and Surprenant. Metal/Cyanide Containing Wastes: Treatment Technologies. Noyes Data Corporation, page 390. 1988.
7.12 Petroleum Bulk Stations and Terminals
7.12.1 Introduction
In conjunction with the detailed review of the Petroleum Refining category, EPA also analyzed data associated with the Petroleum Bulk Stations and Terminals (PBST) Industry, SIC code 5171. Because of similarity of operations and wastewater characteristics, EPA studied PBSTs as a potential new subcategory of the Petroleum Refining category (40 CFR Part 419). This Section builds upon EPA’s earlier study of the industry titled Draft Profile of the Petroleum
7-81

Section 7 - Petroleum Refining
Bulk Stations and Terminals (PBST) Industry, March 3, 2003, which can be found at the EPA E-Docket. The earlier study is divided into several Adobe Acrobat files with Document ID numbers OW-2003-0074-0494, OW-2003-0074-0495, OW-2003-0074-0496, and OW-2003-0074-0497.
For this review, EPA verified TRI and PCS data from the year 2000, examined comments to the Preliminary 2004/2005 Effluent Guidelines Plan, contacted state and regional permitting and compliance authorities, conducted site visits, and met with industry groups in order to consider possible pollution prevention and wastewater treatment methods for PBSTs.
7.12.2 Data Sources
This section describes the data sources EPA used for the PBST study. This section also describes data quality limitations and verification activities. Section 4.2 of this document provides a general description of TRI, PCS, and U.S. Economic Census data sources. Section 4.2.4 discusses the calculation of toxic-weighted pound equivalents (TWPE) for certain data sources. This section discusses data sources specifically as they pertain to the PBST industry review.
7.12.2.1 Toxic Release Inventory
All PBST facilities with more than 10 employees that meet certain chemical threshold criteria must report to EPA’s TRI program. Of the 9,104 PBSTs operating in the United States (1997 U.S. Census and other sources), 502 (5.5 percent) reported to TRI in 2000, with only 167 (1.8 percent) reporting discharges to POTWs and surface waters of the United States. As reported to TRI, the total estimated TWPE discharge in 2000 by PBSTs was 8,010 TWPE. Of the 167 PBST facilities reporting pollutant discharges to water, 125 discharged wastewaters directly and 27 discharged indirectly through POTWs, with the remaining 15 being both direct and indirect dischargers. The 125 solely direct dischargers accounted for 5,325 TWPE discharged, while the solely indirect discharging facilities discharged 8 TWPE. The 15 facilities that were both direct and indirect dischargers accounted for 2,677 TWPE discharged. As with other industries studied, EPA used TRI information to estimate pollutant loadings and to identify treatment technologies used within the industry. (1)
EPA reviewed TRI data, particularly for those facilities and pollutants which contributed significantly to the total TWPE estimate. For example, facilities may estimate releases in a number of ways, when reporting to TRI. If a chemical is not detected in the effluent, facilities may estimate the discharge by using one-half of the detection limit. This may overestimate the amount of chemical discharged.
Facilities report some chemical groups, including the 21 chemicals included in the PAC category to TRI. Facilities are required to report the combined mass of PACs released. They do not report releases of individual PAC compounds to TRI. For PBSTs, to calculate the TWPE of PACs reported in TRI, EPA used the toxicity weighting factor (TWF) for benzo(a)pyrene. See Section 4.4.4.3 for a more detailed discussion on PACs.
7-82

Section 7 - Petroleum Refining
To verify the data reported to TRI, EPA performed the following activities:
C Confirmed that facilities reporting in SIC code 5171 were, in fact, PBSTs, through, for example, contacts with the relevant permit writers; and
C Reviewed comments submitted in response to the December 31, 2003 Preliminary Effluent Guidelines Program Plan.
Facility Specific Verification of TRI Data
The PBST reporting the largest TWPE discharges in the 2000 TRI database is the Coastal Oil of New England facility in South Boston, MA (NPDES ID MA0004405). The facility’s discharges totaled 3,290 TWPE, driven by PACs and other petroleum hydrocarbons. These discharges total approximately 40 percent of the total TRI reported TWPE discharges for 2000. Through contact with Region 1, EPA learned that Coastal Oil ceased operations in 2000 (2). Since EPA’s baseline for the industry’s review was 2000, Coastal Oil’s data are still in EPA’s description of the industry. Nevertheless, the facility’s current status significantly influenced EPA’s final decision regarding effluent guidelines development for the industry.
Comment Received on the 2004/2005 Preliminary Effluent Guidelines Program Plan Pertaining to TRI
EPA received one facility-specific TRI-related comment from ConocoPhillips relevant to PBSTs. ConocoPhillips noted that its Kansas City Terminal, which reported discharges of more than 2,600 TWPE and ranked second in TWPE discharged in 2000, is co-located with the Kansas City Refinery, and shut down in 1983. Site remediation of the old refinery site includes groundwater remediation and discharge under an NPDES permit held by the Kansas City Terminal. ConocoPhillips asserted that the discharge of the treated groundwater accounts for the toxic discharges reported by the facility, as no process wastewater is discharged by the terminal and the only discharge associated with the terminal was stormwater. ConocoPhillips concluded by stating that the Kansas City Terminal’s discharge of wastewater associated with site remediation should be eliminated from EPA’s consideration of effluent guidelines for PBSTs.
After excluding the Kansas City Terminal’s discharges from the PBST TWPE, ConocoPhillips explained that 61 percent of the TWPE discharge came from one facility and 94 percent from three facilities. Therefore, EPA should develop individual permits rather than national categorical ELGs.
Commenters also provided general comments on the TRI data itself. The Independent Liquid Terminals Association stated that TRI data show toxic discharges from PBSTs are minuscule, and five facilities accounted for 97 percent of the TWPE discharges. The American Petroleum Institute (API) noted that only six facilities in TRI reported the discharge of PACs, accounting for 99 percent of the industry’s estimated TWPE discharges. In addition, API noted that 85 percent of the TRI TWPE discharges were due to two facilities in Massachusetts.
7-83

Section 7 - Petroleum Refining
7.12.2.2 Permit Compliance System
States may submit data from PBSTs’ discharge monitoring reports (DMRs) to PCS. The data from each DMR will vary depending on the PBST’s NPDES permit requirements. Refineries that discharge to a POTW, or that transfer their wastewater to a private waste treater, do not submit DMRs; therefore, their data are not in PCS. In addition, PCS typically does not include data for refineries that states classify as “minor sources.” Of the 9,104 PBSTs operating in the U.S. in 2000, data from eight (0.1 percent) PBSTs were included in the 2000 PCS. These eight facilities discharged 5,389 TWPE in 2000, with two reporters, Exxon Mobil’s terminals in East Provide, RI (NPDES ID RI0001333) and Everett, MA (NPDES ID MA0000833) accounting for more than 99 percent of the reported TWPE discharges. (1)
To verify the data reported to PCS, EPA performed the following activities:
C Confirmed that facilities reporting in SIC code 5171 were, in fact, PBSTs, through, for example, contacts with the relevant permit writers and crosschecks with other databases; and
C Reviewed comments submitted in response to the December 31, 2003 Preliminary Effluent Guidelines Program Plan.
Facility Specific Validation of PCS Data
One of the eight PCS major facilities identified early in the screening process was Lyondell Chemical Company in Texas (NPDES ID TX0069493). EPA’s contacts with the Texas Commission on Environmental Quality’s (TCEQ) water permits office suggested that the facility was not, in fact, a PBST. EPA examined the Enforcement and Compliance History Online (ECHO) database, which reported that the facility was a PBST. EPA then reviewed the facility’s TRI reports from 1997 to 2001 and the only reported SIC codes were 2865 and 2869. Given what EPA learned from TCEQ and older TRI reports, EPA concluded that the facility was not a PBST. As a result, EPA removed the PCS loads for Lyondell Chemical Company from the PBST industry’s total loadings.
A similar discovery was made regarding the Texaco Guayanilla Terminal (NPDES ID PR0021024). As with the Lyondell Chemical facility, EPA concluded after crosschecking ECHO and the TRI reports from 1997 to 2001 that the facility was not a PBST. EPA, thereafter, removed its contribution to the 2000 PCS loadings for the PBST industry.
Comment Review
EPA received no PCS-related data from commenters and no comments from facilities requesting corrections to 2000 PCS data.
As with respect to the 2000 TRI data, however, commenters did address the PCS data itself. ILTA stated that, of the PCS majors, only two PBSTs discharge large amounts of
7-84

Section 7 - Petroleum Refining
toxic organics and that both facilities are listed among the TRI reporting facilities. In addition, they asserted that these two facilities represent only 0.00187 percent and 0.0005 percent, respectively, of the total TRI loadings of 8,010 TWPE. As a result, they concluded that the toxic releases from those facilities are trivial.
API also addressed the PCS data by noting that, since only eight facilities are major dischargers, the majority of the industry is made up of minor dischargers. Moreover, they noted that the PCS data for major facilities show average discharge concentration of 16.9 mg/L of total conventional pollutants, 48 mg/L for total nonconventional pollutants, and 0.068 mg/L for total priority pollutants. API asserted that these concentrations are very low and reflect very effective wastewater treatment and low pollutant discharges. Finally, API concluded by stating that these effluent concentrations indicated that individual effluent discharges do not present a potential risk to human health and the environment.
7.12.2.3 Other Data Sources
EPA also collected data from several other sources, listed below:
C Contacts with regional and state permitting and compliance authorities EPA contacted control authorities in the regions and states that contained the largest dischargers reporting to the 2000 TRI and PCS databases. EPA inquired about permitting issues for the industry, wastewater characteristics, how the industry handles its wastewater, and industry trends (3);
C Contacts with treatment technology vendors - EPA contacted treatment technology vendors to gather information on new options to reduce pollutant concentrations in PBST wastewater;
C Industry-provided information/comments - In response to the December 31, 2003 notice of the Preliminary Effluent Guidelines Program Plan, EPA received comments from ILTA, API, the Regional Citizens’ Advisory Council for Prince William Sound (RCAC), Alyeska Pipeline, the Petroleum Marketers Association of America (PMAA), the New England Fuel Institute, the Independent Fuel Terminal Operators Association (IFTOA), the Department of the Navy, Amerada Hess Corporation, and ConocoPhillips.
C Site visits - EPA conducted site visits at two PBSTs, one at ConocoPhillips’s Manassas, VA facility and one at Petroleum Fuel & Terminal Company’s facility in Baltimore, MD.
C Industry/trade association meetings - EPA met with API and the Department of the Navy and several trade groups, including ILTA and PMAA (4).
7-85

Section 7 - Petroleum Refining
7.12.3 Industry Description
The PBST industry is one part of the petroleum production, refining, and distribution system. These facilities are categorized by SIC code 5171 Wholesale Trade Nondurable Goods, Petroleum Products, Petroleum Bulk Stations and Terminals. The PBST industry comprises establishments primarily engaged in the wholesale distribution of crude petroleum and petroleum products from bulk liquid storage facilities. Petroleum products handled by PBSTs include crude oil, gasoline, aviation gasoline, jet fuel (JP-4), diesel fuel, fuel oil, kerosene, naphtha, and lubricating oils. Specific types of PBSTs include:
C Bulk gasoline stations; C Bulk petroleum stations; C Crude oil terminals; C Fuel oil bulk stations and terminals; C Gasoline bulk stations and terminals; C Heating oil dealers; C Liquified petroleum gas (LPG) bulk stations and terminals; C Lubricating oils and greases bulk stations and terminals; and C Oil, petroleum, and petroleum products bulk stations and terminals.
Bulk stations and terminals are part of the wholesale trade industry sector. Wholesale is an intermediate step in the distribution of the crude petroleum and petroleum products. The wholesale industry sells or arranges the sale of crude petroleum and petroleum products for resale by other wholesalers or retailers or for further production (intermediate materials). Establishments that sell crude petroleum and petroleum products directly include wholesale merchants, distributors, jobbers, drop shippers, import/export merchants, and sales branches. Establishments that arrange for the sale of crude petroleum and petroleum products (on a commission basis) include agents and brokers, commission merchants, import/export agents, and representatives of brokers, auction companies, and manufacturers. One commenter to the Preliminary Plan, ILTA, also noted that some PBSTs lease the use of their tanks to customers who own the stored product.
7.12.3.1 Industry Groups
Several groups represent facilities in SIC code 5171, many of whom commented on the Preliminary Plan. API represents the major oil companies and wholesale terminals, with about 400 members. PMAA is an umbrella organization representing small, independent bulk station owners and has 44 state and regional trade associations as members, representing about 8,000 marketers nationwide. PBSTs represented by PMAA typically have capacities ranging from 30,000 to 150,000 gallons. ILTA, another trade association, represents approximately 75 companies of all sizes, with about 500 facilities.
7-86

Section 7 - Petroleum Refining
7.12.3.2 Industry Statistics
According to the 1997 Economic Census (Census), there are 7,690 PBSTs (defined under North American Industrial Classification System (NAICS) code 422710), 813 heating oil dealers (NAICS code 454311), and 601 LPG dealers (NAICS code 454312). SIC code 5171 includes all three NAICS codes, for a total of 9,104 facilities. In order to eliminate confusion, from this point onward, all 9,104 facilities will be referred to as ‘PBSTs’ in this report, unless otherwise noted. The Census data include statistics for three types of facilities:
C Merchant wholesalers - manufacturing sites that sell their own products;
C Manufacturers’ sales branches and sales offices - offices that sell products manufactured in the United States by their parent company; and
C Agents, brokers, and commission merchants - agents and brokers sell products from offices but do not handle or own the products; commission merchants sell and handle products on a consignment basis but do not own the products.
A majority (60 percent) of PBSTs have less than 10 employees and 99 percent have less than 100 employees. Over 90 percent of the facilities are corporations, with the remaining consisting of proprietorships and other entities.
The following table presents the geographical distribution of PBSTs (NAICS code 422710) reporting to the Census. Table 7-35 shows the petroleum storage capacity for the top 10 U.S. states, which account for over 50 percent of the total US. storage capacity. Similar data are unavailable for the 1,414 heating oil and LPG dealers.
7-87

Section 7 - Petroleum Refining
Table 7-35. Geographic Distribution of PBSTs, per 1997 Economic Census
State EPA
Region Bulk Stations (except LPG)
Bulk Terminals (except LPG)
LPG Bulk Stations and Terminals Total
Texas 6 598 120 44 762 California 9 359 103 24 486 Louisiana 6 230 42 11 283 Missouri 7 262 15 4 281 North Carolina 4 233 31 10 274 Florida 4 194 52 26 272 Georgia 4 215 45 12 272 Illinois 5 217 33 14 264 Ohio 5 168 47 9 224 Indiana 5 169 33 16 218 Total for Top 10 States 2,645 521 170 3,336 Total for All States 6,045 1,225 420 7,690
PBSTs range in size from about 10,000 gallons to in excess of one million gallons, with the New England Fuel Institute noting in its comments to the Preliminary Plan that PBSTs typically handle on the order of 50,000 gallons of refined petroleum products. PBSTs may be co-located with refineries and may be located along coastlines to accept and treat large volumes of ballast water. Independent facilities are also reported to be widespread, with ILTA reporting that it represents approximately 500 facilities in the United States and 39 other countries (their American membership was not specified). PMAA, in its comments to the Preliminary Plan, reported that its membership of 44 state and regional trade associations represented nearly 8,000 independent petroleum marketers. The New England Fuel Institute asserted that it represented more than 1,000 stand-alone facilities not associated with any refinery. Along with privately operated PBSTs, the Federal Government operates bulk terminals as well. The Department of the Navy reported in an information submission to EPA that it operates 18 PBSTs across the United States (no facility, tank, or wastewater volumes were provided). In addition, in its comments to the Preliminary Plan, the Department of the Navy suggested that a more appropriate volume threshold for PBSTs would be between 50,000 or 100,000 gallons, noting that the definition for SIC code 5171 often encompasses the size of individual tanks at many Department of Defense facilities that serve as mobile fueling stations.
7.12.3.3 Discharge Status
EPA determined the discharge status of the PBST industry using TRI and PCS data. Table 7-36 lists the discharge status for PBSTs operating in the United States during 2000 and reporting to TRI or PCS.
7-88

Section 7 - Petroleum Refining
Table 7-36. Facilities Reporting to TRI and PCS in 2000 and Their Discharge Status
Database Facilities Reporting
Facilities Discharging to Water
Direct Dischargers
Indirect Dischargers
Direct and Indirect Dischargers
TRI 502 167 125 27 15 PCS 8 8 8 - -
In the PCS data system, facilities may be classified as major or minor dischargers. States are not required to provide discharge data for minor facilities to PCS, so reports for minor facilities are incomplete. For this reason, EPA did not use data from minor facilities in this review and did not include them in the pollutant loadings estimates.
This table indicates that the vast majority of PBSTs do not discharge wastewater to waters of the United States.
7.12.3.4 Overview of Operations and Potential Wastewater Sources
The main function of PBSTs is to collect, store, and/or distribute product within the petroleum industry. As part of these operations, PBSTs may also perform tank cleaning, vehicle and equipment washing and maintenance, hydrostatic testing, product heating, and blending operations (i.e., adding additives to petroleum products). The product is collected from refineries or preliminary gathering stations and terminals using three means: pipelines, water transport, and rail transport. Pipeline systems are believed to be the most common, transporting the greatest volume of product nationwide through pipes of various sizes and capacities. Barges with divided sealed compartments transport product on rivers, canals, lakes, and oceans. Although not as common, rail transport is also a means of product delivery. Rail tank cars are often used for low-volume products (e.g., chemicals and lubricants) and typically have capacity for 20,000 to 40,000 gallons. PBSTs off-load materials and store the product in above ground storage tanks7 (ASTs) until distribution by tank trucks to service stations or other industrial and commercial operations.
Product Transfer Operations
The two main processes occurring at PBSTs are product collection and product distribution. Because product transfer areas and loading/unloading racks are areas susceptible to product leaks and spills, which could lead to violations of EPA’s Spill Prevention, Control, and Countermeasures (SPCC) rules, they are specifically designed to minimize environmental release. They have sloped concrete floors that drain into a spill containment system and canopies that minimize rainfall entry into the transfer area. These precautions prevent accidental
7Underground storage tanks (USTs) may be used for loading rack spill containment and drainage systems. An UST system is a tank (or combination of tanks) and connected piping having at least 10 percent of their combined volume underground. UST regulations apply only to underground tanks and piping storing either petroleum or certain hazardous substances. EPA’s Office of Underground Storage Tanks (OUST) web site provides further regulatory information. These regulations do not apply to ASTs.
7-89

Section 7 - Petroleum Refining
spills from spreading beyond the transfer areas and minimize stormwater contact with product residues on the loading/unloading racks, thereby minimizing the volume of contaminated water in the spill containment system. Even with these precautions in place, most facilities also incorporate stormwater tank basins (i.e., stormwater collection tanks) with the capacity to contain any contaminated stormwater resulting from an accidental overflow or equipment failure.
Loading equipment such as piping, valves, and fittings are designed to be compatible with the type of product being handled and durable enough to withstand the stress of pressure and exposure to the elements. The pumps and loading devices are designed to allow appropriate flow of the type of product being transferred. Trained personnel or an automatic control system (or both) minimizes the spills and overflows that occur during product transfer.
Product Collection
PBSTs that receive product by pipeline use a network of pipes equipped with valves and pumps to transfer the product into storage tanks. Although the overall percentage of PBSTs receiving their products by pipeline was not known at the time of this report, a survey of 57 PBSTs conducted by API in 1988, showed that 63 percent received product by pipeline.
Barges and tankers delivering product are usually equipped with high-volume pumps and hoses for transferring product into the storage tanks via fill nozzles. Safe pressure is maintained during product transfer using bypasses or relief valves. The results of the 1988 API survey show that approximately 30 percent of facilities receive product from barges or tankers .
Rail tank car transfers take place in loading/unloading racks equipped with filling hoses or pipes that can be connected directly from the rail car to the storage tanks. Pressure relief systems are provided for the pumping system and the rail car itself. Rail tank cars are typically used to deliver more viscous products, such as lube oil; therefore, only a small portion of PBSTs typically receive product this way.
Product Distribution
Product is distributed from the storage tanks to service stations or other end-use facilities using tank trucks. Tank trucks typically have capacity for 5,000 to 12,000 gallons. Tank truck transfers occur in loading/unloading racks equipped with filling hoses or pipes and pump islands between the truck bays. Product can be transferred from the storage tank to the tank trucks using either top loading or bottom loading methods. There are two types of top loading methods: splash loading and submerged fill pipe loading. Significant turbulence and vapor/liquid contact occur during the splash loading method because the fill pipe dispensing the cargo is lowered only part way into the cargo tank. Liquid turbulence is relatively controlled during submerged loading because the fill pipe extends almost to the bottom of the cargo tank. The level of vapor generation and loss during submerged fill pipe loading is therefore much less than during splash loading. Top loading is most applicable for distillate products and asphalt
7-90

Section 7 - Petroleum Refining
(more viscous products), and is discouraged for flammable liquids due to the potential to generate more vapors.
PBSTs most commonly use the bottom loading method because of reduced air emissions and improved safety. When product enters from the bottom of the tank, liquid turbulence, and therefore air emissions, are minimized. Furthermore, most bottom loading systems have vapor recovery systems in place to capture vapors and pipe recovered product back to the storage tank or to a thermal oxidation unit where the vapor is combusted. Approximately 10 to 30 percent of the displaced vapors never reach the recovery system due to collection system leaks; however, 90 to 99 percent of the product in the vapors that reach the vapor recovery system is recovered.
Product Storage
Between the product collection and distribution processes, the product is stored. PBSTs typically store product in vertical ASTs. Vertical tank storage capacities range from 500 to 300,000 barrels (bbls), or 21,000 to 12.6 million gallons. PBSTs also use horizontal tanks, or drums, for low-volume storage. For example, horizontal tanks are often used to store gasoline additives.
Depending on the volume and type of product stored, facilities use vertical tanks with a variety of roof designs and bottom constructions. Tank roofs can be fixed or floating, and tank bottoms can be cone-shaped, crown-shaped, or flat.
To control air emissions and to prevent product losses, product contamination, and fires, vertical tanks are equipped with one of the following roof types:
C Fixed roof - cover attached to the top of the tank, usually cone- or dome-shaped; includes a breather valve that allows the tank to operate at a slight internal pressure or vacuum;
C Fixed roof with internal floating roof - attached cover and internal roof that floats on the surface of the petroleum, rising and falling with the liquid level;
C Fixed roof with vapor recovery system - attached cover where volatile emissions (vapors) are captured and recovered;
C External floating roof - roof floats on the surface of the petroleum, rising and falling with the liquid level; and
C External floating roof with weather covers (aluminum domes) - cover is not attached to the tank, but provides additional protection.
7-91

Section 7 - Petroleum Refining
Tanks with fixed roofs are closed vessels, and stormwater cannot typically enter these tanks. However, when product is placed in a fixed-roof tank, air must be released and treated to allow room for the product and prevent the tank from building too much internal pressure. Conversely when product is removed from a fixed-roof tank, air must be pumped in to fill its place and prevent the tank from collapsing. Fixed roof tanks are therefore a potential source of air emissions, but not water emissions.
Although floating roof tanks do not require removing and adding air during product transfer, they are more likely to allow stormwater to enter. Most of the stormwater collecting on the tank roof is drained through a tank drain; however, during heavy precipitation, or if a drain clogs, water may penetrate the roof seal and enter the tank. Floating roof tanks are therefore a contributor to the generation of tank bottom water, a source of contaminated wastewater.
Tank bottom water is not typically present at PBSTs in large volumes, but it is believed to be the major source of dissolved contaminants. Because there is much more product than water in a storage tank, the water can become highly concentrated with water-soluble materials in the product. The most common pollutants and bulk parameters/indicators in tank bottom water are as follows:
C Oil and grease;C Total petroleum hydrocarbons (TPH);C Biochemical oxygen demand (BOD);C Chemical oxygen demand (COD);C Total organic carbon (TOC);C Ammonia;C Total suspended solids (TSS);C Phenols;C Total dissolved solids (TDS);C Naphthenic acids;C Aromatics: benzene, toluene, ethyl benzene, and xylene (BTEX); andC Surfactants.
The volume of tank bottom water generated is facility specific and depends on several factors such as number of tanks, tank volumes, the amount of precipitation, the products handled, and the temperature. Commenters and the industry noted that, since no general canvassing of the industry has ever been performed, estimating tank bottoms water volume is very difficult. In its 1988 study, API estimated that a moderate-size PBST has seven large storage tanks (100 foot diameter), and that one inch of water will accumulate in the bottom of the tank during a typical year. This converts to approximately 655 cubic feet of water (roughly 5,000 gallons) per year. If the concentration of a particular pollutant is 10,000 mg/L (0.084 pounds of pollutant per gallon of tank bottom water), almost 3,000 pounds of the pollutant needs treatment at the facility annually (approximately 420 pounds per tank). Most PBSTs will not attempt to handle this load all at once, and, in some cases, control authorities report that PBSTs
7-92

Section 7 - Petroleum Refining
will, instead, draw the tank bottom water into an equalization tank and then gradually feed the water through a wastewater treatment system.
Many commenters to the Preliminary Plan noted that PBSTs often ship their tank bottoms water off site for treatment. Amerada Hess, PMAA, and the New England Fuel Institute stated that facilities will often send their wastes to others for treatment. In addition, ILTA and the County Sanitation Districts of Los Angeles County also noted that some PBSTs send their tank bottoms to refineries for reclamation of their petroleum fractions.
Tank Cleaning
Although not a frequent process at PBSTs, tanks are occasionally cleaned to remove accumulated sludge and residual product. While not usually emptied specifically for cleaning purposes, a storage tank may be cleaned if it is emptied for maintenance or if it is needed to store a different product. Tank cleaning requires removing and disposing of accumulated sludge, recovery and/or treatment of any tank bottom water, and treating of any detergents used for cleaning.
Vehicle and Equipment Washing and Maintenance
Vehicles and other product transferring equipment are sometimes washed on site at a designated area, resulting in wastewater contaminated with detergents and a small amount of product. Facilities handle this wastewater separately from other process wastes because of the potential to form emulsions when detergents and oil are mixed. Vehicle and equipment maintenance is also occasionally done on site, resulting in wastewater containing oil, antifreeze, brake fluid, or other vehicle fluids. This wastewater is also handled separately from other process wastes.
The percentage of PBSTs expected to use detergents to wash vehicles or equipment or to use brake fluid, antifreeze, lubricants, and other oils onsite for vehicle and equipment maintenance could not be estimated, given the data collected from industry and control authorities. As a result, an estimate of contributions toward total wastewater generation is not possible to make. However, of interest is Amerada Hess’s comment to the Preliminary Plan stating that, of the nonstormwater component of PBST wastewaters, equipment and vehicle washing and maintenance waters are a primary fraction.
Hydrostatic Testing
Equipment at PBSTs is periodically checked for leaks by hydrostatic testing. This process involves filling the pipes or tanks with water, applying pressure, and searching for leaks. A high volume of water is discharged at the completion of the testing. Clean hydrostatic test water is discharged directly to a storm drain, but if hydrostatic test water is contaminated with product from the storage equipment, it typically undergoes treatment before it is discharged.
7-93

Section 7 - Petroleum Refining
Neither control authorities nor commenters were able to provide any data to establish the volume of this type of flow. Amerada Hess and the County Sanitation Districts of Los Angeles County identified this as a possible contributor to PBSTs waste streams, but did not provide numerical data.
Product Heating
A PBST that stores heavy products (e.g. asphalt) needs to keep the product hot to maintain its fluidity. Steam coils placed in the product tank can heat the product with steam generated by a boiler. Most boiler feed water contains bicarbonate ions, resulting in the formation of acidic steam (carbon dioxide dissolves in condensed steam to make carbonic acid). The steam condensate is therefore corrosive and necessitates the use of chemicals, typically amines, to control the corrosion. As a result, amines may be present in the boiler wastewater stream. If the amines are not used and the steam coils corrode, steam may leak into the tank, come into contact with product, and become a source of tank bottom water.
Ballast Water Handling
PBSTs located along coastlines often also off-load ballast water from tankers transporting petroleum products, resulting in wastewater that is often contaminated with product. These wastewaters are normally rather dilute and very large in volume and usually undergo treatment before discharge. EPA is aware of one PBST that handles large volumes of ballast water as a result of comments submitted to the Preliminary Plan by Alyeska Pipeline and RCAC. Alyeska’s facility treats and discharges approximately 10 million gallons per day of oily (0.5 to 1.0 percent oil) ballast water. The facility treats the wastewater with oil/water separation, dissolved air flotation, biological treatment, and, as needed, polishes with air stripping. The effluent concentration of oil and grease is typically 3-5 mg/L.
Wastewater Remediation Activities
Soil and/or groundwater under a PBST may be contaminated as a result of past terminal operations, current operations, or off-site contamination that has migrated on site. Groundwater is typically contaminated with dissolved hydrocarbons and is pumped to the surface, treated, and discharged. Soil may have total petroleum hydrocarbon contamination, requiring air sparging or soil washing. Control authorities in New England pointed to this as a widespread problem at PBSTs in their part of the U.S., though were unable to estimate wastewater flows as a result. In the case of New England PBSTs, many are very old and may have inadequate and compromised tanks. As a result, in many areas, mobile petroleum hydrocarbons like MTBE may find their way into the groundwater, rendering a need for remediation (5). As a consequence of these remediation activities, many PBSTs in the Northeast are moving to include granular activated carbon as a polishing step in their treatment systems.
7-94

Section 7 - Petroleum Refining
Stormwater
Stormwater is defined as the portion of precipitation that becomes surface runoff (precipitation minus percolation and evaporation). The amount of stormwater generated at a PBST is dependent on several variables, including the size of the site (and more specifically the size of the process area), climatic conditions (taking into account spatial and temporal considerations), and the extent of pollution prevention practices in place to minimize the contamination of stormwater. Although most facilities use covered loading/unloading racks and geographical barriers (e.g., berms) to avoid contact between stormwater and contaminants in the process area, stormwater remains an issue for PBSTs because it represents the greatest volume of wastewater generated at most facilities. According to API’s 1988 study, the average amount of stormwater generated annually per site (where more than 75 percent were less than 20 acres, and the remaining 25 percent were larger, typically covering 60 to 80 acres) was 20 million gallons.
API also attempted to quantify the average amount of stormwater at PBSTs of varying size and location, using the following assumptions: precipitation ranges from 10 to 50 inches per year, 100 percent of precipitation is runoff (no percolation or evaporation), and PBSTs occupy between 2 and 20 acres. Using these assumptions, API calculated that the smallest PBSTs (2 acres) in the driest regions (10 inches net precipitation annually) incur approximately 0.54 million gallons of stormwater per year, and the largest PBSTs (20 acres) in regions with the most precipitation (50 inches of net precipitation annually) experience approximately 27 million gallons of stormwater per year. Accordingly, the volume of stormwater is very site specific and year specific.
Although stormwater discharge volumes are site-specific, many commenters on the Preliminary Plan noted the overwhelming contribution of stormwater to PBST wastewater flows. Amerada Hess noted that stormwater runoff is the primary wastewater source at PBSTs, at nearly 95 percent of total wastewater discharge. The New England Fuel Institute stated that the only discharge from its member facilities to surface water is stormwater. IFTA, in its comments, asserted that PBSTs only discharge rainwater containing no more than trace amounts of oil, grease, and other pollutants.
Contaminated Stormwater
Stormwater that has come into direct contact with product (e.g., runoff from contaminated surfaces or loading/unloading racks) is contaminated, and therefore collected and treated before being discharged. API estimated that 0.6 percent of all stormwater (3,200 to 162,000 gallons per site annually, using the estimated volumes of 0.54 million gallons and 27 million gallons of stormwater per year) is contaminated.
Not all facilities have sufficient wastewater treatment facilities on site, and must send this contaminated stormwater off site to adjoining refineries, to waste disposal companies, or to regional treatment centers for treatment. Even if the stormwater is clean as it enters a tank basin, it may become contaminated in the event of an accidental product leak or spill into the basin. Facilities may treat this contaminated water by removing the floating oil alone, or may
7-95

Section 7 - Petroleum Refining
need to remove dissolved contaminants, depending on the extent of contamination and the permit and/or POTW requirements. Floating oil is removed with floating skimmers or rope skimmers before any water is drained. Basin water containing dissolved contaminants is removed from the basin and treated as soon as possible to prevent migration of the contaminants to soil or groundwater (especially if the basin is comprised of permeable soil). Some PBSTs pump the contaminated basin water to a storage tank reserved for such situations. Other PBSTs may not have a spare storage tank onsite and instead pump the contaminated basin water into the bottom of a product tank for temporary storage.
Uncontaminated Stormwater
Stormwater that has not come into contact with product is said to be uncontaminated. If a facility determines that stormwater from a particular area onsite (i.e., the facility yard) has relatively no chance of contamination, it typically discharges the stormwater without collection and treatment, unless required by an NPDES or other discharge permit. API estimated that 98.3 percent of all stormwater (0.53 to 26.5 million gallons per site annually, using the best case and worst case volumes calculated above) is classified as having little chance of contamination because it runs over uncontaminated areas such as lawns, driveways, building roofs, parking lots, or undeveloped land.
If a facility determines that stormwater (or any other wastewater) collected in a tank basin is “clean” (i.e., has not come into contact with product or other contaminants), it can be discharged separately to a POTW or surface waters without treatment, or it can be combined with other treated wastewaters prior to discharge. Direct discharge to surface waters tends to be the easier and cheaper option if the water can be gravity drained to the final outfall. However, if the water must be pumped out of the facility, it is typically more cost effective to combine it with other treated waste streams for discharge to a POTW.
7.12.4 Regulatory Background
At this point in time, no national effluent guidelines regulate the discharge of pollutants from PBSTs. There are, however, several other EPA regulations that PBSTs have to comply with, and they are as follows:
C Clean Water Act Requirements;C Clean Air Act Requirements;C Resource Conservation and Recovery Act Requirements;C Emergency Planning and Community Right-to-Know Act Requirements;C Safe Drinking Water Act Requirements; and C Regional and State Programs.
The following sections summarize these regulations.
7-96

Section 7 - Petroleum Refining
7.12.4.1 Clean Water Act
PBSTs that discharge or have the potential to discharge wastewater containing regulated pollutants or other wastes (e.g., process wastewater, secondary containment water, and stormwater) must operate under the terms of federal, state, and/or local permits which include NPDES permits or POTW pretreatment agreements. These permits typically require wastewater monitoring, including amount of water volume discharged and generalized wastewater parameters (e.g., pH or specific pollutant concentrations).
In response to the 1987 CWA amendments, EPA established a program to address stormwater discharges. EPA developed NPDES stormwater permit application regulations to control the discharge of stormwater associated with an industrial activity (i.e., stormwater discharge directly related to manufacturing, processing, or raw material storage areas) (40 CFR Part 122.26(b)(14)). These regulations apply to stormwater from one of the 11 industrial activity categories defined at 40 CFR Part 122.26. 40 CFR Part 122.26(b)(14)(viii), listing transportation facilities of various types specifically lists facilities classified as SIC code 5171.
NPDES stormwater regulations require regulated facilities to obtain coverage under a NPDES stormwater permit and implement stormwater pollution prevention plans (SWPPPs) or stormwater management programs to effectively reduce or prevent the discharge of pollutants into receiving waters. Both the SWPPPs and stormwater management programs use best management practices (BMPs).
According to the U.S. EPA Integrated Compliance Information System (ICIS) retrieval component, the Online Tracking Information System (OTIS), over 700 facilities classified as SIC code 5171 have NPDES permits. NPDES permits for PBSTs usually regulate the discharge of oil and grease, naphthalene, toxicity, benzene, toluene, ethylbenzene, and xylene.
SPCC Plan
The SPCC rule (40 CFR Part 112) requires certain facilities to develop and implement oil spill prevention, control, and countermeasure plans. As part of the SPCC plan, facilities must install containment systems and other countermeasures to prevent oil spills from reaching navigable waters. If a facility is unable to provide secondary containment (e.g., berms around storage tanks), facilities must develop a spill contingency plan as part of the SPCC plan.
On July 17, 2002, EPA issued a final rule to amend the Oil Pollution Prevention regulation, specifically addressing requirements for SPCC plans. Changes to the SPCC rule include eliminating duplicate regulation, exempting certain small facilities and most wastewater treatment facilities, and requiring consideration of industry standards in prevention plans. Industry standards represent good engineering practice and generally are environmentally protective. Under the SPCC rule, EPA allows permit writers to apply industry standards where the standards are both specific and objective and their application may reduce the risk of discharges to and impacts to the environment. EPA allows the application of industry standards
7-97

Section 7 - Petroleum Refining
due to technology advances and resulting specific standard changes. However, if industry standards change in a way that would increase the risk of discharge, EPA will apply and enforce standards and practices that protect the environment, rather than the less protective industry standard. Industry standards that may be used for the SPCC rule have been developed by organizations listed in the July 17, 2002 Federal Register, 67 FR 47058 (40 CFR Part 112). The changes to the SPCC rule are expected to reduce regulatory burden by approximately 55,000 facilities (40 percent).
The revised SPCC rule applies to PBST owners and operators with the following exemptions:
C Completely buried storage tanks subject to all of the technical requirement of the Underground Storage Tank (UST) regulations (40 CFR Part 280, 281);
C Portions of facilities used exclusively for wastewater treatment;
C Storage containers of less than 55 gallons (de minimis container size); and
C Aboveground storage tanks (ASTs) with capacity of 1,320 gallons or less (replacing the 660-gallon threshold).
On July 17, 2002, EPA issued a final rule addressing some requirements of SPCC plans and issued a schedule for facilities to come into compliance. As a consequence of litigation, on June17, 2004, EPA proposed an extension to several of the compliance dates. A link to the Federal Register notice may be found at the following address: http://www.epa.gov/oilspill/pdfs/fr061704.pdf
7.12.4.2 Clean Air Act
Facilities storing crude petroleum and petroleum products generate air emissions during loading and unloading operations and from normal tank breathing losses (collectively known as “working losses”).
The Clean Air Act (CAA) and the Clean Air Act Amendments (CAAA) of 1990 direct EPA to establish national standards for ambient air quality and enforce the standards through a variety of mechanisms. Regulations under the CAA and CAAA that may apply to storage terminals include the following:
C Title V permitting;C New Source Performance Standards (NSPS); andC National Emission Standards for Hazardous Air Pollutants (NESHAP).
7-98

Section 7 - Petroleum Refining
According to EPA’s OTIS database, the following number of facilities classified as SIC code 5171 have CAA permits:
C 546 major sources; C 395 synthetic minor sources; and C 191 federally reportable minor sources.
Major sources are defined by the CAA as stationary facilities that emit or have the potential to emit š10 tons of any one toxic air pollutant or š25 tons of more than one toxic air pollutant per year.
NESHAP
Facilities are subject to NESHAP if they are a major source of hazardous air pollutants (HAP) and emit 10 tons per year of a single HAP or 25 tons per year of a combination of HAPs. NESHAPs that apply to PBSTs include the following:
C 40 CFR Part 63 Subpart R: Standards for Gasoline Distribution Facilities (Bulk Gasoline Terminals and Pipeline Breakout Stations), promulgated December 1994; and
C 40 CFR Part 63 Subpart Y: Standards for Marine Tank Vessel Loading Operations, promulgated September 1995.
7.12.4.3 Resource Conservation and Recovery Act
The Resource Conservation and Recovery Act (RCRA) of 1976 addresses solid (Subtitle D) and hazardous (Subtitle C) waste management activities. Items to note regarding RCRA and PBSTs include the following:
C According to the Toxics Release Inventory (TRI) database, PBST releases include the RCRA hazardous wastes that are commercial chemical products designated with the code “P” and “U”. 40 CFR Part 261.33 defines these wastes as acute hazardous wastes (code P) or toxic wastes (code U).
C EPA's OTIS database includes 2,301 facilities classified as SIC code 5171; these facilities have obtained RCRA permits.
C RCRA enforcement authority (Part 7003) is usually used to clean up petroleum plumes beneath storage terminals.
Subtitle C (40 CFR Parts 260-299) governs the handling of hazardous waste from the point of generation to disposal. Regulations for hazardous waste include waste
7-99

Section 7 - Petroleum Refining
accumulation, manifesting, and recordkeeping standards. Permits under Subtitle C include general facility standards including the following:
C Contingency plans; C Emergency procedures; C Recordkeeping and reporting requirements; C Financial assurance mechanisms; andC Unit-specific standards.
RCRA requirements generally do not apply to specific industries, but rather apply to any facility that transports, treats, stores, or disposes hazardous wastes. In addition, RCRA also provides for the cleanup of hazardous waste releases or solid waste management unit releases (40 CFR Part 264, Subpart S and Part 264.10).
Possible RCRA wastes at PBSTs include tank bottoms water, oil/water separator sludge, and other wastewater treatment sludges. Under the Comprehensive Environmental Response, Compensation, and Liability Act (CERCLA), PBSTs must report any hazardous waste release exceeding the reportable quantity and becomes liable for the release cleanup. Note the definition of a hazardous waste under the RCRA statute does not include pollutants that are oil (of any kind, or in any form) or synthetic gases used for fuel. However, oil mixed with a hazardous substance is classified as a hazardous waste under RCRA.
At PBSTs, water may be found in contact and transported along with petroleum products. The fact that the water accompanies the petroleum product does not make the mixture of the two a waste, even though the water will ultimately be separated from the product and disposed of as a waste. The RCRA regulations define the point of waste generation as being “ the point just beyond the step in which product is separated. Therefore, mixtures of petroleum products and water, “even if mostly water, can be classified as product, so long as there is legitimate recycling of product from the mixture”.
Most wastewater from PBSTs are not classified as hazardous wastes under RCRA. However, in 1990, EPA issued regulations (40 CFR Part 261.24) which classified any solid waste containing more than 0.5 mg/L of extractable benzene under conditions of the Toxicity Characteristics Leaching Procedure (TCLP) as a hazardous waste. In addition, water which contains more than 0.5 mg/L dissolved benzene is potentially classified as a hazardous waste. Typically, tank bottoms water from gasoline tanks and other sources at PBSTs contain more than 0.5 mg/L benzene, a component of gasoline. Exceeding the 0.5 mg/L limit for benzene requires PBSTs to handle and dispose of the waste in accordance with RCRA requirements. Note that RCRA regulations apply only to hazardous wastes, not to products.
In addition to benzene, there are also other contaminants that could be present in tank bottoms water, causing the water to potentially be classified as a RCRA hazardous waste at the concentrations listed in Table 7-37.
7-100

Section 7 - Petroleum Refining
Table 7-37. Concentrations That Would Render Tank Bottoms Water a RCRA Hazardous Waste
Tank Bottoms Water Contaminant RCRA Limit (mg/L) PBST Contaminant Sources
Arsenic 5.0 Found in crude oils, water-soluble
o-Cresol 200 Made in refining, water-soluble
m-Cresol 200 Made in refining, water-soluble
p-Cresol 200 Made in refining, water-soluble
Cresols 200 Made in refining, water soluble
Lead 5.0 Used as a gasoline additive
Selenium 1.0 Found in crude oils, water-soluble
Wastewater that contains any of these contaminants above the RCRA limit concentration requires handling and disposal in accordance with RCRA requirements.
In addition to wastewater, there are also solid hazardous wastes that might be generated at PBSTs. These wastes will have the following characteristics as described in API’s Minimization, Handling, Treatment, and Disposal of Petroleum Products Terminal Wastewaters:
C Ignitability. If the waste is ignitable (flash point less than 140oF) under the RCRA test conditions, then it will be hazardous. Some product-contaminated sludges may fall in this category.
C Reactivity. If the waste contains sufficient cyanide or sulfide to release more than the regulated amount of hydrogen cyanide or hydrogen sulfide when acidified, it will be hazardous. It is unlikely that PBSTs will generate reactive wastes from normal operations. However, since anaerobic biological activity converts sulfate to sulfide (by sulfate-reducing bacteria), it is possible that alkaline tank bottoms water stored for long periods of time might accumulate enough sulfide to fail the reactivity standard.
C Corrosivity. If the pH of the waste is less than 2.0, or more than 12.5, it will be classified as corrosive. Such wastes should be rare at PBSTs.
C Leachability. If more than regulated amounts of any chemical constituents are leached from the waste when it is subjected to specified leaching tests, it is hazardous. The regulated materials include toxic heavy metals and selected organic constituents. Possible materials that would fail this test are tank bottom sludge and wastewater treatment sludge. However, since heavy metals are not common at PBSTs and most of the regulated organic compounds are not expected to be in any petroleum products or wastes, PBST sludges will most likely pass this test. If wastes are derived from
7-101

Section 7 - Petroleum Refining
leaded product storage tanks, or from removal of lead-based paint (e.g., spent blasting sand), then the waste could fail the lead leachability test. Also, benzene may appear in solid wastes at excessive levels as well as in wastewater (the wastewater disposal exclusions do not apply to nonaqueous wastes).
7.12.4.4 Emergency Planning and Community Right-to-Know Act
The Emergency Planning and Community Right-To-Know Act (EPCRA) provides community access to information about chemical hazards and facilitates the development of chemical emergency response plans by state and local governments. EPCRA regulations include the following types of reporting requirements for facilities that store or manage specified chemicals:
C Section 302 - facilities must notify the state emergency response commission (SERC) and local emergency planning committee (LEPC) of the presence of any extremely hazardous substances (listed at 40 CFR Part 355) above the substance’s threshold planning quantity.
C Section 304 - facilities must notify the SERC and LEPC in the event of a nonexempt release exceeding the reportable quantity of a CERCLA hazardous substance or an EPCRA extremely hazardous waste.
C Sections 311 and 312 - facilities must submit material safety data sheets (MSDSs) and hazardous chemical inventory forms (Tier I and II forms) to the SERC, LEPC, and local fire department for hazardous chemicals in amounts exceeding a chemical use threshold. The list of hazardous chemicals is defined by the Occupational Safety and Health Agency (OSHA).
C Section 313 - facilities must submit an annual toxic chemical release form to EPA’s Toxic Release Inventory (TRI) for a specified list of chemicals and chemical categories if the amount of chemical manufactured, processed, or otherwise used exceeds reporting thresholds. Only facilities in certain SIC codes (including SIC code 5171) and that employ 10 or more employees are required to report.
TRI requires facilities in SIC code 5171 to report the releases, transfers, and treatment of listed chemicals. This industry was added to TRI reporting beginning in 1998. Additional information on the types of pollutants and reporting criteria are available in the guidance document EPCRA Section 313 Industry Guidance: Petroleum Terminals and Bulk Storage Facilities, available on EPA’s TRI web site: http://www.epa.gov/tri/industry.htm.
7-102

Section 7 - Petroleum Refining
Based on number of employees, a majority of the PBSTs would not meet the first reporting criteria; therefore, the TRI database contains only a subset of the PBST industry. Recall that, in the TRI database for reporting year 2000, 502 PBSTs reported chemical releases.
7.12.4.5 Safe Drinking Water Act
The Safe Drinking Water Act (SDWA) authorizes EPA to establish health-based, national standards for drinking water. Part of the SDWA includes regulation of underground injection of waste fluids (liquids, gases, or slurries). Underground injection technology includes placing water, wastewater, or water mixed with chemicals into porous rock formations, injection wells, or other similar conveyance systems.
The SDWA classifies drywells or septic systems where PBSTs inject nonsanitary (i.e. nonsewage type) waste into the ground as Class V wells. To operate Class V wells normally does not require individual permits; however, users must submit inventory information to regulators (see 40 CFR Parts 144.24, 144.25, and 144.26). In addition, the water disposed of must not have the potential to cause contamination of the groundwater beneath the well where it becomes unfit for drinking, if used as or may be used as drinking water.
7.12.4.6 Regional and State Programs
As part of this study, EPA searched state web sites to evaluate current state NPDES permit regulations and to establish the availability of data on current PBST industry practices. The technology for treating PBST discharges typically includes oil/water separators to treat stormwater from secondary containment areas. Based on permits and regulations obtained for this analysis, states and regions apply a wide range of limitations and pollutant monitoring requirements to the PBST industrial category.
The following summaries describe the relevant NPDES general and individual permits that have been issued by EPA Regions and delegated states for PBSTs. Data are publicly available through state and EPA web sites.
Region 1
Connecticut:Connecticut Department of Environmental Protection - Marine Terminals
Program
The Department of Environmental Protection (DEP) Bureau of Waste Management licenses petroleum bulk storage facilities that receive product from, or dispense to, ships or barges. The application for this license requires detailed site information.
7-103

Section 7 - Petroleum Refining
New Hampshire: New Hampshire Department of Environmental Services - Application for the
Construction of New and Substantially Modified Petroleum Aboveground Storage Tank Facility
The New Hampshire Department of Environmental Services requires a spill prevention plan for new and substantially modified petroleum stations and terminals. In addition to a spill prevention plan (SPP), the applicant must specify the manufacturer of the containment sump for aboveground piping over surface waters (marinas) and describe all secondary containment, including how stormwater will be handled.
Region 4
North Carolina: North Carolina Department of Environment General Permit No. NCG080000 to
Discharge Stormwater under NPDES
The North Carolina Department of Environment issues general stormwater permits through its Health and Natural Resources, Division of Water Quality. These permits cover stormwater point source discharges associated with activities that have vehicle maintenance areas (including vehicle rehabilitation, mechanical repairs, painting, fueling, lubrication, and equipment cleaning operation areas) associated with activities classified by specific SIC codes, including SIC 5171, with total petroleum storage capacity of less than one million gallons.
Table 7-38 presents limitations for oil/water separators and PBSTs:
Table 7-38. Sample Limits in North Carolina’s Stormwater General Permit
Parameter Limitation and Units Monitoring Frequency
pH 6.0 to 9.0 s.u. Annually
Oil and grease 30 mg/l Annually
Total suspended solids 100 mg/l Annually
Total rainfall Inches (report) Annually
Storm event duration Minutes (report) Annually
Total flow Million gallons (report) Annually
7-104

Section 7 - Petroleum Refining
South Carolina: South Carolina Department of Health and Environmental Control NPDES
General Permit for Discharges From Bulk Petroleum Storage Activities (SCG340000)
General permits issued by the South Carolina Department of Health and Environmental Control for discharges from bulk petroleum storage activities cover stormwater runoff from secondary containment structures (e.g., dikes and berms), stormwater and pad wash-down water from loading racks, and vehicle wash-down water. The only numerical permit limitation is for oil and grease. However, the permittee must monitor once per quarter for the following parameters:
C Flow; C Ethylbenzene; C Naphthalene; C Copper; C TOC; C Toluene; C Methyl Tertiary Butyl Ether (MTBE); C pH; C Benzene; C Total xylenes; and C Surfactants (only for vehicle washing).
Toxicity testing also must be conducted once per year using a 48-hour static acute toxicity test performed using a control and 100-percent effluent. The test is conducted on Ceriodaphnia according to South Carolina procedures for pass/fail modifications to EPA’s standard methods.
Region 5
Ohio: Environmental Protection Agency - Effluent Limitations and Monitoring
Requirements for Petroleum Bulk Storage Facilities
Ohio EPA established a monitoring program to characterize discharges from petroleum bulk storage terminals or similar facilities (i.e., large industrial facilities, airports, etc.). Petroleum bulk storage facilities are subcategorized as follows:
C Type A - Terminals with product loading/unloading racks.
C Type B - Terminals without loading racks (usually referred to as tank farms). Product transport is via pipelines only. Discharge of tank bottoms water is a potential.
7-105

Section 7 - Petroleum Refining
C Type C - Terminals that are bulk crude oil storage and pipeline facilities. Crude oil arrives and leaves via pipeline; there is no loading or unloading of product or tank bottoms water.
Table 7-39 presents the parameters considered by Ohio EPA for developing permit requirements for each type of facility. Monitoring frequency is recommended to be once per month for all parameters, except phenol and naphthalene, which are recommended once per quarter.
Table 7-39. Parameters Considered by Ohio While Developing Permits
Parameter
Facility Type
A B C
Benzene X X
Toluene X X
Ethylbenzene X X
Xylene X X
BOD X X X
COD X X
O&G X X X
TSS X X X
TOC X X X
Phenol X X X
Naphthalene X X
Weather (report) X X X
Precipitation (report) X X X
Annual organic pollutant scan X
The only numeric limitations recommended are for oil and grease: 15 mg/l monthly average, 20 mg/l daily maximum.
Wisconsin: Wisconsin Department of Natural Resources Petroleum Contaminated Water
WPDES General Permit No. WI-0046531-3
These WPDES general permits apply to point source discharges of wastewater that have been contaminated with petroleum, including, but not limited to: gasoline, diesel fuel, aircraft fuel, jet fuel, heating oils, and lubrication oils. Discharges are categorized into the following three types:
7-106

Section 7 - Petroleum Refining
C Petroleum contact water (excluding tank bottom water) - technology-based limits assume use of adequately sized, designed, and functioning oil/water separator;
C Tank bottoms water - technology-based limits assume removal of dissolved or emulsified petroleum products from water including stripping, chemical addition, dissolved air floatation, activated carbon, activated clays, thermal treatment, and distillation; and
C Scrap and waste storage area oily water - technology-based limits assume the same treatment as for tank bottom water.
Discharges to groundwater and surface water have separate limitations for each of the three types of discharges, as shown in Table 7-40.
Table 7-40. Limitations by Discharge Type
Parameter
Petroleum Contact Water Tank Bottoms Water
Scrap and Waste Storage Area Oily Water
Groundwater
Surface Water
Groundwater
Surface Water
Groundwater
Surface Water
Flow Estimate – – – – – O&G 15 mg/l – – – – – Total BTEX Monitor – 750 ug/l – – – PAH Monitor – 0.1 ug/l – – – Naphthalene – – 8 ug/l – 8 ug/l 70 ug/l Benzo(a)pyrene – – 0.02 ug/l 0.1 ug/l 0.02 ug/l 0.1 ug/l Benzene – – 0.5 ug/l 50 ug/l 0.5 ug/l 50 ug/l Ethylbenzene – – 140 ug/l – 140 ug/l – Toluene – – 200 ug/l – 200 ug/l – TSS – – – – 40 mg/l BOD – Monitor – Monitor – Monitor
Region 6
Arkansas: Arkansas Department of Environmental Quality Authorization to Discharge
Under the NPDES and the Arkansas Water and Air Pollution Control Act (ARG340000)
This authorization by the Arkansas Department of Environmental Quality applies to any facility that stores, in one or more stationary bulk storage tanks, petroleum and petroleum products; and subsequently transfers, distributes, or sells the petroleum and petroleum products
7-107

Section 7 - Petroleum Refining
in large quantities, via pipeline, marine transportation, tank car, or tank truck, to the wholesale or commercial market. Six outfall types in the general permit with limitations as specified below:
C 101 Secondary containment areas (dikes) surrounding petroleum storage tanks;
C 201A Petroleum loading and transfer areas;
C 201B Petroleum loading and transfer areas and tank bottom water; nondischarge of tank bottom water directly to the diked area;
C 301 Petroleum tank truck wash water;
C 401 Petroleum tank truck garages located adjacent to petroleum storage and transfer areas; and
C 601 Containment stormwater runoff covered by or commingled with the above discharges.
Table 7-41 lists the above outfalls and applicable limitations.
Table 7-41. Arkansas Limits by Outfall Type
Parameter
Outfall
101 201A 201B 301 401 601
O&G No free 10 mg/l (daily avg) No free oil 15 mg/l (daily max) oil
Flow Report
pH 6.0 - 9.0 s.u
Total BTEX – – 0.1 mg/l – – –
TDS – – 500 mg/l – – –
Ammonia (as Nitrogen)
– – 1 mg/l (daily average) 2 mg/l (daily max)
– – –
Benzene – – 0.05 mg/l – – –
Cyanide – – 0.005 mg/l (daily – – – average)
0.009 mg/l (daily max)
Lead – – 0.0006 mg/l (daily – – – average)
0.0012 mg/l (daily max)
Naphthalene – – Report – – –
7-108

Section 7 - Petroleum Refining
Table 7-41 (Continued)
Parameter
Outfall
101 201A 201B 301 401 601
Acute Toxicity – – >50% survival for 24-hr test on 100% effluent
(1/month)
– – –
COD – – – 50 mg/l (daily
average) 75 mg/l
(daily max)
– –
TSS – – – 35mg/l (daily
average) 53 mg/l
(daily max)
– –
Texas/EPA Region 6: Final NPDES General Permit for Discharges from Petroleum Bulk Stations and
Terminals (TXG340000)
NPDES general permits issued by EPA Region 6 for the state of Texas apply to discharges of facility wastewater and contact stormwater from petroleum bulk stations and terminals and establishments primarily engaged in the cooperative or wholesale distribution of refined petroleum products or petroleum fuels from bulk liquid storage facilities. Table 7-42 lists the permit limitations.
Table 7-42. Texas General Permit Limits
Parameter Daily Limit
Flow Estimate (report)
Total petroleum hydrocarbons 15 mg/l
Benzene 0.05 mg/l
BTEX 0.5 mg/l
Lead 0.25 mg/l
pH 6.0 - 9.0 s.u.
In addition, discharges are analyzed once per year for the following parameters that have monthly average and daily maximum limitations:
C Arsenic; C Barium; C Cadmium (inland and tidal limits);
7-109

Section 7 - Petroleum Refining
C Chromium; C Copper; C Manganese; C Mercury; C Nickel; C Selenium (inland and tidal limits); C Silver; and C Zinc.
An acute toxicity test also must be conducted once per year using a 24-hour standard test on both Daphnia pulex and fathead minnows. Greater than 50-percent survival is required using 100-percent effluent.
Region 10
Oregon: Oregon Department of Environmental Quality General Permit 1300-J
The Oregon Department of Environmental Quality general permits cover facilities storing, transferring, formulating, and/or packaging bulk petroleum products or vegetable oils, and other facilities with oily stormwater runoff and/or tank bottoms water. There are approximately 22 active facilities covered by these permits.
Stormwater discharges from bulk petroleum storage sites do not require permits if the total storage capacity at the site does not exceed 150,000 gallons and if the discharge from the containment area is treated by an oil/water separator. The discharge may not exceed water quality standards for oil and grease of 10 mg/l (monthly average) and 15 mg/l (daily maximum).
Facilities that are required to obtain an NPDES permit must meet the same oil and grease limitations. In addition, Oregon uses benchmark concentrations, shown in Table 7-43, to assess the site’s Stormwater Pollution Control Plan.
Table 7-43. Oregon Stormwater Pollution Control Plan benchmarks
Parameter Benchmark Total Copper 0.1 mg/l Total Lead 0.4 mg/l Total Zinc 0.6 mg/l TSS 130 mg/l Floating Solids No visible discharge O&G No visible sheen pH 6.0 - 9.0 s.u.
7-110

Section 7 - Petroleum Refining
7.12.5 Wastewater Characterization
This section presents wastewater characterization data based on TRI and PCS submissions for 2000. Using these data, EPA estimated total discharges from PBSTs and compared them to discharges from other industries.
7.12.5.1 TRI Data
Facilities report both direct discharges (i.e., mass of pollutant released directly to receiving streams) and indirect discharges before treatment (i.e., mass of pollutant transferred to POTWs) to TRI. For direct discharges, EPA used the reported mass to calculate TWPEs. For indirect discharges, EPA first estimated the reduction in pollutant mass accomplished by the POTW (i.e., pollutant percent removal) and then used the resulting mass of pollutant after treatment to calculate TWPEs discharged to the POTW’s receiving stream. EPA calculated the reduction in pollutant mass for indirect discharges by using average POTW removal efficiencies (see DCN 00618, Evaluation of RSEI Model Runs).
The reported releases of PACs, n-hexane, and benzene comprise nearly 99 percent of the PBST industry’s total toxic releases of 8,010 TWPE. Table 7-44 presents the pounds (and TWPE) discharged by direct and indirect dischargers as reported to TRI for the PACs, n-hexane, and benzene.
Table 7-44. TWPE Discharges of Individual Pollutants Based on 2000 TRI Data
Parameter Facilities Reporting
Total Pounds Discharged
TWPE Discharged
Cumulative Percentage of Total TWPE Discharged (8,010)
PACs 5 35.293 7,741.21 96.6 n-Hexane 74 4,949 117.71 98.1 Benzene 109 4,033 63.53 98.9
7.12.5.2 PCS Data
Facilities report direct discharges (i.e., mass of pollutant released directly to receiving streams) to PCS. For direct discharges, EPA used the reported mass to calculate TWPEs. As discussed in Section 7.12.2.2, PCS includes only results of permit-required monitoring for direct discharging facilities. Even though toxic pollutants may be present in a refinery’s discharge, they will not be reported unless required by permit.
The reported release of benzo(a)pyrene, benzo(b)fluoranthene, dibenzo(a, h)anthracene, and benzo(a)anthracene comprise more than 98 percent of the industry toxic releases of 5,389 TWPE, as reported to PCS. Table 7-45 presents the pounds (and TWPE) discharged by PCS major reporters for the four pollutants listed earlier.
7-111

Section 7 - Petroleum Refining
Table 7-45. TWPE Discharges of Individual Pollutants Based on 2000 PCS Data
Parameter Facilities Reporting
Total Pounds
Discharged TWPE
Discharged Cumulative Percentage of Total
TWPE Discharged (5,389)
Benzo(a)pyrene 3 0.58 2,467.78 45.8
Benzo(b)fluoranthene 3 2.39 1,007.76 64.5
Dibenzo(a,h)anthracene 3 0.58 975.35 82.6
Benzo(a)anthracene 3 4.64 839.2 98.2
7.12.5.3 Stormwater Contributions to TRI and PCS Data
When reporting to the TRI, sites complete a Form R for each chemical exceeding the reporting threshold. Each chemical’s Form R includes the pounds per year discharged in wastewater to receiving streams and water bodies for direct discharges (Section 5.3 of Form R). Sites also report discharges to POTWs and other off-site locations for wastewater treatment; however, only discharges to receiving streams or water bodies include reporting of the “% From Stormwater.” Therefore, this analysis only applies to direct discharges. Moreover, this assessment will focus on those facilities whose TRI TWPE discharges ranked highest. The following four facilities discharged 96 percent of the 8,010 TWPE calculated from the 2000 TRI data:
C Coastal Oil of New England, South Boston, MA;C Phillips Pipeline Co. Kansas City Terminal, Kansas City, KS;C Irving Oil Terminals, Inc., Searsport, ME; andC Noco Energy Corp., Tonawanda, NY.
Coastal Oil of New England did not provide any data linking toxic discharges to storm events. The other three facilities did, with Table 7-46 listing stormwater contributions to the discharge of various pollutants.
Table 7-46. Percent Discharges to Surface Waters Due to Stormwater for 2000 TRI Reporters
Parameter
Percent Discharged to Surface Waters Due to Stormwater
Phillips Pipeline, Kansas City, KS
Irving Oil Terminals, Inc., Searsport, ME
Noco Energy Corp., Tonawanda, NY
1,2,4-trimethylbenzene 22 100 100
Benzene 22 100 100
Ethylbenzene 22 100 100
n-Hexane 22 100 100
Methyl tert-butyl ether 22 100 100
7-112

Section 7 - Petroleum Refining
Table 7-46 (Continued)
Parameter
Percent Discharged to Surface Waters Due to Stormwater
Phillips Pipeline, Kansas City, KS
Irving Oil Terminals, Inc., Searsport, ME
Noco Energy Corp., Tonawanda, NY
PACs 22 100 100
Toluene 22 100 100
Xylene (mixed isomers) 22 100 100
Of the eight PCS majors, four also reported to TRI in 2000. They are as follows:
C Exxon Mobil, East Providence, RI;C ConocoPhillips, East Boston, MA;C Shell Co., San Juan, PR; andC Exxon Mobil, Everett, MA.
Exxon Mobil’s East Providence, RI facility and Shell Co. reported no stormwater contributions to toxic discharges to surface waters. ConocoPhillips’s East Boston, MA facility and Exxon Mobil’s Everett, MA facility reported that stormwater was responsible for 100 percent of toxic discharges to surface waters for the following pollutants: benzene, ethylbenzene, methyl tert-butyl ether, toluene, and xylene (mixed isomers). In addition, Exxon Mobil’s Everett, MA terminal also reported that 100 percent of n-hexane discharges to surface waters took place due to stormwater.
7.12.5.4 Wastewater Handling
The various types of wastewater are often handled differently. Any wastewater that has come into contact with product, particularly oil and grease and total petroleum hydrocarbons, is collected and treated in some fashion, sometimes on-site (oil/water separation, some form of primary and/or secondary treatment, e.g., biological treatment followed by granular activated carbon treatment), and disposal to a publicly owned treatment works (POTW), a lined lagoon, or direct discharge to surface waters. Several commenters to the Preliminary Plan stated that oil/water separation is widely used at those facilities that treat their wastewaters. ILTA went so far as to say that virtually all PBSTs that treat wastewater on site have oil/water separators. According to several control authorities, facilities that perform on-site treatment are generally larger. Their size and attendant economics make it easier for them to install and operate a treatment system. Many smaller facilities, on the other hand, have their wastes collected and shipped for off-site treatment at adjoining refineries or treatment facilities (3). The use of this practice was also widely reported by commenters.
Wastewater requiring primary and/or secondary treatment (because it is contaminated with oil and grease and total petroleum hydrocarbons) is typically tank bottom water, loading/unloading rack water, a portion of the tank basin water, wastewater generated during remediation, and water used for hydrostatic testing, if it is contaminated (if hydrostatic
7-113
Section 7 - Petroleum Refining
test water is not contaminated, it is normally released to a storm drain). In the case of tank bottoms water, commenters report that it is normally sent off site for treatment. For example, Amerada Hess reported that all of its terminals ship tank bottoms water off site for treatment. Wastewater that contains surfactants or other types of cleaning agents is not commingled with other oily wastewaters to prevent the formation of emulsions; therefore, wastewater from vehicle and equipment washing and maintenance, as well as wastewater from lavatories, is typically discharged separately to the POTW. Stormwater runoff from the facility yard, roofs, and drives, as well as some of the tank basin water, is either collected and examined (visual inspection and/or chemical testing), or released to the environment without collection if the facility ensures that the water has had no contact with product or other pollutants. If collected stormwater is clean, it is sent to a storm drain; otherwise, it is sent through oil/water separation and other necessary treatment measures before being discharged to a POTW, a lined lagoon, or to surface waters.
7.12.6 Pollution Prevention Practices
Pollution prevention practices reduce pollution at the source. This includes any practice that reduces the amount of pollutants entering any waste stream or otherwise released into the environment prior to recycling, treatment, or disposal and reduce the hazards to public health and the environment. Pollution prevention practices include equipment or technology modifications, process or procedure modifications, reformulation or redesign of products, substitution of raw materials, and improvements in housekeeping, maintenance, training, or inventory control. As discussed in Section 7.12.3, there are several sources of wastewater at PBST facilities; however, there are also many pollution prevention practices that can be implemented to reduce or eliminate these sources of wastewater. In addition to the environmental benefits of pollution prevention, PBST facilities can benefit from implementing pollution prevention practices by doing the following:
C Reducing the size of downstream wastewater treatment equipment;C Providing a permanent solution for eliminating pollutants;C Eliminating costs associated with managing wastewater; andC Providing more reliable methods for eliminating pollutants.
This section describes the following pollution prevention practices that can be implemented to reduce or eliminate wastewater generation at PBSTs:
C Section 7.12.6.1 discusses the pollution prevention practices that minimize stormwater contamination;
C Section 7.12.6.2 discusses pollution prevention practices that minimize generation of wastewater; and
C Section 7.12.6.3 discusses pollution prevention practices for reducing other wastewater sources.
7-114

Section 7 - Petroleum Refining
7.12.6.1 Stormwater Pollution Prevention Practices
Stormwater is the major source of wastewater volume at most PBST facilities. Stormwater can be divided into three categories – uncontaminated, potentially contaminated, and contaminated – based on the type of area from which the stormwater is generated. To minimize the amount of wastewater that requires treatment, PBSTs should segregate stormwater from sources of contamination and take preventive measures to minimize potential stormwater contamination.
Stormwater Segregation
To minimize the amount of wastewater generated, PBSTs should segregate stormwater from sources of contamination so that it can be discharged with minimal or no treatment. Two methods to segregate stormwater from potential sources of contamination are geographical segregation and roof design. Both of these methods help prevent contamination of stormwater by pollutants from PBST facilities and dilution of contaminated water.
Geographical Segregation
Geographical segregation prevents mixing of different categories of stormwater (i.e., uncontaminated, potentially contaminated, and contaminated), using a combination of the following methods:
C Grading: moving dirt to form land slopes such that water flows in the desired direction;
C Berms: elevated barriers used to contain and control surface water movement;
C Interceptor drains: collection channels (e.g., ditches or sewers) that capture a type of runoff before it can mix with another type; and
C Curbs: elevated barriers to contain and control surface water movement that are low enough to allow for personnel and equipment to move over them.
To implement geographical segregation, the facility must identify which plant areas generate each of the three types of stormwater. If a facility determines that different types of stormwater are commingling, it can use the geographical segregation methods listed above to segregate the stormwater, enabling the facility to reduce the amount of stormwater that requires treatment.
7-115

Section 7 - Petroleum Refining
Roof Design
Facilities can provide roofs over potential sources of contamination, with the runoff from the roofs sent to a less-contaminated area. The primary use of roofs is on storage tanks because tank bottoms water is highly contaminated, but has very low flow if stormwater is segregated. For tanks that contain water-soluble materials (e.g., gasoline oxygenates and fuel and lubricant additives), fixed roofs are recommended because water mixing with such materials can significantly contaminate and degrade product quality.
Roofs (or canopies) can also be used over transfer racks to segregate stormwater from small product spills that result when making and breaking hose connections to transport vehicles. These canopies also protect personnel from the elements and keep stormwater out of the transport vehicle. To prevent stormwater runoff from flowing over the facility slab, roof drains should be routed away from the slab and the slab should be surrounded by rollover curbs . In addition, this area should have a drainage and containment system which drains to a sump and is routed to the proper treatment system. This system should also be designed to hold the maximum capacity of the largest compartment of a tank car or truck used at the facility in the event of tank rupture or accidental overflow.
Pump stations are considered contaminated areas because of pump seal leaks and pump maintenance discharges. PBSTs can place a roof or canopy over the pump station to eliminate stormwater collection and treatment from the pump station slab. These roofs are similar to the roofs placed over transfer racks.
A novel possibility of this type is the use of green roofs. Green roofs, sometimes called roof gardens, are a surface treatment for rooftops involving the addition of several layers of growth media and plants to create a contained green space. Current green roof design is generally comprised of four components: a waterproof membrane, a drainage layer, a growth medium, and vegetation. Variations in these components, including the addition of a vegetation support layer above the growth medium can greatly affect the water flow and thermal characteristics of the green roof. Proponents of green roofs have claimed numerous benefits including improved air quality, stormwater attenuation, reduction of the “heat island effect,” and aesthetic value (6). While EPA is unaware of any PBSTs that use this technology, EPA is aware of other industrial structures in the United States that use green roofs. The most prominent of these is the Ford Automobile Company’s Rouge Center in Michigan, which installed a green roof approximately two years ago. While Ford is, as yet, unable to provide performance data, the possibility remains intriguing. In the case of PBSTs, the technology is probably not appropriate for direct usage on tank roofs, but might be used on canopy roofs. A potential hurdle, from the standpoint of design, is adequate load-bearing capacity.
Minimizing Stormwater Contamination
Potentially contaminated stormwater is collected and subjected to minimal treatment before discharge; if it becomes contaminated, it must be treated more extensively. To
7-116

Section 7 - Petroleum Refining
reduce the amount of contaminated stormwater, steps can be taken to reduce the probability of contamination.
Stormwater at PBSTs may be contaminated by accidental release of materials to the ground, including leaks in piping or tanks, overfilling the tanks, accidentally opening tank nozzles, or tank cleanout activities. See Section 7.12.6.2 for descriptions of methods to minimize these releases. When such releases do occur, there are preventative measures that can minimize the likelihood of stormwater contamination.
Petroleum tanks are surrounded by a containment area, bounded by dikes or walls. It is a general rule that the containment area is able to hold the volume of the largest tank in the area without spillover. Rainwater is removed from the contained area via drainage pipes with shutoff valves that are placed through the dikes or walls. The shutoff valves should be closed at all times except during attended rainwater drainage. If a product spill occurs at the same time that rainwater accumulates in the tank basin, then the clean water can be drained using “turndown ells” on the basin end of the pipe. These devices allow water to drain while minimizing entrainment of floating product.
7.12.6.2 Minimizing Generation of Wastewater
There are several ways that product can become mixed with wastewater at a PBST, including petroleum product discharges into wastewater, product/water emulsion, and tank bottoms water accumulation. Pollution prevention practices are available to reduce or eliminate product contamination in wastewater streams.
Petroleum Product Discharges
Product discharges can enter wastewater through petroleum product tank bottoms draws, waste product discharge, equipment drainage, sampling episodes, leaks, tank deterioration, and product transfer mishaps. Using appropriate pollution prevention practices can reduce or eliminate all of these sources of product discharge.
Removal of Tank Bottoms Water
Water from various sources collects in the bottoms of petroleum product tanks (see Section 7.12.5.2). This wastewater must be removed to ensure that water is not being mixed with product as it is pumped from the tank; this method is termed product tank bottoms draw. Once it is removed, this wastewater is sent to a collection tank for oil separation and treatment. Facilities should use methods such as water volume determination, water/product interface detection, and product entrainment prevention that maximize the withdrawal of water while minimizing the withdrawal of product.
The facility should first determine the amount of water in the tank to ensure that the minimum amount of water is drawn. One way is by gauging the tank with a tape or stick coated on its lower end with water-indicating paste, which changes color when it comes in
7-117

Section 7 - Petroleum Refining
contact with water. Another way is to position closely spaced trycock valves on the side of the tank. These valves should be situated where the water accumulation is expected. Facility personnel can determine the water level by opening the trycock valves (starting with the lowest one) to assess the highest one that delivers water.
A third method for detecting the water/product interface is using sight glasses mounted on the side of the tank. The upper end nozzle of the sight glass should be placed lower than the level of the product; otherwise, there will be no correlation between the interface level in the sight glass and the interface level in the tank. Calibration curves (or tank strappings) show the relationship between tank water level and tank water volume and can be used to determine the volume of water to remove once the level is known. Manual control is another method of interface detection, where the water draw valve is manually opened, the drawn substance is sampled, and once product is detected, the valve is manually closed.
There are more reliable methods of detection that rely on the properties that distinguish water from product, such as detectors based on electrical conductivity or capacitance and devices using a float of exact specific gravity to control a shutoff valve. If the volume of the water in the tank is known, facilities can use a device that meters the draw volume and operates a shutoff valve when the determined wastewater volume is reached. Unfortunately, fouling could be a concern for these three methods. Another technique is to draw water through a canister of material that swells when contacted by hydrocarbon, and consequently blocks the flow once product is drawn.
Product entrainment is defined by API to be the carryover of droplets of product in a water draw flow. Facilities can minimize product entrainment using proper design guidelines and operating procedures. For example, a water sump can be situated in the tank bottom next to the water drain nozzle and the nozzle to the tank interior can be connected with a turndown ell. This method ensures that the water is taken from the lowest possible elevation (i.e., farthest away from the water/product interface). Facilities can also use vortex eliminators or vortex barriers to keep the product from being pulled down in a swirling vortex. Another method is to place the product draw nozzle at the highest possible elevation because if there is a large separation between the product and water draws, then some water can remain in the tank to avoid drawing in some product. In addition, facilities can control product entrainment by the water draw rate. Product entrainment and overshooting the water/product interface is more probable at high water flow rates. Facilities should also reduce the water draw frequency.
Discharge of Waste Product
Slop oil (or waste product) is any petroleum product that does not meet product specifications and cannot be used or distributed as is. Slop oil systems can eliminate waste product discharge into wastewater sewers. PBST facilities can use these systems to collect waste product and reuse it. Slop oil systems are comprised of collection points that are situated at all sources where waste product is generated. If small volumes of waste product are generated, the slop oil system may be a collection drum. If facilities generate large volumes of waste product, then they should use a direct pipe connection from the system. For intermediate volumes, an oil
7-118

Section 7 - Petroleum Refining
sump can be placed at a lower elevation than where product is released to enable gravity drainage. Water should not enter the slop oil system. The waste product can be transported for further processing using piping, vacuum truck, or truck transport of filled slop oil drums, where it can be converted into a useful product by separating and removing the water.
Equipment Drainage
When equipment is taken out of service for maintenance, it is typically drained. Equipment usually contains large amounts of product, so draining this product into sewers can cause wastewater contamination. The most common pollution prevention practices for minimizing product drainage into sewers are design factors, including avoiding pocketing, using drain nozzles, and providing a collection point.
To avoid pocketing (i.e., product trapped in low points in the piping that is not able to drain in either direction), when a process is stopped, the product in the equipment should flow out of the system through existing equipment. For example, vessels should have drain lines at their low points with connections that enable the contents to be pumped or gravity drained to other parts of the system. In addition, piping should not have pockets that cannot be drained by gravity in either direction. If there are pockets in the system, then drain nozzles should be used with a shutoff valve at the pocket. The drained product can be used, rather than washed into a sewer. One way to recover the drained product is to run hoses from the drain nozzles to a below-grade product collection sump. The product can be transferred from the sump to the slop oil system by vacuum truck or with a sump pump and piping system. An alternative method is to connect the drain nozzle directly to a vacuum truck suction hose.
Product Sampling
PBSTs typically use sampling nozzles and stations to collect samples at different points. Because the sample nozzle piping normally has no flow (i.e., dead volume), it is general sampling protocol to open the sample valve and allow the substance to flow long enough to purge the piping of dead volume to obtain a representative sample. This dead volume is sometimes discharged into the oily wastewater sewer, which contaminates the wastewater with product. Installing a sampling loop or a sample trough can eliminate this discharge.
A sampling loop is a loop of piping where the pipe’s upstream end is connected to the normal sample collection point and its downstream end to a lower pressure region of the same process. When a sample is taken, the sample loop is purged by opening the sample loop line valves, and then the sample nozzle is opened to collect the sample. Another pollution prevention practice is using a sample trough, which is a collection sink or trough at the sample nozzle, connected to the slop oil system.
7-119

Section 7 - Petroleum Refining
Leaks
Leaks can be a major source of product in wastewater and stormwater. There are various types of leaks, such as pump seal leaks, valve seal leaks, and piping leaks, for which pollution prevention practices can be implemented.
Pump seals are found on the rotating shaft in rotating pumps and on the piston in piston pumps. A certain amount of leakage is required to lubricate the seal for many rotating seals. Pollution prevention practices to minimize leakage include considering product leaks as a factor in pump selection, selecting mechanical seals instead of packing seals, and selecting seal-less pumps over ones that use seals. In addition, pump seals should be maintained in good condition; therefore, when product leakage from seals becomes excessive, they should be tightened, repaired, or replaced.
Valve seals are used to minimize process fluid leakage along the stem that connects the internal parts with the external actuator. These seals can leak, so to minimize product release, PBSTs should choose valve designs that minimize leakage and maintain valve seals in good condition.
Unlike pumps and valves, piping leaks are not inherent to the equipment design and typically result from improper assembly or corrosion. To prevent piping leakage, PBSTs should hydrotest equipment that is taken down for maintenance before returning it to service. In addition, if buried piping is metal, it should have a protective wrapping and coating. Cathodic protection may also be necessary. For aboveground pipes, facilities should post signs and inform drivers at the facility about the presence of these pipes to avoid accidental spills from collisions .
Tank Deterioration
Tanks can deteriorate over time causing leaks and rupture, so they should be designed correctly and inspected periodically. As described in the SPCC requirements, tanks should be selected based on their suitability for the material being stored and the storage conditions. Industry standards should be followed for the construction, material, installation, and use of the tank. Fiberglass tanks should be used underground because they do not corrode. If metal underground storage tanks (USTs) are used, then they should have corrosion resistant coating, cathodic protection, or another effective method of protection from corrosion. Trained personnel should inspect aboveground storage tanks (ASTs) to detect leaks or other deterioration. Inspectors may use X-ray or radiographic analysis to determine the wall thickness and detect cracks and crevices in metal; ultrasonic analysis to measure the shell metal thickness; hydrostatic testing to identify leaks caused by pressure; visual inspection to detect cracks, leaks, or holes; and magnetic flux eddy current test and ultrasonic analysis to detect pitting. Corrosion can be prevented in metal ASTs by using dielectric coatings, cathodic protection, and double-bottom tanks.
7-120

Section 7 - Petroleum Refining
Product Transfer Mishaps
Wastewater and stormwater can become contaminated by-product transfer mishaps, such as tank overfilling and accidental opening of nozzles. Gauging the tank before it is filled and monitoring the tank while it is being filled can prevent tank overfilling. High-level alarms and automatic shutoffs can also prevent tank overfilling. Establishing a policy to keep blind flanges or caps over all pipe openings and unconnected valve ends can minimize accidental releases caused by accidentally opening tank nozzles.
Controlling Emulsions
An emulsion is the dispersion of product in water or vice versa. The phase in which the droplets are dispersed is the continuous phase and the droplets comprise the dispersed phase. Since petroleum product is separated from wastewater by gravity separation, there are serious adverse effects on wastewater quality when product cannot be gravity separated from wastewater. Emulsions typically accumulate at the product/water interface because their density is in between the densities of the product and water. The PBST industry typically refers to these emulsions as rag or cuff. Pollution prevention practices that minimize product/water emulsions involve product droplet control, surfactant control, and fine solids control.
Product Droplet Control
Emulsions are stabilized by small oil droplets because they are inherently slower to separate from the continuous phase. Small oil droplets are formed by agitation of oil and water, which is caused by pumping product/water mixtures or turbulent flow of product/water mixtures. Centrifugal pumps are frequently used by PBST facilities and generate emulsions because the material pumped is subject to high agitation in the pump. To minimize emulsions, facilities should use positive displacement pumps (e.g., gear pumps, piston pumps, diaphragm pumps, and Archimedes screw pumps) because they produce less agitation and therefore less emulsions. Emulsions are also formed by turbulent flow of product/water mixtures, which can be caused by high velocities of fluid flow in pipes or ditches. Pollution prevention practices such as increasing pipe diameter, restricting the gravity gradient, and avoiding sudden changes in elevation avoid turbulence in oily wastewater streams by maintaining low velocities.
Surfactant Control
Emulsions are also stabilized by surfactants (e.g., detergent and soaps) collecting at the product/water interface, which reduce the surface tension and inhibit phase separation. Natural surfactants are present in crude oil; however, manufactured detergents used for cleanup or as gasoline or lube oil additives are of most concern at PBST facilities.
PBSTs use detergents to clean oily equipment. To minimize the formation of emulsions, facilities should use the minimum amount of detergent necessary. Another method is to use nondetergent alternatives, such as dry cleaning methods (e.g., solvents or absorbent materials for spilled product) or steam cleaning.
7-121

Section 7 - Petroleum Refining
Gasoline additives can contain detergents that keep vehicle fuel systems free from deposits. To prevent emulsions from forming, gasoline additives or gasoline containing additives should not come into contact with water; therefore, PBSTs should keep these substances in waterproof tanks.
Some PBSTs accept water-containing, off-specification products with additives (which aid in the formation of emulsions) from service stations. For this source, pollution prevention practices include keeping these products separate from other products until all water is separated; using a low-flow tank if the recovered product is sent to a product tank; and not mixing the water separated from haulback material with oily wastewater.
Fire foam systems are tested occasionally at PBSTs. Releasing foaming agent surfactants dissolved in water can cause product/water emulsions to form. Physically cleaning up the foam (instead of washing it down), selecting a foaming agent that is compatible with the treatment system (e.g., it is biodegradable if biotreatment is used), and segregating the foam wastewater from oily wastewater can minimize the release of these surfactants and thereby reduce the possibility of forming emulsions.
Fine Solids Control
Fine solids can generate product/water emulsions by contacting and being saturated with product and water simultaneously. Fine solid sources include soil, powdered materials, and corrosion products.
Soil erosion is a common source of fine solids at PBSTs, and clay soils produce very fine particles. To prevent emulsions from forming from this source, facilities should minimize the erosion of soil into wastewater collection systems by segregating runoff areas, planting groundcover plants, paving the drainage area, and using geofabrics.
PBSTs occasionally use powdered materials, such as spent blasting sand. To prevent emulsions from forming from this source, facilities should properly store these materials to prevent them from entering stormwater and wastewater sewers. If these materials are deposited on paved areas, they should be removed by dry methods, such as sweeping instead of washing it down.
Fine solids can also be generated from sulfide corrosion of steel, which creates very fine iron sulfide. Facilities should remove these fines from process equipment without mixing product, water, and solids.
In general, to keep solids from entering oily wastewater streams, facilities should use closed sewer or pipes instead of open ditches to convey wastewater. Also, facilities should segregate sanitary wastes from oily wastewater because these wastes contain biosolids and detergents that stabilize emulsions. To do this, facilities can send sanitary waste to a municipal sanitary sewer, a septic tank, or other dedicated sanitary treatment system, or mix the sanitary waste with oily wastewater only after oil/water separation.
7-122

Section 7 - Petroleum Refining
Tank Bottoms Water Accumulation
According to API, product tank bottoms water is the most expensive wastewater to treat because it is by far the most contaminated wastewater generated at PBST facilities. Therefore, it is important to minimize this source of wastewater by reducing the tank bottoms flow, the amount of entrained product water, tank breathing and condensation, rainwater, and other sources.
Reduction of Tank Bottoms Flow
A pollution prevention practice that can be implemented at PBST facilities is reducing the flow of tank bottoms water to minimize the amount of contaminant transfer from petroleum products. This method affects wastewater contaminants in different ways depending on the solubility of the contaminant. Entrained contaminants are drained along with the water; therefore, reducing the amount of wastewater will proportionately reduce the discharge of entrained product. Saturated contaminants are present at high concentration in products and are not readily soluble in water. Because these contaminants will have the same concentration regardless of the amount of water and product, the mass flow of these contaminants is directly proportional to the water flow. Extractable contaminants are somewhat soluble in both water and product. These contaminants are able to partition in both the product and water phases; therefore, reducing the wastewater flow, can reduce the discharge of these contaminants. Waterborne (or water-soluble) contaminants are not expected to be soluble in products; therefore, these contaminants are not affected by reducing tank bottoms flow rates. To reduce this type of contaminant, facilities should reduce the source of water-soluble contaminants into the tank.
Reduction of Water Entrained in Product
A significant source of tank bottoms water is water entrained in the products. This water is highly contaminated with water-soluble contaminants. Some procedures that can minimize entrained water at PBSTs include reducing water in products delivered from tankage, establishing distribution chain procedures, setting product specifications, and requiring take-back of delivered water. In addition, there are some techniques that can be used to reduce or eliminate entrainment of water.
PBSTs can reduce or eliminate entrainment of water in products delivered from tankage using the same methods for reducing the amount of water drawn from a tank. These methods include installing nozzles that draw the product as high as possible above the maximum water level expected, keeping the tank water level as low as possible, removing tank water before removing product, and using turned-up water nozzles that minimize entrainment of water.
Establishing distribution chain procedures from the refinery through the product distribution chain can also minimize water content in product. In addition, PBSTs can set product specifications for water or contaminants in product received at the terminal. PBSTs can also return water delivered with the product to the originator, which gives originators incentive to reduce the amount of water entrained in the products.
7-123

Section 7 - Petroleum Refining
Reduction of Tank Breathing and Condensation
According to API, tank breathing air and condensation are minor sources of water in tanks, and it is difficult to minimize or remove these water sources.
Reduction of Rainwater
Rainwater is a major source of tank bottoms water. It can be reduced or eliminated by installing fixed roofs on the tanks. If floating roofs are used, then the roof seals should be replaced or repaired periodically and floating roof drains should be cleared of blockage.
7.12.6.3 Pollution Prevention Practices for Reducing Other Sources of Wastewater
Rack cleanup water is generated when product spills, product drips, and accumulated dirt are rinsed from the equipment and/or slab. Facilities can reduce this source of wastewater by using dry cleaning methods, such as absorbent granules or fabrics and wiping or sweeping equipment. If washing is the only feasible option, then the minimal amount of water should be used. Additionally, PBSTs should minimize the use of detergents by tracking the amount of detergent used by each operator to avoid forming emulsions. Selected detergents should have minimal impact.
To minimize vehicle wash water, vehicles can be taken offsite and washed at a commercial vehicle washing facility. This will prevent the detergents from mixing with oily wastewaters and forming emulsions. PBSTs can also discharge wash water into municipal sewers to avoid mixing with other oily wastewaters. If vehicles are washed onsite, the amount of detergent used should be minimized and vehicle wash water should be segregated from other oily wastewaters.
Most vehicle maintenance wastes are comprised of vehicle fluids (e.g., brake fluid and antifreeze), which contain additives that stabilize emulsions. Facilities should haul these wastes offsite for recovery or disposal and not discharge them to the wastewater treatment system. Collection drums should be located in vehicle maintenance areas for each type of fluid.
Cryogenic vapor recovery systems chill the air that is displaced when filling tanks to remove hydrocarbon vapors. This method also condenses the humidity in the air, which becomes saturated with hydrocarbons. Because this wastewater contains high concentrations of hydrocarbons, the condensates are discharged to product tanks or slop oil tanks to recover product; therefore, this source is not typically managed as a wastewater stream. If there is a large amount of vapor recovery water, then there likely is an air leak into the aspiration system, which must be fixed to prevent explosions.
Haulback material water bottoms are generated by water entering service station tanks through leaks. To encourage service stations to fix such leaks and minimize the amount of haulback material water bottoms, PBSTs can charge service stations for the cost of hauling and
7-124

Section 7 - Petroleum Refining
treating haulback materials. If the water originates from the product delivered from the PBST, then the PBST should minimize the entrainment of water as discussed previously.
The purpose of hydrostatic testing is to detect leaks in vessels and pipelines. This process requires large amount of water at high flow rates. To minimize the contamination of this water, PBSTs should clean the vessel or pipeline being tested thoroughly before the hydrotest.
Steam systems (or boilers) are used to heat heavy products to keep them fluid. The steam generated for heating becomes contaminated by corrosion inhibitors that are added to the boiler. To minimize wastewater generation, PBSTs should collect condensate from steam traps, return it to the boiler, and fix any leaks. In addition, internal steam-heating coils used in heavy products tanks may corrode, which can lead to leaks. To minimize this corrosion, PBSTs can use external heating coils on insulated tanks.
Implementing the following methods can minimize laboratory wastewater flow and contamination: using a vacuum pump or recycle water aspirator; disposing separately or reprocessing spent solvents and test samples; not using regulated solvents; placing solids and wastewater contaminated with regulated pollutants into collection drums for disposal; and washing laboratory glassware in a water-saving dishwasher, minimizing the use of detergents in cleaning.
Tanks accumulate sludge, which needs to be periodically removed by cleaning. During cleaning, none of the oily sludge should come in contact with the ground around the tank. In addition, having a contractor clean the tank and dispose the wastes generated off site can minimize tank cleaning wastewaters. Dry-cleaning methods can also be used to minimize the use of detergents. This wastewater should not come in contact with rainwater or oily wastewater.
7.12.6.4 Conclusions
EPA’s primary source of wastewater discharge information for PBSTs is TRI and PCS. These sources contain discharge information for only a small portion of this industry, however. Less than 1 percent of the number of PBSTs (as determined from the 1997 Census) are in the PCS system, while only 5.5 percent reported to TRI in 2000.
Based on the information in TRI and PCS, pollutant discharges from PBSTs are small in comparison to those of other industrial categories, including refineries. Using information reported to TRI, EPA estimates that PBSTs discharge 8,010 TWPE to waters of the U.S. A few facilities contribute the overwhelming majority of this total TWPE. TRI information also indicates that the vast majority of these TWPEs are associated with stormwater discharges. Of the few facilities contributing to the overall TWPE, one (contributing 3,290 TWPEs) ceased operations in 2000. Discharges from a second facility (contributing more than 2,600 TWPE), are from a now-closed refinery that also performed PBST operations and are attributed to groundwater remediation activities only. Similarly, two facilities contribute the large majority of the 5,389 TWPE reported to PCS. Information from the PCS reporting
7-125

Section 7 - Petroleum Refining
facilities that also report to TRI indicates that stormwater discharges are a significant source of the toxic pollutants discharged.
Information collected from permit and control authorities, site visits, and comment responses supports the conclusions reached from the TRI and PCS data. With few exceptions, discharges from PBSTs appear to be primarily stormwater with low concentrations of toxic pollutants. In addition, these stormwater discharges are subject to general or individual stormwater permits. Moreover, commenters and control authorities widely reported that tank bottoms water, the source of the most toxic waters produced at PBSTs are, by and large, transferred off site for treatment.
Therefore, based on this review, EPA has concluded that most PBSTs do not discharge toxic pollutants to waters of the United States. Of those that discharge, most discharge only stormwater which is subject to general or individual stormwater permitting requirements. For the few PBSTs that EPA identified as discharging toxic pollutants, EPA concludes it is reasonable to provide individual facility permit support, rather than an effluent guidelines rulemaking.
While EPA is deferring the development of effluent guidelines for PBSTs as a new subcategory under 40 CFR Part 419, it will continue to examine this industrial activity in future review cycles.
7.12.7 PBST References
1. Siddiqui, M.A., U.S. EPA. Memorandum to the Effluent Guidelines Planning Docket. Discharge Status of PBST Facilities, as Enumerated by TRI and PCS Databases. March 10, 2004.
2. Siddiqui, M.A., U.S. EPA. Telephone conversation regarding PBSTs with George Papadopoulos, U.S. EPA Region 1. April 29, 2004.
3. Siddiqui, M.A., U.S. EPA. Memorandum to the Effluent Guidelines Planning Docket. Summary of Discussions with Permit Writers About PBST Facilities. April 29, 2004.
4. Siddiqui, M.A., U.S. EPA. Memorandum to the Effluent Guidelines Planning Docket. Meeting with PBST Stakeholders. August 8, 2004.
5. Siddiqui, M.A., U.S. EPA. Telephone discussion regarding PBSTs with Jim Ball and Eric Beck, Rhode Island Department of the Environment, Providence, Rhode Island. April 29, 2004.
6. Pennsylvania State University. Thesis submitted in partial completion of Master of Science degree requirements by Julia DeNardo.
7-126