Embed Size (px)
Citation preview

Governance survey
Technical Supplement 3, Superannuation: Assessing Efficiency and Competitiveness, Productivity Commission Draft Report, May
Superannuation: Assessing Efficiency and Competitiveness, Productivity Commission Draft Report

ã Commonwealth of Australia 2018
Except for the Commonwealth Coat of Arms and content supplied by third parties, this copyright work is licensed under a Creative Commons Attribution 3.0 Australia licence. To view a copy of this licence, visit http://creativecommons.org/licenses/by/3.0/au. In essence, you are free to copy, communicate and adapt the work, as long as you attribute the work to the Productivity Commission (but not in any way that suggests the Commission endorses you or your use) and abide by the other licence terms.
Use of the Commonwealth Coat of ArmsTerms of use for the Coat of Arms are available from the Department of the Prime Minister and Cabinet’s website: https://www.pmc.gov.au/government/commonwealth-coat-arms
Third party copyrightWherever a third party holds copyright in this material, the copyright remains with that party. Their permission may be required to use the material, please contact them directly.
AttributionThis work should be attributed as follows, Source: Productivity Commission, Governance survey, Technical Supplement 3.
If you have adapted, modified or transformed this work in anyway, please use the following, Source: based on Productivity Commission data, Governance survey, Technical Supplement 3.
An appropriate reference for this publication is:Productivity Commission 2018, ‘Governance survey’, Technical Supplement 3 to the Draft Report Superannuation: Assessing Efficiency and Competitiveness, Canberra, May.
Publications enquiriesMedia, Publications and Web, phone: (03) 9653 2244 or email: [email protected]
The Productivity Commission
The Productivity Commission is the Australian Government’s independent research and advisory body on a range of economic, social and environmental issues affecting the welfare of Australians. Its role, expressed most simply, is to help governments make better policies, in the long term interest of the Australian community.
The Commission’s independence is underpinned by an Act of Parliament. Its processes and outputs are open to public scrutiny and are driven by concern for the wellbeing of the community as a whole.
Further information on the Productivity Commission can be obtained from the Commission’s website (www.pc.gov.au).

Technical supplement 3: governance survey
This supplement summarises responses to the governance survey and should be read in conjunction with appendix C, which outlines the survey design, fieldwork and response rates achieved.
The supplement is divided into four sections, aligning with the four parts of the survey. Section 3.1 presents summary respondent information. Section 3.2 covers characteristics of governance Boards. Section 3.3 summarises responses on Board challenges and section 3.4, responses to questions about governance quality.
3.1 Respondent information — Qs 1–3
Q1. Respondent name and job title
Responses not reported.
Q2. How long have you held this position, in years?
Table 3.1 CEO tenure, years — Q280 responses
Years of tenure Number of responses Per cent of responses
Less than 1 6 7.51–2 23 28.8>2–5 14 17.5>5–10 17 21.3>10–15 17 21.3>15 3 3.8Total 80 100.0
Source: Governance survey.
TECHNICAL SUPPLEMENT 3 1

Table 3.2 Summary statistics, CEO tenure, by fund type — Q280 responses
Fund type Average tenure (years)
Corporate 6.5Industry 7.0Public sector 6.6Retail 5.0Total 6.4
Source: Governance survey.
Q3. Registerable Superannuation Entity (RSE) licensee name
Responses not reported.
3.2 Governance Board facts — Qs 4–11
Q4. Composition of the current Board and composition allowed under the Board’s governing rules?
Table 3.3 Number of directors on current Board — Q480 responses
Number of directors Number of responses Per cent of responses
4 4 5.05 9 11.36 21 26.37 6 7.58 9 11.39 17 21.310 2 2.511 5 6.312 4 5.013 1 1.314 1 1.316 1 1.3Total 80 100.0
Source: Governance survey.
2 SUPERANNUATION: EFFICIENCY AND COMPETITIVENESS

Table 3.4 Number of women directors on current Board — Q480 responses
Number of women directors Number of responses Per cent of responses
0 5 6.31 16 20.02 22 27.53 19 23.84 12 15.05 2 2.56 3 3.88 1 1.3Total 80 100.0
Source: Governance survey.
Table 3.5 Number of independent directors on current Board — Q480 responses
Number of independent directors Number of responses Per cent of responses
0 22 27.51 17 21.32 11 13.83 14 17.54 6 7.55 5 6.36 2 2.57 2 2.58 1 1.3Total 80 100.0
Source: Governance survey.
Table 3.6 Summary statistics, current Board membership — Q480 responses
Current Board membership (number)
Average Minimum Maximum
Number of directors 7.8 4 16Number of women directors 2.5 0 8Number of independent directors 2.1 0 8
Source: Governance survey.
TECHNICAL SUPPLEMENT 3 3
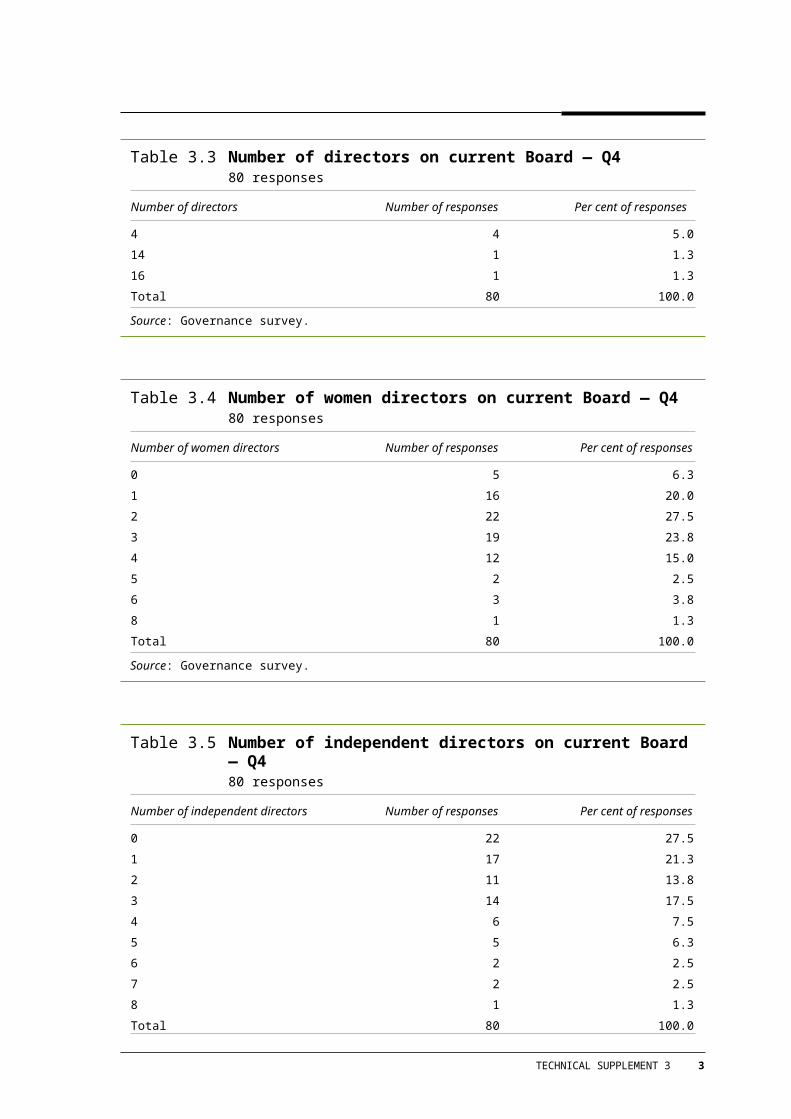
Table 3.7 Number of directors allowed under governing rules — Q475 responses
Number of directors allowed Number of responses Per cent of responses
4 1 1.35 2 2.76 3 4.07 3 4.08 5 6.79 13 17.310 12 16.011 3 4.012 12 16.013 2 2.716 1 1.317 1 1.3Not applicable 7 9.3Not specified 10 13.3Total 75 100.0
Source: Governance survey.
Table 3.8 Number of women directors allowed under governing rules — Q458 responses
Number of women directors allowed Number of responses Per cent of responses
6 2 3.57 2 3.58 3 5.29 5 8.610 2 3.511 1 1.712 6 10.3Not applicable 20 34.5Not specified 17 29.3Total 58 100.0
Source: Governance survey.
Table 3.9 Number of independent directors allowed under governing rules — Q467 responses
Number of independent directors allowed Number of responses Per cent of responses
4 SUPERANNUATION: EFFICIENCY AND COMPETITIVENESS

Table 3.9 Number of independent directors allowed under governing rules — Q467 responses
0 3 4.51 15 22.42 5 7.53 9 13.44 1 1.56 1 1.57 1 1.58 2 3.010 2 3.012 4 6.0Not applicable 13 19.4Not specified 9 13.4Proportional 2 3.0Total 67 100.0
Source: Governance survey.
Q5. Average director tenure for current Board, in years?
Table 3.10 Average director tenure for current Board — Q579 responses
Average years of director tenure Number of responses Per cent of responses
Less than 3 7 8.93-3.9 16 20.34-4.9 11 13.95-5.9 16 20.36-6.9 12 15.27-9.9 13 16.5Greater than 10 4 5.1Total 79 100.0
Source: Governance survey.
TECHNICAL SUPPLEMENT 3 5

Table 3.11 Summary statistics, average director tenure for current Board by fund type — Q579 responses
Average director tenure (years)
Fund type Average Minimum Maximum
Corporate 5.3 1.4 9.0
Industry 6.3 2.5 13.8
Public sector 5.4 3.0 9.0
Retail 3.8 1.0 7.0
Overall 5.4 1.0 13.8
Source: Governance survey.
Q6. Maximum director tenure allowable under your governing policy, in years?
Table 3.12 Maximum director tenure allowed under governing rules — Q676 responses
Maximum years allowed Number of responses Per cent of responses
3 1 1.34 1 1.37 1 1.39 14 18.410 7 9.212 42 55.315 3 4.016 2 2.618 2 2.625 1 1.3Not applicable 2 2.6Total 76 100.0
Source: Governance survey.
Table 3.13 Summary statistics, maximum director tenure allowed under governing rules, by fund type — Q676 responses
Maximum director tenure allowed under governing rules (years)
Fund type Average Minimum Maximum
Corporate 13.1 9.0 25.0Industry 11.7 4.0 18.0
6 SUPERANNUATION: EFFICIENCY AND COMPETITIVENESS

Table 3.13 Summary statistics, maximum director tenure allowed under governing rules, by fund type — Q676 responses
Maximum director tenure allowed under governing rules (years)
Fund type Average Minimum Maximum
Corporate 13.1 9.0 25.0Public sector 11.6 7.0 18.0Retail 10.2 3.0 15.0Overall 11.5 3.0 25.0a Underlying data exclude CEOs who either did not respond or whose response was ‘not applicable’.
Source: Governance survey.
Q7. Committees of the Board — number of current serving members, number who are independent and number who are not Board directors?
Table 3.14 Board committees — Q7a
80 responses
Board committee
Funds with committee type Average number of committee membersb
Number Per cent of responses
Total Independent Not Board directors
Audit 15 18.8 4.1 3.2 1.8Audit and compliance 7 8.8 4.0 1.3 0Audit and governance 2 2.5 4.0 0 0Audit and risk 17 21.3 4.5 1.9 1.5Audit, risk and compliance 38 47.5 4.1 2.3 2.0Compliance 4 5.0 4.5 0 0Governance 3 3.8 4.7 2.0 1.0Insurance and claims 31 38.8 3.5 1.7 2.0Investment 67 83.8 4.8 1.8 1.8Member services and marketing 19 23.8 4.4 1.0 1.3Other 42 52.5 3.6 1.6 2.4Remuneration 72 90.0 4.1 2.2 2.9Risk 13 16.3 4.5 2.3 3.3Risk and compliance 3 3.8 4.3 4.0 2.0a Committee names that differed slightly from those in the list above were coded to the closest committee type. b No response on number of committee members was coded to zero.
Source: Governance survey.
Q.8 For each type of Board director (e.g. member representative, employer representative, independent, non-executive, executive), who the director is
TECHNICAL SUPPLEMENT 3 7

nominated by, the nature of the selection process, who makes the final selection decision and the nature of any outside advice or input into the selection process.
Table 3.15 Board selection processes — Q8 — Nomination processa
78 responses
Directors nominated by
Director type
Employer rep.b
Executive Independent Member rep.
Non-executive
Board/sub-committee 2 3 26 0 3Employer or employer group 64 0 0 0 0Member nomination/election 0 0 1 22 0Member rep. organisation 0 0 0 70 0Other 4 0 14 2 1Parent company 16 12 8 0 11State government 9 0 1 0 0Not applicable 0 2 4 0 0Not reported 0 1 3 0 0a Responses were coded to fit the nomination categories used in the table. b ‘Rep.’ refers to representative.
Source: Governance survey.
Table 3.16 Board selection processes — Q8 — Selection processa
78 responses
Director type
Selection decision byEmployer
rep.bExecutive Independent Member
rep.Non-
executive
Board/sub-committee 62 11 48 59 4Employer or employer group 18 0 0 0 0Member nomination/election 1 0 1 15 0Member rep. organisation 0 0 0 19 0Other 1 0 1 0 0Parent company 8 7 4 0 11State government 4 0 1 0 0Not applicable 0 0 0 0 0Not reported 1 0 2 1 0a Responses were coded to fit the selection decision categories used in the table. b ‘Rep.’ refers to representative.
Source: Governance survey.
8 SUPERANNUATION: EFFICIENCY AND COMPETITIVENESS

Table 3.17 Board selection processes — Q8 — Use of outside advice in selection processa
78 responses
Outside advice used in selection
Director type
Employer rep.b Executive Independent Member rep. Non-executive
Discretionary 12 3 16 13 2No 44 10 18 43 5Yes 8 0 18 7 8Not applicable 16 3 3 17 0Not reported 15 2 2 14 0a Responses were coded to fit the advice source categories used in the table. b ‘Rep.’ refers to representative.
Source: Governance survey.
Q9. Please provide any other information or explanation about the appointment, removal and renewal processes that you view as useful to the Commission’s inquiry
Responses not reported.
TECHNICAL SUPPLEMENT 3 9

Q10. What percentage of the Board’s time during meetings over the course of the last financial year was spent on each of the following tasks?
Table 3.18 Allocation of Board time — Q10Percentage of Board time spent on different tasks in 2016-17, 72 responses
Task Average Maximum
Minimum
Strategic tasksDetermining and monitoring against strategic objectives and business plans
15.4 40 2.7
Determining and implementing the fund’s investment strategy 10.4 30 0Management of risks 11.0 20 3Assessing the fund’s competitiveness (on fees, investments, insurance product offering etc)
7.1 20 0
Reviewing and considering the implications of regulatory change 8.4 20 1Operational tasksReviewing and assessing the fund’s investment performance 7.9 35 0Assessing quality of member services/needs of members 8.1 20 0Reviewing and assessing insourcing/outsourcing of services 5.1 18 0Selecting and assessing investment managers 3.2 16 0Selecting and assessing the administrator 4.2 15 0Assessing appropriateness of insurance policies 4.1 15 0Ensuring compliance with legislation and regulation 8.2 30 0Other tasks (including insurance claims, consulting with actuaries and auditors and other Board tasks)
9.0 50 0
Source: Governance survey.
Q11. Please provide any information that would assist the Commission in interpreting your responses, for example, detail about what is included within ‘Other tasks’ or where delegations of responsibility (including to Board committees) mean Board time spent on a task is low
Responses not reported.
10 SUPERANNUATION: EFFICIENCY AND COMPETITIVENESS

3.3 Board challenges — Qs 12–17
Q12–14. Please rate each of the Board challenges listed below on a scale from 1–4 with respect to your Board’s experience in the last financial year (with 1 indicating ‘not a challenge’, 2 ‘modest challenge’, 3 ‘significant challenge’, 4 ‘major challenge’ and NA ‘not applicable’).
Table 3.19 Board challenge rating — Q12 — fund management and performance challengesData presented as row percentages, 79 responses
Degree of challenge
None Modest Significant
Major NA
a. Fund stability and sustainability (including scale) in the short run (1 to 3 years)
49.4 32.9 10.1 5.1 2.5
b. Fund stability and sustainability (including scale) in the longer run (more than 3 years)
15.2 50.6 21.5 10.1 2.5
c. Fund investment performance 13.9 54.4 22.8 6.3 2.5
d. Understanding member engagement and member needs
22.8 57.0 16.5 3.8 0.0
e. Stakeholder communications 35.4 54.4 8.9 0.0 1.3
f. Appropriate insurance arrangements for members
22.8 46.8 25.3 1.3 3.8
Source: Governance survey.
Table 3.20 Board challenge rating — Q13 — organisational challengesData presented as row percentages, 79 responses
Degree of challenge
None Modest Significant Major NA
a. Fund mission clarity, alignment of interests, and autonomy
64.6 29.1 5.1 1.3 0.0
b. Fund design and talent attraction/retention 43.6 44.9 5.1 6.4 0.0
c. Clarity about respective roles and responsibilities of Board and Management
65.8 29.1 5.1 0.0 0.0
d. Superannuation policy and regulatory changes
1.3 29.1 49.4 19.0 1.3
e. Risk management 19.0 64.6 15.2 1.3 0.0
Source: Governance survey.
TECHNICAL SUPPLEMENT 3 11

Table 3.21 Board challenge rating — Q14 — board effectiveness/dynamics challengesData presented as row percentages, 79 responses
Degree of challenge
None Modest Significant Major NA
a. Board effectiveness 62.0 34.2 3.8 0.0 0.0b. Board expertise and experience 55.7 39.2 5.1 0.0 0.0c. Board conflict resolution and consensus
building processes84.8 11.4 3.8 0.0 0.0
d. Reaching consensus about the investment strategy
64.6 32.9 1.3 0.0 1.3
Source: Governance survey.
Q15. Please identify any additional challenges faced by your board in the last financial year and classify them as either a ‘modest challenge’, ‘significant challenge’ or ‘major challenge’.
Table 3.22 Other modest, significant and major challenges nominated by CEOs — Q15a,b
Count of responses
Area of challenge Modest Significant Major Total
Cyber risk and security 5 5 0 10Board effectiveness and governance 7 2 0 9Competition 2 3 2 7Fund growth 3 3 1 7Fund mergers 2 2 2 6Investment performance 3 1 0 4Member experience/engagement 2 2 0 4Other 18 10 4 32Performance of key service providers 4 2 1 7Project delivery 2 1 1 4Regulatory change 7 8 8 23a 50 CEOs nominated at least one other challenge. b Responses were coded to the areas of challenge listed in the table.
Source: Governance survey.
12 SUPERANNUATION: EFFICIENCY AND COMPETITIVENESS

Q16. Please rank the top 4 challenges for your Board in order from most to least important.
Table 3.23 Top four challenges ranked from most (1) to least (4) important — Q16a
71 responses
1 2 3 4 Total
Regulatory change 33 16 10 5 64Investment performance 6 5 6 6 23Long term fund sustainability 6 6 5 5 22Other 5 6 10 6 27Investment strategy 4 2 4 10Member experience/engagement 4 12 6 6 28Project delivery 4 0 1 1 6Board effectiveness and governance 2 3 6 3 14Fund growth 2 2 0 2 6Fund mergers 2 2 1 0 5Appropriate insurance arrangements 1 4 8 4 17Competition 1 2 2 0 5Risk management 1 3 2 5 11Cyber risk and security 0 1 3 5 9Fund design and talent attraction/ret.. 0 2 1 3 6Performance of key service providers 0 3 2 2 7Product design 0 2 0 1 3
a Responses were coded to the areas of challenge listed in the table.
Source: Governance survey.
Q17. For the challenges you rated as significant or major (that is, that you gave a rating of 3 or 4), please provide a brief explanation for why these are a challenge
Responses not reported.
TECHNICAL SUPPLEMENT 3 13

3.4 Governance quality — Qs 18–24
For all tables in this section, row percentages are used for responses. Calculation of the mean rating follows the approach in Keith Ambachtsheer’s work, with responses coded from 1 (strongly disagree) to 6 (strongly agree). Mean ratings from Keith Ambachtsheer’s 2014 survey are reported for reference (Ambachtsheer and McLaughlin 2015).
For the purposes of presentation the numbers used for coding are presented instead of the descriptions that CEOs responded to. These descriptions are:
1 denotes ‘Strongly disagree’
2 denotes ‘Mostly disagree’
3 denotes ‘Slightly disagree’
4 denotes ‘Slightly agree’
5 denotes ‘Mostly agree’
6 denotes ‘Strongly agree’
Additionally ‘NA’ as a column title or ‘..’ in the body of a table denote ‘not applicable’, the column titled ‘KA’ denotes the mean rating obtained for a question in Keith Ambachtsheer’s work, and – denotes nil or rounded to zero.
Table 3.24 Board capability — Q18Aa
Data presented as row percentages, 78 responses
1 2 3 4 5 6 NA Mean KA
a. Our fund has an effective process for selecting, developing and terminating its Board directors.
– 3.8 2.6 3.8 29.5 59.0 1.3 5.4 3.8
b. My Board has appropriate turnover (neither too high nor too low).
1.3 5.1 3.8 10.3 33.3 44.9 1.3 5.1 4.5
c. My Board directors have capabilities (relevant knowledge, experience, intelligence, skills) necessary to do their work.
– 1.3 – 1.3 32.1 64.1 1.3 5.6 4.3
d. My Board has the right mix of capabilities. – 1.3 1.3 3.8 37.2 55.1 1.3 5.5 ..e. My Board seeks independent review of
Board composition and mix of capabilities to ensure these are optimal.
1.3 2.6 9.0 9.0 23.1 39.7 15.4 5.0 ..
f. My Board examines and improves its own mix of capabilities over time.
– – – 7.7 38.5 52.6 1.3 5.5 ..
g. My Board uses independent experts where relevant to provide additional expertise to Board subcommittees.
– – – 5.1 19.2 67.9 7.7 5.7 ..
h. Board subcommittees provide input of meaningful value to the deliberations and decision making of my Board.
– – 1.3 20.5 76.9 1.3 5.8 ..
14 SUPERANNUATION: EFFICIENCY AND COMPETITIVENESS

Table 3.24 Board capability — Q18Aa
Data presented as row percentages, 78 responsesa 1 denotes ‘Strongly disagree’; 2 denotes ‘Mostly disagree’; 3 denotes ‘Slightly disagree’; 4 denotes ‘Slightly agree’; 5 denotes ‘Mostly agree’; 6 denotes ‘Strongly agree’; ‘NA’ as a column title or ‘..’ in the body of a table denotes ‘Not applicable’; the Mean is the mean response excluding ‘not applicable’ responses; ‘KA’ denotes the mean rating obtained for a question in Keith Ambachtsheer’s work. – denotes nil or rounded to zero.
Source: Governance survey.
Q18B. For the quality ratings that you assessed as Disagree (whether strongly, mostly or slightly) in question 18A, please provide a brief explanation
Responses not reported.
Table 3.25 Board performance – Q19Aa
Data presented as row percentages, 78 responses
1 2 3 4 5 6 NA Mean KA
a. My Board does a good job of representing the interests of members.
– – – – 16.7 82.1 1.3 5.8 5.4
b. The interests of members are always the same as the interests of the Board.
– – 1.3 3.9 38.5 53.9 2.6 5.5 ..
c. My Board has good mechanisms to understand and communicate with members.
– 1.3 1.3 6.4 44.9 42.3 3.9 5.3 4.8
d. My Board sets clear, appropriate, understandable and well communicated standards for our organisational performance.
– – – 6.4 28.2 60.3 5.1 5.6 4.9
e. My Board sets a clear, appropriate, understandable and well communicated framework for values and ethics.
– – 1.3 3.9 32.1 60.3 2.6 5.6 5.1
f. My Board approves the necessary resources for us to do our work.
– – – 3.9 25.6 64.1 6.4 5.6 5.3
g. My Board holds me accountable for our performance and does not accept subpar performance.
– – – 2.6 19.2 75.6 2.6 5.8 5.3
h. My Board understands and shares our vision, mission, values, strategic positioning, operation plan and resource plan.
– – – 2.6 25.6 65.4 6.4 5.7 5.2
a 1 denotes ‘Strongly disagree’; 2 denotes ‘Mostly disagree’; 3 denotes ‘Slightly disagree’; 4 denotes ‘Slightly agree’; 5 denotes ‘Mostly agree’; 6 denotes ‘Strongly agree’; ‘NA’ as a column title or ‘..’ in the body of a table denotes ‘Not applicable’; the Mean is the mean response excluding ‘not applicable’ responses; ‘KA’ denotes the mean rating obtained for a question in Keith Ambachtsheer’s work. – denotes nil or rounded to zero.
Source: Governance survey.
TECHNICAL SUPPLEMENT 3 15

Q19B. For the quality ratings that you assessed as Disagree (whether strongly, mostly or slightly) in question 19A, please provide a brief explanation
Responses not reported.
Table 3.26 Board performance continued — Q20Aa
Data presented as row percentages, 78 responses
1 2 3 4 5 6 NA Mean KA
a. My Board does a good job of balancing over control and under control.
– 2.6 – 6.4 47.4 41.0 2.6 5.3 4.8
b. My Board directors understand their fiduciary duties as trustee directors.
– – 1.3 2.6 10.3 84.6 1.3 5.8 ..
c. My Board understands and seeks to implement contemporary best practice for Board governance.
– 1.3 – 1.3 34.6 61.5 1.3 5.6 ..
d. My Board has a sound process for setting its strategic objectives.
– – 1.3 5.1 25.6 66.7 1.3 5.6 ..
e. My Board effectively evaluates progress against its strategic objectives.
– – 1.3 2.6 28.2 65.4 2.6 5.6 ..
f. My Board examines and improves its own effectiveness on a regular basis.
– – 2.6 6.4 29.5 59.0 2.6 5.5 4.6
g. My Board and related committees use their time effectively (deal with the right issues).
– – 1.3 3.9 34.6 59.0 1.3 5.5 4.7
h. My Board and related committees use their time efficiently (focused and do not waste time).
– – 1.3 1.3 34.6 61.5 1.3 5.6 4.8
a 1 denotes ‘Strongly disagree’; 2 denotes ‘Mostly disagree’; 3 denotes ‘Slightly disagree’; 4 denotes ‘Slightly agree’; 5 denotes ‘Mostly agree’; 6 denotes ‘Strongly agree’; ‘NA’ as a column title or ‘..’ in the body of a table denotes ‘Not applicable’; the Mean is the mean response excluding ‘not applicable’ responses; ‘KA’ denotes the mean rating obtained for a question in Keith Ambachtsheer’s work. – denotes nil or rounded to zero.
Source: Governance survey.
Q20B. For the quality ratings that you assessed as Disagree (whether strongly, mostly or slightly) in question 20A, please provide a brief explanation
Responses not reported.
Table 3.27 Investment governance — Q21Aa
Data presented as row percentages, 78 responses
1 2 3 4 5 6 NA Mean KA
a. Developing our investment strategy required considerable effort and involvement of the Board.
– 2.6 5.1 12.8 32.1 44.9 2.6 5.1 5.4
b. My Board’s investment strategy is not – 2.6 3.9 16.7 38.5 34.6 3.9 5.0 ..
16 SUPERANNUATION: EFFICIENCY AND COMPETITIVENESS

Table 3.27 Investment governance — Q21Aa
Data presented as row percentages, 78 responses
1 2 3 4 5 6 NA Mean KA
a. Developing our investment strategy required considerable effort and involvement of the Board.
– 2.6 5.1 12.8 32.1 44.9 2.6 5.1 5.4
materially influenced by the performance of peer funds.
c. There is a high level of trust between my Board/investment committee and our investment team.
– – – 1.3 21.8 70.5 6.4 5.7 5.3
d. There is a clear allocation of responsibilities and accountabilities for fund decisions between the Board/investment committee and the investment team.
– – – 3.9 18.0 71.8 6.4 5.7 5.4
e. My Board does not spend time assessing individual portfolio manager effectiveness or individual investments.
2.6 7.7 9.0 10.3 26.9 37.2 6.4 4.7 4.8
f. I have the necessary managerial authority to implement long term asset mix within reasonable limits.
6.4 10.3 5.1 2.6 10.3 46.2 19.2 4.7 5.0
g. I have the authority to retain and terminate investment managers.
19.2 6.4 7.7 7.7 14.1 21.8 23.1 3.7 4.5
h. My Board assesses investment performance over the medium to long term and against our investment strategy.
– – – – 15.4 80.8 3.9 5.8 ..
i. My Board regularly assesses and fully understands the attribution of our investment performance outcomes, including by asset class.
1.3 1.3 1.3 6.4 32.1 52.6 5.1 5.4 ..
a 1 denotes ‘Strongly disagree’; 2 denotes ‘Mostly disagree’; 3 denotes ‘Slightly disagree’; 4 denotes ‘Slightly agree’; 5 denotes ‘Mostly agree’; 6 denotes ‘Strongly agree’; ‘NA’ as a column title or ‘..’ in the body of a table denotes ‘Not applicable’; the Mean is the mean response excluding ‘not applicable’ responses; ‘KA’ denotes the mean rating obtained for a question in Keith Ambachtsheer’s work. – denotes nil or rounded to zero.
Source: Governance survey.
Q21B. For the quality ratings that you assessed as Disagree (whether strongly, mostly or slightly) in question 21A, please provide a brief explanation
Responses not reported.
TECHNICAL SUPPLEMENT 3 17

Table 3.28 Conflict and risk management — Q22Aa
Data presented as row percentages, 78 responses
1 2 3 4 5 6 NA Mean KA
a. Developing our risk management framework requires considerable effort and involvement of the Board.
– – 2.6 14.1 32.1 50.0 1.3 5.3 ..
b. My Board has a good understanding of the risks faced by the fund and its members, how they are changing and how they are identified, assessed and managed.
– – – – 24.4 74.4 1.3 5.8 ..
c. My Board usually has adequate time to think about all the risk implications when making decisions.
– – – 2.6 28.2 68.0 1.3 5.7 ..
d. My Board has robust policy and procedures for identifying, assessing and managing actual, perceived and potential conflicts of interests or duties.
– – – – 16.7 82.1 1.3 5.8 ..
e. My Board and subcommittee members are aware of their duties and responsibilities regarding conflicts of interests or duties.
– – – 1.3 10.3 87.2 1.3 5.9 ..
f. My Board’s conflict management process requires individuals to excuse themselves from decisions in which they have a conflict.
– 1.3 – 1.3 10.3 85.9 1.3 5.8 ..
g. My Board is active in declaring conflicts and in the assessment and management of any identified actual, potential or perceived conflicts of interests or duties.
– – – 1.3 14.1 83.3 1.3 5.8 ..
h. My Board identifies and effectively manages any related party transactions.
– – – 1.3 5.1 84.6 9.0 5.9 ..
a 1 denotes ‘Strongly disagree’; 2 denotes ‘Mostly disagree’; 3 denotes ‘Slightly disagree’; 4 denotes ‘Slightly agree’; 5 denotes ‘Mostly agree’; 6 denotes ‘Strongly agree’; ‘NA’ as a column title or ‘..’ in the body of a table denotes ‘Not applicable’; the Mean is the mean response excluding ‘not applicable’ responses; ‘KA’ denotes the mean rating obtained for a question in Keith Ambachtsheer’s work. – denotes nil or rounded to zero.
Source: Governance survey.
Q22B. For the quality ratings that you assessed as Disagree (whether strongly, mostly or slightly) in question 22A, please provide a brief explanation
Responses not reported.
Table 3.29 Operational issues — Q23Aa
Data presented as row percentages, 78 responses
1 2 3 4 5 6 NA Mean KA
a. I have the necessary people and budget to do the work.
– – – 3.9 42.3 51.3 2.6 5.5 5.1
b. Compensation levels in our – – 3.9 10.3 35.9 44.9 5.1 5.3 4.4
18 SUPERANNUATION: EFFICIENCY AND COMPETITIVENESS

Table 3.29 Operational issues — Q23Aa
Data presented as row percentages, 78 responses
1 2 3 4 5 6 NA Mean KA
a. I have the necessary people and budget to do the work.
– – – 3.9 42.3 51.3 2.6 5.5 5.1
organisation are competitive.c. Performance based compensation is
an important component of our organisational design.
7.7 3.9 3.9 15.4 14.1 35.9 19.2 4.6 3.7
a 1 denotes ‘Strongly disagree’; 2 denotes ‘Mostly disagree’; 3 denotes ‘Slightly disagree’; 4 denotes ‘Slightly agree’; 5 denotes ‘Mostly agree’; 6 denotes ‘Strongly agree’; ‘NA’ as a column title or ‘..’ in the body of a table denotes ‘Not applicable’; the Mean is the mean response excluding ‘not applicable’ responses; ‘KA’ denotes the mean rating obtained for a question in Keith Ambachtsheer’s work. – denotes nil or rounded to zero.
Source: Governance survey.
Q23B. For the quality ratings that you assessed as Disagree (whether strongly, mostly or slightly) in question 23A, please provide a brief explanation
Responses not reported.
Q24. Please provide any additional comments on Governance Quality you feel might be useful for the Commission’s Inquiry
Responses not reported.
Q25. I give permission for my de-identified responses to be included in a dataset that researchers can apply to the Productivity Commission to access
Responses not reported.
References
Ambachtsheer, K. and McLaughlin, J. 2015, How effective is pension fund governance today? And do pension funds invest for the long-term? Findings from a new survey, KPA Advisory Services, Toronto.
TECHNICAL SUPPLEMENT 3 19