Embed Size (px)
Citation preview

International Stormwater Best Management Practices (BMP) Database
Technical Summary:
Volume Reduction
Prepared by
Geosyntec Consultants
Wright Water Engineers, Inc.
Under Support From
Water Environment Research Foundation Federal Highway Administration
Environment and Water Resources Institute of the American Society of Civil Engineers
January 2011
International Stormwater BMP Database
Pollutant Category Summary: Volume Reduction Page i
January 2011
Disclaimer
The BMP Database (“Database”) was developed as an account of work sponsored by the Water Environment Research Foundation (WERF), the American Society of Civil Engineers (ASCE)/Environmental and Water Resources Institute (EWRI), the American Public Works Association (APWA), the Federal Highway Administration (FHWA), and U.S. Environmental Protection Agency (USEPA) (collectively, the “Sponsors”). The Database is intended to provide a consistent and scientifically defensible set of data on Best Management Practice (“BMP”) designs and related performance. Although the individuals who completed the work on behalf of the Sponsors (“Project Team”) made an extensive effort to assess the quality of the data entered for consistency and accuracy, the Database information and/or any analysis results are provided on an “AS-IS” basis and use of the Database, the data information, or any apparatus, method, or process disclosed in the Database is at the user’s sole risk. The Sponsors and the Project Team disclaim all warranties and/or conditions of any kind, express or implied, including, but not limited to any warranties or conditions of title, non-infringement of a third party’s intellectual property, merchantability, satisfactory quality, or fitness for a particular purpose. The Project Team does not warrant that the functions contained in the Database will meet the user’s requirements or that the operation of the Database will be uninterrupted or error free, or that any defects in the Database will be corrected.
UNDER NO CIRCUMSTANCES, INCLUDING CLAIMS OF NEGLIGENCE, SHALL THE SPONSORS OR THE PROJECT TEAM MEMBERS BE LIABLE FOR ANY DIRECT, INDIRECT, INCIDENTAL, SPECIAL, OR CONSEQUENTIAL DAMAGES INCLUDING LOST REVENUE, PROFIT OR DATA, WHETHER IN AN ACTION IN CONTRACT OR TORT ARISING OUT OF OR RELATING TO THE USE OF OR INABILITY TO USE THE DATABASE, EVEN IF THE SPONSORS OR THE PROJECT TEAM HAVE BEEN ADVISED OF THE POSSIBILITY OF SUCH DAMAGES.
The Project Team’s tasks have not included, and will not include in the future, recommendations of one BMP type over another. However, the Project Team's tasks have included reporting on the performance characteristics of BMPs based upon the entered data and information in the Database, including peer reviewed performance assessment techniques. Use of this information by the public or private sector is beyond the Project Team’s influence or control. The intended purpose of the Database is to provide a data exchange tool that permits characterization of BMPs solely upon their measured performance using consistent protocols for measurements and reporting information.
The Project Team does not endorse any BMP over another and any assessments of performance by others should not be interpreted or reported as the recommendations of the Project Team or the Sponsors.

International Stormwater BMP Database
Pollutant Category Summary: Volume Reduction Page ii
January 2011
Acknowledgements
Report Preparation1
Aaron Poresky, P.E., Geosyntec Consultants
Jane Clary, Wright Water Engineers, Inc.
Eric Strecker, P.E. Geosyntec Consultants
Andrew Earles, P.E. Ph.D., D.WRE, Wright Water Engineers, Inc.
Project Information
WERF Project Director:
Jeff Moeller, P.E., Water Environment Research Foundation
Principal Investigators:
Jonathan Jones, P.E, Wright Water Engineers, Inc.
Eric Strecker, P.E., Geosyntec Consultants
Project Managers/Contacts for more information:
Jane Clary, Project Manager, Wright Water Engineers, Inc.
Marcus Quigley, P.E., Project Manager, Geosyntec Consultants
Project Steering Committee:
Patricia A. Cazenas, Office of Project Development and Environmental Review, Federal Highway
Administration
Brian Parsons, P.E., Environmental and Water Resources Institute of American Society of Civil
Engineers
Eric Strassler, Office of Water/Office of Science & Technology, U.S. Environmental Protection Agency
Project Subcommittee:
Michael E. Barrett, Ph.D., P.E., Center for Research in Water Resources, University of Texas
Bob Carr, P.E., Water Resources Modeling, American Public Works Association
David R. Graves, Environmental Science Bureau, New York State Dept. of Transportation
Gregory E. Granato, U.S. Geological Survey
Jesse Pritts, P.E., Engineering and Analysis Division Office of Water/Office of Science & Technology,
U.S. Environmental Protection Agency
Low Impact Development (LID) Expert Panel:
In December 2008, an expert panel provided input and guidance regarding efforts related to integrating
LID into the BMP Database, as well as approaches to volume reduction analysis. The authors gratefully
acknowledge the following experts who influenced the development of volume reduction analysis
concepts included in this paper:
Richard Horner, Ph.D., University of Washington
Bill Hunt, P.E., Ph.D., North Carolina State University
Bob Pitt, P.E., Ph.D., University of Alabama
Robert Roseen, P.E. Ph.D., University of New Hampshire
Robert Traver, P.E., Ph.D., Villanova University
Ben Urbonas, P.E., Urban Watersheds, LLC
1 Contact Aaron Poresky ([email protected]) or Jane Clary ([email protected]) with questions regarding this
summary.

International Stormwater BMP Database
Pollutant Category Summary: Volume Reduction Page iii
January 2011
Table of Contents
1 INTRODUCTION ............................................................................................................................................ 1
1.1 REGULATORY CONTEXT ...................................................................................................................................... 2 1.2 KEY VOLUME REDUCTION MECHANISMS ............................................................................................................... 3 1.3 GOALS OF VOLUME REDUCTION ANALYSIS ............................................................................................................. 4 1.4 ORGANIZATION OF REPORT ................................................................................................................................. 5
2 INVENTORY OF VOLUMETRIC DATA .............................................................................................................. 6
2.1 DATA INVENTORY .............................................................................................................................................. 6 2.2 KEY RELIABILITY CONSIDERATIONS ........................................................................................................................ 6 2.3 RECOMMENDATIONS FOR IMPROVING RELIABILITY OF VOLUME REDUCTION ANALYSES ................................................. 10
3 RECOMMENDED USES OF VOLUMETRIC DATA AND LIMITATIONS OF USES ................................................ 11
3.1 THEORETICAL CONSIDERATIONS ......................................................................................................................... 11 3.2 RECOMMENDED VOLUMETRIC ANALYSES SUPPORTED BY THE BMP DATABASE ........................................................... 12
4 CATEGORICAL ANALYSIS OF VOLUMETRIC DATA ........................................................................................ 12
4.1 PRIMARY SCREENING – FILTERED DATASETS PRIOR TO REASONABLENESS CHECKS ........................................................ 13 4.2 SECONDARY SCREENING – FILTERED DATASETS WITH REASONABLENESS CHECKS ......................................................... 16 4.3 RESULTS OF CATEGORICAL ANALYSES .................................................................................................................. 17
4.3.1 All Events - Pooled by BMP Category ................................................................................................. 19 4.3.2 All Studies – Pooled by BMP Category ............................................................................................... 27
5 ADVANCED ANALYSIS OF VOLUMETRIC DATA ............................................................................................ 27
6 CONCLUSIONS ............................................................................................................................................ 29
6.1 GENERAL CONCLUSIONS ................................................................................................................................... 29 6.2 RECOMMENDATIONS FOR BMP SELECTION .......................................................................................................... 30
7 REFERENCES ............................................................................................................................................... 31

Pollutant Category Summary: Fecal Indicator Bacteria Page 1
January 2011
Basic Terminology
The following key terms are used throughout this report:
Hydrologic performance: the ability of stormwater
BMPs to manage flow rates and volumes of runoff; in the
context of BMP effectiveness, refers collectively to
capture efficiency and volume reduction.
Capture efficiency: the fraction of long-term runoff
volume that is managed by a BMP (i.e., does not bypass).
Volume reduction: fraction of water managed by a BMP
that does not discharge to surface water (i.e., is infiltrated,
evaporated, transpired, or used). The total fraction of
runoff volume reduced is therefore the product of capture
efficiency and volume reduction.
Infiltration: the process of water entering soil at the
ground surface.
Percolation: the process of water moving downward
through the unsaturated zone of soil below the ground
surface.
Evaporation: the process by which water changes from a
solid to a gaseous state at the interface between liquid
water and atmosphere.
Transpiration: the process by which plants uptake liquid
water and expel it in a gaseous phase.
Evapotranspiration: the combined processes of
evaporation and transpiration.
Water balance: the long-term balance of water fluxes in
and out of a control volume; in the context of a BMP, the
major fluxes include inflow, outflow, percolation,
evapotranspiration, and non-potable use.
Hydromodification: Changes in runoff and sediment
yield caused by land use modifications.
Normally-wet BMPs: BMPs characterized by the
presence of a permanent pool of water, commonly
sustained by a low permeability liner, continuous
baseflow, and/or groundwater seepage.
Normally-dry BMPs: BMPs characterized by the
presence of discharge pathways at their lowest elevation,
such that they are designed to dry between storm events.
VOLUME REDUCTION TECHNICAL SUMMARY
1 INTRODUCTION
The hydrologic performance of stormwater best
management practices (BMPs) is an important
factor in the overall effectiveness of BMPs in
reducing potential adverse impacts of urbanization
on receiving waters. In addition to providing water
quality data, the International Stormwater BMP
Database also provides watershed characteristics
and monitoring results for precipitation and flow
conditions, enabling assessment of the hydrologic
performance of BMPs when such data are provided
by the researcher. BMP performance metrics
recommended since the inception of the BMP
Database project have included:
1. the fraction of long-term runoff volume
managed by the BMP (i.e., capture
efficiency),
2. the fraction of the captured volume that is
lost in the BMP and does not discharge to
surface water (i.e., volume reduction), and
3. the level of treatment provided for water
that discharges from the BMP (effluent
concentration characteristics).
Historically, BMP performance analysis has
focused primarily on water quality aspects of BMP
performance in terms of pollutant loads and
concentrations. Similarly, stormwater management
strategies have focused primarily on capture
efficiency (through the development and
application of sizing criteria) and treatment
performance (through the selection and design of
BMPs to address pollutants of concern).

International Stormwater BMP Database
Pollutant Category Summary: Volume Reduction Page 2
January 2011
More recently, volume reduction has been emphasized as a means of managing site hydrology
and controlling stormwater pollutant loads, and the need to quantify the hydrologic performance
of BMPs has become more important. The watershed, precipitation and flow data contained in
the BMP Database serve as a potentially useful source of data to facilitate better understanding
of the hydrologic performance of BMPs.
The purposes of this technical summary are to:
Discuss the regulatory context for volume reduction and introduce potential goals of
volume reduction analysis,
Provide an inventory of the volumetric data contained in the BMP Database,
Discuss reliability of these data and recommended uses,
Provide suggestions for screening criteria to improve the reliability of the datasets,
Describe methods that may be used for categorical analysis of BMPs and provide
categorical analysis results, and
Discuss potential advanced uses of volumetric data.
1.1 Regulatory Context
Volume is increasingly recognized as a ―constituent of concern‖ in the realm of water quality
regulations. Increased runoff volume resulting from urbanization carries with it increased
pollutant loads. In addition, increased volumes and peak flow rates carry more energy to
receiving channels and can result in channel erosion. The term hydrograph modification
(hydromodification) is commonly used in the regulation of volume to describe changes in the
volume, rates and timing of runoff, which, coupled with changes in sediment supply, can cause
channel instability. The term hydromodification also encompasses changes to the site water
balance which can affect the seasonality of flow in receiving water and alter groundwater
conditions. Reduced infiltration volume resulting from increased impervious cover and soil
compaction can, in some cases, result in lower dry weather base flows and lower groundwater
recharge. Conversely, increases in infiltration as a result of imported irrigation or the creation of
more direct pathways to groundwater (such as in an infiltration basin in sandy soil or dry wells),
can yield unnaturally high groundwater and unseasonal base flows in intermittent and ephemeral
streams or increased base flows in perennial streams.
Historically, urban runoff volume has been regulated in the context of flood control, which
primarily emphasizes peak flow reduction, but not necessarily runoff volume reduction. Other
historic emphasis on volume reduction has been related to groundwater augmentation and
infrastructure savings (e.g., use of dry wells rather than a storm sewer system or to reduce
combined sewer overflows in areas with very high permeability soils). More recently, National
Pollutant Discharge Elimination System (NPDES) Municipal Separate Storm Sewer System
(MS4) permits in some parts of the country have begun to emphasize volume reduction in the
context of low impact development (LID) objectives (e.g., controlling volumes and flow rates to
mimic pre-development conditions) and addressing hydromodification impacts. For example,
International Stormwater BMP Database
Pollutant Category Summary: Volume Reduction Page 3
January 2011
recent nationwide regulations for federal facilities have required projects to attempt to maintain
pre-development hydrology, ―retaining‖ stormwater on site via infiltration, evaporation, and
harvest and use BMPs (USEPA, 2009). (The authors note that stormwater that is
evapotranspired, harvested and used, or infiltrated is not actually ―retained‖; instead, it is
prevented from running off. However, the use of the word ―retain‖ to describe limiting surface
runoff is gaining acceptance in the stormwater field).
Finally, volume can be the key parameter or contributing parameter in 303(d) listed impairments
to receiving waters and can be regulated as part of Total Maximum Daily Loads (TMDLs).
Exhibit 1 provides a summary of the 303(d) list impairments and TMDLs that are potentially
related to stormwater volumes or base flow rate alterations associated with urbanization.
Exhibit 1. Impairments and TMDLs Related or Potentially Related to Volume, Flow Rates
and Channel Erosion
Impairment Impaired Waters TMDLs
Flow Alteration(s) 109 0
Sediment 6,178 3,492
Turbidity 3,064 969
Habitat Alterations 669 83
Source: http://iaspub.epa.gov/waters10/attains_nation_cy.control?p_report_type=T
(Accessed 10/01/2010)
1.2 Key Volume Reduction Mechanisms
Volume reduction in the context of BMP effectiveness refers to the volume that enters a BMP
that does not discharge to surface water. This water is considered ―lost‖ or ―retained‖. The fates
of lost volume include: infiltration into the bottom and sides of the BMP and percolation to
groundwater or shallow interflow pathways, evaporation or evapotranspiration to the
atmosphere, or use of the stored water, generally either for irrigation or other non-potable use
such as toilet flushing. The key volume reduction mechanisms can be categorized as follows:
Evaporation of ponded water
Evapotranspiration of water stored in the root zone below the surface of the BMP
Infiltration below the BMP and through the side walls (Note: may still reach receiving
water via groundwater discharge.)
Demand for stored water (Note: may still reach receiving water via POTW outfall.)
The relative magnitude of each mechanism is expected to vary by BMP type, underlying soil
types, groundwater conditions and connectivity to receiving water, climate, and non-potable
water demand.

International Stormwater BMP Database
Pollutant Category Summary: Volume Reduction Page 4
January 2011
1.3 Goals of Volume Reduction Analysis2
Volume reduction provided by BMPs can help meet a variety of stormwater management
objectives, even if the BMP is not specifically designed to retain stormwater (Strecker et al.,
2004). An analysis of the volumetric data contained in the BMP Database can help provide a
better understanding of the benefits that BMPs can be expected to provide for volume reduction.
Additionally, such analysis may potentially be used in the development and calibration of
mechanistic representations of volume reduction processes. Volumetric analyses of the BMP
Database may attempt to answer one or more of the following fundamental questions regarding
runoff volume reduction:
How much runoff volume is reduced by a BMP or suite of BMPs on a long-term average
basis?
How does one category of BMPs compare to another category of BMPs with respect to
volume reduction performance?
What effect does a BMP or suite of BMPs have on the frequency of runoff leaving the
site?
How does performance vary with the magnitude of precipitation or inflow event?
In addition, more advanced and specific questions related to volume reduction may be supported
in whole or part by volumetric data contained in the BMP Database. In some cases, additional
data from outside of the BMP Database would be required to support these studies. Study
questions may include:
How do climatic patterns and seasonality influence the volume reduction performance of
a BMP or suite of BMPs?
How does a BMP or suite of BMPs impact the overall water balance of the system on a
long-term average basis? (i.e., How are deeper infiltration, evapotranspiration, and runoff
balances changed?)
How much runoff volume is reduced by a BMP or suite of BMPs under conditions
specified for regulatory purposes (e.g., a specific design storm)?
How do the design attributes of a BMP affect its volume reduction performance
compared to similar BMPs?
What model framework and parameters are appropriate to represent an individual BMP
or BMP type?
2 Concepts and volume analysis metrics provided in this section have been adapted from Chapter 9 of Urban
Stormwater BMP Performance Monitoring prepared by Geosyntec Consultants and Wright Water Engineers
(2009a), which can be downloaded for more detailed at http://www.bmpdatabase.org/MonitoringEval.htm. These
concepts are also presented in the International Stormwater BMP Database Project Technical Memorandum
―Drawing Appropriate Conclusions Regarding Volume Reduction in Practice- and Site-level Studies of Stormwater
BMPs‖ prepared by Geosyntec Consultants and Wright Water Engineers (2009b), which can be downloaded from
http://www.bmpdatabase.org/BMPPerformance.htm.

International Stormwater BMP Database
Pollutant Category Summary: Volume Reduction Page 5
January 2011
Fundamental metrics for evaluating volume reduction performance are provided in Exhibit 2.
The analysis methods and analyses presented in this technical summary are based on the
fundamental elements of one or more of these metrics. Practice-level studies refer to specific
BMPs with a defined inflow and outflow, while site-level studies refer to LID sites for which
there is not a defined inflow and the hydrologic performance of the entire site is of interest. The
BMP Database currently accepts site-level studies; however, at the time of publication of this
technical summary no site-level studies had been submitted.
Exhibit 2. Simple Metrics for Interpreting Single-Event Volumetric Data
Metric Application
Presence/Absence of Discharge Practice level and site level
Absolute Volume Reduction (Out – In) Practice level only
Relative Volume Reduction (Out – In)/In Practice level only
Discharge Volume per Area Practice level and site level
Discharge Volume per Impervious Area Practice level and site level
Source: Geosyntec and Wright Water Engineers, 2009a&b.
Practice-level: refers to studies that monitor inflow and outflow volumes at defined monitoring locations.
Site-level: refers to studies in which the entire site hydrologic performance is of interest; outflow is measured, but
inflow cannot be defined by a monitoring location.
1.4 Organization of Report
Volume reduction analysis is a complex undertaking, particularly as it relates to datasets for
studies conducted by many researchers under diverse circumstances and with regard to studies
conducted with varying study objectives. As a result, a substantial portion of this report
carefully outlines steps that must be taken to avoid misleading or erroneous conclusions when
conducting volume analysis, both in general and with regard to the BMP Database dataset. The
authors of this report have made extensive efforts to appropriately present and caveat
conclusions based on the dataset contained in the BMP Database. The general organization of
the remainder of this summary includes these sections:
Section 2 provides an inventory of volumetric data and a discussion of the reliability of
these data for use in volume reduction analysis.
Section 3 describes recommended methods of using the data from the BMP Database to
attempt to answer simple study questions.
Section 4 provides results of volume reduction analyses on a BMP categorical basis and
conclusions from these analyses.
Section 5 provides an introduction to more advanced analyses which may be useful for
answering the advanced study questions listed above.
Section 6 provides overall conclusions.

International Stormwater BMP Database
Pollutant Category Summary: Volume Reduction Page 6
January 2011
2 INVENTORY OF VOLUMETRIC DATA
The BMP Database contains a variety of data that are potentially useful for volume reduction
analysis. This section introduces the datasets potentially useful for volumetric analysis and their
location in the BMP Database. This section also discusses the reliability of these data for use in
volume reduction analysis. It is strongly cautioned that some studies in the BMP Database,
particularly earlier studies, did not include volume reduction as a study objective and may be less
reliable for volume reduction analysis than those which had volume reduction performance as an
explicit objective. In addition, flow monitoring data can be very difficult to accurately obtain
(Strecker et al., 2001).
2.1 Data Inventory
Data potentially useful for volume reduction analysis contained in the BMP Database include
storm event characteristics, watershed characteristics, event inflow, event outflow, event peak
flow, and various BMP design characteristics. Data are entered into the BMP Database and
stored as storm event totals (and in some cases study period totals). This timescale does not
support analyses of intra-event processes and performance; however, it supports most types of
volume reduction analysis. Exhibit 3 provides an inventory of the types of data contained in the
BMP Database that are potentially useful for volume reduction analysis, the location of these
data, and the approximate quantity and completeness of observations. Discussions of the
reliability of these data are contained in Section 2.2.
The BMP Database contains ―starter queries‖ to provide an initial basis for querying datasets that
can be used to evaluate the hydrologic performance of BMPs. Guidelines for developing queries
using the BMP Database can be downloaded from the project website (www.bmpdatabase.org).
2.2 Key Reliability Considerations
Several factors should be considered when using the volumetric data in the BMP Database for
runoff volume reduction analysis. Of primary importance, it must be recognized that many
studies contained in the BMP Database, particularly older studies, were conducted to evaluate
treatment performance (i.e., change in concentration between influent and effluent, or just
effluent concentration), and did not have volume reduction as an explicit goal. This consideration
has several ramifications that influence the reliability of volumetric and supporting data. In
addition, inherent limitations of monitoring study design and instrumentation should also be
considered. Key reliability considerations are discussed below.

International Stormwater BMP Database
Pollutant Category Summary: Volume Reduction Page 7
January 2011
Exhibit 3. Partial Directory of Volume Reduction and Related Data in BMP Database
Reported Data Data Type BMP Database Field ID
BMP Database
Table Name Inventory of Data (August 2010)
Paired Event
Inflow/Outflow
Volume
Number TOTVOLEFF FLOW Approximately 2,300 events with
paired inflow/outflow out of 3,500
events with either inflow or outflow. Monitoring Station Type
= ―Inflow‖ and ―Outflow‖
MONITORING
STATIONS
Event Peak Flow
(Inflow and
Outflow)
Number PEAKEFFFLOW FLOW ≈1,300 events with peak flow out of
2,300 events with paired
inflow/outflow
Reporting Start Date
(Start Date/Time)
Time/Date STARTDATE/
STARTTIME
FLOW Date: all events
Time: approximately half of events
Reporting End Date
(End Date/Time)
Time/Date ENDDATE/ ENDTIME FLOW Date: approximately half of events
Time: approximately half of events
Watershed Location Text CITY/ COUNTY/ STATE
various other data such as
elevation, lat-long, etc.
TESTSITE A01 All flow events have a watershed
location; 323 unique watersheds
recorded in Database
Watershed Area Number WA WATERSHED
NS01
Most studies have watershed area
(≈30 paired events without watershed
data out of ≈ 2,300 events with paired
inflow/outflow)
Watershed
Imperviousness
Number PERI WATERSHED
NS01
≈1,800 events reporting IA out of
2,300 paired flow events
Watershed Directly
Connected
Imperviousness
Area
Number PERIC WATERSHED
NS01
≈500 events reporting DCIA out of
2,300 events with paired
inflow/outflow
Most Common
NRCS Hydrologic
Soil Group
Select
A,B,C, or D
MCHG WATERSHED
NS01
≈70 watersheds with HSG out of 323
unique watersheds
Regional
Precipitation
Statistics
Number Multiple REGCLIME A03 Summary statistics provided for 136
regional climate stations
≈240/290 test sites have a regional
climate station assigned
Event Precipitation
Depth
Number TOTALDEPTH PRECIPITATION ≈1,800 events with precipitation
depth out of 2,300 events with paired
inflow/outflow
Precipitation Start
(Date/Time)
Time/Date STORMSTARTDATE
STORMSTARTTIME
PRECIPITATION Date: all precipitation events have
start date (≈6,100)
Time: approximately 75 percent of
precipitation events have start time.
Precipitation End
(Date/Time)
Time/Date STORMENDDATE
STORMENDTIME
PRECIPITATION Date: approximately 75 percent of
precipitation events have end date.
Time: approximately 75 percent of
precipitation events have end date.
Study Design
Schematic
Graphic BMPPLAN LAYOUTS
PHOTOS
Approximately two-thirds of
structural BMP studies have
schematics.

International Stormwater BMP Database
Pollutant Category Summary: Volume Reduction Page 8
January 2011
Studies may not have been designed or could not be designed to account for all inflow
pathways. Inflow pathways that may have been unaccounted include diffuse inflow (such as
area tributary directly to the BMP not via the inflow pipe), lateral inflow (such as along the
length of a swale), shallow interflow, groundwater seepage, and precipitation directly on the
BMP. For example, when monitoring vegetated swales, it is commonly only feasible to
measure concentrated inflow at the head of the swale; however, swales commonly receive
inflow along their entire length. As another example, many normally-wet BMPs potentially
receive substantial volumes of interflow and groundwater seepage during and between
monitoring events that are not reflected in inflow monitoring. These factors should be
considered in evaluating the reliability of reported inflow volumes for a variety of BMP
types.
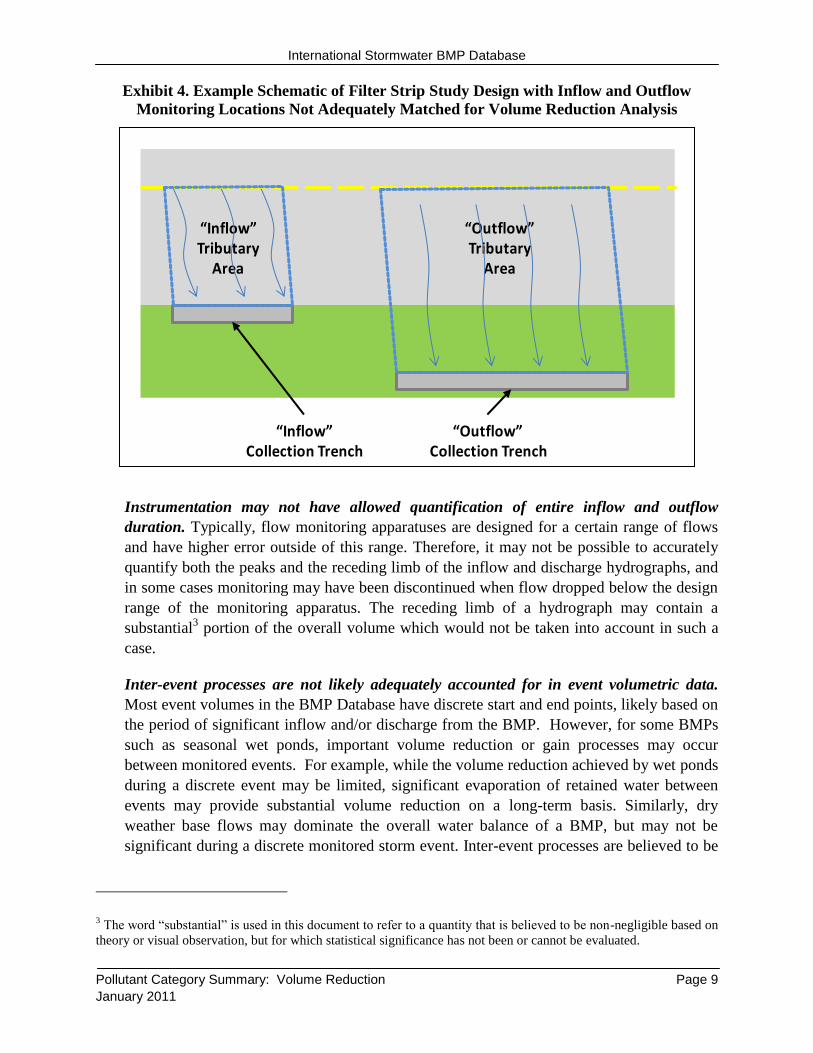
Reported inflow and outflow volumes are not intended to be matched because the inflow is
a reference station for water quality purposes only. In some studies where the inflow to a
BMP was diffuse and could not be monitored directly, a reference station was used to collect
water quality samples representative of the inflow concentration to the BMP. For example,
in the monitoring of filter strips, it is common practice to collect flow at the upstream edge
of one part of the filter strip to represent the influent concentration to the BMP while
collecting discharge from another portion of the filter strip to represent effluent
concentration from the BMP (see Exhibit 4). The tributary areas to these different points do
not necessarily need to be equal for assessment of water quality performance. However, for
a valid assessment of volumetric performance, tributary areas must be equal or must be
adequately defined by the investigator to allow scaling. In some cases, investigators
provided notes with datasets indicating that they were not appropriate for use in volumetric
analysis or providing dimensions; however, specifically for historic studies, this potential
use was not a primary intent and may not have been noted.
Monitoring protocol may not have attempted to measure the entire inflow and outflow
duration. For studies with treatment performance as the primary objective, flow monitoring
is used primarily to pace automatic sampling equipment and/or to volume-weight aliquots.
For studies that do not seek to quantify volume reduction, the need to monitor volume
theoretically expires after all sample jars are been filled. In historic monitoring studies that
did not have volume reduction as an explicit objective, it is possible and perhaps likely that
volume measurement was discontinued after water quality sampling had concluded, but
prior to the end of inflow and/or outflow. The ramifications of this potential source of error
are difficult to quantify, as cases theoretically exist in which sampling would have been
discontinued early for either the inflow or the outflow or both.
International Stormwater BMP Database
Pollutant Category Summary: Volume Reduction Page 9
January 2011
Exhibit 4. Example Schematic of Filter Strip Study Design with Inflow and Outflow
Monitoring Locations Not Adequately Matched for Volume Reduction Analysis
Instrumentation may not have allowed quantification of entire inflow and outflow
duration. Typically, flow monitoring apparatuses are designed for a certain range of flows
and have higher error outside of this range. Therefore, it may not be possible to accurately
quantify both the peaks and the receding limb of the inflow and discharge hydrographs, and
in some cases monitoring may have been discontinued when flow dropped below the design
range of the monitoring apparatus. The receding limb of a hydrograph may contain a
substantial3 portion of the overall volume which would not be taken into account in such a
case.
Inter-event processes are not likely adequately accounted for in event volumetric data.
Most event volumes in the BMP Database have discrete start and end points, likely based on
the period of significant inflow and/or discharge from the BMP. However, for some BMPs
such as seasonal wet ponds, important volume reduction or gain processes may occur
between monitored events. For example, while the volume reduction achieved by wet ponds
during a discrete event may be limited, significant evaporation of retained water between
events may provide substantial volume reduction on a long-term basis. Similarly, dry
weather base flows may dominate the overall water balance of a BMP, but may not be
significant during a discrete monitored storm event. Inter-event processes are believed to be
3 The word ―substantial‖ is used in this document to refer to a quantity that is believed to be non-negligible based on
theory or visual observation, but for which statistical significance has not been or cannot be evaluated.
“Outflow” Tributary
Area
“Inflow” Collection Trench
“Outflow” Collection Trench
“Inflow” Tributary
Area

International Stormwater BMP Database
Pollutant Category Summary: Volume Reduction Page 10
January 2011
most important for BMPs with large wet pools, including wet ponds, wetland basins, and
wetland channels.
Difficulties are inherent in monitoring flow from small urban watersheds. Runoff rates
from small, highly impervious drainage areas can be difficult to monitor due to short times
of concentration yielding ―flashy‖ hydrographs (i.e., flows rise and fall directly in response
to a rainfall). For these watersheds, the range of flows that needs to be measured accurately
is relatively large (Strecker et al., 2001). Rapidly changing flow conditions can cause
equipment with poor data density recording capabilities to miss brief periods of significant
flow as well as cause errors in flow measurement due to unsteady conditions or flows below
the minimum that can be measured. It is commonly easier to obtain flow data from the
outflow of a volume-based BMP as compared to inflow because of smoothing of event
peaks.
Uncertainty in flow measurement can influence reliability of findings, particularly where
expected volume changes are minor. Even a calibrated site with control structure may have
an error of plus or minus 20 percent due to combined considerations of equipment
sensitivity and multiple sources of potential error. Less sophisticated monitoring designs,
such as the use of Manning’s equation in a pipe to estimate flow could lead to even more
substantial errors. Consequently, it can be difficult to distinguish real changes in volume
from noise, particularly where expected volume reductions or gains are of a similar
magnitude to experiment error.
Monitoring designs do not commonly include all water balance components. While
comparison of inflow and outflow volumes can provide an assessment of total volume lost
or gained in the BMP, these values do not allow direct observation of the relative magnitude
of volume loss pathways (e.g., ET versus infiltration). Direct assessment of these pathways
is not possible without monitoring of percolation, evapotranspiration, and change in soil
moisture storage; however, such additional monitoring is not routinely conducted for many
studies.
These issues influence the reliability of volumetric data and should be considered whenever
drawing conclusions from this or any dataset. However, with appropriate consideration and
understanding of these factors, volumetric data can still be useful in supporting studies of BMP
effectiveness.
2.3 Recommendations for Improving Reliability of Volume Reduction Analyses
General recommendations for reviewing and screening volumetric data prior to analysis include
these practices:
Evaluate study objectives where available. The 2009 version of the BMP Database provides
a new field allowing the submitting investigator to document the primary intent of the study
and note limitations of the study. For example, the investigator may explicitly document that

International Stormwater BMP Database
Pollutant Category Summary: Volume Reduction Page 11
January 2011
volumetric data are not appropriate for volume reduction analysis. Studies that are annotated
as such should not be used for volume reduction analysis. (Note: Based on additional
review of underlying reports, this field has been completed for some historic BMP studies
by the BMP Database Project Team.)
Evaluate study design data where available. Graphics are available in the BMP Database
for many studies that depict the monitoring design. Where graphics are available and where
the scope of the analysis allows this depth of investigation, these graphics can help
determine whether the study volumetric data can be reliably used for volume reduction
analysis.
Conduct reasonableness checks on datasets. Reasonableness checks can help identify
studies that are very likely unreliable for volume reduction analysis but are not specifically
annotated as such. For example, studies with inflow and/or outflow volume much greater
than the volume of precipitation over the watershed likely contain discrepancies in entered
volume, precipitation depth and/or watershed area; mismatched periods of precipitation and
flow monitoring; and/or other factors. A suite of simple reasonableness checks is described
in Section 4.2.
In addition, some methods of analyses may be more robust against data quality issues than
others. For example, it is generally recommended to perform primary analysis within each study;
then normalize for comparison to other studies. Data tend to be more reliably compared within a
study rather than across studies. For example, errors in conversion of units, if present, would
likely apply across all data in a study, therefore would have less effect on a comparison within
the study, but would be problematic in comparisons across studies. Similarly, miscalibration or
lack of calibration of equipment would potentially affect all data collected within a study,
therefore could potentially ―balance out‖ if analyses are first performed within the study before
being compared to other studies.
3 RECOMMENDED USES OF VOLUMETRIC DATA AND LIMITATIONS OF USES
3.1 Theoretical Considerations
This section describes recommended uses and limitations of volumetric data contained in the
BMP Database for a variety of purposes. These recommendations are based on three theoretical
considerations:
Volume reduction is conceptually linked to design attributes. While water quality data
often show little or no dependency on BMP design attributes that are distinguishable from
the high variability associated with multiple environmental conditions, volume reduction is
conceptually more strongly correlated to design information. For example, a detention basin
with a 0.3 meter (1 foot) temporary storage sump (i.e., outlet located 0.3 meters above the
bottom elevation), may not show significantly different water quality treatment performance

International Stormwater BMP Database
Pollutant Category Summary: Volume Reduction Page 12
January 2011
than a detention basin with no sump; however, all else being equal, the former basin would
be expected to yield significantly higher volume reduction than the latter. A variety of other
factors such as underlying infiltration rate, average depth of BMP, amended soil thickness
and moisture retention potential, and unit design volume would be expected to influence
volume reduction in a somewhat predictable way.
Volume reduction is conceptually linked to storm characteristics. Similar to above, it is
often difficult to characterize the dependency of treatment performance on storm
characteristics; however, there are strong theoretical linkages between volume reduction
performance and storm depth. BMPs often have a certain amount of volume they can store
before discharging, whether in soil pores, micro-depressions, or designed surface volume
below the lowest design outlet. Conceptually, larger storms would be more likely to result
in discharge from BMPs, and all else equal, the fraction of the inflow volume lost would
tend to decline with increasing storm size. Additionally, where volume loss mechanisms are
based on a rate (e.g., the infiltration rate beneath a swale), then a longer duration, lower
intensity storm event may allow more water to infiltrate than a short, intense event of the
same overall depth. Volume reduction analyses should not ignore the expected nonlinearity
of performance with different storm characteristics.
Global screening may introduce bias. As discussed above, a variety of factors may be
responsible for error in volumetric data. In some cases, unreliable studies can be excluded
based on detailed inspection of individual studies. However, some studies cannot be
excluded based on purely evident objective factors. In addition, when attempting to conduct
a global analysis of data, it may not be feasible to evaluate every study individually;
therefore, it may be necessary to use objective screening rules. These rules may, in turn,
introduce bias by excluding some BMPs based on their observed performance. Results of
analysis relying on global screening should pay careful attention to possible biases
introduced by screening.
Finally, the BMP Database has limited numbers of studies for some BMP categories and
subcategories, constraining the types of analysis that can currently be supported.
3.2 Recommended Volumetric Analyses Supported by the BMP Database
With consideration of these factors, a suite of recommended analyses is provided in Exhibit 5.
The specific purposes and limitations of each analysis should be understood to avoid
inappropriate conclusions.
4 CATEGORICAL ANALYSIS OF VOLUMETRIC DATA
This section provides the results of the categorical analyses described in Exhibit 5 to the extent
supported by data available for the categories of BMPs in the BMP Database. While the intended
uses of categorical analysis results are relatively narrow, these results may be useful at the

International Stormwater BMP Database
Pollutant Category Summary: Volume Reduction Page 13
January 2011
planning level if limitations are carefully observed. In addition, the graphical results of these
analyses provide a visual inventory of data contained in the BMP Database.
The first steps of the categorical analyses included screening of data as introduced in Section 2.3
to improve the reliability of the dataset. The following subsections describe the screening
processes and associated assumptions, followed by the results of categorical analyses.
4.1 Primary Screening – Filtered Datasets Prior to Reasonableness Checks
Several criteria were applied to the volumetric datasets as part of a primary screening step.
1) Studies for which inflow and outflow events could not be adequately paired were
removed from the analysis dataset. At least three paired events were required for
inclusion of a study in the analysis. This threshold is subjective, and many factors should
be considered when determining whether a data set is adequately representative of the
range of storms that a BMP is designed to treat. In addition to number of storms, factors
such as seasonal distribution of storm events, storm size, storm duration, antecedent
conditions, and objectives of the data analysis should be considered. The authors
recognize that a three storm threshold is not ideal, but due to the already constrained
number of studies included in this analysis, a lower threshold was uses for purposes of
this broad-level analysis. When evaluating specific studies, studies with more storm
events will tend to yield more reliable conclusions that those with fewer numbers of
storms.
2) Studies and events explicitly annotated as not intended for volume reduction analysis
were removed from the analysis dataset. This screening factor primarily applied to newer
datasets for which the potential use in volumetric analysis was foreseen by the study
investigator and was advised against. This screening factor does not account for studies in
which the investigator may not have foreseen this potential use and did not express this
limitation.
3) Studies for which inflow was assumed by the investigator to equal outflow for the more
than two thirds of events were removed from the analysis dataset. In some cases, this
assumption was explicit. However, in most cases this assumption is reflected by entry of
identical values for inflow and outflow volume (to all significant figures). While the
observation of Inflow Volume ≈ Outflow Volume may be useful, it is considered to be a
narrative observation rather than a quantitative observation and is not considered to be an
appropriate generalization for inclusion with studies where inflows and outflows were
actually monitored.
Note that a combination of counterbalancing errors may cause an unreliable study to still pass
reasonableness checks; therefore, it is always recommended to perform a study-by-study
evaluation of reliability where the scope of the analysis allows, rather than relying on universal
screening rules. Nonetheless, these screening steps are relatively objective in nature and
generally make the resulting dataset more reliable for volume reduction analysis.

International Stormwater BMP Database
Pollutant Category Summary: Volume Reduction Page 14
January 2011
Exhibit 5. Recommended Volume Reduction Analyses
Analysis
Scale
Recommended
Analysis Description Intended Purpose(s) Limitations
Categorical;
all events
pooled
BMP categorical
analysis of inflow vs.
outflow
Total inflow and outflow volumes are
normalized to equivalent depth over the
watershed area and plotted on a scatter
plot.
Normalization eliminates influence of the
watershed area on the plot and presents
the data in units that are comparable to
precipitation depth to allow evaluation of
the influence of event depth on volume
reduction.
The inflow=outflow line is plotted as the
dividing line between events with volume
reduction and volume gain.
Qualitatively evaluate overall
trends and variability in
volume reduction by BMP
category.
Qualitatively evaluate trends
in volume reduction as
function of the magnitude of
the inflow event.
Inspect the results of
reasonableness screening.
Analysis results do not
distinguish between BMPs in
the same category with
significantly different design
attributes.
Data reliability issues
discussed elsewhere.
Potential bias as a result of
screening methods discussed
elsewhere.
BMP categorical
analysis of inflow vs.
outflow by inflow bin
Total inflow and outflow volumes are
tabulated at each normalized inflow
volume bin.
The average normalized inflow and
outflow at each bin is also reported.
The difference between inflow and
outflow at each bin represents the volume
reduction for that magnitude of event.
Evaluate the influence of
event magnitude on BMP
volume reduction
performance.
Limitation: Does not account
for differences that event
intensity/duration could have
on volume loss.
BMP categorical
analysis of
presence/absence of
discharge
Inflow and outflow events are counted
and binned by normalized inflow volume.
The percentage of events discharging at
each normalized inflow bin is calculated.
Evaluate ability of a BMP
category, in general, to reduce
the frequency of discharge
and estimate the typical
threshold of discharge from a
site.

International Stormwater BMP Database
Pollutant Category Summary: Volume Reduction Page 15
January 2011
Exhibit 5. Recommended Volume Reduction Analyses
Analysis
Scale
Recommended
Analysis Description Intended Purpose(s) Limitations
Categorical,
pooled by
study total
BMP categorical
analysis of relative
total volume
reduction observed
by study
Sum inflow and outflow volumes by
study and compute relative volume
reduction (Study Total Inflow Volume -
Study Total Outflow Volume)/(Study
Total Inflow Volume).
Pool study total relative volume reduction
estimates by BMP category and compute
summary statistics on study totals.
Evaluate range and central
tendency of relative volume
reduction within BMP
categories.
Provide planning level
estimate of ranges of long-
term average volume
reduction potential achievable
by category of BMP.
Analysis does not distinguish
between BMPs in the same
category with significantly
different design attributes.
Data reliability issues
discussed elsewhere.
Potential bias as a result of
screening methods discussed
elsewhere.
Study-based
specific
analyses
(All analyses
described
above may be
modified for
individual
studies where
data allow)
Correlation of design
attributes to relative
volume reduction
Compute relative volume reduction on
study-by-study basis.
Identify studies with numeric or narrative
design parameters.
Conduct correlation analysis and/or
population segregation statistical test to
identify correlations and/or determine
significance.
Develop relationships
between design parameters or
attributes and volume
reduction performance.
Support advancement of BMP
design criteria to improve
volume reduction.
Relative paucity of design
attributes and consistency
between studies may limit
the number of studies that
can be included in the
analysis at this time.
Study-based
parameterization of
mechanistic model
Use design parameters and study period
to parameterize a mechanistic hydrology
and hydraulics model to represent the
monitored system.
Use inflow and outflow data to calibrate
model.
Develop parameter estimates
for representation of
unmonitored BMPs.
Evaluate effect of design
modifications to improve
volume reduction and capture
efficiency.
Data in Database may not be
significant for full calibration
of multiple models.
Intra event flow data are not
contained, therefore
calibration would need to be
based on event performance.
May require obtaining
additional precipitation and
ET data for modeling.

International Stormwater BMP Database
Pollutant Category Summary: Volume Reduction Page 16
January 2011
4.2 Secondary Screening – Filtered Datasets with Reasonableness Checks
The data remaining after primary screening were subjected to a suite of simple reasonableness
checks intended to exclude studies that are clearly not valid for volume reduction analysis.
Reasonableness screening excluded observations based on the following characteristics4:
1) Inflow or outflow volume more than 120 percent of precipitation volume for greater than
or equal to 50 percent of events (entire study removed), or more than 150 percent of
precipitation volume for an individual event (individual event removed). Studies or
events triggering these criteria likely contain errors in reported watershed areas,
precipitation depths, and/or event volume and/or significant base flows that were not
reported. This check is believed to improve the reliability of the dataset.
2) Greater than 20 percent increase in volume for greater than or equal to 50 percent of
events in a study (entire study removed), or greater than 50 percent increase in volume
for an individual event (individual event removed). This is the only method used to
identify studies in which significant inflow pathways were not accounted for in
monitoring design, or in which monitoring duration biased results. This is an imperfect
screening method; although it is believed to improve the reliability of the dataset overall,
it also has the potential to introduce bias. This screening step may not adequately account
for the following conditions:
a. Studies in which significant inflow pathways are not accounted for in study
design, but volume reduction performance is high enough for the study to pass the
screening check. For example, a study in which approximately 20 percent of flow
is not accounted for at the inflow monitoring station but which achieves 20
percent removal of captured flow would be theoretically show a near-zero net
removal/gain based on reported data. Studies such as this would not be excluded;
however, their inclusion would result in estimates of volume reduction potentially
biased low.
b. Studies in which significant volume addition actually occurs in the BMP, such as
by groundwater inflow, truly resulting in increased discharge volumes. In this
case, a study may be excluded from analysis that accurately represents volume
gain. While volume gain in BMPs is not generally expected to be significant for
most BMP types, this screening method prevents a valid analysis of volume gain.
4 Note: the reasonableness check methodology described in this section was developed primarily with consideration
of normally-dry BMPs (e.g., swales, filter strips, bioretention, detention basins) which are not expected to receive a
significant amount of inflow volume via interflow and groundwater seepage, particularly when they are designed to
achieve volume reduction. Because normally-wet BMP (e.g., retention ponds, wetland basins/channels, composite
BMPs) commonly do receive inflow via interflow and groundwater seepage, it is not possible to distinguish between
real and erroneous volume gains via a categorical level screening. As such, the reasonableness screening
methodology has not been applied to normally-wet BMPs to avoid introduction of bias.

International Stormwater BMP Database
Pollutant Category Summary: Volume Reduction Page 17
January 2011
For BMP types in which significant volume gain is possible, this method may bias
estimates of volume reduction performance high. However, this can be discounted
with the assumption that use of the analyses results should be limited to BMPs
that are not expected to or have not been designed to have significant volume
addition.
c. Studies in which differences between inflow and outflow are primarily a function
of errors in measurement and/or reporting, such as mismatched durations of
monitoring or miscalibration or lack of calibration of equipment. In a global
sense, this criterion is expected to exclude some studies with artificial increase but
would not exclude studies with artificial volume decrease, as it is not possible to
distinguish artificial from real volume reduction based on this criterion. In this
sense, this criterion tends to bias volume reduction high.
Overall, these secondary screening criteria are expected to improve the reliability of the dataset
for volume reduction analysis; however, they are somewhat subjective may introduce a bias
which cannot be quantified.
4.3 Results of Categorical Analyses
Categorical analysis was conducted on events and studies passing primary and secondary
screening. Exhibit 6 provides an inventory of the data remaining for BMP categorical analysis
and the analysis conducted for each category. Based on this inventory, several BMP categories
were selected for further analysis, including BMP categories deemed to have sufficient quantities
of paired volumetric data.
While many manufactured device studies reported flow data, the majority of these studies report
identical inflow and outflow volumes to all reported significant figures. As such, the bulk of
manufactured device studies did not pass primary screening criteria #3 (see Section 4.1), and this
BMP category was not included in categorical analysis. Nonetheless, the observation that
reported outflow equals inflow for the majority of manufactured devices is important as it
indicates that these BMPs generally do not achieve volume reduction considered to be significant
by the study investigator(s).
The following sections present the results of BMP categorical analyses and discussions of these
results. Refer to Exhibit 5, above, for description of the analyses, intended uses, and limitations.

International Stormwater BMP Database
Pollutant Category Summary: Volume Reduction Page 18
January 2011
Exhibit 6. Inventory of Events/Studies Utilized for Analysis Dataset
Category Category Name
Count of
Events
Passing
Primary
Screening1
Count of
Events
Passing
Secondary
Screening2
Count of
Studies
Passing
Secondary
Screening3
Dataset Sufficient
for Categorical
Analysis?
BI Biofilter - Grass Strip 482 243 16 Yes
BR Bioretention (with
underdrains) 237 227 7 Yes
BR Bioretention (without
underdrains) 195 173 1 No
BS Biofilter - Grass Swale 113 84 13 Yes
CO Composite—Overall Site
BMP 23 NA
4 NA
4 No
DB Detention Basin (Dry) -
Surface Grass-Lined 170 112 11 Yes
DC
Detention Basin (Dry) -
Concrete or Lined
Tank/Basin
8 6 1 No
DU Detention - Underground
Vault, Tank or Pipe(s) 5 5 1 No
FL Filter - Combination of
Media or Layered Media 22 21 1 No
FO Filter - Other Media 64 64 2 No
FS Filter - Sand 30 5 1 No
MD Manufactured Device 15 15 2 No
OT Other--Uncategorized BMP 11 11 1 No
RP
Retention Pond (Wet) -
Surface Pond With a
Permanent Pool
414 NA4 NA
4 In vs. Out Only
4
RV Retention Underground
Vault or Pipes (Wet) 107 NA
4 NA
4 No
WB Wetland - Basin With Open
Water Surfaces 376 NA
4 NA
4
In vs. Out Only4,
combined with
WC5
WC Wetland - Channel With
Wetland Bottom 44 NA
4 NA
4
In vs. Out Only4,
combined with
WB5
1 – Count of events includes all events passing primary screening.
2 – Count of events includes all events passing primary screening and secondary screening.
3 – Includes all study locations passing primary and secondary screening; each study location contains multiple
events.
4 - BMP category is ―normally-wet‖ and therefore secondary (reasonableness) screening was not applied. A limited
suite of analyses has been conducted for these categories.
5 – Wetland channels and wetland basins combined for analysis based on similar unit processes for volume
reduction and relatively small number of data points for wetland channels.

International Stormwater BMP Database
Pollutant Category Summary: Volume Reduction Page 19
January 2011
4.3.1 All Events - Pooled by BMP Category
BMP Categorical Analysis of Inflow vs. Outflow
Exhibit 7 presents plots of inflow versus outflow normalized to the equivalent depth of the flow
volume over the watershed for all events, pooled by BMP category. Each point on these charts
represents the respective ratio of inflow and outflow volume for a single storm event. The
location of a point relative to the Outflow = Inflow line indicates whether the BMP lost or gained
volume during the event; points below the line indicate volume reduction, and points above the
line indicate volume gain. The distance of a point from the Outflow = Inflow indicates the
magnitude of the loss or gain, normalized by watershed area. Two sets of charts are provided for
each BMP category, with one showing the overall data set and the other ―zooming in‖ on a
subset of the data set with storms smaller than 2.5 watershed-cm. For Filter Strips, Swales,
Bioretention, and Dry Detention Basins, data points that were removed from the analysis dataset
as part of reasonableness screening are shown on this plot in light grey to provide a graphical
inventory of all data and the analysis dataset. For retention (wet) ponds and wetland
basins/channels, all data points are shown with the same symbology, as secondary
(reasonableness) screening was not conducted for these types of BMPs. Data which were
removed as part of primary screening prior to reasonableness checks are not shown in any plots.
This analysis supports the following general observations:
The scatter plots shown in Exhibit 7 provide a general assessment of the variability of
volumetric performance, general trends in performance, and an inventory of the data
passing and failing reasonableness checks.
All categories show substantial variability; which is a reflection of a variety of factors
including differences between BMPs, event characteristics, and antecedent conditions.
Filter strips, vegetated swales, and bioretention with underdrains exhibit relatively high
volume reductions, especially for smaller storm events. Bioretention appears especially
effective in preventing discharge during small events; the majority of inflow events less
than 1 watershed-cm in volume result in very low or zero outflow. (Note: Discharge via
underdrains is considered to be surface discharge in these studies.) Grass lined detention
basins appear to provide substantial volume reduction, specifically in smaller events.
General trends in retention (wet) ponds and wetland basins/channels do not show distinct
volume loss or gain on average, but many individual events are observed to deviate
widely in both directions from the 1:1 line, indicating variability in performance.
Reasonableness screening was most important for filter strips. For filter strips, the high
quantity of data not passing reasonableness checks suggests that some of the observed
variability or performance and overall trends in volume reduction may be influenced by
unquantified error. However, it appears that data not passing reasonableness checks are
relatively equally distributed below and above the 1:1 line.
Wetland basins and channels showed an increase in volume in a relatively large portion
of storm events, particularly at low inflow volumes. Although volume gains are possible
in wetland basins and channels, it is not possible to distinguish real volume gains from
unreliable data points; therefore, these data did not undergo reasonableness screening.

International Stormwater BMP Database
Pollutant Category Summary: Volume Reduction Page 20
January 2011
Exhibit 7a. Scatter Plot of Inflow and Outflow Volume
Note: data inventory (“n=##”) represents the “all events” scale range.

International Stormwater BMP Database
Pollutant Category Summary: Volume Reduction Page 21
January 2011
Exhibit 7b. Scatter Plot of Inflow and Outflow Volume
Note: data inventory (“n=##”) represents the “all events” scale range.

International Stormwater BMP Database
Pollutant Category Summary: Volume Reduction Page 22
January 2011
Exhibit 7c. Scatter Plot of Inflow and Outflow Volume
(Reasonableness Screening Not Conducted for Retention Ponds and Wetland Basins/Channels)
Note: data inventory (“n=##”) represents “all events” scale range.
International Stormwater BMP Database
Pollutant Category Summary: Volume Reduction Page 23
January 2011
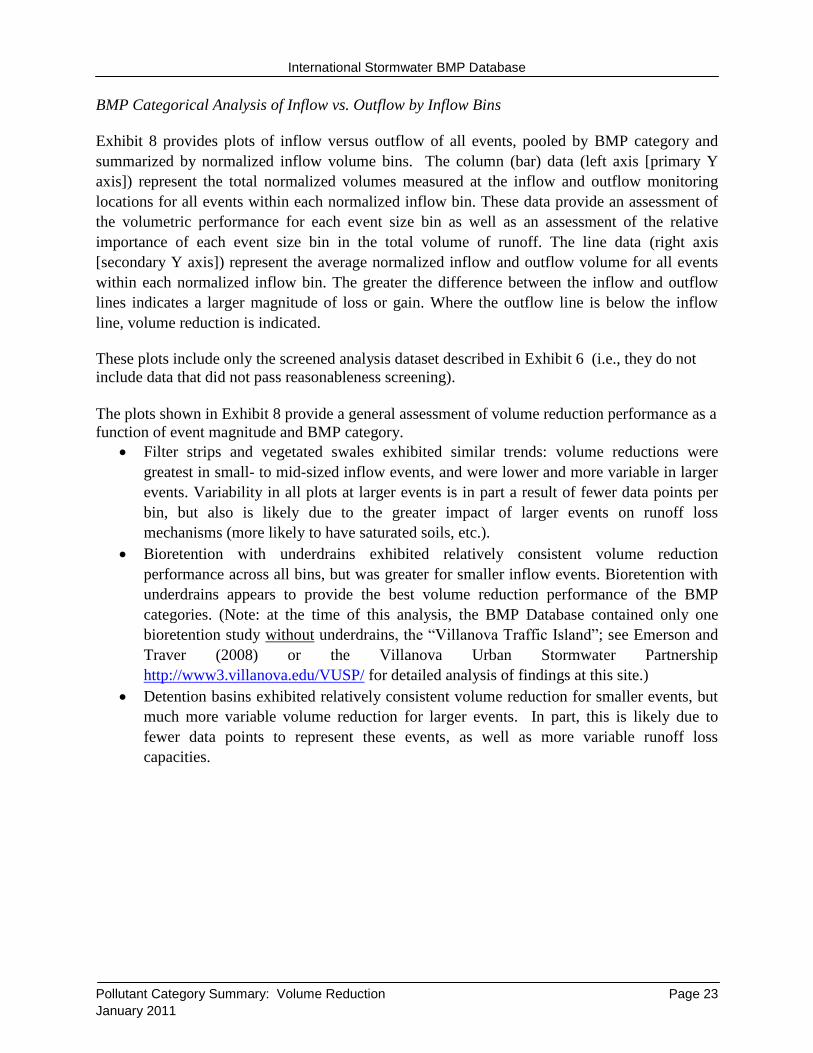
BMP Categorical Analysis of Inflow vs. Outflow by Inflow Bins
Exhibit 8 provides plots of inflow versus outflow of all events, pooled by BMP category and
summarized by normalized inflow volume bins. The column (bar) data (left axis [primary Y
axis]) represent the total normalized volumes measured at the inflow and outflow monitoring
locations for all events within each normalized inflow bin. These data provide an assessment of
the volumetric performance for each event size bin as well as an assessment of the relative
importance of each event size bin in the total volume of runoff. The line data (right axis
[secondary Y axis]) represent the average normalized inflow and outflow volume for all events
within each normalized inflow bin. The greater the difference between the inflow and outflow
lines indicates a larger magnitude of loss or gain. Where the outflow line is below the inflow
line, volume reduction is indicated.
These plots include only the screened analysis dataset described in Exhibit 6 (i.e., they do not
include data that did not pass reasonableness screening).
The plots shown in Exhibit 8 provide a general assessment of volume reduction performance as a
function of event magnitude and BMP category.
Filter strips and vegetated swales exhibited similar trends: volume reductions were
greatest in small- to mid-sized inflow events, and were lower and more variable in larger
events. Variability in all plots at larger events is in part a result of fewer data points per
bin, but also is likely due to the greater impact of larger events on runoff loss
mechanisms (more likely to have saturated soils, etc.).
Bioretention with underdrains exhibited relatively consistent volume reduction
performance across all bins, but was greater for smaller inflow events. Bioretention with
underdrains appears to provide the best volume reduction performance of the BMP
categories. (Note: at the time of this analysis, the BMP Database contained only one
bioretention study without underdrains, the ―Villanova Traffic Island‖; see Emerson and
Traver (2008) or the Villanova Urban Stormwater Partnership
http://www3.villanova.edu/VUSP/ for detailed analysis of findings at this site.)
Detention basins exhibited relatively consistent volume reduction for smaller events, but
much more variable volume reduction for larger events. In part, this is likely due to
fewer data points to represent these events, as well as more variable runoff loss
capacities.

International Stormwater BMP Database
Pollutant Category Summary: Volume Reduction Page 24
January 2011
Exhibit 8a. BMP Categorical Analysis of Inflow vs. Outflow by Event Magnitude
0
2
4
6
8
10
12
0
10
20
30
40
50
60
Ave
rage
Infl
ow
an
d O
utf
low
wit
hin
Bin
(w
ate
rsh
ed-c
m)
Tota
l In
flo
w a
nd
Ou
tflo
w W
ith
in B
in
(wat
ers
hed
-cm
)
Biofilter - Grass Strips
Sum of Inflow (watershed-cm) Sum of Outflow (watershed-cm)Average Inflow (watershed-cm) Average Outflow (watershed-cm)
0
1
2
3
4
5
6
7
0
2
4
6
8
10
12
14
Ave
rage
Infl
ow
an
d O
utf
low
wit
hin
Bin
(w
ate
rsh
ed-c
m)
Tota
l In
flo
w a
nd
Ou
tflo
w W
ith
in B
in
(w
ate
rsh
ed-c
m)
Biofilter - Grass Swales
Sum of Inflow (watershed-cm) Sum of Outflow (watershed-cm)Average Inflow (watershed-cm) Average Outflow (watershed-cm)

International Stormwater BMP Database
Pollutant Category Summary: Volume Reduction Page 25
January 2011
Exhibit 8b. BMP Categorical Analysis of Inflow vs. Outflow by Event Magnitude
0
5
10
15
0
10
20
30
40
50
60
Ave
rage
Infl
ow
an
d O
utf
low
wit
hin
Bin
(w
ate
rsh
ed-c
m)
Tota
l In
flo
w a
nd
Ou
tflo
w W
ith
in B
in
(wat
ers
hed
-cm
)
Bioretention (with underdrains)
Sum of Inflow (watershed-cm) Sum of Outflow (watershed-cm)Average Inflow (watershed-cm) Average Outflow (watershed-cm)
0
1
2
3
4
5
6
7
8
0
2
4
6
8
10
12
14
16
Ave
rage
Infl
ow
an
d O
utf
low
wit
hin
Bin
(w
ate
rsh
ed-c
m)
Tota
l In
flo
w a
nd
Ou
tflo
w W
ith
in B
in
(wat
ers
hed
-cm
)
Detention Basins - Surface, Grass Lined
Sum of Inflow (watershed-cm) Sum of Outflow (watershed-cm)Average Inflow (watershed-cm) Average Outflow (watershed-cm)

International Stormwater BMP Database
Pollutant Category Summary: Volume Reduction Page 26
January 2011
BMP Categorical Analysis of Presence/Absence of Discharge
Only the datasets for bioretention with underdrains consistently included events in which inflow
was greater than zero and outflow was explicitly reported as zero, therefore this is the only
category for which presence/absence of discharge could be evaluated. Exhibit 9 provides a plot
of presence versus absence of outflow discharge of all events, pooled by normalized inflow
volume bins. Column (bar) data (left axis [primary axis]) provides a count of the total number of
events with volume greater than zero at inflow and outflow locations, summed by normalized
inflow volume bins. The line data (right axis [secondary axis]) provides the percent of events
resulting in discharge for each normalized inflow volume bin. While other categories of BMPs
may reduce the frequency of discharge, the available data do not support this evaluation for
BMPs other than bioretention. A more advanced analysis could be conducted to evaluate the
frequency of discharge below a certain threshold percentage of inflow (e.g., percent of events
with discharge less than 10 percent of inflow volume), and results could be interpreted similarly
to the presence/absence analysis for a broader range of BMPs.
Exhibit 9. Presence/Absence of Discharge by Storm Magnitude – Bioretention
The results shown in Exhibit 9 are consistent with the expected performance based on typical
design characteristics of bioretention with underdrains. Smaller events resulted in discharge
much less frequently than larger events, and all events greater than 3 watershed-cm caused at
least some discharge.
0%
20%
40%
60%
80%
100%
0
20
40
60
80
100
Pe
rce
nta
ge o
f Ev
en
ts
Nu
mb
er
of
Eve
nts
Inflow Bin (watershed-cm)
Bioretention (with underdrains)
Inflow Events Discharge Events Percent of Events Discharging
International Stormwater BMP Database
Pollutant Category Summary: Volume Reduction Page 27
January 2011
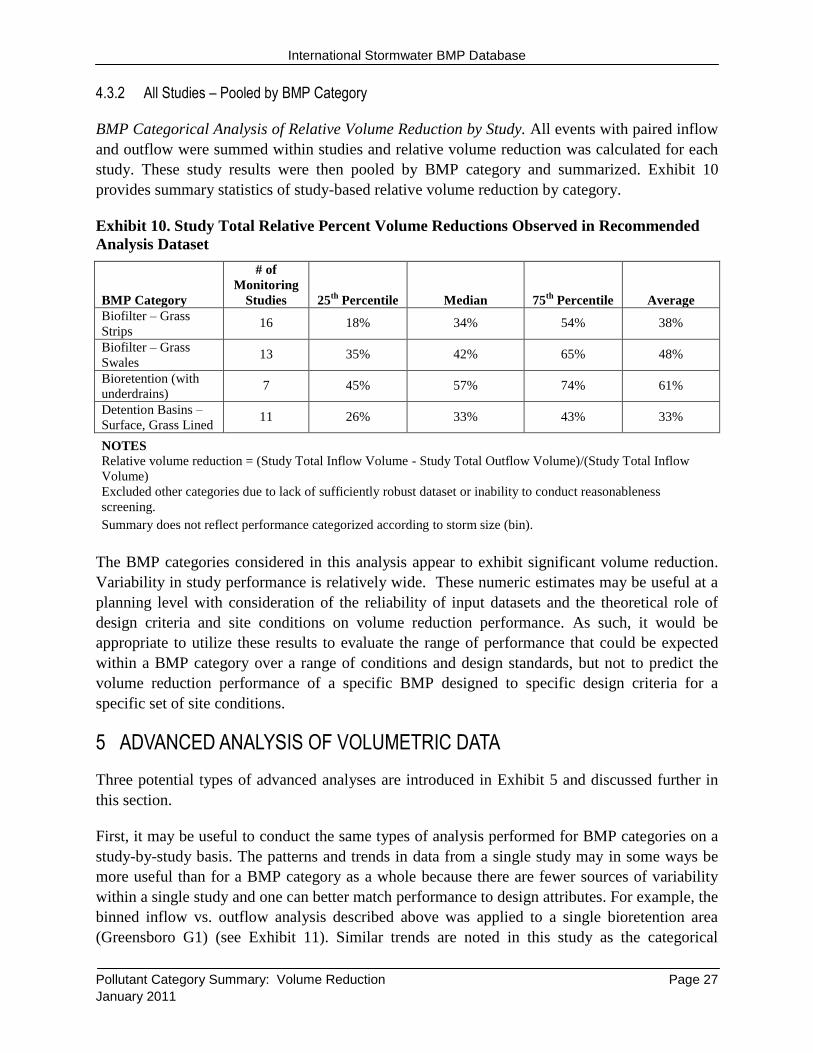
4.3.2 All Studies – Pooled by BMP Category
BMP Categorical Analysis of Relative Volume Reduction by Study. All events with paired inflow
and outflow were summed within studies and relative volume reduction was calculated for each
study. These study results were then pooled by BMP category and summarized. Exhibit 10
provides summary statistics of study-based relative volume reduction by category.
Exhibit 10. Study Total Relative Percent Volume Reductions Observed in Recommended
Analysis Dataset
BMP Category
# of
Monitoring
Studies 25th
Percentile Median 75th
Percentile Average
Biofilter – Grass
Strips 16 18% 34% 54% 38%
Biofilter – Grass
Swales 13 35% 42% 65% 48%
Bioretention (with
underdrains) 7 45% 57% 74% 61%
Detention Basins –
Surface, Grass Lined 11 26% 33% 43% 33%
NOTES
Relative volume reduction = (Study Total Inflow Volume - Study Total Outflow Volume)/(Study Total Inflow
Volume)
Excluded other categories due to lack of sufficiently robust dataset or inability to conduct reasonableness
screening.
Summary does not reflect performance categorized according to storm size (bin).
The BMP categories considered in this analysis appear to exhibit significant volume reduction.
Variability in study performance is relatively wide. These numeric estimates may be useful at a
planning level with consideration of the reliability of input datasets and the theoretical role of
design criteria and site conditions on volume reduction performance. As such, it would be
appropriate to utilize these results to evaluate the range of performance that could be expected
within a BMP category over a range of conditions and design standards, but not to predict the
volume reduction performance of a specific BMP designed to specific design criteria for a
specific set of site conditions.
5 ADVANCED ANALYSIS OF VOLUMETRIC DATA
Three potential types of advanced analyses are introduced in Exhibit 5 and discussed further in
this section.
First, it may be useful to conduct the same types of analysis performed for BMP categories on a
study-by-study basis. The patterns and trends in data from a single study may in some ways be
more useful than for a BMP category as a whole because there are fewer sources of variability
within a single study and one can better match performance to design attributes. For example, the
binned inflow vs. outflow analysis described above was applied to a single bioretention area
(Greensboro G1) (see Exhibit 11). Similar trends are noted in this study as the categorical

International Stormwater BMP Database
Pollutant Category Summary: Volume Reduction Page 28
January 2011
analysis presented in Exhibit 8, however data appear to be ―better behaved‖ and are perhaps
more explainable.
Exhibit 11. Study-level Analysis of Volume Reduction Performance by Event Magnitude
for Greensboro G1 Bioretention Cell (Study Source: Hunt et al. 2006)
Second, it may be useful to expand the scope of analysis to include design criteria and attributes
where available to develop relationships between design criteria and attributes and BMP
volumetric performance. For example, the same analysis conducted for the Greensboro G1
bioretention cell (Exhibit 11) was applied to the Hal Marshall bioretention cell (Exhibit 12).
Results show substantially less volume reduction and lower threshold of discharge in the Hal
Marshall cell than the Greensboro G1 cell. Further investigation into the differences between
these BMPs and other bioretention BMPs in the BMP Database should eventually help to refine
BMP design and selection criteria with regard to volumetric performance.
0
2
4
6
8
10
12
14
16
0
2
4
6
8
10
12
14
16
Ave
rage
Infl
ow
an
d O
utf
low
wit
hin
Bin
(w
ate
rsh
ed
-cm
)
Tota
l In
flo
w a
nd
Ou
tflo
w W
ith
in B
in
(wat
ers
he
d-c
m)
Inflow Volume Bin (watershed-cm)
Greensboro G1 Bioretention
Sum of Inflow (watershed-cm) Sum of Outflow (watershed-cm)Average Inflow (watershed-cm) Average Outflow (watershed-cm)

International Stormwater BMP Database
Pollutant Category Summary: Volume Reduction Page 29
January 2011
Exhibit 12. Study-level Analysis of Volume Reduction Performance by Event Magnitude
for Hal Marshall Bioretention Cell (Study Source: Hunt et al. 2008)
Finally, data contained in the BMP Database may be useful for parameterization and calibration
of mechanistic models to specific sites or multiple sites which would allow study findings to be
extrapolated to other sites or to different design criteria and configurations. For example, the
development and verification of soil moisture retention curves for several monitored bioretention
areas could potentially allow reliable use of these curves for facilities beyond those monitored.
6 CONCLUSIONS
6.1 General Conclusions
Over time, the objectives of BMP monitoring data have changed; specifically over the last
several years, greater emphasis has been placed on management of stormwater runoff volume.
In general, the volumetric data contained in the BMP Database reflect this trend. Older studies
for which volume reduction was not a study objective theoretically contain greater sources of
potential bias and error than newer studies. A greater portion of recent studies were conducted
specifically to quantify volume reduction along with water quality characteristics. For this
reason, volumetric analysis based on the BMP Database must be carefully conducted, and
limitations of the dataset should be understood. This technical summary has presented several
key considerations for reliability.
With appropriate consideration for reliability of the dataset and screening of data to remove
unreasonable studies, meaningful results can be obtained from volumetric analyses of the BMP
Database on a categorical basis. In addition, more focused volume reduction analysis of more
0
0.5
1
1.5
2
2.5
3
3.5
0
50,000
100,000
150,000
200,000
250,000
300,000
350,000
400,000
Ave
rage
Infl
ow
an
d O
utf
low
wit
hin
Bin
(w
ate
rsh
ed
-cm
)
Tota
l In
flo
w a
nd
Ou
tflo
w W
ith
in B
in (
L)
Inflow Volume Bin (watershed-cm)
Hal Marshal Bioretention Cell
Sum of Inflow (L) Sum of Outflow (L)
Average Inflow (watershed-cm) Average Outflow (watershed-cm)

International Stormwater BMP Database
Pollutant Category Summary: Volume Reduction Page 30
January 2011
recent studies can potentially allow more confident, although narrower, conclusions about
volume reduction performance.
Finally, analysis of the limitations of existing volumetric datasets provides fertile ground for
improving study design where volume reduction is a study objective. The Urban Stormwater
BMP Performance Monitoring Manual (Geosyntec Consultants and Wright Water Engineers,
2009a) provides updated guidance on monitoring of BMPs and LID sites, including significantly
enhanced guidance for monitoring volumetric performance.
6.2 Recommendations for BMP Selection
Based on the performance data available to date in the BMP Database, only general inferences
regarding BMP selection are appropriate at this time. General recommendations include:
Normally-dry vegetated BMPs (filter strips, vegetated swales, bioretention, and grass
lined detention basins) appear to have substantial potential for volume reduction on a
long-term basis, on the order of 30 percent for filter strips and grass-lined detention
Basins, 40 percent for grass swales, and greater than 50 percent for bioretention with
underdrains. Therefore, these BMPs can be an important part of an overall strategy to
manage site hydrology and control pollutant loading via volume reduction.
Normally-dry vegetated BMPs also tend to provide better volume reduction for smaller
storms, which tend to occur more frequently than larger storms; this can lead to reduced
frequency of discharges or much smaller discharge volumes. Both of these would tend to
reduce the frequency of water quality impairments. Developers of BMP design and
performance criteria may want to consider the role of BMP volume reduction in reducing
pollutant loadings when developing design requirements.
Retention ponds and wetland basins and channels do not appear to provide substantial
volume reduction on average and should not be selected to achieve volume reduction
objectives. In some cases, normally-wet BMPs can be designed to provide some
incidental volume reduction. Climate and other site-specific characteristics will also
affect incidental volume reduction. For example, evaporation will tend to be more
significant in arid areas.
Variability in volumetric performance between studies indicates that design attributes and
site conditions likely play keys role in performance. Therefore, when using categorical
analysis results to select BMPs to maximize volume reduction, it is important to also
ensure that design features to promote volume reduction are explicitly included in design
and the site characteristics are conducive to allow volume reduction. For example, where
facilities will likely be lined to prevent infiltration or soils are poor, volume reduction
would likely be lower on average than observed in the BMP Database studies.
Conversely, for sites with soils conducive to infiltration and design characteristics
provided to promote infiltration (e.g., storage volume below the lowest outlet, etc.),

International Stormwater BMP Database
Pollutant Category Summary: Volume Reduction Page 31
January 2011
volume reduction would likely be higher on average than observed in the BMP Database
studies.
7 REFERENCES5
Emerson, C.H. and Traver, R.G. (2008). ―Multiyear and Seasonal Variation of Infiltration from
Storm-Water Best Management Practices.‖ J. of Irrigation and Drainage Engineering.
134(5): 598-605.
Geosyntec Consultants and Wright Water Engineers (2009a). Urban Stormwater BMP
Performance Monitoring. October 2009. 355 pp. Prepared under Support from U.S.
Environmental Protection Agency, Water Environment Research Foundation, Federal
Highway Administration, Environmental and Water Resources Institute of the American
Society of Civil Engineers. www.bmpdatabase.org
Geosyntec Consultants and Wright Water Engineers (2009b). Memorandum: Drawing
Appropriate Conclusions Regarding Volume Reduction in Practice- and Site-level Studies of
Stormwater BMPs. December 11, 2009. 17 pp. Prepared under Support from U.S.
Environmental Protection Agency, Water Environment Research Foundation, Federal
Highway Administration, Environmental and Water Resources Institute of the American
Society of Civil Engineers. www.bmpdatabase.org
Hunt, W. F., Smith, J.T., Jadlocki, S.J., Hathaway, J.M., and Eubanks, P.R. (2008). ―Pollutant
Removal and Peak Flow Mitigation by a Bioretention Cell in Urban Charlotte, NC.‖ ASCE
Journal of Environmental Engineering, 134(5): 403-408.
Hunt, W. F.; Jarrett, A. R.; Smith, J. T., and L. J. Sharkey. (2006). Evaluating Bioretention
Hydrology and Nutrient Removal at Three Field Sites in North Carolina. Journal of
Irrigation and Drainage Engineering, 132(6): 600-608.
Strecker, E., Mayo, L., Quigley, M. and J. Howell. (2001). Guidance Manual for Monitoring
Highway Runoff Water Quality. FWHA Report No. FHWA-EP-01-021, 206 pp.
http://www.fhwa.dot.gov/environment/h2o_runoff/h2oroff.pdf
Strecker, E., Quigley, M., Urbonas, B. and J. Jones., 2004. Analyses of the Expanded
EPA/ASCE International BMP Database and Potential Implications for BMP Design, In
Proceedings of the World Water and Environmental Resources Congress, Salt Lake City,
Utah, American Society of Civil Engineers.
U.S. Environmental Protection Agency (EPA) (2009). Technical Guidance on Implementing the
Stormwater Runoff Requirements for Federal Projects under Section 438 of the Energy
Independence and Security Act. EPA 841-B-09-001. December 2009. 63 pp.
http://www.epa.gov/owow/NPS/lid/section438/pdf/final_sec438_eisa.pdf
5For additional references, see the Urban Stormwater BMP Performance Monitoring Manual (Geosyntec and WWE
2009a), particularly Chapter 9.