Embed Size (px)
Citation preview

# AA53606-02 October 2006 Page 1 of 73
Technical Report
United Solar Ovonic LLC 3800 Lapeer Road Auburn Hills, MI 48326 - USA Voice: 248-475-0100 Toll Free: 800-843-3892 Fax: 248-364-0510
United Solar Ovonic LLC 8920 Kenamar Drive, Suite 205 San Diego, CA 92121 - USA Voice: 858-530-8586 Toll Free: 800-397-2083 Fax: 858-530-8686
United Solar Ovonic Europe GmbH Trakehner Str. 7-9 D-60487 Frankfurt - Germany Phone: +49-69-7137667-0 Fax: +49-69-7137667-67
United Solar Ovonic Europe GmbH c/o Via Brigaladra 20 I-37020 San Floriano Verona - Italy Voice/Fax: +39-045-6838165

# AA53606-02 October 2006 Page 2 of 73
Table of Contents
Table of Contents 2
UNI-SOLAR® - Triple Junction Technology 4
Higher outdoor Performance 5
Quality and Reliability 5
Characteristic of UNI-SOLAR® Modules at low irradiation levels (Diffuse Light) 6
UNI-SOLAR® Modules: Influence of Module Temperature 7
Stability of UNI-SOLAR® Modules 8
Energy Yield of UNI-SOLAR® Modules 9 Module tests at TISO (Lugano, Switzerland) 9 Monitoring system at FhG-I.S.E. - Freiburg (Freiburg, Germany) 10 PV-System Glattwerk AG (Dübendorf, Switzerland) 11 PV-System E&S Sonnenstrom oHG (Überlingen/Bodensee, Germany) 12
Comparison of energy yields of UNI-SOLAR® Modules 13 PV-System Burg (Isle of Fehmarn) 13 PV-System Technology Center Delmenhorst 14 JuWi GmbH, “Mainz-Bretzenheim” 15
Further Discussion 16
Module Specifications 17
Product Limited Warranty 18
Product Limited Warranty 19
Quality Assurance Certification Letter 21
United Solar Triple Junction Solar Cells 22
Information on the term “Galvalume” and on the Types of Coatings Used On Galvalume Metal Roofing Systems 23
Galvalume Paint Definitions 26
Outdoor Testing and Monitoring of United Solar Ovonic PV Modules under Hot and Humid climate conditions in Florida 27
Flat Roof Performance in Switzerland (CPT Solar) 33
National Renewable Energy Laboratory (NREL) Report 42

# AA53606-02 October 2006 Page 3 of 73
Sandia National Laboratory Paper on Amorphous Silicon PV Modules 49
German Study by Fraunhofer 54
Hot Climate Performance in Thailand 66
Superior Energy Yields of UNI-SOLAR® Triple Junction Solar Products compared to Crystalline Solar Products under real outdoor conditions in Western Europe 69

# AA53606-02 October 2006 Page 4 of 73
UNI-SOLAR® - Triple Junction Technology Technology Each UNI-SOLAR® PV-module utilizes the unique Triple-Junction thin film silicon solar cells from United Solar Ovonic LLC. UNI-SOLAR® modules yield unprecedented performance. Each solar cell is composed of three semiconductor junctions stacked on top of each other, forming three different sub-cells. The bottom sub-cell absorbs the red light; the middle cell the yellow/green light and the top cell absorbs the blue light. This light spectrum splitting capability is the key to higher efficiency, especially at lower insolation levels and under diffuse light. UNI-SOLAR® solar cells are made in a roll-to-roll vacuum deposition process on a continuous roll of stainless steel sheet. The result is a unique, flexible and lightweight cell. The solar cells are arranged in a series string and encapsulated in UV stabilized and weather-resistant polymers to form PV Laminates. The polymer encapsulation includes at the front side EVA and the fluoro-polymer ETFE (e.g. TEFZEL® from DuPont).
Flexible UNI-SOLAR® PV-modules can be bonded to conventional metal roofing panels, single-ply membranes, and modified bitumen roofing materials or they can be fabricated into flexible roofing shingles (UNI-SOLAR® SHR-17). The resulting modules are exceptionally durable. By-pass diodes are connected across each cell, allowing the modules to produce power even when partially shaded or soiled. Each power module has a means of easily making the required electrical connections to create compatible system voltages. These interfaces include weather-tight, Quick Connect plugs, pre-connected to UV protected wires appropriate for all applications from simple single module requirements to high voltage grid-connected applications.

# AA53606-02 October 2006 Page 5 of 73
Higher outdoor Performance All solar modules are sold with their peak power performance (Wp) tested under laboratory conditions (STC conditions), i.e. under a very high and direct irradiation (1000 W/m²) of only one type of solar spectrum (AM 1.5) and under a module temperature of 25°C. In real outdoor conditions this peak power is seldom achieved, since module temperature usually is more in the range of 40-60°C when in the sun (this is especially true for modules that are building-integrated), since the occurrence of 1000 W/m² irradiation is only about 1% of total sun-hours and since the spectral content of the solar spectrum changes continuously with varying climatic conditions. Diffuse light is dominating when the sky is clouded or during mornings and evenings. In most areas of North America as well as Northern and Central Europe, the majority of solar irradiation comes from diffuse light (more than 50% of all solar irradiation) and even in the sunnier sections, the diffuse part is, on average, still 33%.
UNI-SOLAR® products perform better than all their crystalline-silicon and other thin film counterparts under non-ideal orientations and under real outdoors conditions (higher kWh energy output per Wp installed). This enhanced performance, up to 20% higher, can be attributed to the higher sensitivity for low light conditions and for diffuse light, better performance at high temperatures and improved shadow tolerance of UNI-SOLAR® products.
Outdoor testing has shown that UNI-SOLAR® PV products perform 40% better at low light conditions (40-100 W/m²) than all present crystalline technologies. In North American climates, where low light conditions and diffuse light prevail, this results in 8-20% higher yearly energy output per Wp of purchased power for UNI-SOLAR® products compared to all crystalline (and other thin film) technologies. In warm climates, e.g. southern US, performance and yearly energy harvest is also up to 20% higher, in this case due to the better temperature behavior of UNI-SOLAR® products.
Quality and Reliability
UNI-SOLAR® modules comply with following qualification tests (CEI/IEC61646-CEC701 Certificate), whereupon the following test procedures are conducted.
Thermal Cycling Humidity-Freeze Test Damp Heat Test UV-Test Wet Insulation Test Mechanical Load Test Hail Impact Test Robustness of Terminations Test
Framed power modules and SSR-modules further have the Safety Class-II certificate (TUV Rheinland)

# AA53606-02 October 2006 Page 6 of 73
Characteristic of UNI-SOLAR® Modules at low irradiation levels (Diffuse Light) Behavior of UNI-SOLAR® Modules under low irradiation levels (diffuse light)!
DC efficiency versus irradiation
3.5 kWp Triple Junction (UNI-SOLAR®)
0
2
4
6
8
10
0 200 400 600 800 1000
irradiation (W/m2)
DC
effi
cien
cy (%
)
Jun-98
jul-98-okt 99
Efficiency of UNI-SOLAR® modules increases significantly at very low irradiation levels!
Influence of irradiance on OUTDOOR efficiency
follow ing Dutch Irradiation conditions (ECN Studies : ECN-C-00-067; July)
0,0
0,2
0,4
0,6
0,8
1,0
1,2
1,4
0 200 400 600 800 1000 1200Irradiance (W/m²)
rela
tive
OU
TDO
OR
mod
ule
effic
ienc
y
BP SOLAR BP 585
Siemens SM-55
Kyocera KC-60
Siemens CIS S30
UNI-SOLAR US-32
Solarex Millenium MST-43
Shell Solar RSM 75
ASE ASE-100
STC
UNI-SOLAR
Efficiency of UNI-SOLAR® modules is increasing significantly at very low irradiation levels compared to crystalline technology!
# AA53606-02 October 2006 Page 7 of 73
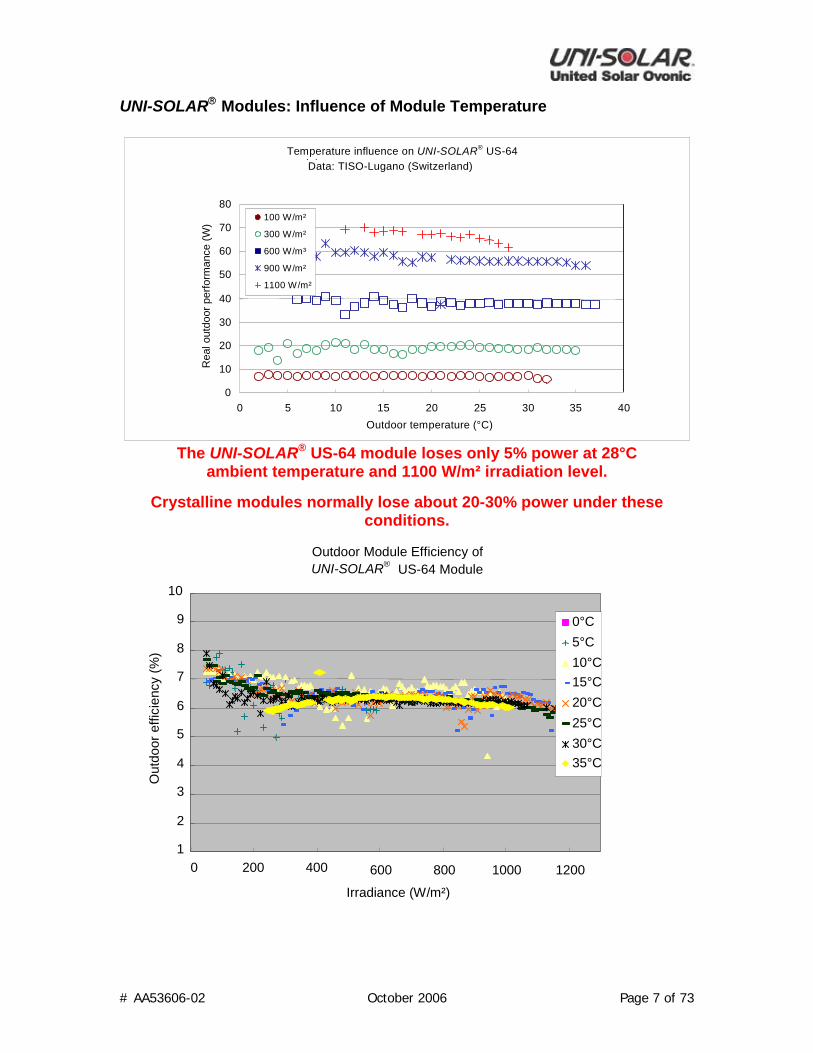
UNI-SOLAR® Modules: Influence of Module Temperature
Temperature influence on UNI-SOLAR® US-64 d lData: TISO-Lugano (Switzerland)
0
10
20
30
40
50
60
70
80
0 5 10 15 20 25 30 35 40 Outdoor temperature (°C)
Rea
l out
door
per
form
ance
(W) 100 W/m²
300 W/m² 600 W/m³ 900 W/m² 1100 W/m²
The UNI-SOLAR® US-64 module loses only 5% power at 28°C
ambient temperature and 1100 W/m² irradiation level.
Crystalline modules normally lose about 20-30% power under these conditions.
Outdoor Module Efficiency of UNI-SOLAR® US-64 Module
1
2
3
4
5
6
7
8
9
10
0 200 400 600 800 1000 1200
Irradiance (W/m²)
Out
door
effi
cien
cy (%
)
0°C 5°C 10°C 15°C 20°C 25°C 30°C 35°C

# AA53606-02 October 2006 Page 8 of 73
Stability of UNI-SOLAR® Modules
Long term outdoor tests of UNI-SOLAR® thin film modules were performed by different R&D Institutes (Forschungszentrum Jülich/Germany, ENRL/USA)
UNI-SOLAR®
‘Triple Junction’-Technology demonstrates a stabilized efficiency with annual cyclic variation at
an average degradation of merely .73% per year.
# AA53606-02 October 2006 Page 9 of 73
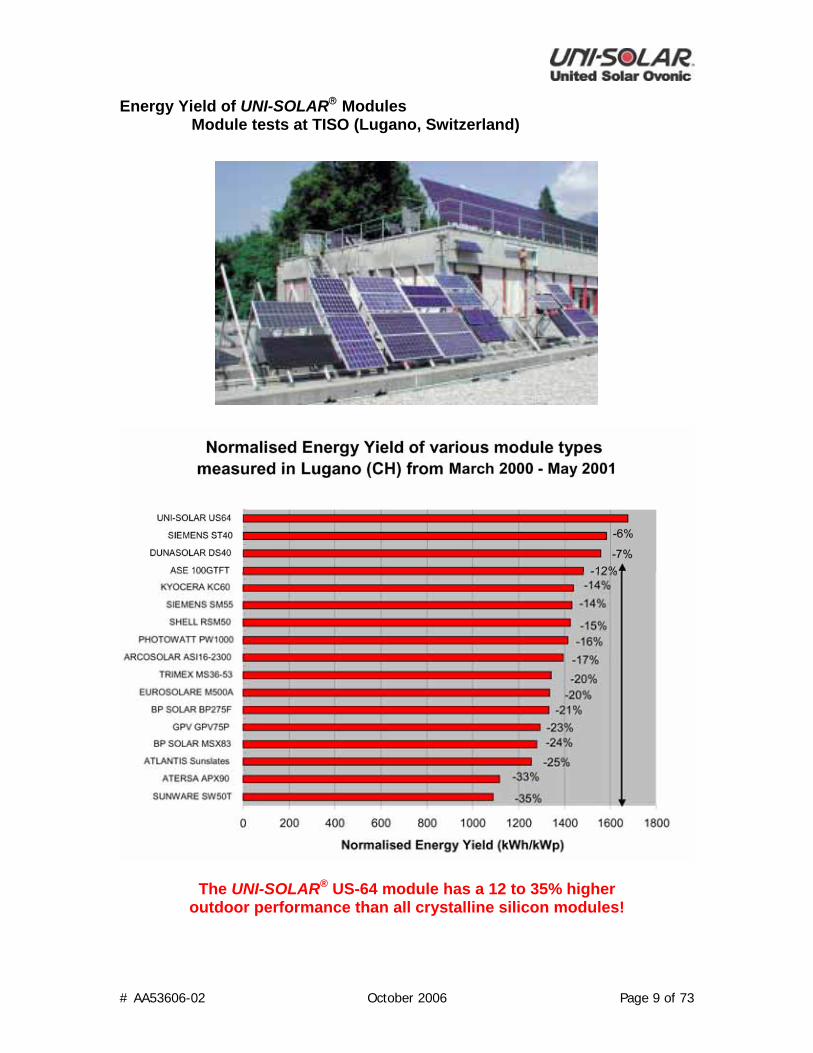
Energy Yield of UNI-SOLAR® Modules Module tests at TISO (Lugano, Switzerland)
The UNI-SOLAR® US-64 module has a 12 to 35% higher outdoor performance than all crystalline silicon modules!

# AA53606-02 October 2006 Page 10 of 73
Monitoring system at FhG-I.S.E. - Freiburg (Freiburg, Germany)

# AA53606-02 October 2006 Page 11 of 73
PV-System Glattwerk AG (Dübendorf, Switzerland)
Discussion: A respectable energy yield due to the not-ideal array-conditions (Shading!).

# AA53606-02 October 2006 Page 12 of 73
PV-System E&S Sonnenstrom oHG (Überlingen/Bodensee, Germany)
Modules: 48 UNI-SOLAR® US-64 DC-Power: 3,072 kWp Design: 12 Modules per string, 2 strings per inverter Inverter: SMA 100E. Dimensioning: PDC,max-WR/Pnom,PV-Module = 78.8 %.
Orientation: Inverters are highly under-dimensioned. 40° South-east, 30° Inclination
Installation: July 2001 Collection of Measurement data: Start August 2001 Remarks: Slightly shaded through a dormer and grid-cable.
Discussion: With respect to the under-dimensioned inverters and shading effects this PV-System generates a demanding energy yield!

# AA53606-02 October 2006 Page 13 of 73
Comparison of energy yields of UNI-SOLAR® Modules PV-System Burg (Isle of Fehmarn)
Modules: 32 UNI-SOLAR® US-64 DC-Power: 2,048 kWp Design: 2 strings with 16 Modules each Inverter: Fronius Sunrise Midi Dimensioning: PDC,max-WR/Pnom,PV-Module = 78,8 %. Orientation: Roof inclination 20° (South) Installation: July 16, 2001 Collection of Measurement data: January 2002 (after full stabilisation) Remarks: Inverters are highly under-dimensioned.
Table: Comparison of different module types/PV-systems in the North of Germany
Location: Module type: Inverter: kWp: Roof inclination:
Azimut: AC-Energy yield
(kWh/kWp): Burg UNI-SOLAR®
US-64 Fronius
Sunrise Midi 2,05 20° 0° 923
Heiligen-hafen
Photowatt (polik. Si)
SMA2500 3,0 45° 0° 830
Nendorf Isofoton (monok. Si)
SMA 2000+1500
4,0 45° 0° 861
Heiligen- hafen
GPV (polik. Si) n.n.
2,4 15° 0° 870
Heiligen-hafen
Siemens (monok. Si) n.n.
1,98 35° 8° 779
Meischen-dorf
Photowatt (polik. Si)
SMA 2000+2500
5,0 30° 10° 812
Sabnens-dorf
Photowatt (polik. Si)
4X SMA2500 10,2 15° 0° 788
Discussion: UNI-SOLAR® PV-System offer an approx. 12% higher energy yield than poly- and mono-cristalline modules*.
* Averaged AC-yield of polycristalline Si-Systems: 825 kWh/kWp. Averaged AC-yield of moncrystalline Si-Systems: 820 kWh/kWp.

# AA53606-02 October 2006 Page 14 of 73
PV-System Technology Center Delmenhorst Modules: AC-Power: Inverters: Orientation:
44 UNI-SOLAR® US-64 (SOLARA SM640 DS) 2,816 kWp SMA Sunny Boy 2000 South 5°, 25° Inclination
Installation: December 12, 2001 Collection of Measurement data: Start January 2002 Table: Energy yields of different PV-Systems TC Delmenhorst Position Type of module # Modules kWp AC-Energy yield (kWh/kWp) 1 TE12062 24 2.88 706.5 2 PW10001 24 2.4 694.0 3 TE12062 24 2.88 649.6 4 MST-434 55 2.75 795.6 5 US-643 44 2.816 845.5 6 TE12062 24 2.88 729.9 7 TE12062 24 2.88 688.2 8 PW10001 24 2.4 652.1 9 PW10001 24 2.4 685.0 10 E12062 24 2.88 698.5 11 PW10001 24 2.88 678.3 12 TE12062 24 2.88 692.9 13 PW10001 24 2.4 643.6 1Photowatt 2Total 3UNI-SOLAR 4BP Solarex Discussion: The energy yield of the UNI-SOLAR® PV-System is 21.8 % higher than the average* of the monocrystalline Total Energie PV-System, 26.1 % higher than the average* of the polycrystalline Photowatt PV-System and 6.3 % higher than the BP Solarex-PV-System. Average AC-yield all TOTAL systems: 694.3 kWh/kWp. Average AC-yield all Photowatt-systems: 670.6 kWh/kWp. * Average AC-yield all TOTAL ENERGIE-Systems: 694.3 kWh/kWp. Average AC-yield all Photowatt-Systems: 6701.6 kWh/kWp.
# AA53606-02 October 2006 Page 15 of 73
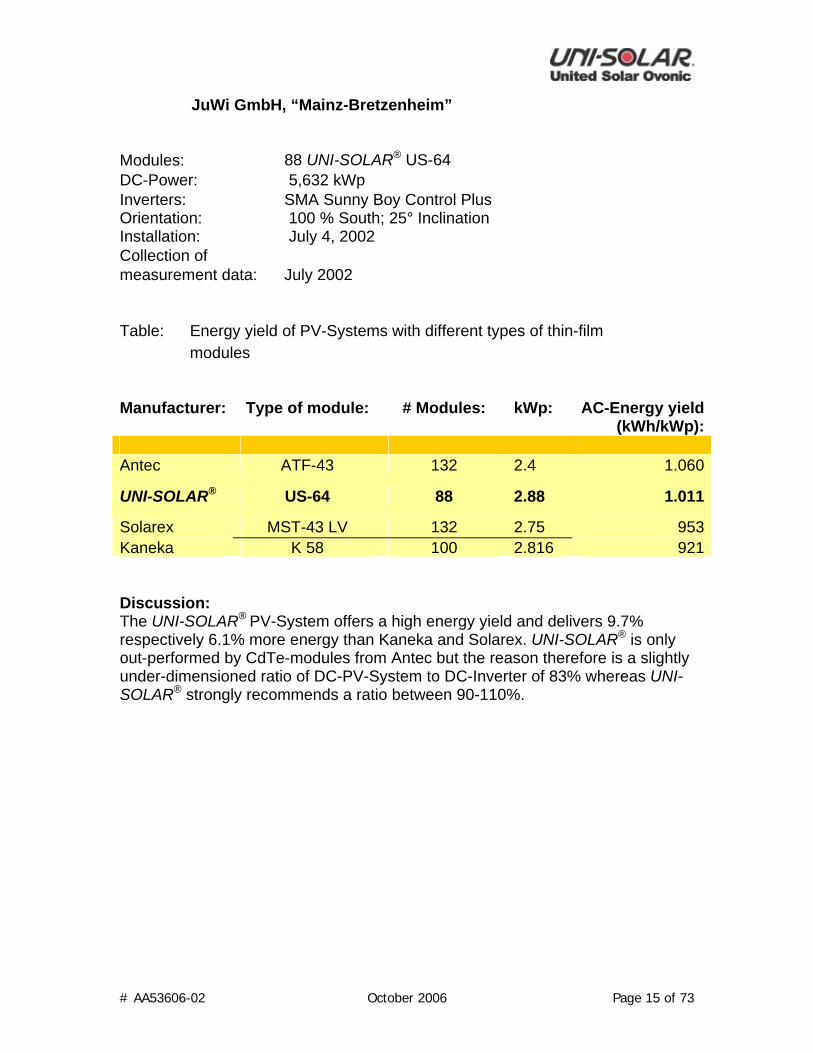
JuWi GmbH, “Mainz-Bretzenheim” Modules: 88 UNI-SOLAR® US-64 DC-Power: 5,632 kWp Inverters: SMA Sunny Boy Control Plus Orientation: 100 % South; 25° Inclination Installation: July 4, 2002 Collection of measurement data: July 2002 Table: Energy yield of PV-Systems with different types of thin-film modules Manufacturer: Type of module: # Modules: kWp: AC-Energy yield
(kWh/kWp): Antec ATF-43 132 2.4 1.060
UNI-SOLAR® US-64 88 2.88 1.011
Solarex MST-43 LV 132 2.75 953 Kaneka K 58 100 2.816 921 Discussion: The UNI-SOLAR® PV-System offers a high energy yield and delivers 9.7% respectively 6.1% more energy than Kaneka and Solarex. UNI-SOLAR® is only out-performed by CdTe-modules from Antec but the reason therefore is a slightly under-dimensioned ratio of DC-PV-System to DC-Inverter of 83% whereas UNI-SOLAR® strongly recommends a ratio between 90-110%.

# AA53606-02 October 2006 Page 16 of 73
Further Discussion In the following pages, we give further information about United Solar Ovonic (“UNI-SOLAR®”) products and systems. We describe our QA program and Certifications, module specifications, warranty, and types of metal pans that can be used in conjunction with our laminates. We have also included a number of articles and studies, from sources independent of United Solar Ovonic, describing specific installations and/or data from installations located around the world.

# AA53606-02 October 2006 Page 17 of 73
Module Specifications We have included our UNI-SOLAR® Module Specifications Sheet in this technical brief. This spreadsheet gives all the specifications for all of our modules. Besides all of the current and voltage specifications, measurements, fuse ratings and termination types, the spreadsheet includes our UNI-SOLAR® a-Si qualifier for power output seen in the first eight weeks after installation. It is interesting to note that a majority of the initial light-induced degradation (i.e. “light soaking”) of the modules will occur over the first few days of exposure of the module to the sun. You can expect that the module will become fully light soaked after 8 weeks. Another very interesting thing to note on the Module Specification spreadsheet is the temperature coefficients at the bottom of the page. The most important temperature coefficients will be the temperature coefficients for Power and Voltage at max power. Our temperature coefficient for Power is -0.21% per degree Celsius (cell operating temperature). This can be compared to the crystalline temperature coefficient for Power, which is -0.45 to -0.55 % per degree Celsius. To calculate power loss for a particular module at some site, you would need to know the temperature that the modules were rated at, the cell temperature on site and the temperature coefficient for the module you are testing. For example, if we had a UNI-SOLAR® module that had a cell operating temperature of 60 degrees Celsius, this would be 35 degrees above 25 degrees Celsius (UNI-SOLAR® modules are rated at 25C). We then multiply 35 and -0.21 and we arrive at -7.35. This is the percentage loss we can expect for a module with a cell operating temperature of 60 degrees Celsius. A US-64 operating at this temperature will put out 64 watts minus 7.35%, or ~59.3 watts. This number does not take into account array output losses due to dirt and dust on the modules (typically 2%) and wire loss (typically 3%). The same sort of calculation can be used for voltage (using the Vmp temperature coefficient) to determine if the array will stay within a certain DC voltage input window on an inverter under site conditions. We have also included our standard PV Product Limited Warranty.

# AA53606-02 October 2006 Page 18 of 73

# AA53606-02 October 2006 Page 19 of 73
Product Limited Warranty

# AA53606-02 October 2006 Page 20 of 73

# AA53606-02 October 2006 Page 21 of 73
Quality Assurance Certification Letter

# AA53606-02 October 2006 Page 22 of 73
United Solar Triple Junction Solar Cells

# AA53606-02 October 2006 Page 23 of 73
Information on the term “Galvalume” and on the Types of Coatings Used On Galvalume Metal Roofing Systems The following papers detail the process used to coat a steel pan to make it more resistant to corrosion. Another paper gives details on the types of “top coats” (i.e. paints and coatings) used in these metal roofing systems.

# AA53606-02 October 2006 Page 24 of 73

# AA53606-02 October 2006 Page 25 of 73

# AA53606-02 October 2006 Page 26 of 73
Galvalume Paint Definitions 4.2 Panel Materials
4.2.2 Galvalume is a specialty steel sheet product with a patented coating
of corrosion-resistant, aluminum-zinc alloy applied by a continuous hot dipping process. Galvalume steel panels shall have a minimum yield strength of 50,000 psi unless otherwise specified under Item 4.3.3. (b) & (c). Galvalume steel will conform to ASTM specification A-792, Grade 50, SS, Class 2 with coating weight AZ55 for bare Galvalume and AZ50 for painted Galvalume. Grade 80 may be used as specified under item 4.3.3.
4.2.3 Acrylic coated Galvalume (Also referred to as Galvalume Plus and
Acrylume) is a bare Galvalume sheet product with a thin, clear acrylic coating applied to both sides of the sheet. This panel conforms to ASTM specification A-792, grade 50. Acrylic coated Galvalume resists fingerprinting and smudging during handling and installation.
4.2.4 Standard Paint, color coated panels shall have the exterior side
finished with a silicone polyester coating system applied over GALVALUME or galvanized steel substrate. Surfaces shall be chemically cleaned, pretreated, primed, and coated, then oven-baked to cure. Top coating system shall have a dry film thickness of 0.70 to 0.80 mils. Specular Gloss at 60° viewing angle shall be 25 to 40. A wash coat of primer shall protect the interior side of these panels. Panels shall be coated prior to roll forming.
4.2.5 Premium Paint, color coated panels shall have the exterior side
finished with an extended life, fluoropolymer coating utilizing Kynar 500 Resin. This coating shall be applied over a GALVALUME or galvanized steel substrate. Surfaces shall be properly prepared and primed, then coated and oven-baked to cure. Top coating system shall have a dry film thickness of .75 -.90 mils on the exterior surface. Specular Gloss at 60° viewing angle shall be 35± 5%. The interior side of these panels shall be protected by a back coat system of .60 ± .05 mils thickness. Panels shall be coated prior to roll forming.

# AA53606-02 October 2006 Page 27 of 73
Outdoor Testing and Monitoring of United Solar Ovonic PV Modules under Hot and Humid climate conditions in Florida The following report was prepared by the Florida Solar Energy Center. The report has been summarized by United Solar Ovonic. The report details the three year testing program, testing methods and how data is being gathered. Although there was a small problem with the first resister that was used in the data acquisition equipment, this was noticed early on and changed by the FSEC engineers. Solar modules degrade in performance when exposed to high temperatures and high humidity can affect the performance of poorly constructed solar modules. However, test modules from United Solar Ovonic PV modules are showing no signs of physical degradation under these conditions. Additionally, a regression analysis and a complementary study of current-voltage characteristics demonstrate that the United Solar Ovonic module’s photovoltaic performance has been stable over the last two years of testing at the FSEC outdoor test site.

# AA53606-02 October 2006 Page 28 of 73
Florida Solar Energy Center Report
Outdoor Monitoring and High Voltage Bias Testing of Thin Film Photovoltaic Modules
Contract Report
Outdoor Monitoring and High Voltage Bias Testing of Thin-Film
Photovoltaic ModulesSummary of United Solar Ovonic (UNI-SOLAR®) Company
Report*
FSEC-CR-XXXX
May 31, 2006
Prepared for
United Solar Ovonic
Submitted by
Neelkanth G. Dhere Florida Solar Energy Center
1679 Clearlake Road Cocoa, FL 32922.
*Summary prepared by United Solar Ovonic

# AA53606-02 October 2006 Page 29 of 73
Outdoor Monitoring and High Voltage Bias Testing of Thin-Film Photovoltaic Modules United Solar Ovonic Company Report
June 1, 2006. 1) Introduction
The Outdoor monitoring and High Voltage Bias Testing of Thin Film Photovoltaic Modules has been undertaken through the project funded by NREL for a period of three years. This work consists of the study of outdoor testing and monitoring of Photovoltaic thin film modules fabricated by UNI-SOLAR® (a-Si on flexible substrate) in hot and humid climate of Florida. The study consists of 40 modules of UNI-SOLAR® which are divided in two sets of twenty modules each.
Two rows of 120 feet in length were constructed on a sturdy concrete
base structure for the installation of the thin film PV module reliability projects. The rows are aligned in East-West direction; the distance between the two rows where the modules are installed is 9 feet. The design is safe from any shadowing effect. 2) UNI-SOLAR Module Installation
The UNI-SOLAR® Modules were installed as shown in Fig 2. Prior to installation these modules were visually inspected and photographed. Module Specifications (US-32): Max Power: 32W Current Maximum Power: 1.94A Voltage Maximum Power: 16.5V Open Circuit Voltage: 23.8V Short Circuit Current: 2.40A
Fig. 2: Installed array of UNI-SOLAR® Modules

# AA53606-02 October 2006 Page 30 of 73
For the current setup twenty modules were connected in series to reach the maximum total Voc of 476 V. In each row, the modules were installed in 3 columns with maximum 7 in each column.
Each array current-voltage output, solar irradiance, along with ambient parameters such as back of the module temperature at two locations, wind speed, relative humidity and UV index are being monitored on daily basis. Data collection began on November 14, 2003. A Campbell Scientific CR10X data logger is used for recording the data from the PV module array and various sensors. Two pyranometers are directly connected to the data logger to read the irradiance values.
Visual Inspection and cleaning of the arrays is carried out regularly.
Current-Voltage Characteristics (i-V) measurement for the arrays is carried out once in every three months. The modules are been visually inspected regularly and the IR images are also being taken.
Fig. 7: IR image UNI-SOLAR Module + 600V
Performance degradation of test modules can be detected with the help of PTC regressions. The PTC power values for each month of the year are then plotted to find out the degradation rate of each module array over time. An in-house Lab view program was developed similar to that used by NREL, for regression analysis.
Regression Analysis for the Module Arrays
Using the LABVIEW software developed in-house, Performance Test Conditions (PTC) power values for each month were calculated for positive and negative arrays. The calculated values for a set of months were then plotted in order to understand the degradation in the performance of the modules.
# AA53606-02 October 2006 Page 31 of 73
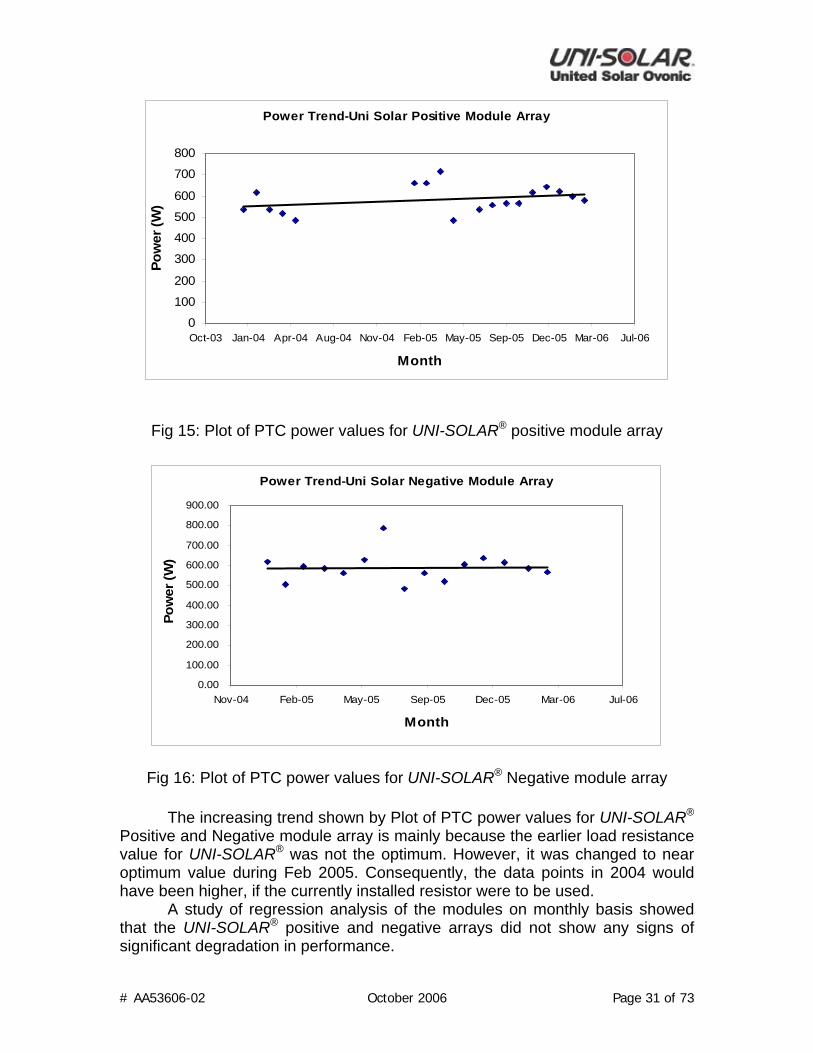
Fig 15: Plot of PTC power values for UNI-SOLAR® positive module array
Fig 16: Plot of PTC power values for UNI-SOLAR® Negative module array
The increasing trend shown by Plot of PTC power values for UNI-SOLAR®
Positive and Negative module array is mainly because the earlier load resistance value for UNI-SOLAR® was not the optimum. However, it was changed to near optimum value during Feb 2005. Consequently, the data points in 2004 would have been higher, if the currently installed resistor were to be used.
A study of regression analysis of the modules on monthly basis showed that the UNI-SOLAR® positive and negative arrays did not show any signs of significant degradation in performance.
Power Trend-Uni Solar Positive Module Array
0
100
200
300
400
500
600
700
800
Oct-03 Jan-04 Apr-04 Aug-04 Nov-04 Feb-05 May-05 Sep-05 Dec-05 Mar-06 Jul-06
Month
Pow
er (W
)
Power Trend-Uni Solar Negative Module Array
0.00
100.00
200.00
300.00
400.00
500.00
600.00
700.00
800.00
900.00
Nov-04 Feb-05 May-05 Sep-05 Dec-05 Mar-06 Jul-06
Month
Pow
er (W
)

# AA53606-02 October 2006 Page 32 of 73
I-V characteristics from PV arrays: A complementary study of current-voltage characteristics is carried out for
comparison with the outdoor data monitoring of the voltage and current of the module arrays. Current voltage (I-V) characteristics of the module arrays taken on quarterly basis, provides important I-V characteristics such as peak power, open circuit voltage, fill factor, etc. The data obtained is used to plot bar charts. Only peak power values are normalized at 1000 W/m2, 25 deg. C. This is done by calculating the power values at 1000 W/ m2 and then multiplying them with the known values of module temperature coefficient. Current-Voltage Characteristics (I-V) of the module arrays taken on quarterly basis, serve as a supplement to the information obtained through continuous data monitoring.
Variation Of Peak Power with Time
580
590
600
610
620
630
Feb-05 Jul-05 Dec-05 May-06
Time (Quarter)
Peak
Pow
er P
pk @
100
0 W
/m2,
25
Deg
C
US_PUS_N
Graph 1: Variation of peak power with time for UNI-SOLAR® module array
From the Peak power values plotted herein no signs of module degradation can be seen as such. The only reason for such a variation in the plotted values is due to different seasons and these values correspond to I-V characteristics taken on one particular day in that quarter. These values plotted have been normalized for 1000W/m2 at 25°C. Discussions and Conclusions: By the time the UNI-SOLAR® thin-film a-Si:H modules arrived at FSEC, most probably they had undergone Staebler-Wronski degradation, if any. Regression analysis should be complemented by current voltage characteristics, to study the performance of PV arrays. One should also take into consideration the graphs of Peak Power, Open Circuit Voltage, Fill Factor with time obtained from I-V characteristics while making conclusion about degradation. These graphs show variation from season to season because the Uni-Solar modules are amorphous silicon and amorphous silicon gets annealed during summer and hence, efficiency goes up.
Overall, the photovoltaic performance of UNI-SOLAR® thin-film a-Si:H modules array has been stable over the last two years of the testing at the FSEC outdoor test site.

# AA53606-02 October 2006 Page 33 of 73
Flat Roof Performance in Switzerland (CPT Solar) In this report, a PV system that utilizes the UNI-SOLAR® PV modules directly bonded to TPO roofing membrane is studied. The study shows the performance of our modules under high temperature conditions because the roof is insulated and this results in the modules reaching higher than normal NOCT numbers. Interesting conclusions include higher-than-expected output from the solar array (compared to calculated numbers) and the horizontally-mounted UNI-SOLAR®
array is putting out an equivalent amount of energy compared to a latitude-tilted crystalline array of the same wattage. There are also very good numbers supporting how amorphous silicon solar modules actually increase in efficiency as radiation levels decrease (good news for morning production from the solar array). This report also finds that the temperature coefficient for Power (at max power) is -0.26%/C which corresponds to UNI-SOLAR® factory-based temperature coefficient for Power (at max power) of -0.21%/C. Additionally, the temperature coefficient for Voltage determined during the study (-0.38%/C) corresponds with UNI-SOLAR’s factory-based temperature coefficient for Voltage of -0.31%/C.

# AA53606-02 October 2006 Page 34 of 73

# AA53606-02 October 2006 Page 35 of 73

# AA53606-02 October 2006 Page 36 of 73

# AA53606-02 October 2006 Page 37 of 73

# AA53606-02 October 2006 Page 38 of 73
# AA53606-02 October 2006 Page 39 of 73

# AA53606-02 October 2006 Page 40 of 73

# AA53606-02 October 2006 Page 41 of 73

# AA53606-02 October 2006 Page 42 of 73
National Renewable Energy Laboratory (NREL) Report The National Renewable Energy Laboratory has been monitoring the performance of a 1 kilowatt UNI-SOLAR® PV system over the course of a 6-year period from October 1998 to September 2004. The data indicates that the system has exhibited stable performance over time with an overall degradation rate comparable to that found in crystalline silicon systems (~1%/year). This is important because thin film products have had a reputation for being less stable over time compared to crystalline products. This report shows that this problem is no longer a problem with amorphous silicon products. Since amorphous silicon modules can consistently outperform crystalline modules with respect to performance ratio, the last, best argument against thin film products is their relatively larger footprint when compared to crystalline products. Larger footprint can be a disadvantage in rack mounted systems. This disadvantage is one of the main drivers behind the push towards the development of building integrated products amongst the thin film manufacturers. If overall installation costs can be reduced through building integration of thin-film PV products, it makes it all the more difficult to economically justify the installation of rack-mounted crystalline products. Thermal annealing / degradation and the difference in wintertime spectra is also mentioned in this article. We conservatively estimate that thermal annealing will account for ~4% increase in performance during warm months. It takes approximately 8 weeks for the module to lose its 4% increase over annual average output. If the ambient temperatures remain cold, the module will continue to show temperature-induced degradation until the module is performing approximately 4% below its annual average power output. Temperature-induced degradation increases recombination in the cell and this will result in lower power output. Another ~1-2% power loss will be seen due to the different light spectra seen on sunny days in the winter. When looking at seasonal fluctuation in power output, it is interesting to note that the annual fluctuation in power for amorphous material is ~10% while the annual fluctuation in power for crystalline products is 20% on average.

# AA53606-02 October 2006 Page 43 of 73

# AA53606-02 October 2006 Page 44 of 73

# AA53606-02 October 2006 Page 45 of 73

# AA53606-02 October 2006 Page 46 of 73

# AA53606-02 October 2006 Page 47 of 73

# AA53606-02 October 2006 Page 48 of 73
# AA53606-02 October 2006 Page 49 of 73
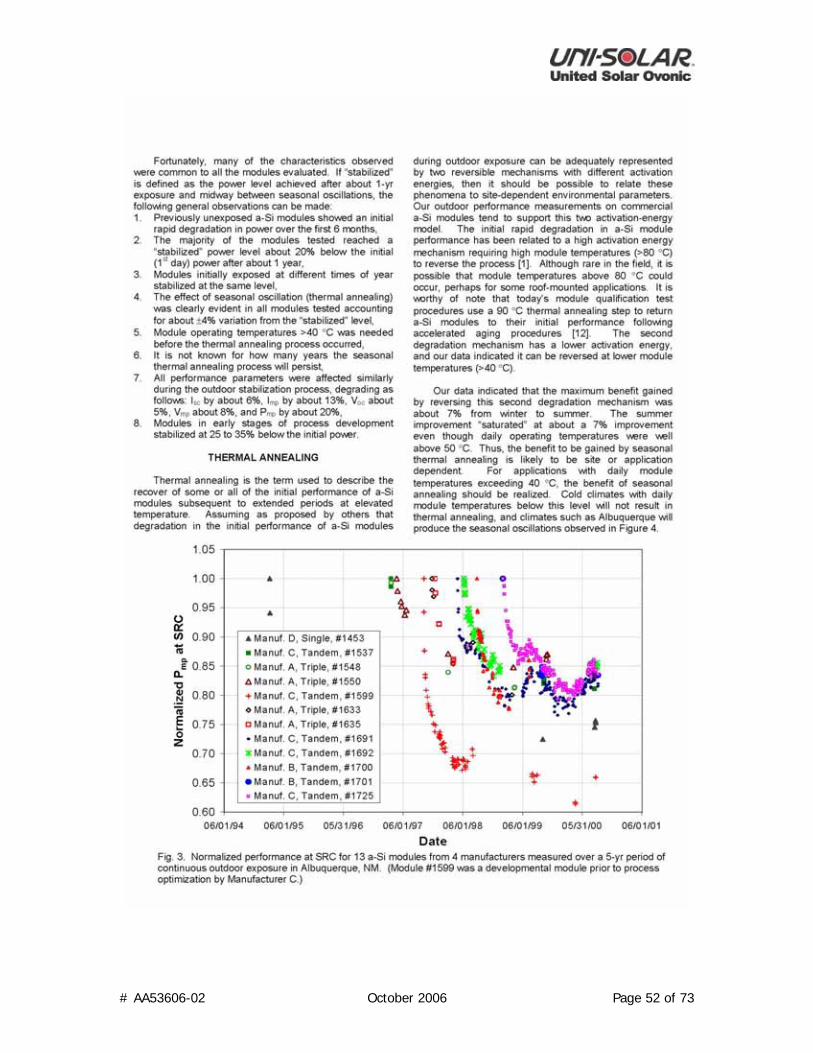
Sandia National Laboratory Paper on Amorphous Silicon PV Modules This article is very technical but it gives the reader an excellent overview on unique characteristics of amorphous silicon solar cells and modules. The article explains how amorphous silicon modules stabilize and what affects thermal annealing and temperature has on these materials. Additionally, there is a discussion on the influence of changing spectral content (sunlight) has on the performance of amorphous silicon modules (both tandem and triple junction materials). This is a long term study and a more comprehensive report is being prepared.

# AA53606-02 October 2006 Page 50 of 73

# AA53606-02 October 2006 Page 51 of 73
# AA53606-02 October 2006 Page 52 of 73

# AA53606-02 October 2006 Page 53 of 73
# AA53606-02 October 2006 Page 54 of 73
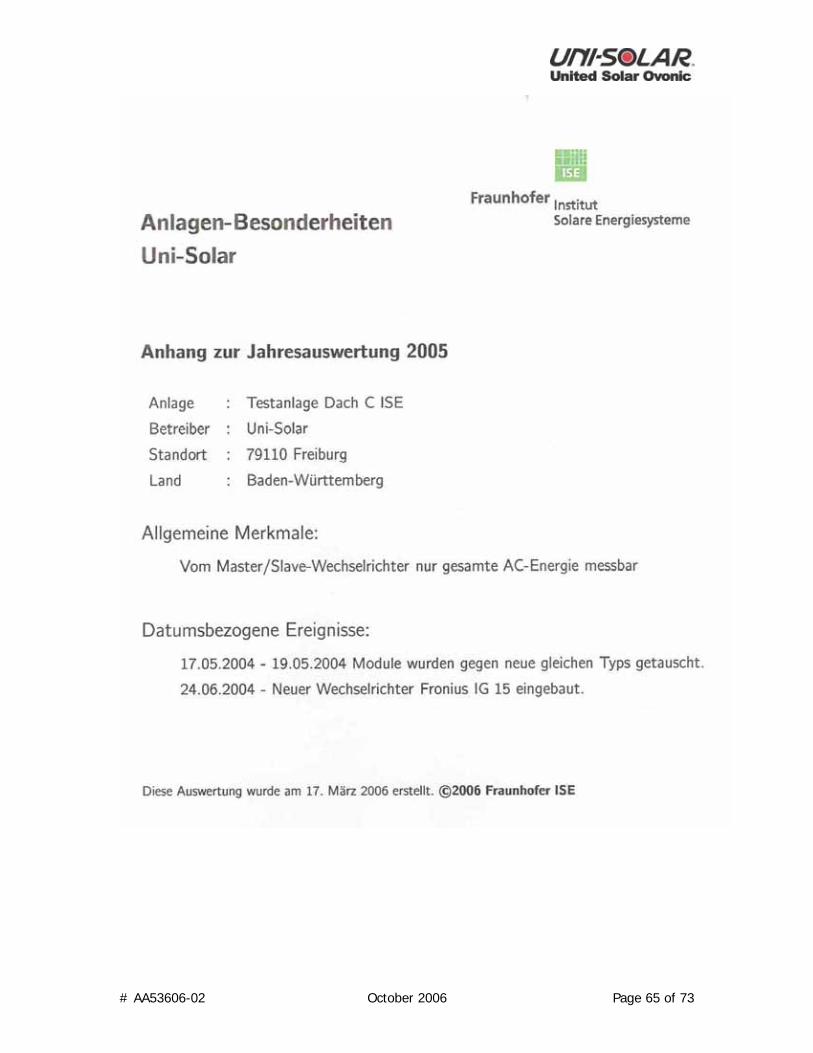
German Study by Fraunhofer In Germany, an ongoing study is being conducted where United Solar Ovonic PV modules are wired to a Fronius inverter. The data and report are written in German however, there is an English summary of the data. With 2005 data, the Fraunhofer ISE was able to conclude that the PV system was performing as expected and is currently out-performing (by ~3%) similar systems that utilize crystalline modules.

# AA53606-02 October 2006 Page 55 of 73

# AA53606-02 October 2006 Page 56 of 73

# AA53606-02 October 2006 Page 57 of 73

# AA53606-02 October 2006 Page 58 of 73

# AA53606-02 October 2006 Page 59 of 73

# AA53606-02 October 2006 Page 60 of 73

# AA53606-02 October 2006 Page 61 of 73

# AA53606-02 October 2006 Page 62 of 73

# AA53606-02 October 2006 Page 63 of 73

# AA53606-02 October 2006 Page 64 of 73
# AA53606-02 October 2006 Page 65 of 73
# AA53606-02 October 2006 Page 66 of 73
Hot Climate Performance in Thailand In Thailand, household-based roof top PV grid-connected demonstration projects were started in 1997. The National Energy Policy and Planning Office has been comparing the performance of 2.25 - 2.88 kW grid-tied systems since 1998. Some of the systems are using crystalline modules (Siemens SP75) and some of the systems are using amorphous silicon modules (United Solar US-64). This is a long-term study that is comparing the output from more than 60 PV systems installed in Bangkok, Thailand. It was found that the grid-tied PV systems that utilized the amorphous silicon modules were outperforming the PV systems that utilized the crystalline modules by ~15% (kilowatt-hours / installed kilowatt peak and performance yield). Although the paper does not speculate as to why there is a 15% difference in performance between the two different technologies, the most likely contributors to the difference in performance yield between the two technologies is; 1) voltage loss due to high cell operating temperatures (greater loss with crystalline technologies), and 2) performance under diffuse light conditions such as the rainy season in Thailand (amorphous silicon collects blue light more efficiently than crystalline technologies do).

# AA53606-02 October 2006 Page 67 of 73
Techincal Digest of the International PVSEC-14, Bangkok, Thailand, 2004 8-5
135
Int’l PVSEC - 14

# AA53606-02 October 2006 Page 68 of 73
136

# AA53606-02 October 2006 Page 69 of 73
Superior Energy Yields of UNI-SOLAR® Triple Junction Solar Products compared to Crystalline Solar Products under real outdoor conditions in
Western Europe In the 1990’s, first generation amorphous silicon thin film products did not have good market acceptance in Western Europe due to low conversion efficiencies, unstable power and poorly understood outdoor characteristics. However, efficiencies have increased and the triple junction materials have proven that the amorphous silicon products are as stable as crystalline products. Results in the study show the excellent performance of multi-junction amorphous silicon modules under real world conditions where high sensitivity to low light and good high-temperature performance make a large impact on power yields and performance ratios (when comparing to crystalline products).

# AA53606-02 October 2006 Page 70 of 73

# AA53606-02 October 2006 Page 71 of 73

# AA53606-02 October 2006 Page 72 of 73

# AA53606-02 October 2006 Page 73 of 73