Embed Size (px)
Citation preview
NEW GOLD INC.
TECHNICAL REPORT ON THENEW AFTON PROJECT,BRITISH COLUMBIA, CANADA
NI 43-101 Report
Authors:R. Dennis Bergen, P.Eng.David W. Rennie, P.Eng.Kevin C.Scott, P.Eng.
December 31, 2009
SCOTT WILSON ROSCOE POSTLE ASSOCIATES INC.
Scott Wilson Mining
Report Control Form Document Title Technical Report on the New Afton Project, British Columbia,
Canada
Client Name & Address
New Gold Inc. 3110-666 Burrard St. Vancouver, British Columbia V6C 2X8
Document Reference
Project # 1416
Status & Issue No.
Final Version
1
Issue Date December 31, 2009 Lead Author R. Dennis Bergen
(name)
(Signed) (signature & date)
Peer Reviewer Richard J. Lambert (name)
(Signed) (signature & date)
Project Manager Approval David W. Rennie (name)
(Signed) (signature & date)
Project Director Approval Richard J. Lambert (name)
(Signed) (signature & date)
Report Distribution Name No. of Copies 5 Client Scott Wilson RPA Filing 1 (project box)
1 (project file) Scott Wilson Roscoe Postle Associates Inc.
55 University Avenue, Suite 501 Toronto, Ontario M5J 2H7 Canada Tel: +1 416 947 0907 Fax: +1 416 947 0395 [email protected]

SCOTT WILSON RPA www.scottwilson.com
New Gold Inc. – New Afton Project Technical Report NI 43-101 – December 31, 2009 Page i
TABLE OF CONTENTS PAGE
1 SUMMARY ................................................................................................................ 1-1 Executive Summary ................................................................................................ 1-1 Technical Summary ................................................................................................ 1-9
2 INTRODUCTION ....................................................................................................... 2-1
3 RELIANCE ON OTHER EXPERTS ........................................................................... 3-1
4 PROPERTY DESCRIPTION AND LOCATION .......................................................... 4-1
5 ACCESSIBILITY, CLIMATE, LOCAL RESOURCES, INFRASTRUCTURE AND PHYSIOGRAPHY ........................................................................................................ 5-1
6 HISTORY .................................................................................................................. 6-1
7 GEOLOGICAL SETTING .......................................................................................... 7-1 Regional Geology ................................................................................................... 7-1 Property Geology.................................................................................................... 7-2
8 DEPOSIT TYPES ...................................................................................................... 8-1
9 MINERALIZATION .................................................................................................... 9-1
10 EXPLORATION ..................................................................................................... 10-1
11 DRILLING .............................................................................................................. 11-1
12 SAMPLING METHOD AND APPROACH .............................................................. 12-1
13 SAMPLE PREPARATION, ANALYSES AND SECURITY ..................................... 13-1
14 DATA VERIFICATION ........................................................................................... 14-1
15 ADJACENT PROPERTIES ................................................................................... 15-1
16 MINERAL PROCESSING AND METALLURGICAL TESTING ............................... 16-1 Metallurgical Testing ............................................................................................. 16-1 Mineral Processing ............................................................................................. 16-15
17 MINERAL RESOURCE AND MINERAL RESERVE ESTIMATES ......................... 17-1 Mineral Resources ................................................................................................ 17-1 Mineral Reserves................................................................................................ 17-19
18 OTHER RELEVANT DATA AND INFORMATION ................................................. 18-1
19 ADDITIONAL REQUIREMENTS ........................................................................... 19-1 Mining Operations ................................................................................................ 19-2 Mineral Processing ............................................................................................. 19-40 Life of Mine Plan ................................................................................................. 19-40 Markets .............................................................................................................. 19-43 Contracts ............................................................................................................ 19-45 Environmental Considerations ............................................................................ 19-45
SCOTT WILSON RPA www.scottwilson.com
New Gold Inc. – New Afton Project Technical Report NI 43-101 – December 31, 2009 Page ii
Taxes ................................................................................................................... 19-53�Capital and Operating Cost Estimates ................................................................. 19-54�Project Execution Plan ......................................................................................... 19-62�Economic Analysis ............................................................................................... 19-62�
20 INTERPRETATION AND CONCLUSIONS ............................................................. 20-1�
21 RECOMMENDATIONS ........................................................................................... 21-1�
22 REFERENCES ........................................................................................................ 22-1�
23 DATE AND SIGNATURE PAGE ............................................................................. 23-1�
24 CERTIFICATE OF QUALIFIED PERSON .............................................................. 24-1�
25 APPENDIX 1 ........................................................................................................... 25-1�
LIST OF TABLES PAGE
Table 1-1 After-Tax Cash Flow .................................................................................... 1-5�Table 1-2 Sensitivity Analyses ..................................................................................... 1-8�Table 1-3 Mineral Resource Summary – September 2009 ........................................ 1-13�Table 1-4 Mineral Resource Summary – 0.4% CuEq Cut-Off .................................... 1-14�Table 1-5 Mineral Reserve Estimate – September 2009 ........................................... 1-15�Table 4-1 Mineral Tenures ........................................................................................... 4-2�Table 11-1 Drill Summary by Campaign .................................................................... 11-1�Table 15-1 Ajax Deposit – Mineral Resource Estimate .............................................. 15-1�Table 16-1 Percentage of Ore Type ........................................................................... 16-1�Table 16-2 Bulk Samples ........................................................................................... 16-3�Table 16-3 Grinding Index Summary ......................................................................... 16-5�Table 16-4 Locked Cycle Test Summary ................................................................... 16-7�Table 16-5 Concentrate Assays ................................................................................. 16-7�Table 16-6 Variability (Batch) Test Summary Results ............................................. 16-10�Table 17-1 Mineral Resource Summary .................................................................... 17-2�Table 17-2 Block Model Geometry ............................................................................. 17-4�Table 17-3 Statistical Summary of Sample Assay Data ............................................. 17-5�Table 17-4 Top Cuts .................................................................................................. 17-9�Table 17-5 Variogram Models .................................................................................. 17-10�Table 17-6 Bulk Density ........................................................................................... 17-12�Table 17-7 Mineral Resource Estimate Comparison ............................................... 17-14�Table 17-8 Mineral Resource Summary (CuEq Cut-Off) ......................................... 17-15�Table 17-9 2009 vs. 2006 Estimate Comparison ..................................................... 17-18�Table 17-10 Mineral Reserve Estimate – September 2009 ..................................... 17-19�Table 17-11 Drawpoint Production by Resource Classification ............................... 17-24�Table 17-12 Tonnage and Grade of Material from Mine Construction Activities ...... 17-25�Table 17-13 Mineral Reserve Estimate .................................................................... 17-26�Table 19-1 LOM Ore and Waste Tonnage Summary .............................................. 19-28�Table 19-2 Underground Mobile Equipment ............................................................ 19-38�Table 19-3 Capital Equipment for Production .......................................................... 19-39�

SCOTT WILSON RPA www.scottwilson.com
New Gold Inc. – New Afton Project Technical Report NI 43-101 – December 31, 2009 Page iii
Table 19-4 Sustaining Capital U/G Equipment ........................................................ 19-39�Table 19-5 LOMP Development ............................................................................... 19-40�Table 19-6 LOMP development Tonnage ................................................................ 19-41�Table 19-7 LOM Mill Feed ........................................................................................ 19-42�Table 19-8 LOM Metal Recovery ............................................................................. 19-42�Table 19-9 Concentrate Production ......................................................................... 19-43�Table 19-10 Metal Price and Exchange Rate Assumptions ..................................... 19-44�Table 19-11 Authorizations and Licences ................................................................ 19-47�Table 19-12 Closure Cost Estimate ......................................................................... 19-53�Table 19-13 Construction Capital Estimate .............................................................. 19-55�Table 19-14 Site Development Capital Estimate ..................................................... 19-55�Table 19-15 Process Capital Estimate ..................................................................... 19-56�Table 19-16 Electrical Capital Estimate ................................................................... 19-56�Table 19-17 Tailings Capital Estimate ..................................................................... 19-57�Table 19-18 Surface Services Capital Estimate ....................................................... 19-57�Table 19-19 Mining Capital Estimate ....................................................................... 19-58�Table 19-20 Indirect Capital Estimate ...................................................................... 19-58�Table 19-21 Sustaining Capital by Area ................................................................... 19-59�Table 19-22 Annual Sustaining Capital .................................................................... 19-60�Table 19-23 Annual Sustaining Capital Breakdown ................................................. 19-60�Table 19-24 Operating Costs ................................................................................... 19-61�Table 19-25 Manpower ............................................................................................ 19-61�Table 19-26 After-Tax Cash Flow ............................................................................ 19-64�Table 19-27 Sensitivity Analyses ............................................................................. 19-67�
LIST OF FIGURES PAGE
Figure 1-1 Sensitivity Analysis ..................................................................................... 1-8�Figure 4-1 Location Map .............................................................................................. 4-4�Figure 4-2 Mineral Titles .............................................................................................. 4-5�Figure 7-1 Regional Geology ....................................................................................... 7-3�Figure 7-2 Afton Pit Geology ........................................................................................ 7-4�Figure 7-3 Property Geology ........................................................................................ 7-5�Figure 11-1 Drill Hole Locations and Resource Outline ............................................. 11-6�Figure 16-1 Process Flowheet ................................................................................. 16-18�Figure 19-1 Location of Mine Workings as Related to Surface .................................. 19-4�Figure 19-2 Location of the Mining Blocks ................................................................. 19-5�Figure 19-3 Block Undercut Outlines ....................................................................... 19-10�Figure 19-4 Caving Stability Chart ........................................................................... 19-11�Figure 19-5 Surface Subsidence Projections ........................................................... 19-15�Figure 19-6 Subsidence Limits Based on Empirical Assessment Methods ............. 19-16�Figure 19-7 Undercut Design ................................................................................... 19-22�Figure 19-8 Drawpoint Arrangement ........................................................................ 19-25�Figure 19-9 Typical Drawpoint Support .................................................................... 19-26�Figure 19-10 Ore and Waste Tonnage .................................................................... 19-28�Figure 19-11 Conveyor Gallery Layout .................................................................... 19-30�
SCOTT WILSON RPA www.scottwilson.com
New Gold Inc. – New Afton Project Technical Report NI 43-101 – December 31, 2009 Page iv
Figure 19-12 Conveyor Decline Cross-Section ........................................................ 19-31�Figure 19-13 Sensitivity Analysis ............................................................................. 19-67�
LIST OF APPENDIX FIGURES & TABLES PAGE
Figure A1-1 Composite Statistics, Histograms and Probability Plots ......................... 25-2�
SCOTT WILSON RPA www.scottwilson.com
New Gold Inc. – New Afton Project Technical Report NI 43-101 – December 31, 2009 Page 1-1
1 SUMMARY EXECUTIVE SUMMARY Scott Wilson Roscoe Postle Associates Inc. (Scott Wilson RPA) was retained by Mr.
Mark Petersen, Vice President, Exploration, of New Gold Inc. (New Gold), to prepare an
independent Technical Report and Feasibility Update on the New Afton Cu-Au-Ag
Project (the Project) near Kamloops, British Columbia, Canada. The purpose of this
report is to support the public disclosure of updated Mineral Resources and Mineral
Reserves for the Project. This Technical Report conforms to NI 43-101 Standards of
Disclosure for Mineral Projects (NI 43-101). Scott Wilson RPA visited the property on
September 3 and 4, 2009.
New Afton is a former producer which operated an open pit mine from 1977 to 1987.
New Gold acquired an option on the New Afton property in 1999 and began exploration
work in 2000. The Project is in the development stage and is a planned 11,000 tpd
(nominal) block cave operation scheduled to commence milling in mid-2012. Copper
and gold in concentrates will be produced at the Project. Development commenced in
2007 but, except for engineering and other limited activities, was halted due to the global
economic conditions in the fourth quarter of 2008. Underground development
recommenced in the first quarter of 2009 and was underway at the time of the site visit.
Surface construction is scheduled to restart in 2011.
CONCLUSIONS Scott Wilson RPA has carried out an audit of the Mineral Resource and Mineral Reserve
estimates for the New Afton Project, and makes the following conclusions:
• The drilling has been conducted in a manner consistent with industry standards.
• The core handling, logging and sampling have been carried out in a manner consistent with industry standards.
• Sampling and assaying has been conducted in a manner appropriate for the
deposit type and mineralization, and using industry-standard practices.
• Assay quality assurance/quality control (QA/QC) protocols are consistent with common industry standards, and no evidence of persistent or systematic errors has been found. However, the QA/QC has been inconsistently monitored and requires more timely review.

SCOTT WILSON RPA www.scottwilson.com
New Gold Inc. – New Afton Project Technical Report NI 43-101 – December 31, 2009 Page 1-2
� Density measurements are made in sufficient numbers and with an appropriate methodology.
� The database is generally free of serious errors, although several inconsistencies have been found. At the time of writing, a new database system was being installed, which will implement more rigorous validation procedures.
� The Mineral Resource estimate has been carried out using generally reasonable assumptions and parameters, and accepted practices.
� Geological interpretation has resulted in improvements to the understanding of several features of the deposit, particularly the faulting and the De-mineralized Zone (DMZ). However, interpretations of the mineralized zone boundaries have not been maintained, resulting in the implementation of a grade shell approach to constraining the grade interpolation. In Scott Wilson RPA’s opinion, it would be preferable to base the resource boundaries on lithological and mineralogical characteristics, if possible.
� The updated Mineral Resource estimate is not materially different from the 2006 estimate used in the Feasibility Study completed by Hatch Ltd. in 2007, and should not result in a major change to the Mineral Reserves.
� The assay database for deleterious elements has been markedly improved since the last estimate but still lags behind the economic elements in terms of numbers of samples and coverage. Improvements could still be made to the block grade estimates for deleterious components.
� The Mineral Resources should be quoted at a CuEq cut-off rather than a Cu cut-off.
� The Mineral Reserve is estimated to 47.4 million tonnes of Probable Mineral Reserves grading 0.95% Cu, 0.69 g/t Au, and 2.03 g/t Ag.
� The Mineral Reserves are considered to be amenable to underground mining through the use of block caving at a production rate of 4 Mtpa of ore.
� The preproduction capital cost is estimated to be C$460.9 million plus sustaining capital of $172.3 million and not including sunk expenditures.
� The estimated Life of Mine (LOM) operating cost is C$17.27 per tonne milled.
� Considering the Project on a stand-alone basis, the undiscounted after-tax cash flow totals C$707 million over the mine life, and simple payback occurs approximately 4.5 years after the start of production.
� The Total Cash Cost is US$0.84 per pound of copper. The mine life capital unit cost is US$0.69 per pound of copper and the byproduct credits are US$0.89 per pound of copper, for a Total Production Cost of US$0.64 per pound of copper. Average annual production during operation is 72 million pounds of copper and 76,000 ounces of gold.

SCOTT WILSON RPA www.scottwilson.com
New Gold Inc. – New Afton Project Technical Report NI 43-101 – December 31, 2009 Page 1-3
The after-tax net present value (NPV) at a 5% discount rate is C$374 million, and the internal rate of return (IRR) is 19%.
RECOMMENDATIONS Scott Wilson RPA makes the following recommendations:
Based upon the assumptions and estimates within this study, the continued development of the Project is recommended.
Database validation protocols should be enhanced and rigorously observed.
Geological interpretation and wireframing should continue with focus on the
zones of mineralization, in order to improve the constraints to the grade interpolations. If possible, the grade shell should be replaced by wireframes based on geological characteristics.
The Mineral Resource estimate should be quoted at a 0.4% CuEq cut-off.
Changing the cut-off does not materially affect the Mineral Reserves.
Analytical work on the deleterious elements should continue in order to allow improvements to be made to the block models for these components.
The review of the project execution plan which is currently underway should be
continued and completed including incorporation of all of the modifications since completion of the 2007 Feasibility Study.
ECONOMIC ANALYSIS A Cash Flow Projection has been generated from the LOM production schedule and
capital and operating cost estimates, and is summarized in Table 1-1. A summary of the
key criteria is provided below.
ECONOMIC CRITERIA Revenue
4 Mpta mining from underground Mill recovery by zone, as indicated by testwork, averaging 87.8%. Exchange rate US$1.00 = C$0.85. Metal prices as shown in Table 19-10. Net Smelter Return includes smelting, refining, transport, and penalty treatment
costs. Revenue is recognized at the time of mill production
SCOTT WILSON RPA www.scottwilson.com
New Gold Inc. – New Afton Project Technical Report NI 43-101 – December 31, 2009 Page 1-4
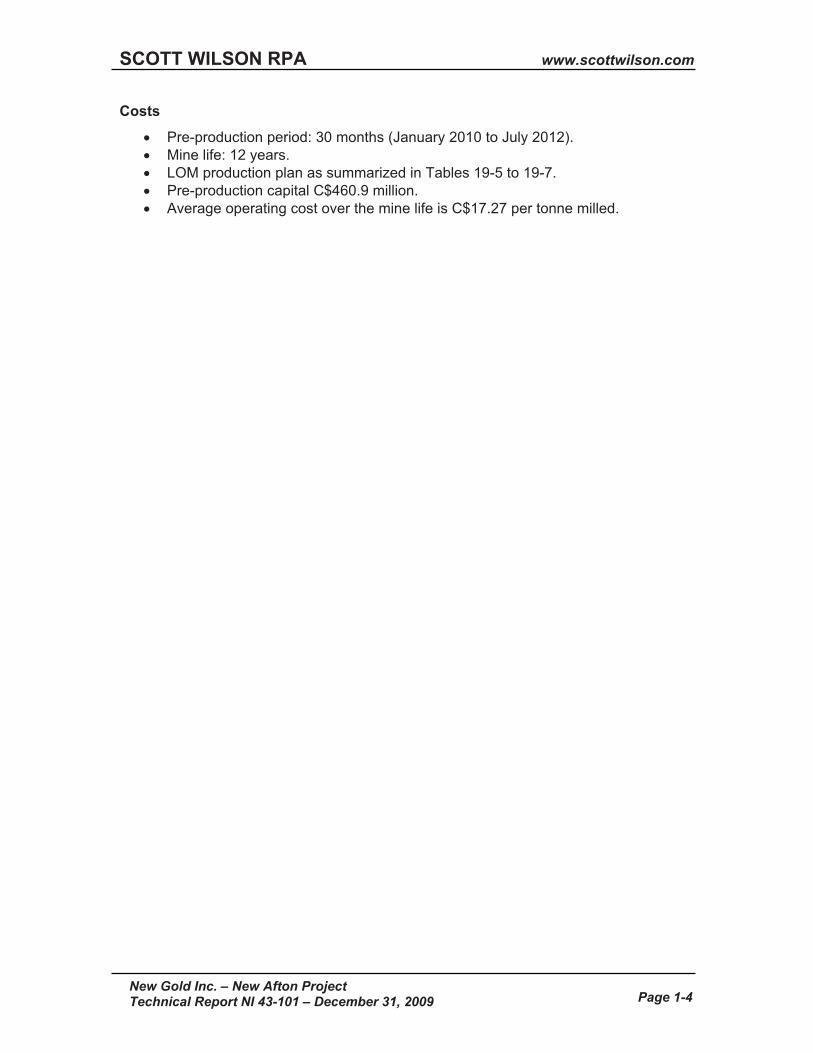
Costs
� Pre-production period: 30 months (January 2010 to July 2012). � Mine life: 12 years. � LOM production plan as summarized in Tables 19-5 to 19-7. � Pre-production capital C$460.9 million. � Average operating cost over the mine life is C$17.27 per tonne milled.

2010 2011 2012 2013 2014 2015 2016 2017 2018 2019 2020 2021 2022 2023 2024 2025 TotalPRODUCTION Mill Feed tonnes 000 2,227 4,085 4,029 4,003 4,000 4,000 4,000 4,034 4,028 4,000 4,000 4,000 1,000 47,406
Copper grade % 0.84 0.86 0.82 0.91 1.07 1.17 1.12 1.14 1.04 0.95 0.87 0.63 0.50 0.95 Gold grade g/t 0.74 0.72 0.69 0.77 0.81 0.83 0.75 0.66 0.59 0.67 0.64 0.46 0.36 0.69 Silver Grade g/t 1.47 1.39 1.66 2.14 2.66 2.59 2.42 2.74 2.45 1.90 1.71 1.25 1.04 2.03
Contained Copper tonnes 18,721 35,304 32,965 36,570 42,745 46,758 44,934 45,921 41,956 37,832 34,816 25,113 5,000 448,636Contained Gold kg 1,639 2,943 2,796 3,097 3,242 3,339 2,995 2,657 2,382 2,697 2,553 1,847 361 32,549Contained silver kg 3,275 5,673 6,673 8,568 10,657 10,345 9,667 11,068 9,880 7,586 6,851 4,988 1,038 96,269
Copper recovery % 76.34 89.68 88.99 89.28 90.00 90.70 90.57 90.43 87.83 86.36 84.83 81.07 74.96 87.87 Copper Con grade % 23.24 28.00 28.00 28.00 28.00 28.00 28.00 28.08 29.07 29.30 29.93 31.06 32.94 28.32%Copper con tonnes t 61,500 113,071 104,775 116,610 137,390 151,468 145,346 147,879 126,765 111,502 98,664 65,542 11,381 1,391,892 Contained Cu t 14,293 31,660 29,337 32,651 38,469 42,411 40,698 41,527 36,851 32,671 29,533 20,358 3,748 394,208 Arsenic grade % 0.24 0.35 0.37 0.50 0.80 0.74 0.77 1.00 0.87 0.42 0.50 0.68 0.71 0.64 Mercury grade ppm 9 13 16 20 26 21 20 25 27 18 22 32 44 21.17
Gold recovery % 75.47 88.37 87.55 87.25 87.85 88.34 88.55 88.70 87.09 86.93 85.94 83.56 79.12 0.86753415Recovered gold kg 1,237 2,601 2,448 2,702 2,848 2,950 2,652 2,357 2,075 2,345 2,194 1,543 286 28,237Con gold grade g/t 20.1 23.0 23.4 23.2 20.7 19.5 18.2 15.9 16.4 21.0 22.2 23.5 25.1 20.3
Silver Recovery % 66.52 77.06 77.63 75.81 75.12 73.92 75.26 76.65 74.85 73.84 74.92 78.29 75.44 0.7526279Recovered silver kg 2,178 4,372 5,180 6,495 8,006 7,647 7,275 8,484 7,395 5,602 5,133 3,905 783 72,454Con silver grade g/t 35.42 38.66 49.44 55.70 58.27 50.49 50.05 57.37 58.34 50.24 52.02 59.58 68.82 52.05
Con moisture 0.08Con Weight (wet) t 66,848 122,903 113,885 126,750 149,337 164,639 157,985 160,738 137,788 121,198 107,243 71,241 12,370 1,512,927
REVENUEPayable copper t 13,678 30,529 28,289 31,485 37,095 40,896 39,244 40,049 35,562 31,527 28,500 19,646 3,617 380,116 payable gold kg 1,206 2,536 2,387 2,634 2,777 2,861 2,573 2,286 2,013 2,286 2,139 1,505 279 27,481payable silver kg 1,960 3,934 4,662 5,846 7,205 6,883 6,547 7,636 6,656 5,041 4,619 3,514 705 65,209Metal price - NG use 1, other 0 1Copper price USD/lb 2.50 2.40 2.00 2.00 2.00 2.00 2.00 2.00 2.00 2.00 2.00 2.00 2.00 2.05 Gold price USD/oz 900.00 850.00 800.00 800.00 800.00 800.00 800.00 800.00 800.00 800.00 800.00 800.00 800.00 809.00 Silver price USD/oz 13.25 13.00 13.00 13.00 13.00 13.00 13.00 13.00 13.00 13.00 13.00 13.00 13.00 13.01 Exchange C:US 0.90 0.90 0.90 0.90 0.85 0.85 0.85 0.85 0.85 0.85 0.85 0.85 0.85 0.85 0.85 0.85 0.86
Copper revenue US$000 75,385 161,531 124,733 138,822 163,561 180,320 173,037 176,582 156,798 139,010 125,661 86,623 15,948 1,718,008Gold revenue US$000 34,893 69,299 61,392 67,760 71,423 73,600 66,167 58,803 51,767 58,800 55,026 38,703 7,164 714,800Silver revenue US$000 835 1,644 1,949 2,443 3,012 2,877 2,737 3,191 2,782 2,107 1,931 1,469 295 27,271Revenue US$000 111,113 232,475 188,073 209,025 237,995 256,797 241,940 238,577 211,347 199,917 182,618 126,795 23,407 2,460,079Losses in transit 0.30% 0.30% 0.30% 0.30% 0.30% 0.30% 0.30% 0.30% 0.30% 0.30% 0.30% 0.30% 0.30% 0.30%Rev after losses US$000 110,779 231,777 187,509 208,398 237,281 256,026 241,215 237,861 210,713 199,317 182,070 126,415 23,337 - 2,452,699
Treatment charge US$000 5,043 9,272 8,592 9,562 11,266 12,420 11,918 12,126 10,395 9,143 8,090 5,374 933 - 114,135Refining charge US$000 2,473 5,519 5,114 5,692 6,706 7,393 7,094 7,240 6,429 5,699 5,152 3,552 654 - 68,716Price participationArsenic penalty US$000 901 2,379 2,327 3,505 6,565 6,721 6,710 8,910 6,622 2,825 2,985 2,667 486 53,604Mercury penalty US$000 - 67 121 244 446 323 303 434 419 168 231 285 78 3,117Gold refining US$000 233 489 460 508 536 552 496 441 388 441 413 290 54 - 5,301Silver refining US$000 22 44 52 66 81 77 74 86 75 57 52 40 8 - 734
TransportationOcean Freight US$000 3,677 6,760 6,264 6,971 8,214 9,055 8,689 8,841 7,578 6,666 5,898 3,918 680 - 83,211Terminal Cost US$000 1,685 3,097 2,710 3,017 3,554 3,918 3,760 3,826 3,279 2,885 2,552 1,696 294 - 36,273Truck Transportation US$000 1,955 3,595 3,146 3,501 4,125 4,548 4,364 4,440 3,806 3,348 2,963 1,968 342 - 42,103
Supervision and Assaying (Umpires US$000 62 113 105 117 137 151 145 148 127 112 99 66 11 - 1,392Marine Insurance Costs US$000 111 232 188 209 238 257 242 239 211 200 183 127 23 - 2,460Charterer's Liability Insurance US$000 31 57 52 58 69 76 73 74 63 56 49 33 6 - 696
Total Costs US$000 16,191 31,624 29,132 33,450 41,938 45,492 43,869 46,804 39,393 31,599 28,666 20,014 3,570 - 411,743
NSR US$000 94,588 200,153 158,376 174,949 195,344 210,534 197,345 191,058 171,319 167,718 153,403 106,401 19,767 - 2,040,956NSR C$000 105,098 222,393 186,325 205,822 229,816 247,687 232,171 224,774 201,552 197,315 180,475 125,177 23,256 2,381,860
NSR/tonne ore C$/t 47.19 54.44 46.24 51.42 57.45 61.92 58.04 55.71 50.04 49.33 45.12 31.29 23.26 50.24 NSR/lb Cu USD/lb 3.14 2.97 2.54 2.52 2.39 2.34 2.28 2.16 2.19 2.41 2.44 2.46 2.48 2.44
New Gold Inc. – New Afton ProjectTABLE 1-1 AFTER-TAX CASH FLOW
SCO
TT WILSO
N R
PA
ww
w.scottw
ilson.com
N
ew G
old Inc. – New
Afton Project
Technical Report N
I 43-101 – Decem
ber 31, 2009 Page 1-5

OPERATING COSTSMining C$ '000s 14,322 30,878 28,826 27,667 27,705 28,464 27,373 27,344 28,562 33,203 33,131 33,014 8,063 348,552Milling C$ '000s 18,352 30,953 30,564 30,123 30,114 30,108 30,103 30,208 30,169 30,073 30,062 30,087 8,665 359,581G&A C$ '000s 5,055 9,272 9,364 9,364 9,364 9,364 9,364 9,364 9,364 9,364 9,364 9,364 2,365 110,334
Total C$ '000s 37,729 71,103 68,754 67,153 67,184 67,936 66,840 66,916 68,095 72,640 72,557 72,464 19,094 818,467
Mining C$ '000s 6.43 7.56 7.15 6.91 6.93 7.12 6.84 6.78 7.09 8.30 8.28 8.25 8.07 7.35 Milling C$ '000s 8.24 7.58 7.59 7.53 7.53 7.53 7.53 7.49 7.49 7.52 7.52 7.52 8.67 7.59 G&A C$ '000s 2.27 2.27 2.32 2.34 2.34 2.34 2.34 2.32 2.32 2.34 2.34 2.34 2.37 2.33
C$ '000sTotal 16.94 17.41 17.06 16.78 16.80 16.98 16.71 16.59 16.91 18.16 18.14 18.12 19.10 17.27
Operating Cash Flow C$ '000s 0 0 67,369 151,289 117,571 138,669 162,632 179,751 165,331 157,858 133,457 124,675 107,918 52,713 4,162 1,563,393
First Nations Royalty C$ '000s 250 250 250 250 250 250 2,298 2,477 2,322 2,248 2,016 1,973 1,805 1,252 1,000 18,390
CAPITAL COSTSMine C$ '000s 37,474 148,837 48,179 234,491Processing C$ '000s 2,542 61,938 34,741 99,221Surface C$ '000s - 24,246 19,487 43,733Indriect C$ '000s 11,131 24,742 17,089 52,962Contingency C$ '000s - 24,416 6,104 30,520Sustaining C$ '000s 39,970 35,881 15,745 24,372 6,057 6,490 3,765 15,256 20,344 3,575 737 62 - - 172,253Reclamation C$ '000s 5,000 2,500 7,500Total C$ '000s 51,147 284,178 165,572 35,881 15,745 24,372 6,057 6,490 3,765 15,256 20,344 3,575 737 62 5,000 2,500 640,680
PRETAX CASHFLOWBC net proceeds tax C$ '000s 1,347 3,026 2,351 2,773 3,253 3,595 3,307 3,157 2,669 2,493 2,158 1,054 83 - 31,268
Net Cash Flow Pre Tax C$ '000s (51,397) (284,428) (99,800) 112,133 99,224 111,274 151,024 167,189 155,938 137,196 108,428 116,634 103,218 50,345 (1,921) (2,500) 872,555Cumulative Cash Flow Pre tax C$ '000s (51,397) (335,826) (435,626) (323,493) (224,269) (112,996) 38,029 205,218 361,155 498,352 606,780 723,414 826,632 876,977 875,055 872,555
Net Cash Flow Pre Tax US$ '000s (46,258) (255,986) (89,820) 100,919 84,341 94,583 128,371 142,111 132,547 116,617 92,164 99,139 87,735 42,793 (1,633) (2,125) 725,497 Cumulative Cash Flow Pre tax US$ '000s (46,258) (302,243) (392,063) (291,144) (206,803) (112,221) 16,150 158,261 290,807 407,424 499,589 598,727 686,462 729,256 727,622 725,497
IRR 21% USD millionsNPV $C millions 0% 873 NPV 725 NPV $C millions 5% 472 NPV 5% 386 NPV $C millions 8% 316 NPV 8% 254 NPV $C millions 10% 236 NPV 10% 187
Total Cash Cost US$/lb 1.13 0.95 0.94 0.82 0.70 0.64 0.66 0.64 0.74 0.89 0.98 1.42 2.04 0.84 Byproduct Credit US$/lb (1.18) (1.05) (1.02) (1.01) (0.91) (0.85) (0.80) (0.70) (0.70) (0.88) (0.91) (0.93) (0.94) (0.89) Capital/Royalty Cost US$/lb 4.98 0.52 0.25 0.33 0.10 0.10 0.07 0.18 0.25 0.07 0.04 0.02 0.54 0.69 Total Production Cost US$/lb 4.92 0.42 0.17 0.14 (0.12) (0.11) (0.07) 0.12 0.29 0.09 0.11 0.52 1.64 0.64
TAXATIONTaxable Income C$ '000s - - - - - - - 17,683 132,732 129,942 112,182 108,804 94,229 41,049 - 636,621 BC Revenue tax C$ '000sBC Income Tax C$ '000s - - - - - - - 1,945 14,601 14,294 12,340 11,968 10,365 4,515 - 70,028 Federal Income Tax C$ '000s - - - - - - - 2,652 19,910 19,491 16,827 16,321 14,134 6,157 - 95,493 Total tax C$ '000s - - - - - - - 4,598 34,510 33,785 29,167 28,289 24,500 10,673 - 165,521
AFTER-TAX CASH FLOWNet Cash Flow After Tax C$ '000s (51,397) (284,428) (99,800) 112,133 99,224 111,274 151,024 162,592 121,427 103,412 79,261 88,345 78,718 39,672 (1,921) (2,500) 707,034 Cum Net Cash Flow After Tax C$ '000s (51,397) (335,826) (435,626) (323,493) (224,269) (112,996) 38,029 200,620 322,048 425,459 504,720 593,065 671,783 711,455 709,534 707,034
IRR after tax 19% USD millionsNPV $C millions 0% 707 NPV 585 NPV $C millions 5% 374 NPV 5% 303 NPV $C millions 8% 244 NPV 8% 193 NPV $C millions 10% 177 NPV 10% 137
Net Cash Flow After Tax US$ '000s (46,258) (255,986) (89,820) 100,919 84,341 94,583 128,371 138,203 103,213 87,900 67,372 75,093 66,911 33,721 (1,633) (2,125) 584,804 Cum Net Cash Flow After Tax US$ '000s (46,258) (302,243) (392,063) (291,144) (206,803) (112,221) 16,150 154,353 257,566 345,466 412,837 487,930 554,841 588,562 586,929 584,804
SCO
TT WILSO
N R
PA
ww
w.scottw
ilson.com
N
ew G
old Inc. – New
Afton Project
Technical Report N
I 43-101 – Decem
ber 31, 2009 Page 1-6
SCOTT WILSON RPA www.scottwilson.com
New Gold Inc. – New Afton Project Technical Report NI 43-101 – December 31, 2009 Page 1-7
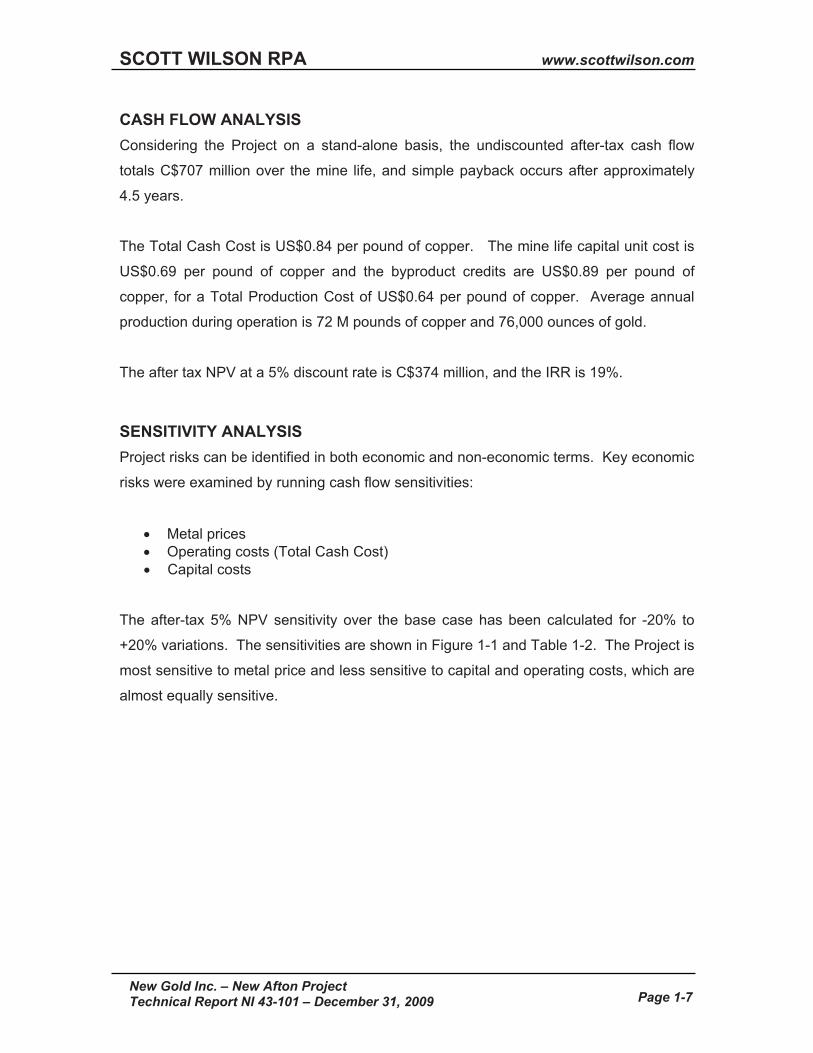
CASH FLOW ANALYSIS Considering the Project on a stand-alone basis, the undiscounted after-tax cash flow
totals C$707 million over the mine life, and simple payback occurs after approximately
4.5 years.
The Total Cash Cost is US$0.84 per pound of copper. The mine life capital unit cost is
US$0.69 per pound of copper and the byproduct credits are US$0.89 per pound of
copper, for a Total Production Cost of US$0.64 per pound of copper. Average annual
production during operation is 72 M pounds of copper and 76,000 ounces of gold.
The after tax NPV at a 5% discount rate is C$374 million, and the IRR is 19%.
SENSITIVITY ANALYSIS Project risks can be identified in both economic and non-economic terms. Key economic
risks were examined by running cash flow sensitivities:
� Metal prices � Operating costs (Total Cash Cost) � Capital costs
The after-tax 5% NPV sensitivity over the base case has been calculated for -20% to
+20% variations. The sensitivities are shown in Figure 1-1 and Table 1-2. The Project is
most sensitive to metal price and less sensitive to capital and operating costs, which are
almost equally sensitive.

SCOTT WILSON RPA www.scottwilson.com
New Gold Inc. – New Afton Project Technical Report NI 43-101 – December 31, 2009 Page 1-8
FIGURE 1-1 SENSITIVITY ANALYSIS
TABLE 1-2 SENSITIVITY ANALYSES New Gold Inc. – New Afton Project
Sensitivity to Metal Price
Cu US$/lb NPV @ 0%
millions NPV @ 5%
millions NPV @ 8%
millions 1.64 302 104 28 1.85 505 239 136 2.05 707 374 244 2.26 910 510 353 2.46 1,112 644 460
Sensitivity to Operating Cost
$/tonne NPV @ 0%
millions NPV @ 5%
millions NPV @ 8%
millions 13.81 825 452 306 15.54 766 413 275 17.27 707 374 244 18.99 648 336 213 20.72 591 298 184
Sensitivity to Capital Cost
$ Millions NPV @ 0%
millions NPV @ 5%
millions NPV @ 8%
millions 513 835 484 345 577 771 429 295 641 707 374 244 705 645 321 195 769 581 266 145

SCOTT WILSON RPA www.scottwilson.com
New Gold Inc. – New Afton Project Technical Report NI 43-101 – December 31, 2009 Page 1-9
TECHNICAL SUMMARY PROPERTY DESCRIPTION AND LOCATION The New Afton Project is located at Latitude 50°39’ north and Longitude 120°31’ west,
approximately 350 km northeast of Vancouver and 10 km west of the City of Kamloops,
in the South-Central Interior of British Columbia. Trans-Canada Highway No. 1 passes
through the middle of the Afton mining lease several kilometres west of its junction with
the Coquihalla Highway No. 5. Access to the mine site is by a mine road located off of
the Trans-Canada Highway.
New Gold’s holdings in the Project area comprise two groups, Afton and Ajax. The New
Afton deposit lies within the Afton Group. The Afton Group consists of 44 mineral
claims, a portion of which have been surveyed and are included in a mining lease issued
on November 9, 2006. Total area of all claims and the lease is 7,352.7 ha.
New Gold holds surface rights on approximately 4,300 acres surrounding the New Afton
Project, purchased from subsidiaries of Teck Resources Limited (Teck) on October 25,
2007. The terms of the purchase agreement provide title to fee simple land, a covenant
to obtain a release of grazing leases, and access to surface improvements, including a
water pipeline to the site from Kamloops Lake.
HISTORY Exploration in the Afton area began in the mid-1800s, as prospectors pushed into the
interior of British Columbia following the Fraser and Caribou gold rushes. The Iron Mask
property, staked in 1896, was the first in the Kamloops district. The Afton property
claims were staked over the Pothook workings in 1949. This was followed by sporadic,
and largely unsuccessful, exploration work by a number of parties through the 1950s
and 1960s.
In 1970, a private company called Afton Mines Ltd. (Afton Mines) obtained a drill
intersection of 170 ft of 0.4% Cu from what ultimately became the Afton deposit. For the
next three years, over 150,000 ft of drilling was carried out by a number of operators.
Teck Corporation and Iso Mines Ltd. bought acquired the Afton property in 1973, and
initiated engineering and metallurgical studies. A production decision was taken in
SCOTT WILSON RPA www.scottwilson.com
New Gold Inc. – New Afton Project Technical Report NI 43-101 – December 31, 2009 Page 1-10
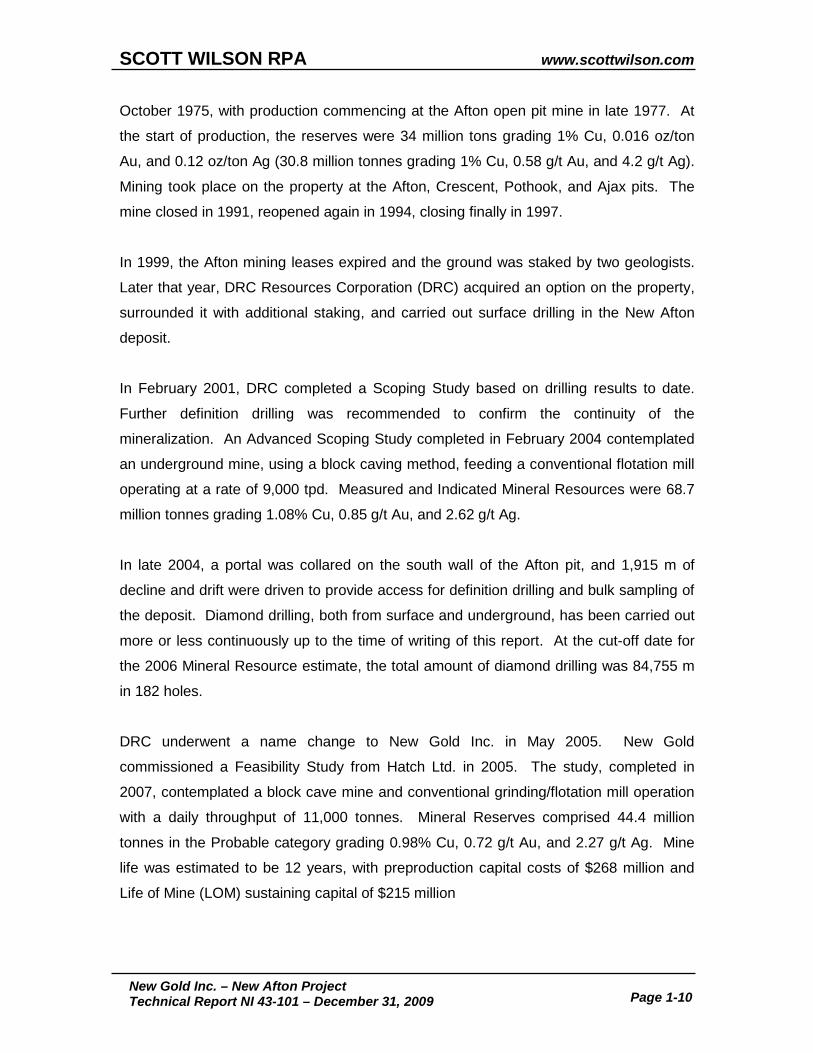
October 1975, with production commencing at the Afton open pit mine in late 1977. At
the start of production, the reserves were 34 million tons grading 1% Cu, 0.016 oz/ton
Au, and 0.12 oz/ton Ag (30.8 million tonnes grading 1% Cu, 0.58 g/t Au, and 4.2 g/t Ag).
Mining took place on the property at the Afton, Crescent, Pothook, and Ajax pits. The
mine closed in 1991, reopened again in 1994, closing finally in 1997.
In 1999, the Afton mining leases expired and the ground was staked by two geologists.
Later that year, DRC Resources Corporation (DRC) acquired an option on the property,
surrounded it with additional staking, and carried out surface drilling in the New Afton
deposit.
In February 2001, DRC completed a Scoping Study based on drilling results to date.
Further definition drilling was recommended to confirm the continuity of the
mineralization. An Advanced Scoping Study completed in February 2004 contemplated
an underground mine, using a block caving method, feeding a conventional flotation mill
operating at a rate of 9,000 tpd. Measured and Indicated Mineral Resources were 68.7
million tonnes grading 1.08% Cu, 0.85 g/t Au, and 2.62 g/t Ag.
In late 2004, a portal was collared on the south wall of the Afton pit, and 1,915 m of
decline and drift were driven to provide access for definition drilling and bulk sampling of
the deposit. Diamond drilling, both from surface and underground, has been carried out
more or less continuously up to the time of writing of this report. At the cut-off date for
the 2006 Mineral Resource estimate, the total amount of diamond drilling was 84,755 m
in 182 holes.
DRC underwent a name change to New Gold Inc. in May 2005. New Gold
commissioned a Feasibility Study from Hatch Ltd. in 2005. The study, completed in
2007, contemplated a block cave mine and conventional grinding/flotation mill operation
with a daily throughput of 11,000 tonnes. Mineral Reserves comprised 44.4 million
tonnes in the Probable category grading 0.98% Cu, 0.72 g/t Au, and 2.27 g/t Ag. Mine
life was estimated to be 12 years, with preproduction capital costs of $268 million and
Life of Mine (LOM) sustaining capital of $215 million
SCOTT WILSON RPA www.scottwilson.com
New Gold Inc. – New Afton Project Technical Report NI 43-101 – December 31, 2009 Page 1-11
Exploration drilling during 2006-2007 resulted in the discovery of the C Zone located
below the main body of mineralization.
At the time of writing of this report, underground development was underway, the mill
building had been erected with exterior cladding installed, and mill foundations had been
poured. Surface construction was suspended until late 2010, and underground
development was expected to be completed in 2012.
GEOLOGY AND MINERALIZATION The Afton area is underlain primarily by rocks of the Upper to Lower Palaeozoic Quesnel
Terrane, a package of island-arc sedimentary rocks, volcanic assemblages and
associated intrusive phases. Quesnel Terrane was accreted onto the North American
continental margin during the Early to Mid-Jurassic and is distributed throughout the
entire length of British Columbia. It forms part of the Intermontane Belt, which is host to
many porphyry Cu-Au-Mo deposits including Copper Mountain, Afton, Highland Valley,
Mount Polley, Gibraltar, Kemess, and Galore Creek.
In the immediate Project area, the Quesnel Terrane comprises Late Triassic to Early
Jurassic Nicola Group island-arc volcanic and sedimentary rocks and coeval alkalic to
subalkalic intrusions of the Iron Mask batholith.
The New Afton deposit is hosted within the Cherry Creek member of the Iron Mask
batholith complex. The Iron Mask complex is a multi-phase plutonic body exposed in a
southeast-trending belt measuring 34 km long by 5 km wide. The Cherry Creek phase is
a partially fault-bounded body trending east-northeast through the deposit area, curving
to east side of the property to a more southeasterly trend. At Afton, the Cherry Creek
intrusive is a variably and multiply brecciated assemblage of porphyritic and equigranular
monzonite-monzodiorite. Cherry Creek rocks include fine- to medium-grained pyroxene-
hornblende monzodiorite and fine-grained biotite-monzonite, varying to more dioritic
composition, and minor syenite. The principal host phase of the Cherry Creek is a
magnetic fine- to medium-grained porphyritic pyroxene-hornblende monzodiorite which
forms a wedge of intrusive breccia between the Nicola and Pothook rocks. Contacts to
the west and southwest are with Nicola Group volcanic rocks and to the east and
southeast with the Pothook diorite.

SCOTT WILSON RPA www.scottwilson.com
New Gold Inc. – New Afton Project Technical Report NI 43-101 – December 31, 2009 Page 1-12
The Project area is traversed by regional-scale fault zones which are believed to be the
principal control to intrusion of the batholithic rocks, as well as the mineralization
processes. North- to northwest-trending steep to moderate-dipping fault zones are
primary controlling structures for emplacement of the Iron Mask intrusives. East- to
northeast-trending faults are important controls to hydrothermal alteration and
mineralization. The faulting and associated fracturing also provided conduits for
meteoric waters, which gave rise to weathering and supergene enrichment of the
primary sulphide mineralization.
A steeply dipping body of serpentinized and sheared picrite has been entrained within
the Hanging Wall Fault, a major structural control to the New Afton deposit. This unit
separates strongly mineralized, pyrite-poor, potassically altered monzodiorite to the
northwest from pyritic, sericite-carbonate-clay-chlorite-altered monzodiorite to the
southeast. Ground conditions within the picrite are poor, which has hampered efforts to
drill through it. As a result, drill information on the hanging wall side of the picrite is
limited.
The bulk of the deposit occupies a large tabular mass measuring 900 m long by
approximately 100 m wide and spanning a vertical distance of approximately 350 m.
The zone dips vertically to steeply south-southeast and plunges at moderate angles to
the southwest. Two subsidiary satellite bodies occur to the northeast of the Main Zone.
One of these zones appears to branch off of the Main Zone and strikes in a somewhat
more easterly trend, dipping steeply to the south-southeast. The other, which is further
away from the Main Zone has a similar strike to the Main Zone but dips at a flatter angle
(approximately 60° southeast).
The deposit is porphyry-style, with very distinct structural controls. The primary
mineralizing event was preceded by development of disseminated magnetite-pyrite.
Primary economic sulphide mineralization occurred in association with potassic
alteration (principally K-spar) resulting in destruction of the earlier magnetite-pyrite
assemblage. Following this, carbonate veinlets (principally ankerite) developed along
and surrounding the faults, along with varying amounts of pyrite, clay gouge, and
sericite.
SCOTT WILSON RPA www.scottwilson.com
New Gold Inc. – New Afton Project Technical Report NI 43-101 – December 31, 2009 Page 1-13
Subsequent faulting reshuffled portions of the deposit in a manner that is not completely
understood. This has resulted in truncation of the zone along the Hanging Wall Fault in
places, and apparent displacement of mineralized blocks. These blocks may occur as
isolated pods in the hanging wall or may also be situated adjacent to the Main Zone
such that they appear to comprise a continuous body of mineralization crossing the fault.
DRILLING All drilling completed to date on the Project has been diamond core drilling, conducted in
a series of programs over a period spanning 2000 to 2008. Most of the drilling has been
for exploration and resource definition. However, in recent years (2007 and later),
geotechnical holes have been drilled for groundwater monitoring and collection of data
for mine design. To date, 277 holes have been drilled for a total of 130,439 m.
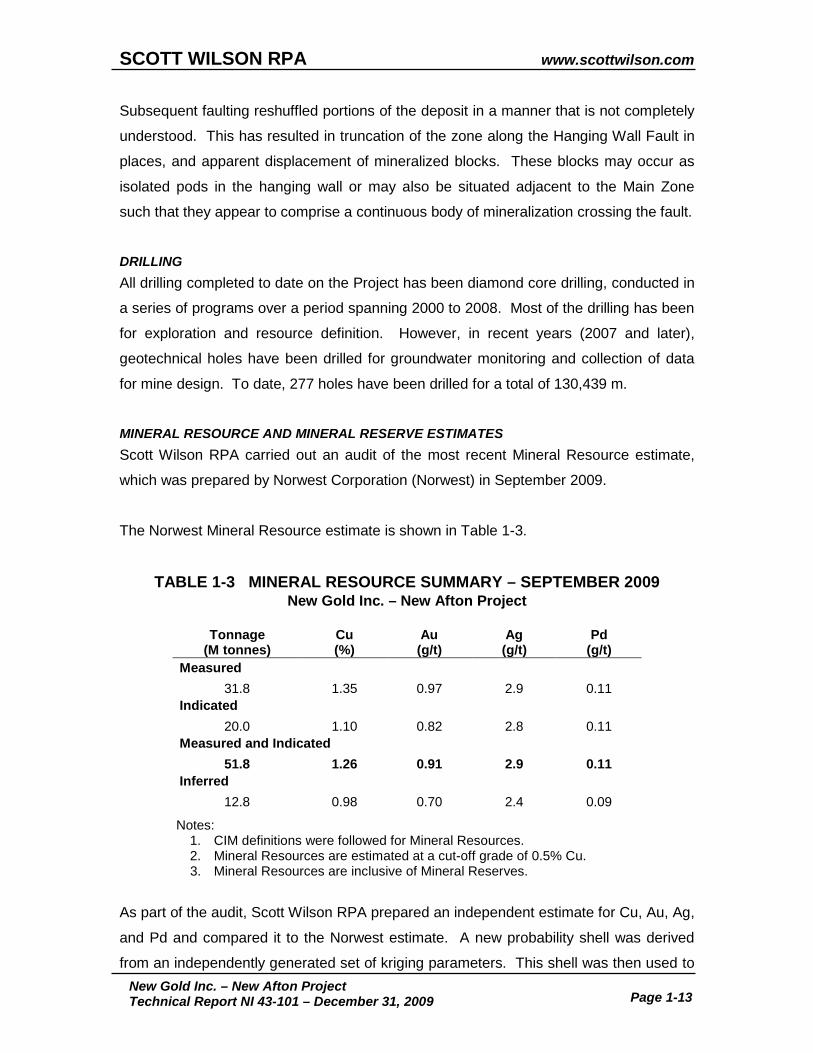
MINERAL RESOURCE AND MINERAL RESERVE ESTIMATES Scott Wilson RPA carried out an audit of the most recent Mineral Resource estimate,
which was prepared by Norwest Corporation (Norwest) in September 2009.
The Norwest Mineral Resource estimate is shown in Table 1-3.
TABLE 1-3 MINERAL RESOURCE SUMMARY – SEPTEMBER 2009 New Gold Inc. – New Afton Project
Tonnage
(M tonnes) Cu (%)
Au (g/t)
Ag (g/t)
Pd (g/t)
Measured 31.8 1.35 0.97 2.9 0.11
Indicated 20.0 1.10 0.82 2.8 0.11
Measured and Indicated 51.8 1.26 0.91 2.9 0.11
Inferred 12.8 0.98 0.70 2.4 0.09
Notes: 1. CIM definitions were followed for Mineral Resources. 2. Mineral Resources are estimated at a cut-off grade of 0.5% Cu. 3. Mineral Resources are inclusive of Mineral Reserves.
As part of the audit, Scott Wilson RPA prepared an independent estimate for Cu, Au, Ag,
and Pd and compared it to the Norwest estimate. A new probability shell was derived
from an independently generated set of kriging parameters. This shell was then used to
SCOTT WILSON RPA www.scottwilson.com
New Gold Inc. – New Afton Project Technical Report NI 43-101 – December 31, 2009 Page 1-14
assign domains to the blocks and composites. Geostatistical analyses were carried out
to derive variogram models, which were somewhat different from those generated by
Norwest. Capping, search parameters, and classification criteria were kept the same as
for the original models.
There is very little difference between the Norwest and Scott Wilson RPA estimates,
which, in Scott Wilson RPA’s opinion, provides additional validation of the Norwest
model. Scott Wilson RPA also notes that the global estimate appears to be quite
insensitive to variations in either the probability shell or the variogram models.
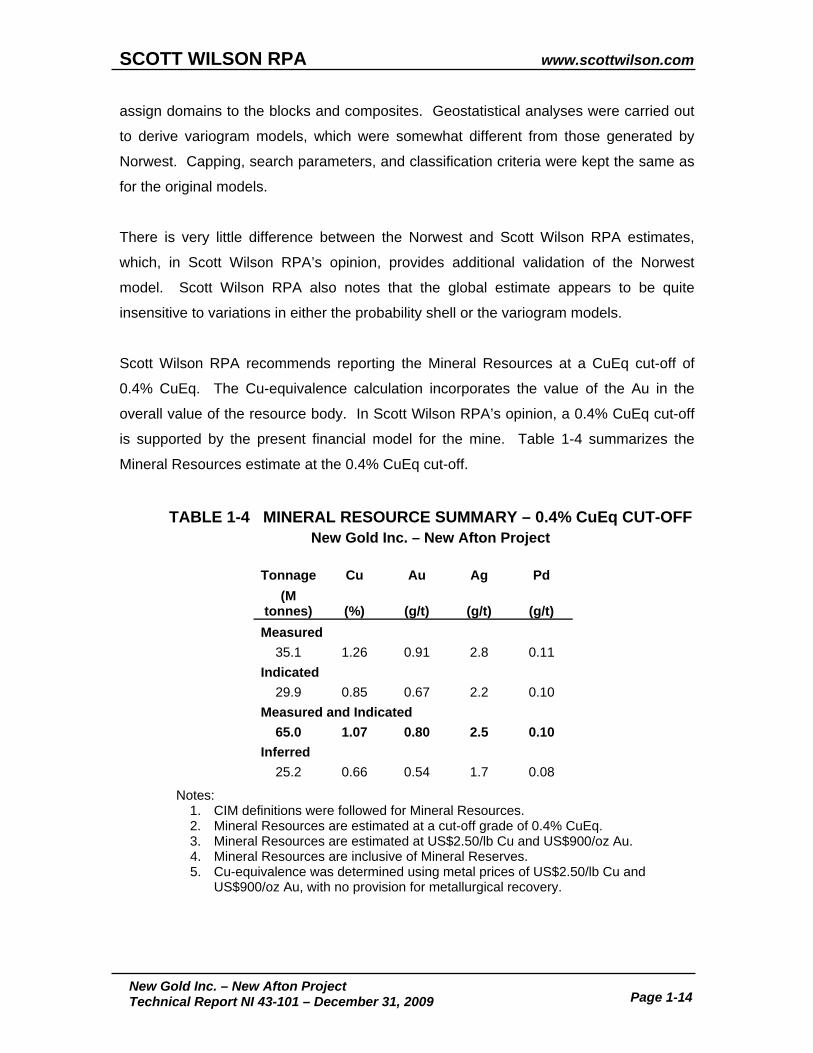
Scott Wilson RPA recommends reporting the Mineral Resources at a CuEq cut-off of
0.4% CuEq. The Cu-equivalence calculation incorporates the value of the Au in the
overall value of the resource body. In Scott Wilson RPA’s opinion, a 0.4% CuEq cut-off
is supported by the present financial model for the mine. Table 1-4 summarizes the
Mineral Resources estimate at the 0.4% CuEq cut-off.
TABLE 1-4 MINERAL RESOURCE SUMMARY – 0.4% CuEq CUT-OFF New Gold Inc. – New Afton Project
Tonnage Cu Au Ag Pd
(M tonnes) (%) (g/t) (g/t) (g/t) Measured
35.1 1.26 0.91 2.8 0.11 Indicated
29.9 0.85 0.67 2.2 0.10 Measured and Indicated
65.0 1.07 0.80 2.5 0.10 Inferred
25.2 0.66 0.54 1.7 0.08
Notes: 1. CIM definitions were followed for Mineral Resources. 2. Mineral Resources are estimated at a cut-off grade of 0.4% CuEq. 3. Mineral Resources are estimated at US$2.50/lb Cu and US$900/oz Au. 4. Mineral Resources are inclusive of Mineral Reserves. 5. Cu-equivalence was determined using metal prices of US$2.50/lb Cu and
US$900/oz Au, with no provision for metallurgical recovery.

SCOTT WILSON RPA www.scottwilson.com
New Gold Inc. – New Afton Project Technical Report NI 43-101 – December 31, 2009 Page 1-15
The Mineral Reserve estimate is shown in Table 1-5. The estimate is based on the
resource block model prepared by New Gold and reviewed by Scott Wilson RPA.
TABLE 1-5 MINERAL RESERVE ESTIMATE – SEPTEMBER 2009 New Gold Inc. – New Afton Project
Category Tonnage
(M tonnes) Cu (%)
Au (g/t)
Ag (g/t)
Probable 47.4 0.95 0.69 2.03
Notes: 1. CIM definitions were followed for Mineral Reserves. 2. Mineral Reserves are estimated at an NSR cut-off grade of $19/t. 3. Mineral Reserves are estimated at US$2.00/lb Cu and US$800/oz Au and a C$/US$
exchange rate of 0.85. 4. Metallurgical recoveries for copper vary from 69% to 89%.
MINING The New Afton deposit is being developed as a block cave mining operation to produce
4 Mtpa of copper-gold ore for processing in a flotation plant for the recovery of copper in
concentrates and gold in concentrates. Underground development is underway using
New Gold crews which replaced the mining contractor crews and commenced
development in February 2009. There is supporting infrastructure at the site including
access, offices, staff, equipment, and a concrete batch plant. The new mill building has
been erected and the grinding mills are mechanically installed. No significant surface
construction was underway at the time of the site visit and the focus is on underground
development and project planning and engineering. This report considers the
development of the Project from the end of the second quarter of 2009 onwards.
Engineering studies have indicated that the New Afton deposit is amenable to block
caving and the Mineral Reserves have been estimated through the application of
Gemcom’s block cave modelling software (PCBC) to determine the mine production
schedules. The deposit has been broken into three zones, B1, B2, and B3. The B1 and
B2 blocks are closer to surface and will provide the initial mine production. Both the B1
and B2 blocks are expected to cave readily. The B3 block is deeper and the rock is
more competent so that caving is marginal and it may be necessary to implement some
additional work to assist the cave development.
SCOTT WILSON RPA www.scottwilson.com
New Gold Inc. – New Afton Project Technical Report NI 43-101 – December 31, 2009 Page 1-16
The B1 and B2 block undercut is approximately 120 m above the B3 undercut. At each
block an undercut will be developed along with an extraction level. At the extraction
level, drawpoints will be developed on a 13 m spacing. Ore will be mucked by load-haul-
dump (LHD) units and hauled to ore passes to drop to a tramming level 14 m below,
from where the ore will be trammed by large LHDs to the crusher. Ore from the B3 block
will be hauled by 50-tonne truck to the crusher level. From the crusher the ore will be
conveyed to the mill via a 4.5 km long conveyor system.
The mine is accessed by two portals for development, one in the open pit and the other
being the conveyor portal near the mill. With the subsidence due to caving, the drift from
the open pit will be lost and the secondary exit will be by conveyance in a ventilation
borehole.
MINERAL PROCESSING The New Afton mill has been designed to process 11,000 tpd, or 4 Mtpa, of ore at full
capacity and recover copper, gold, and silver.
The mill will process a blend of primary, transition, and supergene ores. The process will
utilize conventional crushing, grinding, and concentration processes to separate valuable
minerals from gangue into concentrates at marketable grades. Mineral separation will be
achieved by gravity concentration and differential flotation. A regrinding stage will be
included in the flotation circuit.
The tailings handling system will pump the combined tailings (from the rougher flotation
circuit and the cleaner scavenger circuit) to the Cyclone Plant, a set of primary cyclones
located adjacent to the tailings storage facility (TSF).
The cyclone underflow product will be delivered to a skid-mounted secondary cyclone
pack located on the top of the tailings dam. The sand or coarse fraction from these
secondary cyclones will be used to construct the tailings dam and the secondary cyclone
overflow product will be used to seal the wet side of that dam. A centreline construction
method will be used to establish the tailings dam structure. There will be three seepage
collection ponds below the dry side of the main tailings dam to recover and return
seepage back to the TSF.
SCOTT WILSON RPA www.scottwilson.com
New Gold Inc. – New Afton Project Technical Report NI 43-101 – December 31, 2009 Page 1-17
ENVIRONMENTALMuch of the Project area has been greatly altered such that natural undulating has been
replaced by level rock dumps, open pits, and severely compacted borrow areas. The
dominant water bodies are now related to mining-related impoundments. The baseline
environmental studies undertaken considered both the natural and anthropogenic
landscapes. Environmental baseline studies were undertaken on the Project site
between April and December 2006. All baseline studies were implemented in
accordance with provincial data collection guidelines where applicable, and generally
accepted scientific procedures.
On October 31, 2007, the Ministry of Energy, Mines and Petroleum Resources (MEMPR)
issued Mine Permit M229 approving the work system and reclamation program in
respect of the New Afton Project. The Mine Permit obligates the New Gold to post
reclamation security in the aggregate amount of $9.5 million. The initial installment of
$3.5 million was posted by the New Gold.
New Gold has entered into an agreement with local First Nations to pay a royalty on the
value of the product with a set minimum annual royalty.
CAPITAL AND OPERATING COSTS The remaining preproduction capital budget for the Project is C$460.9 million in Q2 2009
Canadian dollars. Sunk costs are not included in the capital summary. Capital cost
estimates have been prepared by AMEC, New Gold, and AMC Mining Consultants
(Canada) (AMC) in the course of the detailed engineering work which was being done by
AMEC until mid-2009.
Capital cost estimate revisions and adjustments continue as Project optimization tasks
are still underway. The mine capital costs are built up from first principles for the mine
development activities together with quotations for major equipment items. The
sustaining capital estimate for the life of the mine is C$172.3 million.
The life of mine operating cost is estimated to be C$17.27 per tonne milled. The costs
do not include concentrate shipping or treatment, nor do they include corporate
overheads. Operating costs have been compiled by New Gold and AMC. The costs for
all areas were built up from first principles with a high level of detail in the cost build-up.

SCOTT WILSON RPA www.scottwilson.com
New Gold Inc. – New Afton Project Technical Report NI 43-101 – December 31, 2009 Page 1-18
PROJECT EXECUTION PLAN Development of the New Afton Project is underway, with the underground development
being undertaken by company crews. A Project team is in place with administrative,
technical (geology, mine and mill) and mine development personnel on staff. There are
also engineering consultants supporting the group.
The current Project schedule is not in a finished form; this is an aspect of the Project
planning which Scott Wilson RPA recommends be addressed to generate a
comprehensive Project development schedule including all of the changes in the Project
since the 2007 Feasibility Study.
Mine development is scheduled to continue until and after the commencement of
production. The development of the B3 zone has been deferred to reduce the upfront
capital costs. Mill construction is forecast to recommence at the start of 2011, with the
mill planned to be in commissioning mode in Q2 of 2012 and operating at the start of Q3
2012.
New Gold will continue to use AMEC for engineering and procurement, but will do
construction management for the remaining mill construction packages with its own
team, led by a recently hired construction manager.

SCOTT WILSON RPA www.scottwilson.com
New Gold Inc. – New Afton Project Technical Report NI 43-101 – December 31, 2009 Page 2-1
2 INTRODUCTION Scott Wilson Roscoe Postle Associates Inc. (Scott Wilson RPA) was retained by Mr.
Mark Petersen, Vice President, Exploration, of New Gold Inc. (New Gold), to prepare an
independent Technical Report and Feasibility Update on the New Afton Cu-Au-Ag-Pd
Project (the Project) near Kamloops, British Columbia, Canada. The purpose of this
report is to support the public disclosure of updated Mineral Resources and Mineral
Reserves for the Project. This Technical Report conforms to NI 43-101 Standards of
Disclosure for Mineral Projects (NI 43-101). Scott Wilson RPA visited the property on
September 3 and 4, 2009.
New Gold is a publicly traded mining company, focused on gold production, with
operations in the United States, Mexico, and Australia. New Gold’s corporate offices are
located in Vancouver, British Columbia and Toronto, Ontario. The company is listed on
Toronto (TSX:NGD) and New York (NYSE: AMEX) stock exchanges.
New Afton is a former producer which operated an open pit mine from 1977 to 1987.
New Gold acquired an option on the New Afton property in 1999 and began exploration
work in 2000. The Project is in the development stage and is a planned 11,000 tpd
(nominal) block cave operation scheduled to commence milling in mid-2012. Copper
and gold concentrates will be produced at the Project. Development commenced in
2007 but, except for engineering and other limited activities, was halted due to the global
economic conditions in the third quarter of 2008. Underground development was
underway at the time of the site visit and surface construction is scheduled to restart in
2010.
Currently, the major assets and facilities associated with the Project are:
• The resources and reserves of the New Afton copper gold deposit.
• Site access from the Trans-Canada Highway which is immediately adjacent to the site.
• Underground mine workings including a conveyor gallery, a second access from the open pit, and ventilation raises to surface.
• Facilities providing basic infrastructure to the mine, including electric power, heat, water supply, communications, and mine offices.

SCOTT WILSON RPA www.scottwilson.com
New Gold Inc. – New Afton Project Technical Report NI 43-101 – December 31, 2009 Page 2-2
• An underground mobile equipment fleet and support facilities at both the upper, conveyor gallery portal and the portal in the open pit.
• Dewatering facilities for pumping from the open pit to a storage area in
Pothook Lake, which has been bermed to increase its storage capacity. • Construction support equipment including a concrete batch plant and trucks
for the delivery of concrete and surface support equipment. • Engineering and administration offices, mine dry and first aid facilities. • A new concentrator building with the semi-autogenous grinding (SAG) mill,
ball mill, and vertical mill mechanically installed. • Various mill equipment parts stored on site in preparation for installation. • A partially cleared and prepared tailings storage facility. • Site access roads. • A mine development permit issued by the British Columbia government.
Prior Scott Wilson RPA involvement is as follows:
• Conducted an audit of the Mineral Resource estimate; issued a Technical Report in 2006 (Wallis and Giroux, 2006).
• Prepared a Mineral Resource estimate for the Project in 2006 and updated the estimate in 2007.
• Participated in a Feasibility Study for the Project (Mineral Resources); Technical Report issued April 2007 (Hatch, 2007).
SOURCES OF INFORMATION Site visits were carried out by David Rennie, P.Eng., Scott Wilson RPA Principal
Geologist, and Dennis Bergen, P.Eng., Scott Wilson RPA Associate Principal Mining
Engineer.
Discussions were held with personnel from New Gold:
• Mr. David Nicholls, Manager of Technical Services • Mr. Nick Kwong, Project Engineer • Mr. Eric Strom, Senior Mine Engineer • Mr. Craig Lockhart, Maintenance and Surface Manager • Ms. Jane McCaw, Database and Land Specialist • Mr. Daniel Kahler, AMC Consultants

SCOTT WILSON RPA www.scottwilson.com
New Gold Inc. – New Afton Project Technical Report NI 43-101 – December 31, 2009 Page 2-3
• Mr. Richard Hall, Geologist • Mr. Brian Bower, Geologist
The geology and Mineral Resource sections of this report were prepared by David
Rennie, P. Eng. Metallurgy sections were prepared by Kevin Scott, P. Eng., Principal
Metallurgist for Scott Wilson RPA. The mining, permitting, conversion of mineral
resources to reserves, and financial model sections were prepared by Dennis Bergen, P.
Eng., Associate Principal Mining Engineer for Scott Wilson RPA.
The documentation reviewed, and other sources of information, are listed at the end of
this report in Section 22, References.
SCOTT WILSON RPA www.scottwilson.com
New Gold Inc. – New Afton Project Technical Report NI 43-101 – December 31, 2009 Page 2-4
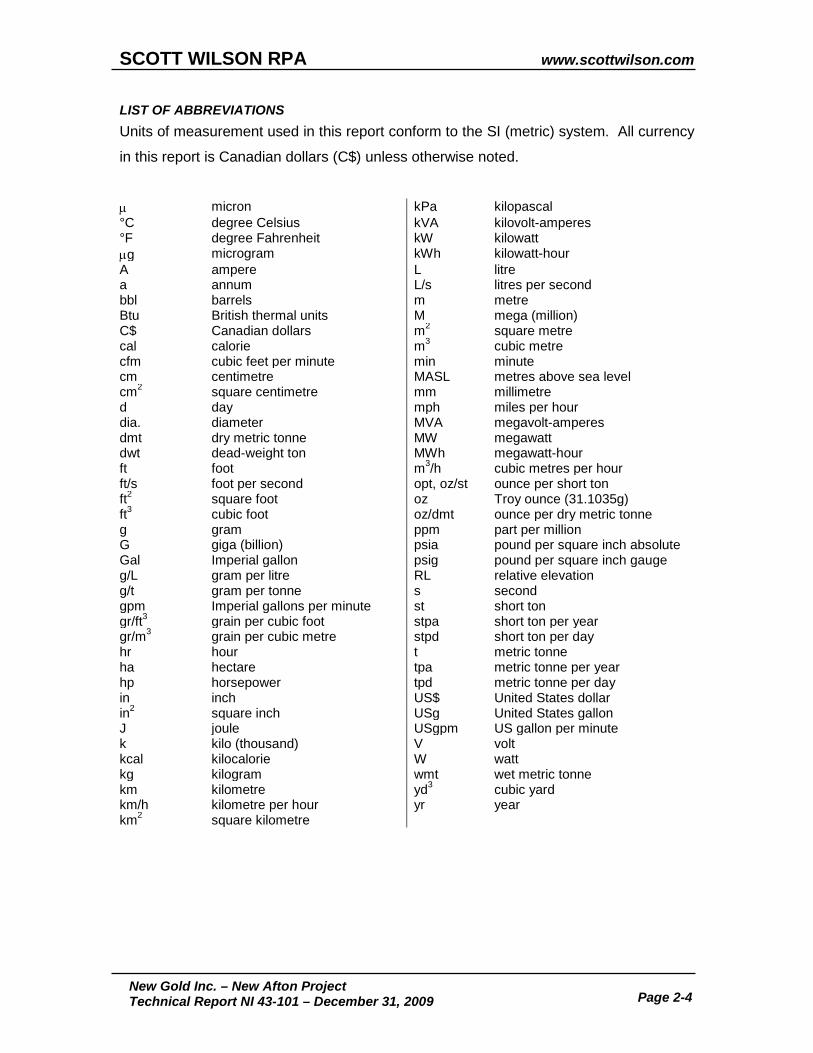
LIST OF ABBREVIATIONS Units of measurement used in this report conform to the SI (metric) system. All currency
in this report is Canadian dollars (C$) unless otherwise noted.
µ micron kPa kilopascal °C degree Celsius kVA kilovolt-amperes °F degree Fahrenheit kW kilowatt µg microgram kWh kilowatt-hour A ampere L litre a annum L/s litres per second bbl barrels m metre Btu British thermal units M mega (million) C$ Canadian dollars m2 square metre cal calorie m3 cubic metre cfm cubic feet per minute min minute cm centimetre MASL metres above sea level cm2 square centimetre mm millimetre d day mph miles per hour dia. diameter MVA megavolt-amperes dmt dry metric tonne MW megawatt dwt dead-weight ton MWh megawatt-hour ft foot m3/h cubic metres per hour ft/s foot per second opt, oz/st ounce per short ton ft2 square foot oz Troy ounce (31.1035g) ft3 cubic foot oz/dmt ounce per dry metric tonne g gram ppm part per million G giga (billion) psia pound per square inch absolute Gal Imperial gallon psig pound per square inch gauge g/L gram per litre RL relative elevation g/t gram per tonne s second gpm Imperial gallons per minute st short ton gr/ft3 grain per cubic foot stpa short ton per year gr/m3 grain per cubic metre stpd short ton per day hr hour t metric tonne ha hectare tpa metric tonne per year hp horsepower tpd metric tonne per day in inch US$ United States dollar in2 square inch USg United States gallon J joule USgpm US gallon per minute k kilo (thousand) V volt kcal kilocalorie W watt kg kilogram wmt wet metric tonne km kilometre yd3 cubic yard km/h kilometre per hour yr year km2 square kilometre
SCOTT WILSON RPA www.scottwilson.com
New Gold Inc. – New Afton Project Technical Report NI 43-101 – December 31, 2009 Page 3-1
3 RELIANCE ON OTHER EXPERTS This report has been prepared by Scott Wilson Roscoe Postle Associates Inc. (Scott
Wilson RPA) for New Gold Inc. (New Gold). The information, conclusions, opinions, and
estimates contained herein are based on:
• Information available to Scott Wilson RPA at the time of preparation of this report,
• Assumptions, conditions, and qualifications as set forth in this report, and • Data, reports, and other information supplied by New Gold and other third
party sources.
For the purpose of this report, Scott Wilson RPA has relied on ownership information
provided by New Gold. Scott Wilson RPA has not researched property title or mineral
rights for the New Afton Project and expresses no opinion as to the ownership status of
the property.
Scott Wilson RPA has relied on New Gold for guidance on applicable taxes, royalties,
and other government levies or interests, applicable to revenue or income from the New
Afton Project
Except for the purposes legislated under provincial securities laws, any use of this report
by any third party is at that party’s sole risk.
SCOTT WILSON RPA www.scottwilson.com
New Gold Inc. – New Afton Project Technical Report NI 43-101 – December 31, 2009 Page 4-1
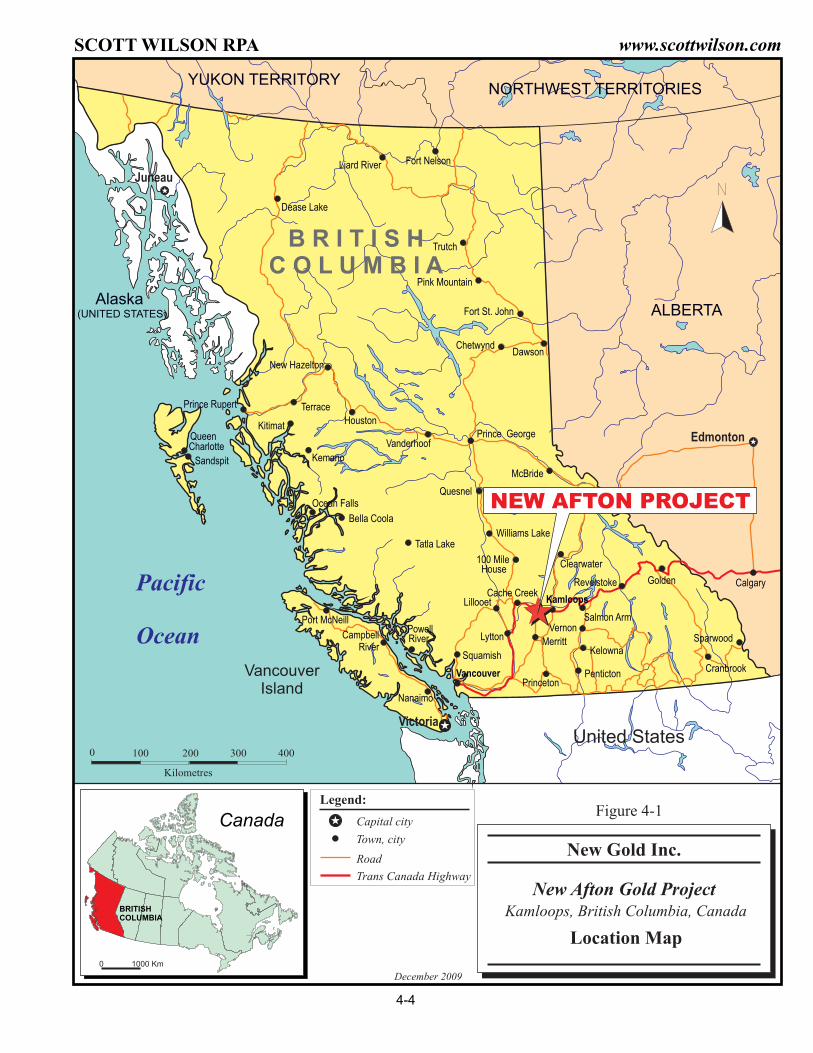
4 PROPERTY DESCRIPTION AND LOCATION The New Afton Project is located at Latitude 50°39’ north and Longitude 120°31’ west,
approximately 350 km northeast of Vancouver and 10 km west of the City of Kamloops,
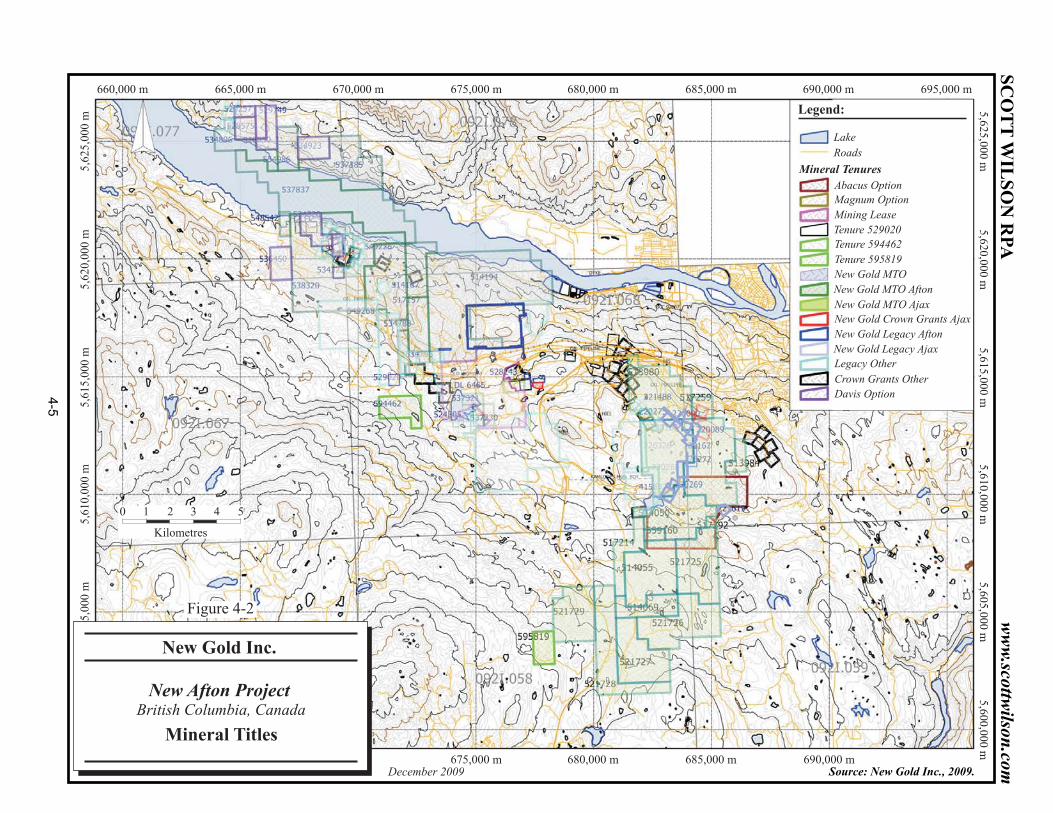
in the South-Central Interior of British Columbia (Figure 4-1). New Gold’s holdings in the
Project area comprise two groups, Afton and Ajax. The New Afton deposit lies within the
Afton Group. The Afton Group consists of 44 mineral claims that have been converted
to the new grid staking system (Figure 4-2). A list of these claims is provided in Table 4-
1. A portion of the Afton claims have been surveyed and are included in a mining lease,
which was issued on November 9, 2006 (Figure 4-2). Total area of all claims and the
lease is 7,352.7 ha.
The project survey control is based on the Universal Transverse Mercator (UTM)
coordinate system. It is based on the Zone 10 North projection, using the World
Geodetic System 1984 (WGS’84) datum. The UTM coordinates place the New Afton
project at 5,614,800N and 675,500E at a surface elevation of 700 MASL.
LAND TENURE New Gold holds surface rights for approximately 4,300 acres surrounding the New Afton
Project, purchased from subsidiaries of Teck Resources Limited (Teck) on October 25,
2007. The terms of the purchase agreement provide title to fee simple land, a covenant
to obtain a release of grazing leases, and access to surface improvements, including a
water pipeline to the site from Kamloops Lake.
Reclamation permits covering the existing pits, plant facility and tailings pond, issued by
the British Columbia Ministry of Energy and Mines, are held in the name of the previous
operator, Teck.
Under an Option to Purchase Agreement (“the Option”) dated September 22, 1999, DRC
Resources Corporation (DRC), the predecessor company to New Gold, acquired the
exclusive right for 90 days to purchase a 100% undivided working interest in the Afton 1
– 11 (the “Original Claims”) as to 50% from Westridge Enterprises Ltd., a non-reporting
British Columbia company wholly owned by John H. Kruzick, a director of DRC, and as
SCOTT WILSON RPA www.scottwilson.com
New Gold Inc. – New Afton Project Technical Report NI 43-101 – December 31, 2009 Page 4-2
to 50% from Indo-Gold Development Ltd., a non-reporting British Columbia company
owned by John Ball, a geologist (the “Optionors”). The Option provided for consideration
to be a 10% Net Profit Royalty (NPR) and a property management agreement with the
Optionors. The terms of the agreement required a series of payments in shares and
expenditure, totalling 2 million shares and $6.5 million in expenditures over a nine year
time frame. The payments and work expenditures have been completed as required and
New Gold now owns the property subject to a 10% NPR.
On June 27, 2002, New Gold acquired an option exercisable on or before December 1,
2010, to purchase the Optionors’ 10% NPR for a cash consideration of $2 million and
the Option was amended by removing the exclusive right of the Optionors to act as the
operators of the New Afton Cu-Au Project. In addition to the Original Claims, New Gold
has staked other claims for its own account to consolidate its land position at the Project.
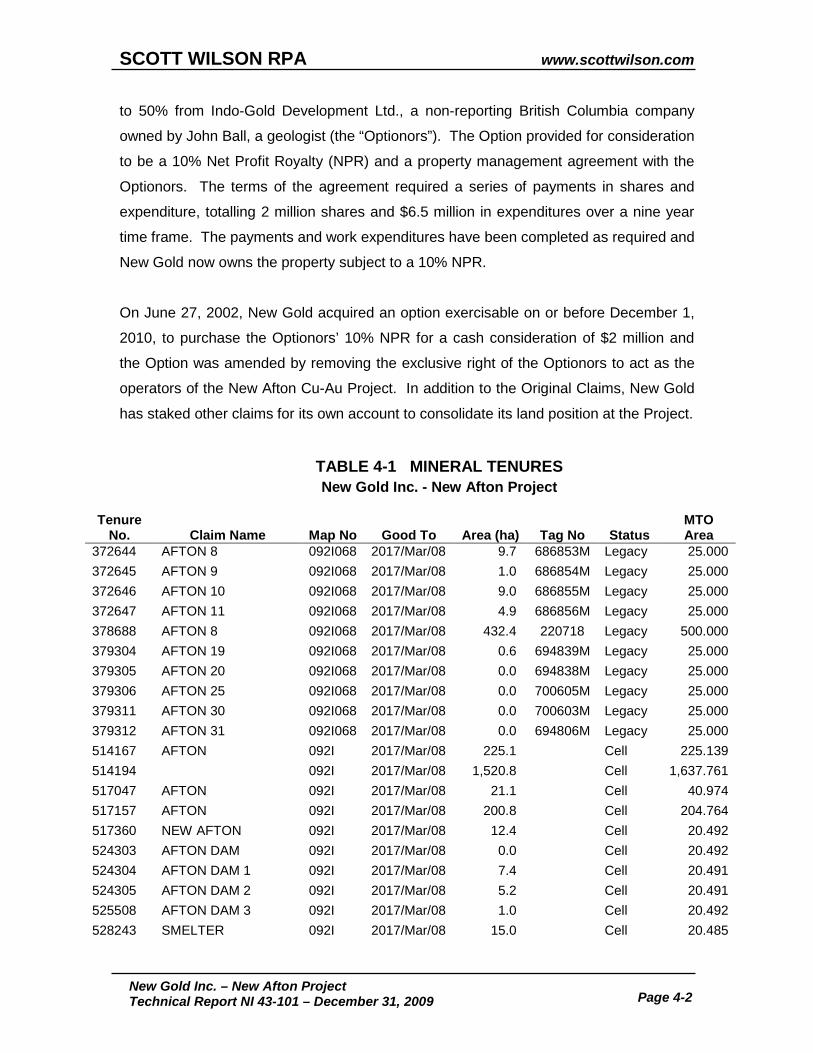
TABLE 4-1 MINERAL TENURES New Gold Inc. - New Afton Project
Tenure
No. Claim Name Map No Good To Area (ha) Tag No Status MTO Area
372644 AFTON 8 092I068 2017/Mar/08 9.7 686853M Legacy 25.000 372645 AFTON 9 092I068 2017/Mar/08 1.0 686854M Legacy 25.000 372646 AFTON 10 092I068 2017/Mar/08 9.0 686855M Legacy 25.000 372647 AFTON 11 092I068 2017/Mar/08 4.9 686856M Legacy 25.000 378688 AFTON 8 092I068 2017/Mar/08 432.4 220718 Legacy 500.000 379304 AFTON 19 092I068 2017/Mar/08 0.6 694839M Legacy 25.000 379305 AFTON 20 092I068 2017/Mar/08 0.0 694838M Legacy 25.000 379306 AFTON 25 092I068 2017/Mar/08 0.0 700605M Legacy 25.000 379311 AFTON 30 092I068 2017/Mar/08 0.0 700603M Legacy 25.000 379312 AFTON 31 092I068 2017/Mar/08 0.0 694806M Legacy 25.000 514167 AFTON 092I 2017/Mar/08 225.1 Cell 225.139 514194 092I 2017/Mar/08 1,520.8 Cell 1,637.761 517047 AFTON 092I 2017/Mar/08 21.1 Cell 40.974 517157 AFTON 092I 2017/Mar/08 200.8 Cell 204.764 517360 NEW AFTON 092I 2017/Mar/08 12.4 Cell 20.492 524303 AFTON DAM 092I 2017/Mar/08 0.0 Cell 20.492 524304 AFTON DAM 1 092I 2017/Mar/08 7.4 Cell 20.491 524305 AFTON DAM 2 092I 2017/Mar/08 5.2 Cell 20.491 525508 AFTON DAM 3 092I 2017/Mar/08 1.0 Cell 20.492 528243 SMELTER 092I 2017/Mar/08 15.0 Cell 20.485
SCOTT WILSON RPA www.scottwilson.com
New Gold Inc. – New Afton Project Technical Report NI 43-101 – December 31, 2009 Page 4-3
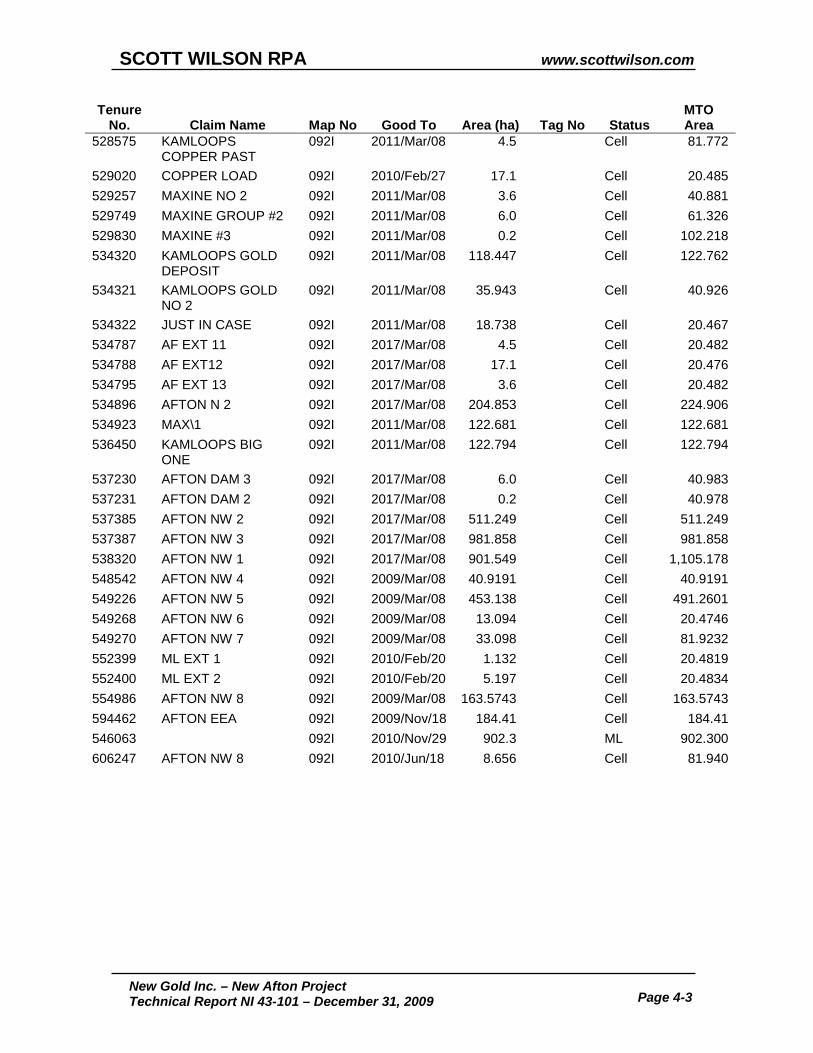
Tenure No. Claim Name Map No Good To Area (ha) Tag No Status
MTO Area
528575 KAMLOOPS COPPER PAST
092I 2011/Mar/08 4.5 Cell 81.772
529020 COPPER LOAD 092I 2010/Feb/27 17.1 Cell 20.485 529257 MAXINE NO 2 092I 2011/Mar/08 3.6 Cell 40.881 529749 MAXINE GROUP #2 092I 2011/Mar/08 6.0 Cell 61.326 529830 MAXINE #3 092I 2011/Mar/08 0.2 Cell 102.218 534320 KAMLOOPS GOLD
DEPOSIT 092I 2011/Mar/08 118.447 Cell 122.762
534321 KAMLOOPS GOLD NO 2
092I 2011/Mar/08 35.943 Cell 40.926
534322 JUST IN CASE 092I 2011/Mar/08 18.738 Cell 20.467 534787 AF EXT 11 092I 2017/Mar/08 4.5 Cell 20.482 534788 AF EXT12 092I 2017/Mar/08 17.1 Cell 20.476 534795 AF EXT 13 092I 2017/Mar/08 3.6 Cell 20.482 534896 AFTON N 2 092I 2017/Mar/08 204.853 Cell 224.906 534923 MAX\1 092I 2011/Mar/08 122.681 Cell 122.681 536450 KAMLOOPS BIG
ONE 092I 2011/Mar/08 122.794 Cell 122.794
537230 AFTON DAM 3 092I 2017/Mar/08 6.0 Cell 40.983 537231 AFTON DAM 2 092I 2017/Mar/08 0.2 Cell 40.978 537385 AFTON NW 2 092I 2017/Mar/08 511.249 Cell 511.249 537387 AFTON NW 3 092I 2017/Mar/08 981.858 Cell 981.858 538320 AFTON NW 1 092I 2017/Mar/08 901.549 Cell 1,105.178 548542 AFTON NW 4 092I 2009/Mar/08 40.9191 Cell 40.9191 549226 AFTON NW 5 092I 2009/Mar/08 453.138 Cell 491.2601 549268 AFTON NW 6 092I 2009/Mar/08 13.094 Cell 20.4746 549270 AFTON NW 7 092I 2009/Mar/08 33.098 Cell 81.9232 552399 ML EXT 1 092I 2010/Feb/20 1.132 Cell 20.4819 552400 ML EXT 2 092I 2010/Feb/20 5.197 Cell 20.4834 554986 AFTON NW 8 092I 2009/Mar/08 163.5743 Cell 163.5743 594462 AFTON EEA 092I 2009/Nov/18 184.41 Cell 184.41 546063 092I 2010/Nov/29 902.3 ML 902.300 606247 AFTON NW 8 092I 2010/Jun/18 8.656 Cell 81.940
Alaska(UNITED STATES)
United States
Pacific
Ocean
YUKON TERRITORYNORTHWEST TERRITORIES
ALBERTA
B R I T I S H
C O L U M B I A
VancouverIsland
Port McNeill
CampbellRiver
PowellRiver
Vancouver
Nanaimo
Kamloops
Merritt
Penticton
Vernon
Kelowna
Calgary
Princeton
Salmon Arm
Clearwater
Quesnel
Williams Lake
100 MileHouse
McBride
Prince GeorgeVanderhoof
Bella Coola
Tatla Lake
Ocean Falls
Kitimat
Terrace
Houston
Kemano
New Hazelton
DawsonChetwynd
Fort St. John
Pink Mountain
Trutch
Fort NelsonLiard River
Dease Lake
Cranbrook
Sparwood
GoldenRevelstoke
Prince Rupert
CharlotteQueen
Sandspit
Lillooet
Squamish
Lytton
Cache Creek
NEW AFTON PROJECT
Victoria
Edmonton
Juneau
Canada
BRITISH
COLUMBIA
0 1000 Km
0 100 400
Kilometres
300200
N
December 2009
Legend:
Capital city
Town, city
Trans Canada Highway
Road
Location Map
New Afton Gold Project
New Gold Inc.
Kamloops, British Columbia, Canada
Figure 4-1
4-4
SCOTT WILSON RPA www.scottwilson.com
660,000 m 685,000 m5,6
20,0
00 m
680,000 m5,6
15,0
00 m
670,000 m5,6
05,0
00 m
675,000 m5,6
10,0
00 m
665,000 m5,6
00,0
00 m
695,000 m690,000 m5,6
25,0
00 m
5,6
20,0
00 m
5,6
15,0
00 m
5,6
05,0
00 m
5,6
10,0
00 m
5,6
00,0
00 m
5,6
25,0
00 m
685,000 m680,000 m675,000 m 690,000 m
Legend:
Lake
Abacus Option
Roads
Magnum Option
Mining Lease
Tenure 594462
Tenure 529020
Tenure 595819
New Gold MTO
New Gold MTO Ajax
New Gold MTO Afton
New Gold Crown Grants Ajax
New Gold Legacy Afton
Legacy Other
New Gold Legacy Ajax
Crown Grants Other
Davis Option
Mineral Tenures
0 1 5
Kilometres
2 3 4
December 2009 Source: New Gold Inc., 2009.
New Afton Project
Mineral Titles
New Gold Inc.
British Columbia, Canada
Figure 4-2
SC
OT
TW
ILS
ON
RP
A
4-5
ww
w.sco
ttwilso
n.co
m
SCOTT WILSON RPA www.scottwilson.com
New Gold Inc. – New Afton Project Technical Report NI 43-101 – December 31, 2009 Page 5-1
5 ACCESSIBILITY, CLIMATE, LOCAL RESOURCES, INFRASTRUCTURE AND PHYSIOGRAPHY ACCESSIBILITY The New Afton Project is located 350 km northeast of Vancouver and 10 km west of
Kamloops, British Columbia, in the South-Central Interior of British Columbia, on the site
of the past producing Afton Mine, a previous operation of Teck. The Project is located
on the south side of the Thompson River Valley. Trans-Canada Highway No. 1 passes,
several kilometres west of its junction with the Coquihalla Highway No. 5, through the
middle of the Afton mining lease. Access to the mine site is by a mine road located off of
the Trans-Canada Highway.
CLIMATE The Kamloops area is in the rain shadow of the Coast Mountains. Precipitation is minor,
averaging about 257 mm annually (of which 175 mm is rainfall), with light winter snow
and infrequent rain in the spring and fall. The area has warm summers where
temperatures can reach 38°C and cool winters where temperatures hover around the
freezing mark. During the winter, short periods of cold weather can occur where
temperatures drop to as low as -29°C.
LOCAL RESOURCES Kamloops is a major transportation hub for highway, air, and railroad. Forestry,
ranching, mining, and tourism are the most important economic activities in the area.
The city has an airport with daily air service from Vancouver, British Columbia, and
Calgary, Alberta, and is serviced by both Canadian National and Canadian Pacific
Railways. Kamloops is a natural resource-based city of 80,000 people. The area has a
ready supply of trained workers and professionals and has suppliers and contractors to
support heavy industry.
SCOTT WILSON RPA www.scottwilson.com
New Gold Inc. – New Afton Project Technical Report NI 43-101 – December 31, 2009 Page 5-2
INFRASTRUCTURE BC Hydro transmission lines, a Terasen natural gas pipeline, and a Pembina oil pipeline
traverse the mining lease north of the Afton pit. A water pipeline approximately four
kilometres in length can deliver fresh water from Kamloops Lake to the mine site. New
Gold purchased the pipeline and pump house facilities from Teck as part of the purchase
agreement in 2007. New Gold has obtained a temporary water permit and applied for a
permanent water permit to withdraw water from Kamloops Lake for mining and milling
operations.
The surface and underground infrastructure at the New Afton Project includes:
• Site access from the Trans-Canada Highway which is immediately adjacent to the site.
• Underground mine workings a conveyor gallery, a second access from the open pit, and ventilation raises to surface.
• Facilities providing basic infrastructure to the site including electric power, water supply, communications, and mine offices.
• An underground mobile equipment fleet and support facilities at both the
upper, conveyor gallery portal and the portal in the open pit. • Dewatering facilities for pumping from the open pit to a storage area in
Pothook Lake, which has been bermed to increase its volume. • Construction support equipment including a concrete batch plant and trucks
for the delivery of concrete and surface support equipment. • Engineering and administration offices, mine dry and first aid facilities. • A new concentrator building with the SAG mill, ball mill and vertical mill
mechanically installed. • A partially cleared and prepared tailings storage facility.
The old Teck concentrator building remains in its location on the east side of the open
pit, but the New Afton facilities are located to the west of the pit. Similarly, the old Teck
tailings storage area remains on site but is not planned for use by New Gold. Both the
concentrator building and tailings pond are on land owned by others.
SCOTT WILSON RPA www.scottwilson.com
New Gold Inc. – New Afton Project Technical Report NI 43-101 – December 31, 2009 Page 5-3
PHYSIOGRAPHY The landscape is characterized by hilly, till-covered, drumlinoidal terrain and dispersed,
small, alkaline water bodies. Relief adjacent to Kamloops Lake is a few hundred metres
or more. The most significant topographic features within the mining lease are the Afton
and Pothook open pits and the reclaimed waste rock dumps of the Afton Operating
Corporation, the former operator. Kamloops Lake is located north of the mining lease
and bisects the Afton mineral tenure. Vegetation consists of open grasslands and
sparse pine forests as a consequence of a continental, semi-arid climate.
SCOTT WILSON RPA www.scottwilson.com
New Gold Inc. – New Afton Project Technical Report NI 43-101 – December 31, 2009 Page 6-1
6 HISTORY Exploration in the Afton area began in the mid-1800s, as prospectors pushed into the
interior of British Columbia following the Fraser and Caribou gold rushes. The Iron Mask
property, staked in 1896, was the first in the Kamloops district. A 100 ft shaft was sunk
on the Pothook deposit in 1898. Mining was carried out from the turn of the century
through until 1927 at several gold, copper, and silver mines including the Pothook, Iron
King, Copper King, and Iron Mask. The Afton property claims were staked over the
Pothook workings in 1949 by Axel Bergland. This was followed by sporadic, and largely
unsuccessful, exploration work by a number of parties through the 1950s and 1960s.
Mr. Chester Millar acquired the property in the mid-1960s and formed a private company
called Afton Mines Ltd. (Afton Mines) to carry out exploration work. In 1970, Afton Mines
obtained a drill intersection of 170 ft of 0.4% Cu from what ultimately became the Afton
deposit. For the next three years, over 150,000 ft of drilling was carried out by a number
of operators. Duval Corporation and Quintana Minerals took options on the property in
1970 but dropped them in 1971. They were followed in 1972 by Canex Placer. Also in
1972, Teck Corporation and Iso Mines Ltd. (Iso) purchased an equity interest in Afton
Mines.
Teck and Iso bought Canex Placer’s interest for $4.0 million in 1973, and initiated
engineering and metallurgical studies. A production decision was taken in October
1975, with production commencing at the Afton open pit mine in late 1977. At the start
of production, the reserves were 34 million tons grading 1% Cu, 0.016 oz/ton Au, and
0.12 oz/ton Ag (30.8 million tonnes grading 1% Cu, 0.58 g/t Au, and 4.2 g/t Ag). Mining
took place on the property at the Afton, Crescent, Pothook, and Ajax pits. The mine
closed in 1991, reopened again in 1994, closing finally in 1997.
Five deep diamond drill holes, drilled in 1980 below and to the southwest of the Afton pit,
pierced what is now referred to as the New Afton deposit. Teck carried out a study to
determine the feasibility of mining this zone from underground, but shelved the Project.
SCOTT WILSON RPA www.scottwilson.com
New Gold Inc. – New Afton Project Technical Report NI 43-101 – December 31, 2009 Page 6-2
In 1999, the Afton mining leases expired and the ground was staked by Westridge Ltd.,
and Indogold Development Ltd. DRC Resources Corporation (DRC) acquired an option
on the property and surrounded it with additional staking. The following year, DRC
began exploration work with 9,320 m of surface diamond drilling in 21 NQ holes in the
New Afton deposit.
In February 2001, DRC completed a Scoping Study based on drilling results to date.
The Scoping Study indicated that the New Afton deposit could be profitably exploited,
and this led to further definition drilling to confirm the continuity of the mineralization.
The successful conclusion of this phase of exploration led to the commissioning of an
Advanced Scoping Study in 2003 and completed in February 2004 (Behre Dolbear,
2004). The study contemplated an underground mine, using a block caving method,
feeding a conventional flotation mill operating at a rate of 9,000 tpd. Measured and
Indicated Mineral Resources were 68.7 million tonnes grading 1.08% Cu, 0.85 g/t Au,
and 2.62 g/t Ag. The report estimated an after-tax internal rate of return (IRR) for the
Project of 19.9%, with a payback of capital in 3.7 years.
In late 2004, a portal was collared on the south wall of the Afton pit, and 1,915 m of
decline and drift were driven to provide access for definition drilling and bulk sampling of
the deposit. The drifting was completed by September 2005. Diamond drilling, both
from surface and underground, has been carried out more or less continuously up to the
time of writing of this report. At the cut-off date for the 2006 Mineral Resource estimate,
the total amount of diamond drilling was 84,755 m in 182 holes.
DRC underwent a name change to New Gold Inc. in May 2005. Total exploration
expenditures on the New Afton Project by DRC and New Gold to the end of the 3rd
quarter of 2006 were C$37.2 million.
New Gold commissioned a Feasibility Study for the Project at the end of 2005, and the
results of this study were released in April 2007 (Hatch, 2007). The study contemplated
a block cave mine and conventional grinding/flotation mill operation with a daily
throughput of 11,000 tonnes. Mineral Reserves comprised 44.4 million tonnes in the
Probable category grading 0.98% Cu, 0.72 g/t Au, and 2.27 g/t Ag. Mine life was
estimated to be 12 years, with preproduction capital costs of $268 million and Life of
SCOTT WILSON RPA www.scottwilson.com
New Gold Inc. – New Afton Project Technical Report NI 43-101 – December 31, 2009 Page 6-3
Mine (LOM) sustaining capital of $215 million. Pre-tax IRR, using base-case metal
prices of US$2.01/lb Cu, US$487/oz Au, and US$8.54/oz Ag, was estimated to be
13.6%.
Also during the period 2006-07, exploration drilling resulted in the discovery of the C
Zone located below the main body of mineralization.
At the time of writing of this report, underground development was underway, the mill
building had been erected with exterior cladding installed, mill foundations had been
poured, and the SAG Mill, Ball Mill and Verti-Mill installed. Surface construction was
suspended until late 2010, and underground development was expected to be
completed in 2012. This concept will allow the mill to be completed in time for the
underground to deliver ore at the mill’s rated capacity of 11,000 tpd.
SCOTT WILSON RPA www.scottwilson.com
New Gold Inc. – New Afton Project Technical Report NI 43-101 – December 31, 2009 Page 7-1
7 GEOLOGICAL SETTING REGIONAL GEOLOGY The Afton area is underlain primarily by rocks of the Upper to Lower Palaeozoic Quesnel
Terrane, a package of island-arc sedimentary rocks, volcanic assemblages and
associated intrusive phases. Quesnel Terrane was accreted onto the North American
continental margin during the Early to Mid-Jurassic, and is distributed throughout the
entire length of British Columbia. It forms part of the Intermontane Belt, which is host to
many porphyry Cu-Au-Mo deposits including Copper Mountain, Afton, Highland Valley,
Mount Polley, Gibraltar, Kemess, and Galore Creek.
In the immediate Project area, the Quesnel Terrane comprises Late Triassic to Early
Jurassic Nicola Group island-arc volcanic and sedimentary rocks, and coeval alkalic to
subalkalic intrusions of the Iron Mask batholith (Figure 7-1). The Nicola Group consists
of submarine and subaerial volcanic and sedimentary rocks. Volcanic components are
intermediate to basic flows, with associated breccias and volcaniclastic units. The Nicola
Group rocks have been regionally metamorphosed to lower greenschist facies.
Intruding the Nicola Group are Iron Mask diorite, monzodiorite, and monzonite plutons
occurring along a northwest trend. Four principal phases of the Iron Mask batholith have
been identified and these are the Pothook phase agmatite intrusion breccia, Pothook
diorite, Cherry Creek Suite monzodiorite to monzonite, and Sugarloaf diorite. Near the
margins of the Iron Mask batholith, Nicola Group rocks have been thermally
metamorphosed to hornfels. The Iron Mask intrusive rocks are the principal hosts for
Cu-Au-Ag mineralization at New Afton.
Post-mineralization Middle Eocene volcanic and sedimentary rocks of the Kamloops
Group unconformably overlie the Nicola and Iron Mask units. These rocks were partially
responsible for shielding the New Afton deposit from removal by erosion and glaciation.
The Project area is traversed by regional-scale fault zones which are believed to be the
principal control to intrusion of the batholithic rocks, as well as the mineralization
processes. North- to northwest-trending steep to moderate-dipping fault zones are
primary controlling structures for emplacement of the Iron Mask intrusives. East- to

SCOTT WILSON RPA www.scottwilson.com
New Gold Inc. – New Afton Project Technical Report NI 43-101 – December 31, 2009 Page 7-2
northeast-trending faults are important controls to hydrothermal alteration and
mineralization. The faulting and associated fracturing also provided conduits for
meteoric waters, which gave rise to weathering and supergene enrichment of the
primary sulphide mineralization.
PROPERTY GEOLOGY The New Afton deposit is hosted within the Cherry Creek member of the Iron Mask
batholith complex (Figure 7-2). The Iron Mask complex is a multi-phase plutonic body
exposed in a southeast-trending belt measuring 34 km long by 5 km wide. The Cherry
Creek phase is the principal host unit for the New Afton deposit. It is a partially fault-
bounded body trending east-northeast through the deposit area, curving to the east side
of the property to a more southeasterly trend (Figure 7-3). At Afton, the Cherry Creek
intrusive is a variably and multiply brecciated assemblage of porphyritic and equigranular
monzonite-monzodiorite. Cherry Creek rocks include fine- to medium-grained pyroxene-
hornblende monzodiorite and fine-grained biotite-monzonite, varying to more dioritic
composition, and minor syenite. The principal host phase of the Cherry Creek is a
magnetic fine- to medium-grained porphyritic pyroxene-hornblende monzodiorite which
forms a wedge of intrusive breccia between the Nicola and Pothook rocks. Contacts to
the west and southwest are with Nicola Group volcanic rocks and to the east and
southeast with the Pothook diorite.
Contact relationships between various intrusive phases are complex and not completely
understood. Cherry Creek rocks are difficult to discriminate from Pothook biotite-
pyroxene diorite owing to overprinting by alteration. Strong potassic alteration occurs
along the contact between the Pothook and Cherry Creek phases. Pothook rocks
outcrop to the east and south of the Afton deposit. They are weakly porphyritic to
equigranular and, where not altered, moderately to strongly magnetic. Poikiolitic biotite
is diagnostic of the Pothook diorite.
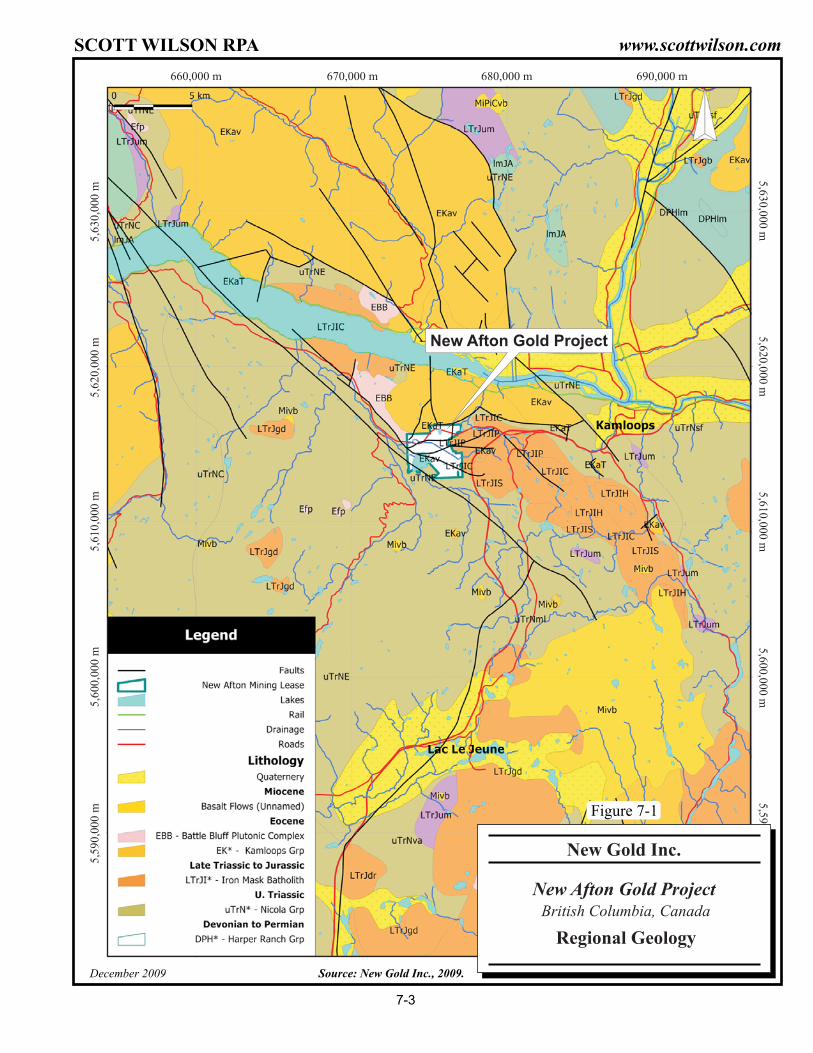
5,6
20,0
00 m
690,000 m
5,6
10,0
00 m
670,000 m
5,5
90,0
00 m
680,000 m
5,6
00,0
00 m
660,000 m
5,6
30,0
00 m
5,6
30,0
00 m
5,6
20,0
00 m
5,6
00,0
00 m
5,6
10,0
00 m
5,5
90,0
00 m
December 2009 Source: New Gold Inc., 2009.
Regional Geology
New Afton Gold Project
New Afton Gold Project
New Gold Inc.
British Columbia, Canada
Figure 7-1
7-3
SCOTT WILSON RPA www.scottwilson.com
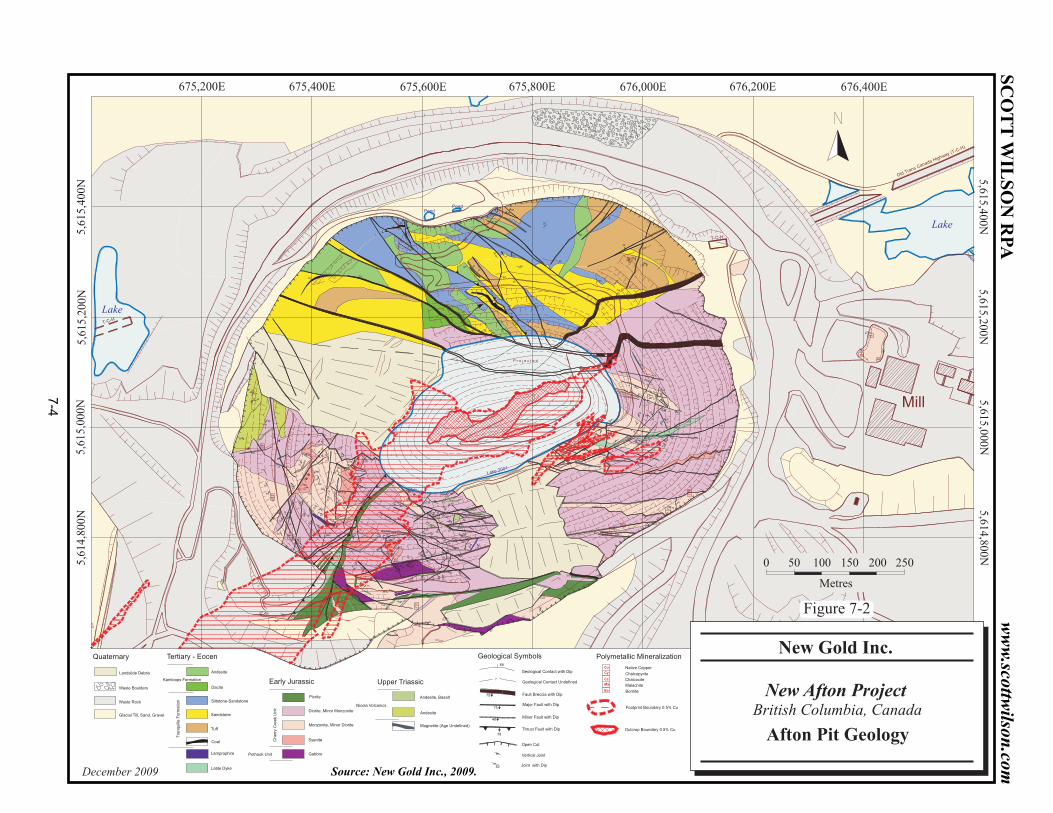
30
78
H=2
50M
etre
s
?
?
?
P r o j e c t e d
74
86
85 83
8767
75
80
75
80
80
88
50
60
69
85
86
83
82
78
80
78
75
85
80
88
85
8076
74
78 86 87
50
78
89
83
76
78
61
57
60
35
71
6376
59
78
4853
44
7043
57
70
5275
8060
43
5970
50
66
75
6561
55
50 54
48
6045
82
5158
65
85
52
65
65
65
85
78
80
80
85
80
80
50
70
65
8576
40
85 73
57
85
80
58
30
76
60
03
8685
51
85
53
79 88
8679
49
7055
40
31
30
886250
80
67
63 8270
70
42
88
78
70
67
60
28
82
8087
68
81
70
8682
85
8988
17
71
76
80
85
85
77
52 6562
45
70
6777
59
1073
68
50 76
35
28
46
554319
23
43
70
88
49
65
63
40
40
57
70
7040
6850 88
85
70
7575
40
75
20
85
68
75
6040
445430
58 55
65
60
62
45
38
75
62
52
70
857660
6571 66 56
71
38
57
70
65
42
47
80
85
72
60
60
82
40
55
66
40
59
41
63
64
36
52
8078
68
80
60
80
49
57
61
45
5888
44
45
58
58
40
83
55
50
30
66
49
60
18
40
7055
55 77
25
73
62
58 67
49
83
70
38
88
60
45
63
62
67
74
62
85
83
50
59
75
72
88
?
?
?
??
?
?
?
?
?
?
Ma
Ma
Ma
Cu
Cy
Cy
Cu
Cy
Cy
Bo
Cy
Bo
Cy Cc
Cy
Cc
Ma
Ma
Ma
Ma
Cy
Ma
Ma
Ma
Ma
PondPond
5,6
15
,00
0N
5,6
15
,20
0N
5,6
15
,40
0N
5,6
14
,80
0N
5,6
15
,00
0N
5,6
15
,20
0N
5,6
15
,40
0N
5,6
14
,80
0N
676,000E 676,200E 676,400E675,800E675,600E675,400E675,200E
Lake
Lake
Lake 2001
Creek
T-C-H
T-C-H
Old Trans Canada Highway (T-C-H)
Mill
75
48
75
78
Cu
Cy
Cc
Ma
Bo
Quaternary Tertiary - Eocen
Upper Triassic
Landslide Debris
Waste Rock
Andesite
Dacite
Siltstone-Sandstone
Sandstone
Tuff
Nicola Volcanics
Andesite
Magnetite (Age Undefined)
Geological Contact with Dip
Geological Contact Undefined?
Fault Breccia with Dip
Major Fault with Dip
Minor Fault with Dip
82 Joint with Dip
Vertical Joint
68Native Copper
Chalcopyrite
Chalcocite
Malachite
Polymetallic Mineralization
Open Cut
Glacial Till, Sand, Gravel
Bornite
Tra
nquill
eF
orm
ation
Coal
Latite Dyke
Lamprophire
Andesite, Basalt
Kamloops Formation
Geological Symbols
Footprint Boundary 0.5% Cu
Outcrop Boundary 0.5% CuThrust Fault with Dip
Early Jurassic
Picrite
Diorite, Minor Monzonite
Monzonite, Minor Diorite
Syenite
Gabbro
Cherr
yC
reek
Unit
Pothook Unit
Waste Boulders
0 50 250
Metres
100 150 200
N
December 2009 Source: New Gold Inc., 2009.
New Afton Project
Afton Pit Geology
New Gold Inc.
British Columbia, Canada
Figure 7-2
SC
OT
TW
ILS
ON
RP
A
7-4
ww
w.sco
ttwilso
n.co
m

0 1
Kilometres
2 3 4
December 2009 Source: Geological Fieldwork 2004, Paper2005-1.
New Afton Project
Property Geology
New Gold Inc.
British Columbia, Canada
Figure 7-3
SC
OT
TW
ILS
ON
RP
A
7-5
ww
w.sco
ttwilso
n.co
m
SCOTT WILSON RPA www.scottwilson.com
New Gold Inc. – New Afton Project Technical Report NI 43-101 – December 31, 2009 Page 7-6
Nicola Group rocks border the Cherry Creek intrusive on west and southwest of the
deposit but are not hosts to the economic mineralization. They consist of augite
porphyry, polylithic volcanic breccias, and picrite flows and breccias. Xenoliths of Nicola
rocks occur within the Cherry Creek intrusive, and on the southwest end of the deposit
the Nicola form a large roof pendant overlying the Cherry Creek. A possible volcanic
vent breccia phase appears to crosscut the Nicola strata
A steeply dipping body of serpentinized and sheared picrite has been entrained within
the Hanging Wall Fault, a major structural control to the New Afton deposit. This unit
separates separating strongly mineralized, pyrite-poor, potassically altered monzodiorite
to the northwest from pyritic, sericite-carbonate-clay-chlorite-altered monzodiorite to the
southeast. Ground conditions within the picrite are poor, which has hampered efforts to
drill through it. As a result, drill information on the hanging wall side of the picrite is
limited.
New Gold geologists have recently discerned that a late, post-mineral intrusive phase
occupies a corridor oriented roughly parallel to and lying within the orebody. This
intrusive post-dates the Cu-Au mineralization and is largely barren, except for scattered
occurrences of limited lateral extent which may, in fact, be entrained blocks of earlier
mineralized intrusive material. It has been called the “De-Mineralized Zone” (DMZ) by
mine staff.
The property is traversed by mafic pyroxene-feldspar porphyry, monzonite, hornblende
diorite porphyry, and hornblende-feldspar-quartz porphyry (latite) dykes. The dykes are
late phases of the intrusive and difficult to discriminate from Cherry Creek rocks in
places. They are post-mineral events, although some have pyrite-chalcopyrite
mineralization along their margins.
Mesozoic units (i.e., Nicola and Cherry Creek) are unconformably overlain by Eocene
Kamloops Group rocks. In the Project area, the Kamloops Group comprises coarse- to
fine-grained clastic sedimentary rocks, along with a mafic flow. Coal beds within this
package are visible in the north wall of the Afton Pit.
SCOTT WILSON RPA www.scottwilson.com
New Gold Inc. – New Afton Project Technical Report NI 43-101 – December 31, 2009 Page 7-7
Structure is a dominant feature of the geology of the deposit and has influenced all
aspects of the host rock lithology, mineralizing events, and post-mineral processes.
Zones of intersection between deep-seated northwest-southeast-trending faults and
east-northeast fractures were primary controls to localization of the Triassic intrusive
bodies (i.e., the Iron Mask batholith) and Nicola volcanic centres. The northwest-
southeast structures are major regional fault zones believed to date back to Triassic
times with repeated stages of reactivation through to the Tertiary.
East-northeast-striking steeply dipping fault zones were the primary control to the New
Afton mineralization. Two faults, termed the Hanging Wall (east) and Footwall (west)
faults, constrain the New Afton deposit to a relatively narrow steeply dipping corridor.
They, along with moderately to steeply dipping east-west, southwest-northeast, and
north-south fault zones have been mapped in the Afton pit (see Figure 7-2), and were
subsequently picked up in diamond drill holes and underground mapping. These
structures are thought to have controlled the flow of mineralizing hydrothermal fluids
responsible for the alteration and deposition of sulphides. The pattern of intersection of
the fault planes has imparted a southwest plunge to the New Afton zone.
Subsequent fault movements shuffled portions of the deposit, in parts truncating it, and
transposing slices of waste and ore in others. The faults and subsidiary fracturing then
provided conduits for weathering solutions, which resulted in supergene alteration down
to relatively deep elevations (approximately 400 m below surface in places).
Lastly, during the Tertiary, tensional stress that developed in a northwest-southeast
direction resulted in northwest-southeast-trending graben structures and the
development of depositional basins for Kamloops Group sediments.
SCOTT WILSON RPA www.scottwilson.com
New Gold Inc. – New Afton Project Technical Report NI 43-101 – December 31, 2009 Page 8-1
8 DEPOSIT TYPES The Afton deposits are Cu-Au silica-saturated, alkalic porphyry style deposits.
Mineralization results from late stage hydrothermal activity driven by remnant heat within
an alkalic intrusive complex. Thermal gradients within these systems give rise to broadly
concentric, although often complexly intermingled, zones of alteration and mineralization.
The distribution of alteration and mineral facies are largely influenced by dikes, veins,
and fracture systems which concentrate and control fluid flow.
The New Afton deposit is unique in the sense that it is very strongly constrained by
structure. The mineralization occurs as a tabular body that occupies a largely fault-
bounded corridor, which traverses the property in an east-northeast/west-southwest
direction (see Figure 7-2). This corridor is bounded on either side by the Hanging Wall
(SE) and Footwall (NW) faults. The orebody does not come in contact with the Footwall
Fault, however, mineralization is partially entrained within and likely disrupted by portions
of the Hanging Wall Fault. Pods of mineralization are also known to occur outboard of
the Hanging Wall Fault.
Very late epithermal processes have overprinted the porphyry system and introduced
mercury, antimony, and arsenic in geochemically significant concentrations.

SCOTT WILSON RPA www.scottwilson.com
New Gold Inc. – New Afton Project Technical Report NI 43-101 – December 31, 2009 Page 9-1
9 MINERALIZATION Hypogene mineralization comprises fine-grained disseminated chalcopyrite and
relatively minor bornite or chalcocite. In weathered portions of the deposit, the
chalcopyrite has been altered to bornite and chalcocite, and in the most intensely
oxidized areas, native copper. Supergene mineralization is broadly constrained to the
upper portions of the deposit, reaching to deeper areas along fracture zones.
Native gold is rarely observed. Gold and silver reportedly occur as electrum grains
within the chalcopyrite and bornite.
Significant amounts of mercury, antimony, and arsenic occur in and around the deposit
but are not thought to be directly related to the porphyry event(s). Rather, they are more
likely to have been introduced during much later epithermal activity, similar to several
other localities in the district.
The central core of mineralization comprises an early potassic alteration phase which
includes intense biotite ± silica ± magnetite hornfels of Nicola Group and Cherry Creek
monzonite. The earliest stages of the mineralization also include stockworks of
magnetite + apatite + actinolite + biotite + calcite + chalcopyrite ± pyrite veins.
Overprinted on the hornfels and magnetite facies is fracture-controlled to pervasive
hydrothermal potassic alteration (K-feldspar + biotite + actinolite) and sulphide
mineralization consisting of disseminated and veinlet-hosted chalcopyrite and pyrite with
subsidiary bornite. Copper-gold mineralization occurs in association with strong potassic
alteration and in crackle breccias proximal to magnetite, pyrite, and quartz-carbonate
stockworks.
Pyrite stockworks encompass the potassic zones in a shell of phyllic alteration, which
includes dolomite + sericite in quartz-carbonate stockworks associated with high-angle
faults. This imparts a bleached appearance to the rock in contrast with the darker
brownish-coloured hornfels.
SCOTT WILSON RPA www.scottwilson.com
New Gold Inc. – New Afton Project Technical Report NI 43-101 – December 31, 2009 Page 9-2
The latest stage of hydrothermal alteration associated with the primary mineralization
event is a propylitic overprint consisting of actinolite + chlorite + epidote ± carbonate ±
pyrite ± chalcopyrite.
The bulk of the deposit occupies a large tabular mass measuring 900 m long by
approximately 100 m wide and spanning a vertical distance of about 350 m. The zone
dips vertically to steeply south-southeast, and plunges at moderate angles to the
southwest. Two subsidiary satellite bodies occur to the northeast of the Main Zone.
One of these zones appears to branch off of the Main Zone and strikes in a somewhat
more easterly trend, dipping steeply to the south-southeast. The other, which is further
away from the Main Zone has a similar strike to the Main Zone but dips at a flatter angle
(approximately 60° southeast).
As stated above, the deposit is porphyry-style, with very distinct structural controls. The
primary mineralizing event was preceded by development of disseminated magnetite-
pyrite. Primary economic sulphide mineralization occurred in association with potassic
alteration (principally K-spar) resulting in destruction of the earlier magnetite-pyrite
assemblage. Following this, carbonate veinlets (principally ankerite) developed along
and surrounding the faults, along with varying amounts of pyrite, clay gouge, and
sericite.
Subsequent faulting reshuffled portions of the deposit in a manner that is not completely
understood. This has resulted in truncation of the zone along the Hanging Wall Fault in
places, and apparent displacement of mineralized blocks. These blocks may occur as
isolated pods in the hanging wall or may also be situated adjacent to the Main Zone
such that they appear to comprise a continuous body of mineralization crossing the fault.

SCOTT WILSON RPA www.scottwilson.com
New Gold Inc. – New Afton Project Technical Report NI 43-101 – December 31, 2009 Page 10-1
10 EXPLORATION Prior to New Gold’s involvement, the only work that had been done on the deep
resource at Afton was the seven holes drilled by Afton Mines in 1973 (two holes) and
1980 (five holes). New Gold commenced exploration work in 2000, with mapping and
sampling of the pit (as well as any available outcrop surrounding the pit) and drilling of
96 surface diamond core holes totalling 42,450 m.
In November 2004, an adit was collared in the former Afton open pit at 512 m ASL. A
ramp was driven from this portal to provide access for underground sampling, infill
drilling to confirm the Mineral Resources, and further exploration drilling to determine the
full extent of the mineralization. Total drifting was 2,200 m.
Diamond drilling from February 2005 to April 2006 (cut-off for the 2006 resource
estimate) totalled 30,778 m in 78 holes. This brought the total amount of drilling on the
Project to 84,755 in 182 holes. Drilling continued throughout 2006, and into 2007, on the
C Zone, a deep extension to the New Afton ore body. Five exploration holes totalling
2,996 m were drilled in the Pothook Pit area, which is approximately 0.5 km east of the
Afton mine pit. Drilling was also conducted on the Hanging Wall Zones, located under
the east side of the Afton pit, in 2008. To date, 276 exploration diamond drill holes have
been completed in the entire Project area, for an aggregate length of 130,439 m.
In late 2005, New Gold contracted Fugro Airborne Surveys to complete 1,323 line-km of
airborne electromagnetic surveying (DIGHEM) of the Afton and Ajax claims. Quantec
Geoscience Ltd. was retained in 2008 to carry out Tensor Magnetotelluric (MT) and DC
Resistivity and Induced Polarization (DC/IP) surveys totalling 34.5 line-km.
In addition to the work at Afton, New Gold carried out relatively small programs on the
Ajax Group, which is located just over 7 km to the southeast of the Afton pit. Drilling on
the Ajax in 2004 and 2006 totalled 4,635 m in ten holes. During the period from 2006 to
2008, New Gold drilled another 16 holes totalling 6,820 m. A radiometric survey,
consisting of 44.73 line-km, was carried out in 2007, along with collection of 2,040
geochemical soil samples.
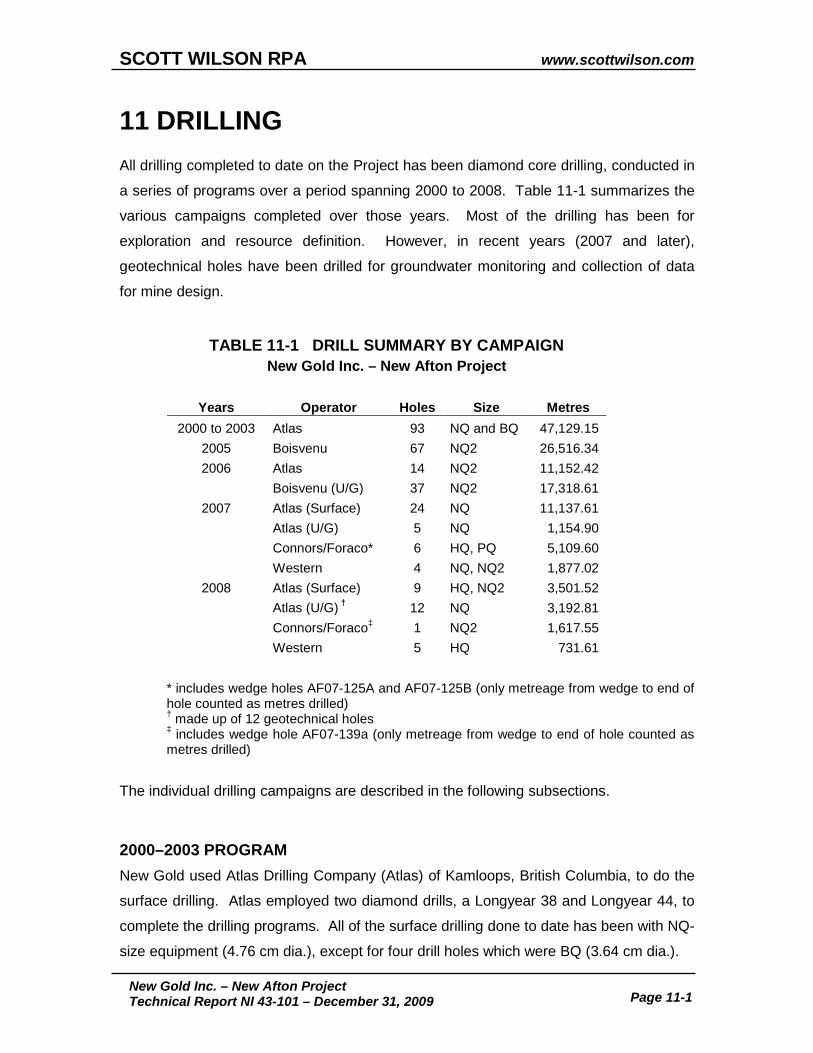
SCOTT WILSON RPA www.scottwilson.com
New Gold Inc. – New Afton Project Technical Report NI 43-101 – December 31, 2009 Page 11-1
11 DRILLING All drilling completed to date on the Project has been diamond core drilling, conducted in
a series of programs over a period spanning 2000 to 2008. Table 11-1 summarizes the
various campaigns completed over those years. Most of the drilling has been for
exploration and resource definition. However, in recent years (2007 and later),
geotechnical holes have been drilled for groundwater monitoring and collection of data
for mine design.
TABLE 11-1 DRILL SUMMARY BY CAMPAIGN New Gold Inc. – New Afton Project
Years Operator Holes Size Metres 2000 to 2003 Atlas 93 NQ and BQ 47,129.15
2005 Boisvenu 67 NQ2 26,516.34 2006 Atlas 14 NQ2 11,152.42
Boisvenu (U/G) 37 NQ2 17,318.61
2007 Atlas (Surface) 24 NQ 11,137.61
Atlas (U/G) 5 NQ 1,154.90
Connors/Foraco* 6 HQ, PQ 5,109.60
Western 4 NQ, NQ2 1,877.02
2008 Atlas (Surface) 9 HQ, NQ2 3,501.52
Atlas (U/G) † 12 NQ 3,192.81
Connors/Foraco‡ 1 NQ2 1,617.55
Western 5 HQ 731.61
* includes wedge holes AF07-125A and AF07-125B (only metreage from wedge to end of hole counted as metres drilled) † made up of 12 geotechnical holes ‡ includes wedge hole AF07-139a (only metreage from wedge to end of hole counted as metres drilled)
The individual drilling campaigns are described in the following subsections.
2000–2003 PROGRAM New Gold used Atlas Drilling Company (Atlas) of Kamloops, British Columbia, to do the
surface drilling. Atlas employed two diamond drills, a Longyear 38 and Longyear 44, to
complete the drilling programs. All of the surface drilling done to date has been with NQ-
size equipment (4.76 cm dia.), except for four drill holes which were BQ (3.64 cm dia.).
SCOTT WILSON RPA www.scottwilson.com
New Gold Inc. – New Afton Project Technical Report NI 43-101 – December 31, 2009 Page 11-2
A total of 93 diamond drill holes were collared for an aggregate length of 47,129 m
(Figure 11-1). All surface drill collars were surveyed by transit and Brunton compass.
Drill hole orientations in 2000 beyond hole 2K-12 were measured using a Pajari Bore
Hole Survey Instrument, and in 2001 and 2002 a Reflex Easy-Shot Survey Instrument,
which records dip and azimuth, was used. Drilling is discussed in further detail in reports
prepared by Behre Dolbear (2003, 2004).
At the completion of the 2000 drilling program, the Main Zone was estimated to be 365
m long, 76 m wide (average), and 300 m in vertical extent.
In 2001, ten diamond drill holes extended the length of the Main Zone 280 m to the
southwest of the previous drilling. The 2002 infill drilling intersected the Main Zone from
the west and provided exploration data on the areas between previously drilled holes.
Drill holes extended the measured length of the Main Zone 120 m to the southwest.
Drilling in 2003 focused on upgrading Inferred Resources to Measured and Indicated
Resources. At that time, the Main Zone was estimated to be 800 m long, 90 m wide
(average), and 300 m in vertical extent.
2005–2006 PROGRAM The 2005 underground drilling program was carried out by Boisvenu Drilling Ltd. of
Vancouver, British Columbia, using NQ2 equipment (5.06 cm dia.). All drill holes were
surveyed using a photo-bore single-shot instrument for dip and azimuth changes
downhole, with collar surveys done by transit.
Underground drilling totalled 26,516 m in 67 holes during 2005, with an additional 37
holes drilled in 2006 (17,319 m). The 2005 program focused on definition drilling of the
known mineralization in the Main Zone. The pattern was configured to fill in sections
halfway between the existing surface holes, bringing the nominal section spacing to 40
m. In 2006, the principal target area was the C Zone. This drilling was successful in
delineating a modest Inferred Mineral Resource of 7.9 Mt grading 0.96% Cu, 0.88 g/t Au,
and 1.6 g/t Ag.
The core from the drill was brought by the drillers on a daily basis to the core shack
where it was placed on a pallet and covered until placed in the temporary racks. The

SCOTT WILSON RPA www.scottwilson.com
New Gold Inc. – New Afton Project Technical Report NI 43-101 – December 31, 2009 Page 11-3
core was logged for rock type, mineralization, and alteration, and also for geotechnical
data including percent recovery, rock quality designation (RQD), character and number
of fractures. The core was photographed prior to being sampled. Scott Wilson RPA
noted in the site visits conducted in 2005 and 2006 that the core recovery was generally
excellent.
Underground drilling was carried out on 12 sections and consisted of several drill hole
fans from each station (Figure 11-1). Drilling completed to that time had delineated a
mineralized body measuring about 1,000 m in length, 50 m to 100 m in width, and 400 m
in vertical extent, with a moderate plunge to the west.
2007 PROGRAM The 2007 drilling also targeted the Hanging Wall Zones, as well as depth extensions to
the C Zone. Geotechnical drilling was also conducted from both surface and
underground. Four holes were drilled on the C Zone, and 23 holes were drilled on
Hanging Wall Zones targets. The geotechnical program comprised five underground
and four surface holes.
The C Zone program was carried out by FORACO Drilling Ltd. (FORACO). Core sizes
were PQ (8.51 cm dia.), HQ (6.35 cm dia.), NQ2, and BQTK (4.07 cm dia.). Three
contractors: FORACO, Atlas, and Western Exploration Diamond Drilling Ltd. (Western),
were employed for the Hanging Wall program. The core sizes were HQ and NQ2. Atlas
and Western were also contracted to do the geotechnical drilling, which was entirely
NQ2 size.
Core-handling protocols in 2007 were similar to those applied in 2005-2006. Downhole
surveys were carried out using either a Reflex Easy-Shot or Maxibor instrument. The
Reflex measurements were made every 50 m for holes greater than 100 m depth. For
shorter holes, measurements were made at the mid-point and bottom of the hole. The
Maxibor provided readings every three metres downhole.
SCOTT WILSON RPA www.scottwilson.com
New Gold Inc. – New Afton Project Technical Report NI 43-101 – December 31, 2009 Page 11-4
2008 PROGRAM Drilling continued on the Hanging Wall Zones in 2008, with a total of 4,450 m drilled in
15 surface holes. Drilling contractors used were Atlas, Western, and Connors Drilling
Ltd.
New Gold now has a formal protocol for locating, monitoring, surveying, and logging the
drill holes. Planned holes are plotted in plan and section to confirm the target and collar
location. A geologist inspects the collar site, and the surveyors mark both the collar
location and line. Once the drill has been set up, the geologist conducts an inspection,
checks the orientation of the rig, and confirms with the driller. Daily site inspections are
conducted by a geologist as the hole is being drilled.
Following completion, a downhole survey is carried out by a technician using the Reflex
instrument (as described under 2007 Program). The Maxibor is no longer used as New
Gold personnel have concerns regarding its mechanical reliability.
At this time, also, a request is made to the surveyors for collar pick-up. Scott Wilson
RPA notes that, in practice, some underground collars are not actually surveyed, but are
located relative to the drift survey. Site reclamation of both the pad and the sump is then
carried out.
Core is delivered at the end of each shift to the logging facility housed in a Quonset hut
on site. Depending on the back-log, the core is either laid out for processing or stored
for later logging. Processed core is laid out, washed, checked for correct depth
measurements, and marked with start and end measurements. Any incorrect depth
blocks are corrected at this time. Aluminum tags, denoting hole and box numbers, are
affixed to each box. The core is then marked for sampling on two-metre intervals.
Geotechnical logging is then carried out, followed by the geological logging. Geological
logging includes lithology, alteration, and mineralization. The logs are transcribed into
spreadsheets, which are then sent to the database manager along with the core imagery
and sample lists.

SCOTT WILSON RPA www.scottwilson.com
New Gold Inc. – New Afton Project Technical Report NI 43-101 – December 31, 2009 Page 11-5
Sample tags are prepared for the marked intervals as well as the quality
assurance/quality control (QA/QC) samples, and this is all recorded in a spreadsheet.
The core is then photographed and placed in racks to await sampling.
In Scott Wilson RPA’s opinion, the core handling protocols are consistent with common
industry practice and are appropriate for the Project.

3,400 m 3,900 m3,800 m3,600 m 3,700 m3,500 m 4,300 m4,200 m2,2
00 m
2,1
00 m
1,9
00 m
2,0
00 m
2,4
00 m
3,000 m 3,200 m 3,300 m3,100 m1,8
00 m
1,7
00 m
1,6
00 m
1,5
00 m
2,2
00 m
2,1
00 m
1,9
00 m
2,0
00 m
2,4
00 m
1,8
00 m
1,7
00 m
1,6
00 m
1,5
00 m
2,3
00 m
2,3
00 m
1,4
00 m
4,100 m4,000 m2,900 m2,800 m
3,400 m 3,900 m3,800 m3,600 m 3,700 m3,500 m 4,300 m4,200 m3,000 m 3,200 m 3,300 m3,100 m 4,100 m4,000 m2,900 m2,800 m
1,4
00 m
Legend:
Drillhole Trace
Topo Contour
Drillhole Collar
Resource Outline
N
December 2009 Source: New Gold Inc., 2009.
New Afton Project
Drill Hole Location andResource Outline
New Gold Inc.
British Columbia, Canada
Figure 11-1
SC
OT
TW
ILS
ON
RP
A
11-6
ww
w.sco
ttwilso
n.co
m
SCOTT WILSON RPA www.scottwilson.com
New Gold Inc. – New Afton Project Technical Report NI 43-101 – December 31, 2009 Page 12-1
12 SAMPLING METHOD AND APPROACH 2000-2003 DRILL PROGRAMS New Gold consultant, James McDougall, P.Eng., reviewed and advised on diamond
drilling and geological fieldwork for the 2000 to 2003 programs. All significantly
mineralized drill core from the 2001 to 2003 programs (except for specimen sections)
was logged, photographed, and diamond sawed, with half the core retained in the core
box at New Gold’s core shack and the other half taken directly to the laboratory.
Samples were conveyed by laboratory employees from site to Eco Tech Laboratory Ltd.
of Kamloops, British Columbia, for analysis for Cu, Au, Ag, and Pd. Core from the 2000
program was split rather than diamond sawed and was not photographed prior to
splitting. However, in view of the extreme fragmentation involved with core splitting,
occasional one-foot unsplit mineralized sections were retained for structural studies.
Sample lengths were predominantly 2.00 m or 3.05 m, however, Scott Wilson RPA notes
that there are a significant number of longer intervals. The maximum sample length
recorded in the database is 15.2 m, and 930 samples measure greater than 3.05 m.
Approximately 4.7% of the samples contained within the deposit are greater than 3.05 m
in length.
A limited number of check samples were randomly selected and sent to Acme Analytical
Laboratories Ltd. and International Plasma Laboratory Ltd. of Vancouver, British
Columbia. All of the check samples correlated well with the originals (Behre Dolbear
2003). Selected core samples were examined microscopically in the field, and in thin
section by petrographer J.F. Harris, Ph.D.
2005 UNDERGROUND SAMPLING The underground samples comprise continuous chip samples taken on both sides of the
drift and correspond with each round of approximately 4.8 m in length. Muck samples
are also taken for each round. These samples were not used for mineral resource
estimation.
SCOTT WILSON RPA www.scottwilson.com
New Gold Inc. – New Afton Project Technical Report NI 43-101 – December 31, 2009 Page 12-2
2005-06 DRILL PROGRAMS Drill holes were sampled in two-metre lengths or less as marked by the geologist. Scott
Wilson RPA notes that, while the sampling protocol includes provision for sampling at
less than two-metre lengths, virtually all of the sampling done since the start of 2005 was
done on two-metre intervals. Sampling is reportedly based on visible mineralization, but,
in practice, most of the core was sampled. The samples were sawn in half, bagged, and
put into plastic pails for shipping. The sampler filled out sample tags and, for every 20
samples, included a blank sample prepared from previously drilled barren andesite, a tag
for a standard to be put into the sample stream at the lab, and, in addition, a quarter
sample to provide a duplicate.
The pails were kept in a locked trailer, which housed the cutting facility, until shipped.
The laboratory picked up the samples several times a week. Sample tags were stapled
onto the core boxes at the start of each sample. After the core was sampled, the
remaining half core was stored in the original boxes on pallets outside. Each pallet was
covered with plastic wrap and securely fastened. Scott Wilson RPA notes that a
permanent core storage facility with covered racks has since been established on site
and all core has been relocated to this facility.
The assay results were loaded directly from the laboratory into an MS Access database.
The drill logs were entered into MS Excel spreadsheets from the handwritten logs.
2007 AND SUBSEQUENT DRILLING PROGRAMS The two metre sampling interval standard has been maintained and is specified in the
formal protocol that New Gold now maintains. Samples are marked as described above
in Section 11 of this report. Technicians retrieve the boxes from the rack and convey
them to the cutting shack. Core is sawn in half, and the sample is placed in a plastic bag
marked with the tag number. The remaining half core is put back in the box for storage.
Each day, the samples are placed in rice bags, which are then marked with the sample
sequence and prepared for shipping. A daily manifest is prepared, detailing the sample
numbers cut and packaged, and is provided to the laboratory. Samples are stored in a
locked enclosure until pick-up by laboratory personnel. Each shipment is accompanied
by the manifest, with a duplicate copy retained at site.

SCOTT WILSON RPA www.scottwilson.com
New Gold Inc. – New Afton Project Technical Report NI 43-101 – December 31, 2009 Page 12-3
Starting in early 2007, New Gold commenced a program of assaying pulps by inductively
coupled plasma (ICP) in order to build a database of potentially deleterious elements.
Starting in the walls, and progressing through the deposit to the opposite wall, every fifth
sample was selected from the drill database. These samples were run using ICP. At the
time of the site visit, 9,137 samples had been analyzed in this program.
In Scott Wilson RPA’s opinion, the sampling method is appropriate for the deposit type
and is consistent with current industry practice. The samples are taken in such a way as
to be representative of the deposit as it is presently known.

SCOTT WILSON RPA www.scottwilson.com
New Gold Inc. – New Afton Project Technical Report NI 43-101 – December 31, 2009 Page 13-1
13 SAMPLE PREPARATION, ANALYSES AND SECURITY 2000-2003 DRILL PROGRAMS Sample preparation and analysis were as follows:
• All samples were sorted, documented, dried (if necessary), roll crushed to -10 mesh, split into 250 g subsamples, and pulverized to 95% -140 mesh.
• Samples for Cu metallics assay (when requested) were split and pulverized into additional 250 g subsamples of -10 mesh material. The entire pulp was screened to -140 mesh.
• Au and Pd were subsampled to 30 g aliquots and analyzed with conventional fire assay using atomic absorption (AA) and/or Inductively Coupled Plasma (ICP) finish. Minimum reported detection for Au and Pd was 0.005 g/t.
• Cu was determined by AA using aqua regia digestion. “Metallic” Cu (when required) included two Cu assays per sample.
• Ag geochemical analysis was by aqua regia digestion and AA.
• All equipment was flushed with barren material and blasted with compressed air between each sampling procedure.
All core drilled by New Gold in the 2000-2003 programs was assayed by Eco Tech
Laboratories Limited (Eco Tech) of Kamloops, British Columbia, who are Certified
Assayers and participate in the National Canmet Proficiency Testing, and who maintain
their own in-house QA/QC program.
The New Afton property is fenced and gated, and reasonably secure. It was reported
that after the core was logged and sawn, tied sample bags were locked in New Gold’s
field office until picked up by personnel from Eco Tech for transport to their facilities.
Drill core was stored in core racks at the locked, secure core shack. Rejects were kept
at Eco Tech’s office, and pulps were securely stored at New Gold’s field office.
2005 AND SUBSEQUENT DRILL PROGRAMS All analytical work was performed by Eco Tech. Copper and silver assays were
determined using standard acid digestion followed by AA. Gold and palladium were

SCOTT WILSON RPA www.scottwilson.com
New Gold Inc. – New Afton Project Technical Report NI 43-101 – December 31, 2009 Page 13-2
determined using fire assay followed by an AA finish. The one-in-five deleterious
element samples were run for 30-element ICP.
Mr. Stewart Wallis of Scott Wilson RPA visited the Eco Tech Kamloops facility on June
7, 2005, for an inspection, and discussed the assaying methodology and QA/QC
protocols with Jutta Jealouse, President. Internal checks consist of a minimum two
repeats, one blank, two re-splits, and two or three reference standards, one for Cu, one
for Ag, or one combined Cu/Ag and one for Au/Pd. If native Cu is reported on the
sample sheets, a metallic screen analysis is run in addition to the regular assay.
The laboratory was observed to be clean and proper procedures were in place to track
each sample. Assay results and internal check results were checked and batches rerun
if problems were observed. The laboratory has since been acquired by Stewart Group
Ltd., of the United Kingdom. Eco Tech is ISO 9001-2000 accredited.
Bulk density measurements are made at Eco Tech, using a water immersion method.
Specimens are sealed in wax, weighed in air and in water, and the density determined
by the ratio between the weight of displaced water and the weight of the sample.
Correction is made for the volume of wax encasing the specimen. Data for 686
determinations were included in the database provided to Scott Wilson RPA for review.
In Scott Wilson RPA’s opinion, the assay methodologies are standard practices in the
industry and are appropriate for the mineralization at New Afton. The laboratory is well-
known, accredited commercial assayer, with considerable experience with Afton ores.
As noted above, the samples are in the custody of New Gold personnel or authorized
designates from the drill to the lab, and Scott Wilson RPA has no concerns regarding
sample security.
SCOTT WILSON RPA www.scottwilson.com
New Gold Inc. – New Afton Project Technical Report NI 43-101 – December 31, 2009 Page 14-1
14 DATA VERIFICATION 2000-2003 DRILL PROGRAMS New Gold’s QA/QC program was as follows:
• Assay standards were routinely used to control assay precision.
• One in nine pulp samples were re-assayed by Eco Tech.
• One in 25 reject samples were re-split and re-assayed by Eco Tech, and
• Pulp samples were randomly selected for duplicate assaying by different laboratories.
Previous reports (Behre Dolbear 2003, 2004) have described validation of the assays
from the surface drilling program. Behre Dolbear (2004) concluded that the assay and
survey database used for the Afton mineral resource estimation was sufficiently free of
error to be adequate for resource estimation.
2005-2006 DRILL PROGRAM Scott Wilson RPA conducted a review of the QA/QC results for the 2006 mineral
resource estimate. Independent samples were not collected as the property had been
previously visited and reported on by of a number of independent Professional
Geologists and is a former producing mine.
New Gold’s protocols were somewhat modified from the ones used prior to 2005. A
blank, standard, or duplicate was entered into the sample stream at a frequency of one
every eight samples. A total of 18,508 unprepared samples were submitted to Eco Tech
during the 2005-2006 program (Konst, 2006). This included 801 blanks, 793 standards,
and 721 duplicates, which, in sum, equates to approximately 12% of all samples run.
Sample QA/QC data from the underground drilling program was analyzed by Ron Konst,
P.Geo., an independent consultant retained by New Gold. Mr. Konst noted that there
were 53 blank assays and 18 standard assays with results outside of an acceptable error
limit. These samples comprised 7% and 2% of the total blank and standard assays,
respectively, although it was reported that several of these “outliers” were the result of
improper labelling (i.e., standards sent as blanks, and vice versa). The Konst report

SCOTT WILSON RPA www.scottwilson.com
New Gold Inc. – New Afton Project Technical Report NI 43-101 – December 31, 2009 Page 14-2
recommended that the batches with out-of-specification (OOS) QA/QC data be
investigated and re-assayed, if appropriate. This work was carried out and no material
changes to the assay database resulted. Several of the OOS blanks were found to be
misidentified in the database and did not represent improper assay results.
The duplicate data were analyzed using scatter diagrams and Thompson-Howarth plots
to determine if any biases were present and to define the assay precision. The precision
for Cu at a 0.6% grade was ±9%, and for Au at a 0.5 g/t grade, ±20%. No biases were
detected.
Scott Wilson RPA reviewed the Konst report and the QA/QC data, and conducted
independent analyses of the QA/QC assays. The duplicate analyses were subject to
Thompson-Howarth plots to confirm the results of the Konst report. Also, each of the
blank assays was plotted against the sample that immediately preceded it in the sample
stream, to check for evidence of contamination in sample preparation. No concerns
were indicated by this analysis. Scott Wilson RPA reviewed the plots of the standard
assays and confirmed that there was no indication of systematic bias, nor any trends or
particular time periods where assays tended to be OOS.
Scott Wilson RPA concurred with the principal conclusion of the Konst report and
considered the assay data suitable for use in mineral resource estimation. However, in
the course of preparing the estimate, Scott Wilson RPA found a number of database
errors, which were brought to the attention of New Gold personnel and corrected. These
errors were often observed to persist in subsequent versions of the database, indicating
that the validation process was not robust. Eventually, these errors were expunged, but
there were concerns regarding the data handling.
Scott Wilson RPA carried out a check of approximately 10% of the drilling database
against the original assay and survey records. Drill holes were selected on a more or
less random basis, spanning the entire life of the Project to date. No errors were found.
2007 AND SUBSEQUENT PROGRAMS New Gold consultant, Bruce Davis, reviewed the QA/QC data in October 2008 and found
that QA/QC results were showing significant deficiencies but remedial measures had not

SCOTT WILSON RPA www.scottwilson.com
New Gold Inc. – New Afton Project Technical Report NI 43-101 – December 31, 2009 Page 14-3
been taken. The recommendation was made to select approximately 300 sample pulps
for re-assay of Cu and Au, both at the principal laboratory, Eco Tech, as well as at
another laboratory. The results of this re-assay program did not indicate that there were
any concerns with respect to bias. However, the data did display a somewhat high level
of scatter for pulp duplicates.
Scott Wilson RPA selected approximately 10% of the holes drilled since the last
resource estimate (2006). Records showed that 110 holes had been drilled and, of
these, 11 were checked against the original assay data received from the laboratory. No
errors were found. In addition, the entire database was checked using the Gemcom
validation utility. One or two very minor discrepancies were found with respect to the
header information, but none that would impact on resource estimation.
Present protocols are for the assay data to be sent via email and hard copy to the
database manager at site. These data are then converted to comma-delimited files and
imported into the master database for validation. The validated data can then be
exported to various users for specific applications such as geological interpretation,
plotting, and resource estimation.
At the time of the most recent Scott Wilson RPA site visit, a new database system was
being implemented, with automated functions for importing, validating, and exporting the
drill data. Data handling protocols were also being introduced that would provide for the
establishment of a single master database, with one person responsible for its
maintenance. Scott Wilson RPA considers this to be a very worthwhile step and strongly
recommends that all phases of the data handling process be rigorously monitored.
Assay QA/QC results should be reviewed on a continual basis, in a timely fashion, and
remedial actions taken when necessary.
In Scott Wilson RPA’s opinion, the present protocols for data acquisition and
management appear to be reasonable.

SCOTT WILSON RPA www.scottwilson.com
New Gold Inc. – New Afton Project Technical Report NI 43-101 – December 31, 2009 Page 15-1
15 ADJACENT PROPERTIES The New Afton Project is the most advanced exploration and development project in the
area. The ground adjacent to the southeast (Ajax deposit) is 100% owned by Abacus
Mining & Exploration Corp. In July 2009, Wardrop Engineering Inc. produced a
Preliminary Assessment on the property which contemplated a 60,000 tpd open pit mine
and mill facility. Measured and Indicated Mineral Resources for the project were quoted
as 422.4 Mt at a grade of 0.30% Cu, 0.19 g/t Au, 0.0015% Mo, and 0.31 g/t Ag, with an
additional Inferred Resource of 80.6 Mt grading 0.22% Cu, 0.16 g/t Au, 0.0011% Mo,
and 0.38 g/t Ag (Table 15-1). The database for the 2009 Mineral Resource estimate
comprised 140,490 m of diamond drilling in 366 drill holes along with 53 percussion drill
holes totalling 4,386 m.
TABLE 15-1 AJAX DEPOSIT – MINERAL RESOURCE ESTIMATE Abacus Mining & Exploration Corp. – Ajax Deposit
Cut-off
CuEq* (%) Mt Cu (%) Au (g/t) Mo (%) Ag (g/t) CuEq*(%)
Measured 0.13 231.4 0.30 0.18 0.0018 0.35 0.32
Indicated 0.13 211.0 0.29 0.19 0.0012 0.31 0.32 Measured + Indicated
0.13 422.4 0.30 0.19 0.0015 0.31 0.32
Inferred 0.13 80.6 0.22 0.16 0.0011 0.38 0.24
*A recovered copper equivalent grade (CuEq %) is calculated using copper and gold commodity prices of US$2.00/lb and US$700/troy oz (respectively) in the formula:
CuEq (%) = [Cu(%) x Cu-Rec x 22.0462 x $2.00 + Au(g/t) x Au-Rec x 0.03216 x $700] [22.0462 x $2.00]
Revised metal recoveries were used, which were developed during the preparation of the PA: Cu-Rec = 32.591 x Cu(%) + 72.732, and Au-Rec = 33.87 1 x Au(g/t) + 75.29 (max. value = 90%).
Scott Wilson RPA has compiled information from reports filed on SEDAR. Scott Wilson
RPA has been unable to verify information on adjacent properties, and this information is
not necessarily indicative of the mineralization on the property that is the subject of this
Technical Report.

SCOTT WILSON RPA www.scottwilson.com
New Gold Inc. – New Afton Project Technical Report NI 43-101 – December 31, 2009 Page 16-1
16 MINERAL PROCESSING AND METALLURGICAL TESTING This section has been summarized from the Hatch 2007 Feasibility Study as well as the
SGS Mineral Services (SGS) metallurgical test report, both completed in April 2007.
Where necessary, the information on equipment sizing has been updated with recent
data provided by New Gold on the implementation phase of the Project.
METALLURGICAL TESTING A metallurgical test program was developed by Hatch in conjunction with New Gold and
SGS. The primary test work was completed by SGS from March to October 2006, while
secondary programs were completed by Pocock Industrial Inc. (Pocock) and Knelson.
Mineralogy was completed by Advanced Mineral Technology Laboratory (Amtel) and
Vancouver Petrographics Ltd. (VPL). Hatch reviewed and interpreted the results from the
various test programs to develop the process design criteria and flowsheets.
Three ore types represent the mineralization for this copper-gold deposit. At the testing
stage, the proportion of these ore types was estimated based on the resource estimate
at the time. The preliminary metallurgical evaluations focused on the mesogene and
hypogene ore types. The metals of economic interest were copper, gold, silver, and
palladium. Table 16-1 provides a comparison of the estimated percentages for the test
program with the percentages in the 2009 Life of Mine (LOM) plan. In the opinion of
Scott Wilson RPA, the samples used in testing were reasonably representative of the
different ore types.
TABLE 16-1 PERCENTAGE OF ORE TYPE New Gold Inc. – New Afton Project
Rock Type % Estimated for Testing % in LOM Plan
Hypogene (Primary Zone) 50% 52%
Mesogene (Transition Zone) 40% to 50% 44%
Supergene (Enriched Zone) 5% to 10% 4%
SCOTT WILSON RPA www.scottwilson.com
New Gold Inc. – New Afton Project Technical Report NI 43-101 – December 31, 2009 Page 16-2
PROGRAM DESCRIPTION This metallurgical test program was conducted in two phases. The first phase was
conducted on bulk samples representing the mesogene and hypogene ore types, to
establish typical metallurgical requirements for the two main ore types. These samples
were obtained from the exploration decline into the deposit. Barren hanging wall and
footwall materials adjacent to the ore were obtained to evaluate the impact of dilution.
The second phase evaluated the variability of metallurgical response to the standard
conditions established. This phase of the program employed split drill core samples from
various spatial locations in the orebody. In addition, split drill core samples from diamond
drill holes 90 and 91 were included. Drill hole 90 represented two different supergene
ore types, while drill hole 91 was selected to more thoroughly represent the mesogene
ore. SGS completed grinding and flotation tests on all of these samples and also
conducted solid-liquid settling tests on flotation concentrates.
Pocock conducted tailings dewatering tests on various rougher flotation tailings samples.
Their scope of work included flocculant screening, static and dynamic gravity
sedimentation, and pulp rheology, pressure and vacuum filtration tests.
Amtel completed a mineralogical evaluation and reported on the deportment of gold
values in the three ore types. VPL issued two mineralogical examination reports, one on
30 bulk samples for the two main ore types and the second on 70 core and bulk samples
representing the three ore types, footwall, and other rock units.
SAMPLES In the first phase, bulk samples were taken to represent the two main ore types, the
mesogene and the hypogene. For each ore type, three grades were prepared.

SCOTT WILSON RPA www.scottwilson.com
New Gold Inc. – New Afton Project Technical Report NI 43-101 – December 31, 2009 Page 16-3
TABLE 16-2 BULK SAMPLES New Gold Inc. – New Afton Project
Rock Type Low Grade Medium Grade High Grade Average
%Cu g/t Au %Cu g/t Au %Cu g/t Au %Cu g/t Au
Hypogene 0.82 0.34 1.45 1.06 2.19 0.91 1.49 0.77
Mesogene 0.75 0.68 1.56 1.13 1.48 0.54 1.26 0.78
For each bulk sample a total of nine 300 kg drums were collected and shipped to SGS
for metallurgical testing, three drums for each grade range. Composite mixing
proportions were then calculated to blend the three grade samples from each ore type to
match a target assay. The final mesogene master composite assayed 1.44% Cu and
1.26 g/t Au, while the hypogene master composite assayed 1.26% Cu and 1.05 g/t Au.
Scott Wilson RPA notes that the LOM plan grades are lower at 0.96% Cu and 0.72 g/t
Au, and this may have an effect on the metallurgical performance.
Dilution samples were submitted for ore blending to represent the expected dilution with
the selected block caving mining method. Block caving will result in lower selectivity at
the ore interfaces. To evaluate this effect on the metallurgical performance, a total of
approximately 500 kg barren hanging wall and footwall samples were sent to SGS. The
dilution type samples represented the mesogene, hypogene, and picrite rock types.
Supergene samples consisting of split drill core from drill hole 90 were also tested. Six
pails, weighing a total of 193 kg, were sent to SGS. Half of the sample was designated
Type 1, representing a hematite-rich alteration, and half was Type 2, representing a
weaker hematite alteration but with more interval fractures.
For the second phase, variability samples were selected to represent various spatial
locations within the mineralized zones. For this work, 18 pails of split drill core samples
representing supergene, mesogene, and hypogene ore types and the three grade
ranges were submitted. Each pail weighed 24 kg to 30 kg.
In addition nine pails of core samples from drill hole 91, weighing 245 kg, were sent to
SGS. These additional core samples were submitted to provide an expected range of
primary and secondary copper minerals representing all three ore types.

SCOTT WILSON RPA www.scottwilson.com
New Gold Inc. – New Afton Project Technical Report NI 43-101 – December 31, 2009 Page 16-4
MINERALOGY Three laboratories conducted mineralogical studies on the New Afton samples.
• VPL conducted two mineralogical studies: one for hypogene and mesogene ores on the underground bulk samples and a second petrographic study on 70 drill core and underground samples for all three ore types and footwall rocks.
• SGS conducted a modal analysis on the mesogene and hypogene ores and a mineralogical study on hypogene copper concentrate samples.
• Amtel conducted a gold deportment study for all ore types.
The VPL studies are briefly summarized below:
• Hypogene ore contains chalcopyrite (CuFeS2) as the main copper mineral of interest with a chalcopyrite:pyrite ratio of 25:1. Chalcopyrite occurs primarily as free grains but with inclusions in silicates. Gold particles varied in size from 5 µm to 40 µm and occur as native gold between pyrite and chalcopyrite grains. There is sericite present.
• Mesogene ore copper mineralization includes chalcopyrite, as well as bornite (Cu5FeS) and chalcocite (Cu2S) in varying proportions that occur as intergrowths replacing the original chalcopyrite mineralization. Chalcocite tends to be finer grained and dispersed, which will have a negative influence on the final concentrate grade. Pyrite is extremely rare. The content of sericite is higher. No gold particles were observed.
• Supergene ore copper minerals are mainly chalcocite and native copper. Native copper occurs as micro-fracture coatings, which will render recovery by flotation difficult. Lower levels of sericite and carbonate compared to the mesogene ore were observed.
• Footwall Zone rocks resemble mesogene rocks but with lower levels of sericite. Some sulphides are present as barren pyrite, but copper minerals are rare.
The SGS modal analysis quantified the levels of various minerals. This study identified
tennantite (Cu11FeAs4S13) as the primary source of arsenic (As). The As level in
mesogene ore poses an economic concern for the concentrate produced from this ore
type. The study also indicated the presence of tetrahedrite (4Cu2S·Sb2S3) in the
mesogene ore type, which has the potential to cause higher Sb levels in the copper
concentrate, but this was not evident in flotation test results.
The levels of sericite and chlorite were high enough in both the mesogene and
hypogene rock types to cause slimes problem in the dewatering of flotation tailings.

SCOTT WILSON RPA www.scottwilson.com
New Gold Inc. – New Afton Project Technical Report NI 43-101 – December 31, 2009 Page 16-5
Subsequently, it was concluded that tailings would not be thickened as part of the
process (see Mineral Processing section).
The Amtel study noted that approximately 40% of the gold was associated with copper
sulphides and 30% occurred as liberated electrum in all three ore types.
GRINDING A detailed study of the grinding characteristics for the mesogene and hypogene ore
types was undertaken. Coarse ore was subjected to energy determinations using the
Bond Low-energy Impact Test and the JKTech Drop-weight Test (DWT).
Coarse ore was crushed and homogenized to form two grindability composite at minus
1-1/4” and minus six mesh. These samples underwent further grinding tests including
the SAG Power Index (SPI) test, the MacPherson 18” Autogeneous grinding test (AWI),
the Bond Rod Mill work index (RWI), the Bond Ball Mill work index (BWI), and Abrasion
Index (AI) determinations. Those results have been summarized in Table 16-3.
TABLE 16-3 GRINDING INDEX SUMMARY New Gold Inc. – New Afton Project
Rock Type Dry Solids S.G.
SPI (mins)
AWI (kWh/t)
RWI (kWh/t)
BWI (kWh/t)
AI (g)
Hypogene 2.70 200 19.2 18.5 21.8 0.164
Mesogene 2.77 140 18.2 18.3 19.8 0.071
These work indices have classified both ores as being hard and competent, with the
hypogene ore being very hard. For the Abrasion index classifications, the mesogene ore
has been categorized as low-abrasive and the hypogene ores as mildly abrasive.
FLOTATION A total of 83 batch flotation tests and seven locked cycle tests (LCT) were performed
over the entire test program. The first phase test work on the bulk samples included
open circuit and locked cycle tests and evaluated the following:
• primary and regrind product sizes • collector and frother types

SCOTT WILSON RPA www.scottwilson.com
New Gold Inc. – New Afton Project Technical Report NI 43-101 – December 31, 2009 Page 16-6
• flotation kinetics
The effect of dilution with barren rock on the metallurgical performance was studied. A
limited amount of flotation work was conducted on the supergene ore. At the end of the
test program, a flowsheet was established that consisted of two stages of primary
grinding, rougher flotation, rougher concentrate regrinding, first stage cleaning followed
by cleaner-scavenger flotation, and two additional stages of cleaner flotation. The
cleaner-scavenger concentrate was recycled for regrinding. Rougher tailings and the
cleaner-scavenger tailings are handled separately but combine to make final tailings.
The main flotation reagents used were collectors, including potassium amyl xanthate
(PAX), sodium isopropyl xanthate (SIPX), Aero 5100, Aero 7249 and Cytec 3418A (a
phosphine reagent); and frothers, including methyl isobutyl carbinol (MIBC), Dowfroth-
250 (DF250) and pine oil. PAX was selected as the collector based on its traditional role
in porphyry flotation, while DF250 was used as the principal frother. The high sericite
contents of some of the ores will warrant the possible use of carboxyl-methyl-cellulose
(CMC). Subsequent testing determined the ultimate selection of PAX, 3418A, MIBC,
and lime as the reagent suite for the process plant.
The results indicated that a P80 of 160 µm was the optimum primary grind. Finer primary
grinding of the hypogene ore to a P80 of 106 µm did not improve the copper recovery.
Gold flotation kinetics followed that for copper for both ore types.
The optimum regrind size for cleaner flotation performance was between 21 µm and 59
µm for the hypogene and mesogene ores. Consequently, a P80 of 35 µm was selected
for sizing the regrind mill.
Dilution tests on bulk samples included the addition of 10% and 20% hanging wall and
footwall materials for the hypogene (five tests) and mesogene (eight tests) ore types.
This was followed by a series of four cleaner tests on mesogene ore, diluted with
supergene ore by 20% and 40%. The results indicated that the diluting rock produced
similar rougher copper and gold recovery but with higher mass recoveries and
subsequently lower concentrate grades. The impact of this would be an increased load
on the regrind mill and cleaner circuit.
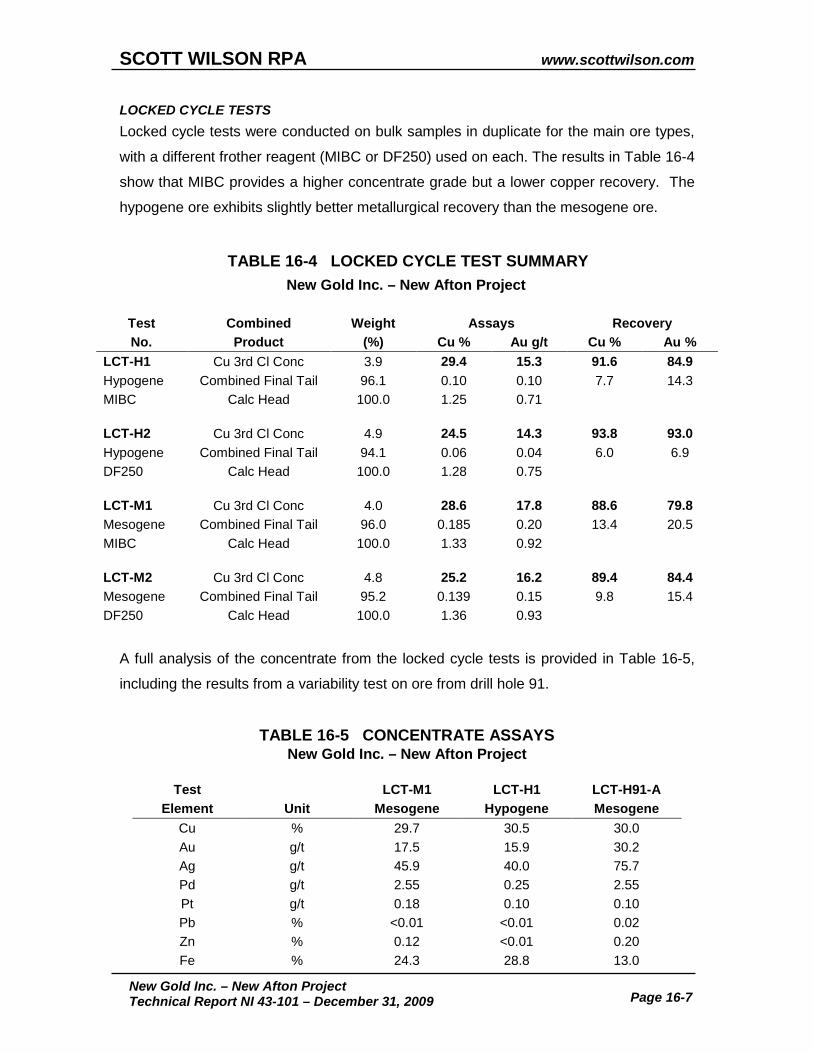
SCOTT WILSON RPA www.scottwilson.com
New Gold Inc. – New Afton Project Technical Report NI 43-101 – December 31, 2009 Page 16-7
LOCKED CYCLE TESTS Locked cycle tests were conducted on bulk samples in duplicate for the main ore types,
with a different frother reagent (MIBC or DF250) used on each. The results in Table 16-4
show that MIBC provides a higher concentrate grade but a lower copper recovery. The
hypogene ore exhibits slightly better metallurgical recovery than the mesogene ore.
TABLE 16-4 LOCKED CYCLE TEST SUMMARY New Gold Inc. – New Afton Project
Test Combined Weight Assays Recovery No. Product (%) Cu % Au g/t Cu % Au %
LCT-H1 Cu 3rd Cl Conc 3.9 29.4 15.3 91.6 84.9 Hypogene Combined Final Tail 96.1 0.10 0.10 7.7 14.3 MIBC Calc Head 100.0 1.25 0.71 LCT-H2 Cu 3rd Cl Conc 4.9 24.5 14.3 93.8 93.0 Hypogene Combined Final Tail 94.1 0.06 0.04 6.0 6.9 DF250 Calc Head 100.0 1.28 0.75 LCT-M1 Cu 3rd Cl Conc 4.0 28.6 17.8 88.6 79.8 Mesogene Combined Final Tail 96.0 0.185 0.20 13.4 20.5 MIBC Calc Head 100.0 1.33 0.92 LCT-M2 Cu 3rd Cl Conc 4.8 25.2 16.2 89.4 84.4 Mesogene Combined Final Tail 95.2 0.139 0.15 9.8 15.4 DF250 Calc Head 100.0 1.36 0.93
A full analysis of the concentrate from the locked cycle tests is provided in Table 16-5,
including the results from a variability test on ore from drill hole 91.
TABLE 16-5 CONCENTRATE ASSAYS New Gold Inc. – New Afton Project
Test LCT-M1 LCT-H1 LCT-H91-A
Element Unit Mesogene Hypogene Mesogene Cu % 29.7 30.5 30.0 Au g/t 17.5 15.9 30.2 Ag g/t 45.9 40.0 75.7 Pd g/t 2.55 0.25 2.55 Pt g/t 0.18 0.10 0.10 Pb % <0.01 <0.01 0.02 Zn % 0.12 <0.01 0.20 Fe % 24.3 28.8 13.0
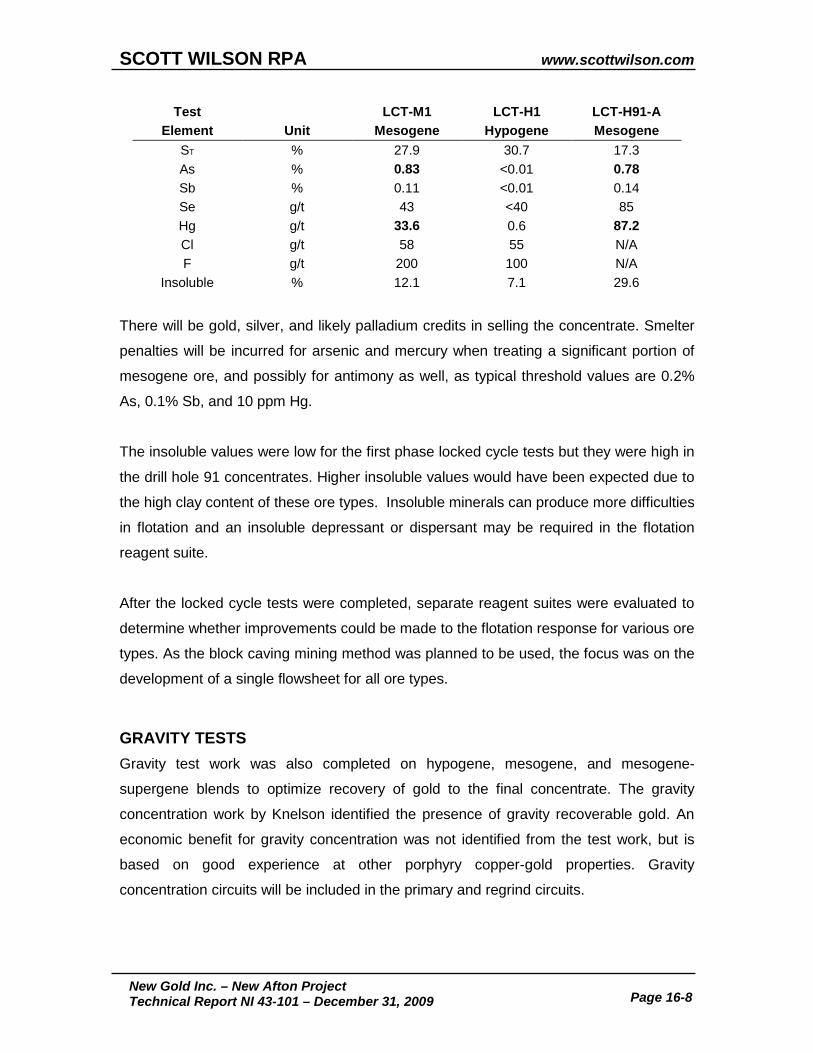
SCOTT WILSON RPA www.scottwilson.com
New Gold Inc. – New Afton Project Technical Report NI 43-101 – December 31, 2009 Page 16-8
Test LCT-M1 LCT-H1 LCT-H91-A Element Unit Mesogene Hypogene Mesogene
ST % 27.9 30.7 17.3 As % 0.83 <0.01 0.78 Sb % 0.11 <0.01 0.14 Se g/t 43 <40 85 Hg g/t 33.6 0.6 87.2 Cl g/t 58 55 N/A F g/t 200 100 N/A
Insoluble % 12.1 7.1 29.6
There will be gold, silver, and likely palladium credits in selling the concentrate. Smelter
penalties will be incurred for arsenic and mercury when treating a significant portion of
mesogene ore, and possibly for antimony as well, as typical threshold values are 0.2%
As, 0.1% Sb, and 10 ppm Hg.
The insoluble values were low for the first phase locked cycle tests but they were high in
the drill hole 91 concentrates. Higher insoluble values would have been expected due to
the high clay content of these ore types. Insoluble minerals can produce more difficulties
in flotation and an insoluble depressant or dispersant may be required in the flotation
reagent suite.
After the locked cycle tests were completed, separate reagent suites were evaluated to
determine whether improvements could be made to the flotation response for various ore
types. As the block caving mining method was planned to be used, the focus was on the
development of a single flowsheet for all ore types.
GRAVITY TESTS Gravity test work was also completed on hypogene, mesogene, and mesogene-
supergene blends to optimize recovery of gold to the final concentrate. The gravity
concentration work by Knelson identified the presence of gravity recoverable gold. An
economic benefit for gravity concentration was not identified from the test work, but is
based on good experience at other porphyry copper-gold properties. Gravity
concentration circuits will be included in the primary and regrind circuits.
SCOTT WILSON RPA www.scottwilson.com
New Gold Inc. – New Afton Project Technical Report NI 43-101 – December 31, 2009 Page 16-9
Subsequent test work determined that final grade concentrate could be produced from
coarse material with flash flotation in the grinding circuit. A flash flotation circuit was
subsequently added to the process plant design.
In addition, Knelson conducted a preliminary bench-scale assessment of native copper
recovery by gravity concentration for the three ore types. This was done because the
native copper values proved to be difficult to recover by flotation methods. Based on the
analysis completed by Knelson, there will be potential to recover some of the copper in
the supergene ore to a gravity concentrate at a marketable concentrate grade. Copper in
hypogene and mesogene ores did not appear to be amenable to gravity concentration.
More work on a larger scale should be completed to quantify the native copper impact on
metallurgy.
VARIABILITY TESTS In the second phase of flotation work, tests were conducted on drill core samples to
determine the variability of flotation response on a spatial basis throughout the different
zones of mineralization. Various intervals from sixteen drill holes were provided for this
evaluation. Within these intervals, the samples were classified by ore type and by copper
grades, as was done in the first phase. A total of 25 open circuit batch cleaner tests were
performed, ten on hypogene ore, seven on mesogene ore, and eight on supergene ore.
A summary of the variability test results is shown in Table 16-6.
Later in the test program, another set of variability samples from drill hole 91 were
provided as a more wide representation of the mesogene ore type; those samples were
provided as three composites, labelled A, B, and C. The sample designations were a
function of the depth in that drill hole. The “A” composite is from the 266 m to 300 m
depth, the “B” composite from 300 m to 360 m depth, and the “C” composite from the
360 m to 418 m depth. Testing on these samples included five batch tests and three
locked cycle tests.
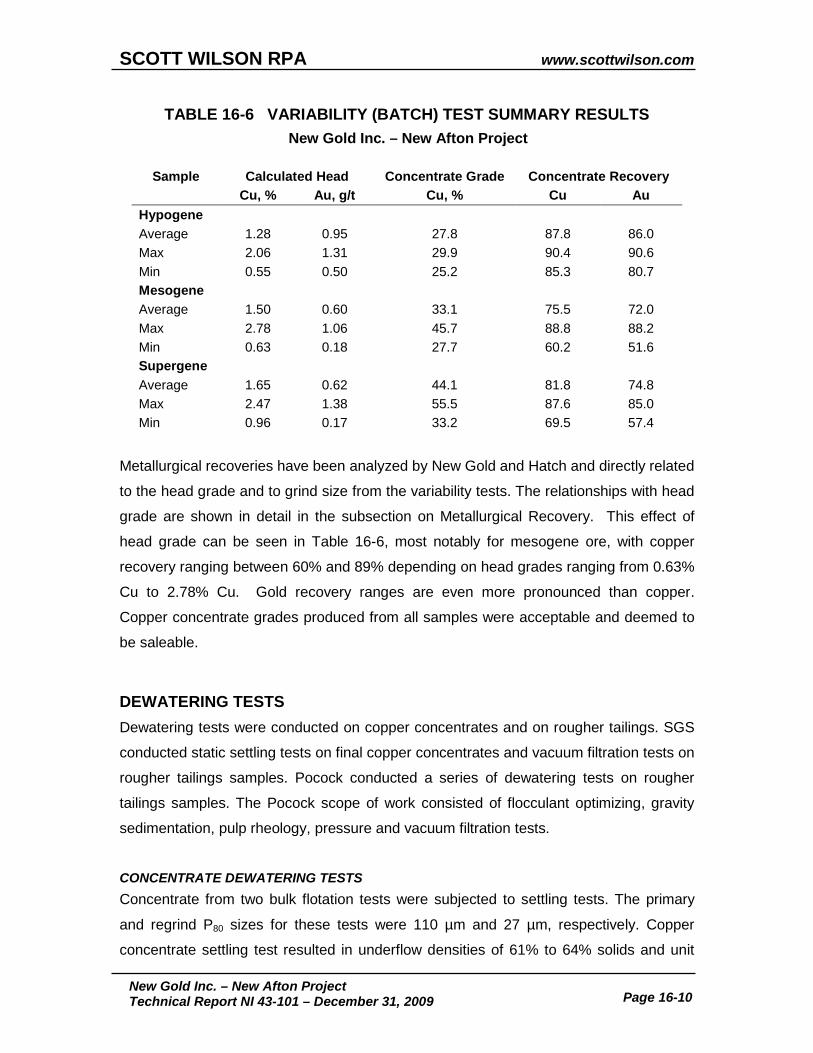
SCOTT WILSON RPA www.scottwilson.com
New Gold Inc. – New Afton Project Technical Report NI 43-101 – December 31, 2009 Page 16-10
TABLE 16-6 VARIABILITY (BATCH) TEST SUMMARY RESULTS New Gold Inc. – New Afton Project
Sample Calculated Head Concentrate Grade Concentrate Recovery
Cu, % Au, g/t Cu, % Cu Au Hypogene Average 1.28 0.95 27.8 87.8 86.0 Max 2.06 1.31 29.9 90.4 90.6 Min 0.55 0.50 25.2 85.3 80.7 Mesogene Average 1.50 0.60 33.1 75.5 72.0 Max 2.78 1.06 45.7 88.8 88.2 Min 0.63 0.18 27.7 60.2 51.6 Supergene Average 1.65 0.62 44.1 81.8 74.8 Max 2.47 1.38 55.5 87.6 85.0 Min 0.96 0.17 33.2 69.5 57.4
Metallurgical recoveries have been analyzed by New Gold and Hatch and directly related
to the head grade and to grind size from the variability tests. The relationships with head
grade are shown in detail in the subsection on Metallurgical Recovery. This effect of
head grade can be seen in Table 16-6, most notably for mesogene ore, with copper
recovery ranging between 60% and 89% depending on head grades ranging from 0.63%
Cu to 2.78% Cu. Gold recovery ranges are even more pronounced than copper.
Copper concentrate grades produced from all samples were acceptable and deemed to
be saleable.
DEWATERING TESTS Dewatering tests were conducted on copper concentrates and on rougher tailings. SGS
conducted static settling tests on final copper concentrates and vacuum filtration tests on
rougher tailings samples. Pocock conducted a series of dewatering tests on rougher
tailings samples. The Pocock scope of work consisted of flocculant optimizing, gravity
sedimentation, pulp rheology, pressure and vacuum filtration tests.
CONCENTRATE DEWATERING TESTS Concentrate from two bulk flotation tests were subjected to settling tests. The primary
and regrind P80 sizes for these tests were 110 µm and 27 µm, respectively. Copper
concentrate settling test resulted in underflow densities of 61% to 64% solids and unit
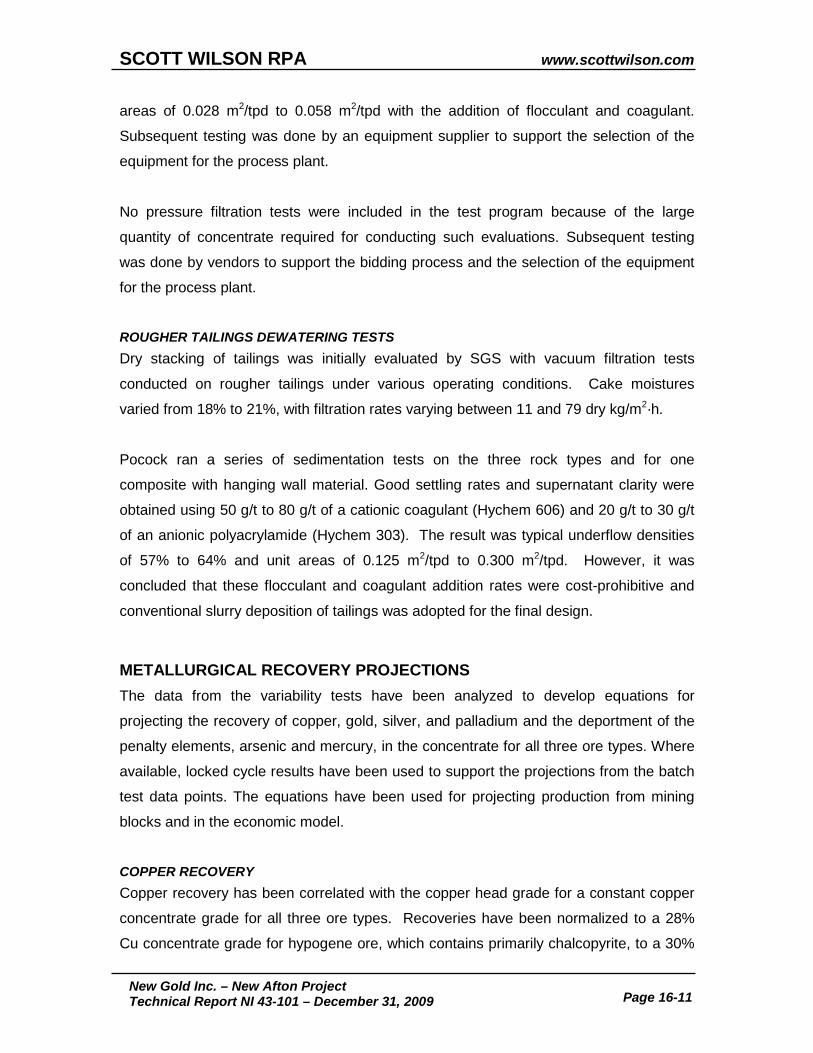
SCOTT WILSON RPA www.scottwilson.com
New Gold Inc. – New Afton Project Technical Report NI 43-101 – December 31, 2009 Page 16-11
areas of 0.028 m2/tpd to 0.058 m2/tpd with the addition of flocculant and coagulant.
Subsequent testing was done by an equipment supplier to support the selection of the
equipment for the process plant.
No pressure filtration tests were included in the test program because of the large
quantity of concentrate required for conducting such evaluations. Subsequent testing
was done by vendors to support the bidding process and the selection of the equipment
for the process plant.
ROUGHER TAILINGS DEWATERING TESTS Dry stacking of tailings was initially evaluated by SGS with vacuum filtration tests
conducted on rougher tailings under various operating conditions. Cake moistures
varied from 18% to 21%, with filtration rates varying between 11 and 79 dry kg/m2·h.
Pocock ran a series of sedimentation tests on the three rock types and for one
composite with hanging wall material. Good settling rates and supernatant clarity were
obtained using 50 g/t to 80 g/t of a cationic coagulant (Hychem 606) and 20 g/t to 30 g/t
of an anionic polyacrylamide (Hychem 303). The result was typical underflow densities
of 57% to 64% and unit areas of 0.125 m2/tpd to 0.300 m2/tpd. However, it was
concluded that these flocculant and coagulant addition rates were cost-prohibitive and
conventional slurry deposition of tailings was adopted for the final design.
METALLURGICAL RECOVERY PROJECTIONS The data from the variability tests have been analyzed to develop equations for
projecting the recovery of copper, gold, silver, and palladium and the deportment of the
penalty elements, arsenic and mercury, in the concentrate for all three ore types. Where
available, locked cycle results have been used to support the projections from the batch
test data points. The equations have been used for projecting production from mining
blocks and in the economic model.
COPPER RECOVERY Copper recovery has been correlated with the copper head grade for a constant copper
concentrate grade for all three ore types. Recoveries have been normalized to a 28%
Cu concentrate grade for hypogene ore, which contains primarily chalcopyrite, to a 30%

SCOTT WILSON RPA www.scottwilson.com
New Gold Inc. – New Afton Project Technical Report NI 43-101 – December 31, 2009 Page 16-12
Cu concentrate grade for mesogene ore, due to the presence of bornite, and 58% Cu
concentrate for supergene ore, due to the presence of native copper.
A recovery increase of 2% to 3% has been applied to the best fit equations based on the
expected improvement in project plant performance vs. batch open circuit cleaner data.
This increase is supported by locked cycle test results for hypogene and mesogene ore
types. Typically, locked cycle recovery would be higher than that from batch open
cleaners for the same concentrate grade and it would be indicative of the recovery that
may be achieved in an optimized plant operation. For supergene ore, the correlation has
been developed based on flotation only with an increase to allow for potential native
copper recovery by gravity concentration.
For Hypogene ore, the correlation for copper recovery is expressed as:
% Cu recovery = 6.2059·Ln (F) + 90.69 where F = % Cu(ore)
For Mesogene ore, the correlation is based on tails losses and is expressed as:
% Cu recovery = 100(28.062 – 3.168/F) (29.8944 – 0.0646·F) where F = % Cu(ore)
For Supergene ore, the correlation is estimated as follows:
% Cu recovery = 41.308·Ln (F) + 54.833 where F = % Cu(ore)
GOLD RECOVERY Amtel’s mineralogical study concluded that gold is primarily associated with copper
sulphides that will be recoverable by flotation in all three ore types. For hypogene ore,
the gold recovery did not correlate well with copper recovery, but the gold concentration
ratio correlated well with copper concentration ratio. For mesogene and supergene ore
types, there was a reasonable direct correlation between gold recovery and copper
recovery.

SCOTT WILSON RPA www.scottwilson.com
New Gold Inc. – New Afton Project Technical Report NI 43-101 – December 31, 2009 Page 16-13
For Hypogene ore, gold recovery was calculated using the concentration ratio
correlation and the calculated concentrate production based on copper:
g/t Au (conc) = 1.0447x - 1.8458 g/t Au (ore) where x = %Cu(conc) %Cu(ore)
For Mesogene ore, gold recovery was calculated as follows:
% Au recovery = 15.754·e0.0193x where x = % Cu recovery
For Supergene ore, gold recovery was calculated as follows:
% Au recovery = 0.6545x + 24.715 where x = % Cu recovery
SILVER RECOVERY For both hypogene and mesogene ore types, silver recovery has a poor direct
correlation with copper recovery, but the silver concentration ratio correlated well with
copper concentration, similar to the hypogene gold recovery.
For Hypogene ore, silver recovery was calculated using the concentration ratio
correlation and the calculated concentrate production based on copper:
g/t Ag (conc) = 1.181x - 10.271 g/t Ag (ore) where x = %Cu(conc) %Cu(ore)
For Mesogene ore, silver recovery was calculated using the concentration ratio
correlation and the calculated concentrate production based on copper:
g/t Ag (conc) = 0.7922x – 2.2975 g/t Ag (ore) where x = %Cu(conc) %Cu(ore)
For Supergene ore, silver recovery was calculated as follows:
% Ag recovery = 0.714x1.067
where x = % Cu recovery

SCOTT WILSON RPA www.scottwilson.com
New Gold Inc. – New Afton Project Technical Report NI 43-101 – December 31, 2009 Page 16-14
ARSENIC AND MERCURY CONTENT IN CONCENTRATE For hypogene and mesogene ore types, the data showed a strong correlation between
the arsenic and mercury concentration ratios and copper concentration ratio. These
correlations were used to determine the economical concentrate grade (particularly for
mesogene ore which contains higher arsenic) by assessing the effect of concentrate
copper grade on the levels of these elements in the concentrate and their associated
penalties.
For Hypogene ore, the concentration relationships are as follows:
% As (conc) = 0.8615x - 6.2294 % As (ore)
g/t Hg (conc) = 1.162x - 11.434 g/t Hg (ore) where x = %Cu(conc)
%Cu(ore)
For Mesogene ore, the concentration relationships are as follows:
% As (conc) = 0.6285x + 6.0855 % As (ore)
g/t Hg (conc) = 0.3864x + 8.2154 g/t Hg (ore) where x = %Cu(conc)
%Cu(ore)
For Supergene ore, the arsenic and mercury content in the concentrate correlated
directly with their respective ratio to copper in the feed as follows:
% As(conc) = 40.658x - 0.0716 where x = %As(ore) %Cu(ore) g/t Hg(conc) = 51.077x - 8.4396 where x = g/t Hg(ore) %Cu(ore)

SCOTT WILSON RPA www.scottwilson.com
New Gold Inc. – New Afton Project Technical Report NI 43-101 – December 31, 2009 Page 16-15
MINERAL PROCESSING The New Afton processing facilities have been designed to process 4 Mtpa of ore and
recover copper, gold, and silver. A conventional crushing, grinding, gravity concentration
and flotation process has been proposed for the Project, utilizing standard processes
and equipment.
The process design criteria were developed based on a combination of test work results,
experience from similar operations, and industry practice. The following process
description should be read in conjunction with the process flow diagram shown in Figure
16-1.
PROCESS DESCRIPTION The New Afton mill has been designed to process a blend of primary, transition, and
supergene ores. The process will utilize conventional crushing, grinding, and
concentration processes to separate valuable minerals from gangue into concentrates at
marketable grades. Mineral separation will be achieved by gravity concentration and
differential flotation. A regrinding stage will be included in the flotation circuit.
The New Afton mill has been designed to process 11,000 tpd of ore at full capacity and
will operate 24 hours per day, 365 days per year. The plant will consist of the following
unit operations.
• Primary crushing • Conveying from underground to surface • Stockpiles – coarse ore storage and reclaim, and intermediate waste storage • SAG mill primary grinding with cone crushing of recycle pebbles • Ball mill secondary grinding with closed circuit cyclone classification • Gravity concentration • Flash Flotation • Rougher flotation • Rougher concentrate regrinding, classification and gravity concentration • Cleaning flotation in three stages with one open stage of cleaner-scavenger • Concentrate thickening and storage • Concentrate pressure filtration • Concentrate storage, loading and weighing (on-site) • Tailings cycloning and water reclaim
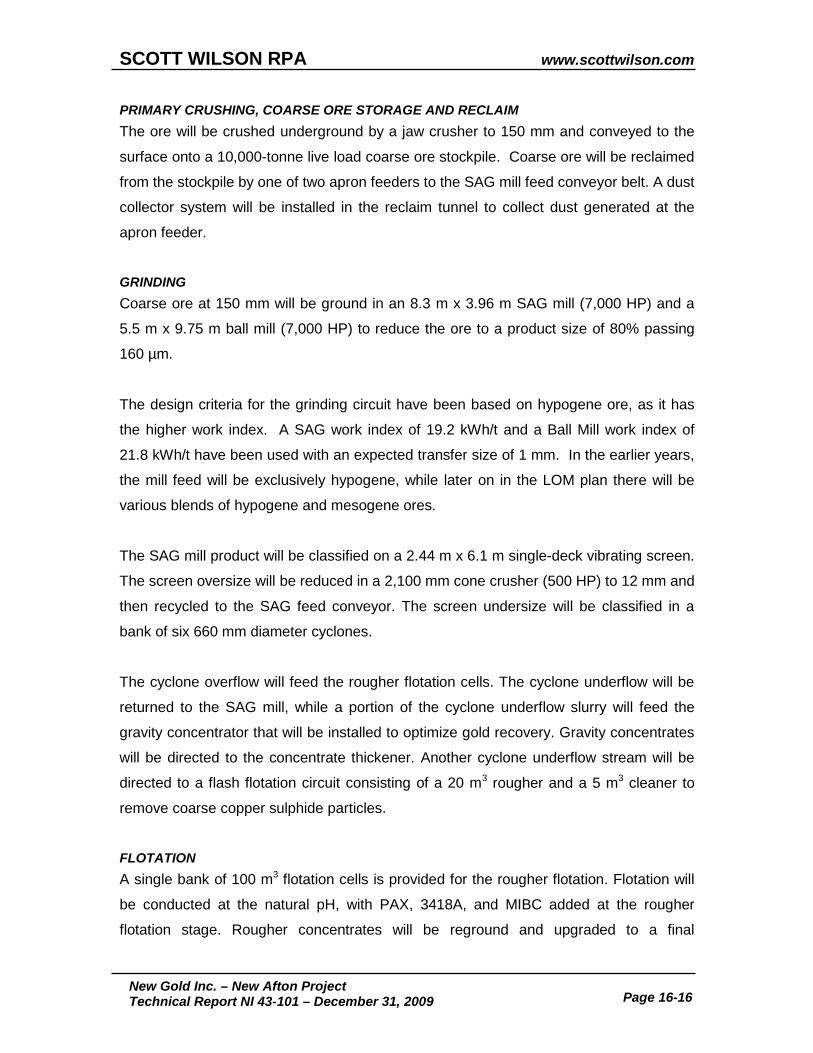
SCOTT WILSON RPA www.scottwilson.com
New Gold Inc. – New Afton Project Technical Report NI 43-101 – December 31, 2009 Page 16-16
PRIMARY CRUSHING, COARSE ORE STORAGE AND RECLAIM The ore will be crushed underground by a jaw crusher to 150 mm and conveyed to the
surface onto a 10,000-tonne live load coarse ore stockpile. Coarse ore will be reclaimed
from the stockpile by one of two apron feeders to the SAG mill feed conveyor belt. A dust
collector system will be installed in the reclaim tunnel to collect dust generated at the
apron feeder.
GRINDING Coarse ore at 150 mm will be ground in an 8.3 m x 3.96 m SAG mill (7,000 HP) and a
5.5 m x 9.75 m ball mill (7,000 HP) to reduce the ore to a product size of 80% passing
160 µm.
The design criteria for the grinding circuit have been based on hypogene ore, as it has
the higher work index. A SAG work index of 19.2 kWh/t and a Ball Mill work index of
21.8 kWh/t have been used with an expected transfer size of 1 mm. In the earlier years,
the mill feed will be exclusively hypogene, while later on in the LOM plan there will be
various blends of hypogene and mesogene ores.
The SAG mill product will be classified on a 2.44 m x 6.1 m single-deck vibrating screen.
The screen oversize will be reduced in a 2,100 mm cone crusher (500 HP) to 12 mm and
then recycled to the SAG feed conveyor. The screen undersize will be classified in a
bank of six 660 mm diameter cyclones.
The cyclone overflow will feed the rougher flotation cells. The cyclone underflow will be
returned to the SAG mill, while a portion of the cyclone underflow slurry will feed the
gravity concentrator that will be installed to optimize gold recovery. Gravity concentrates
will be directed to the concentrate thickener. Another cyclone underflow stream will be
directed to a flash flotation circuit consisting of a 20 m3 rougher and a 5 m3 cleaner to
remove coarse copper sulphide particles.
FLOTATION A single bank of 100 m3 flotation cells is provided for the rougher flotation. Flotation will
be conducted at the natural pH, with PAX, 3418A, and MIBC added at the rougher
flotation stage. Rougher concentrates will be reground and upgraded to a final

SCOTT WILSON RPA www.scottwilson.com
New Gold Inc. – New Afton Project Technical Report NI 43-101 – December 31, 2009 Page 16-17
concentrate grade with three stages of cleaner and one stage of cleaner-scavenger
flotation.
Rougher and recycled cleaner-scavenger concentrates will be reground in a 1,250 HP
vertical grinding mill operating in closed circuit with three 381 mm diameter cyclones. A
second collector, Aerophine 3418A will be added to the regrind mill. The regrind mill will
produce a particle size distribution of 80% passing 35 μm. The cyclone overflow will then
advance to the cleaning stages.
The first cleaner consists of a bank of seven 20 m3 flotation cells operating in open
circuit, while the second and third cleaners will operate in closed circuit. The first cleaner
concentrate will be fed to the second cleaner circuit, while the first cleaner-scavenger
tails will report to the final tails pump box. The second cleaner concentrate will feed the
third cleaner circuit to produce the final copper concentrate. The second and third
cleaner circuits consist of 5 m3 flotation cells.
DEWATERING AND CONCENTRATE TRANSPORTATION The concentrate dewatering circuit includes thickening and pressure filtration. The final
concentrates from the third cleaner flotation stage will be dewatered in an 18 m diameter
thickener with flocculant added to the solution to enhance solids settling and to achieve
the target underflow density of 65% solids by weight. The thickener overflow will be re-
used as process water in the plant.
The underflow from the thickener will be pumped to a concentrate stock tank that will be
designed for 24-hour storage. Stock tank concentrate will be pumped to one of two 40
m2 pressure filters to produce a concentrate cake containing 8% to 12.5% H2O. The
concentrate filter cake will be discharged onto a 1,320-tonne capacity concentrate
stockpile in the loading shed. Concentrates will be sampled, loaded into B-Line trucks,
and weighed prior to shipment from the site.

December 2009 Source: New Gold Inc., 2009.
New Afton Project
Process Flow Sheet
New Gold Inc.
British Columbia, Canada
Figure 16-1
SC
OT
TW
IL
SO
N R
PA
16-1
8
ww
w.sco
ttwilso
n.co
m

SCOTT WILSON RPA www.scottwilson.com
New Gold Inc. – New Afton Project Technical Report NI 43-101 – December 31, 2009 Page 16-19
TAILINGS DISPOSAL The tailings handling system will pump the combined tailings (from the rougher flotation
circuit and the cleaner scavenger circuit) to the Cyclone Plant, a set of primary cyclones,
located adjacent to the tailings storage facility (TSF).
The cyclone underflow product will be delivered to a skid-mounted secondary cyclone
pack located on the top of the tailings dam. The sand or coarse fraction from these
secondary cyclones will be used to construct the tailings dam and the secondary cyclone
overflow product will be used to seal the wet side of that dam. A centreline construction
method will be used to establish the tailings dam structure. There will be three seepage
collection ponds below the dry side of the main tailings dam to recover and return
seepage back to the TSF.
TAILINGS STORAGE FACILITY The TSF includes the Pothook pit, the tailings dam, and the impoundment zone. The
concept of “dry-stacking” for tailings disposal was evaluated earlier and dropped for
various reasons, principally related to the prohibitive costs of the flocculants and
coagulants. The plan is to create a centreline raised tailings dam with an upstream (u/s)
low-permeability core of compacted glacial till and a downstream (d/s) shell of cycloned
sand from the tailings. Certain segments of the tailings dam will also include a starter
dam constructed solely out of native glacial till. Cyclone overflow (fines) and the unused
whole tailings will be impounded behind the dam, along with a small amount of operating
water and seasonal surplus water. The impounded water is to be reclaimed and reused
in the plant.
The TSF partially overlies former waste rock dumps and partially is located on native
ground. Areas covering waste rock dumps will be lined with a 1.5 mm thick
geomembrane to prevent piping into the waste rock.
Initially, whole tailings will be stored in Pothook pit followed by a stage during which a
layer of whole tailings will be deposited in the entire impoundment area. Subsequently,
a cycloning operation consisting of primary and secondary cyclones will go in operation
to separate the sand fraction from the whole tailing.

SCOTT WILSON RPA www.scottwilson.com
New Gold Inc. – New Afton Project Technical Report NI 43-101 – December 31, 2009 Page 16-20
The tailings deposition design is based upon the feasibility production schedule which
commenced with two years at 1.6 Mtpa before ramping up to 4 Mtpa and contained a
LOM plan of 44.4 Mt. The revised production plan contains 47.4 Mt and moves
immediately to a production rate of 4 Mtpa. New Gold has modified the tailings dam
design and schedule to accommodate these changes.

SCOTT WILSON RPA www.scottwilson.com
New Gold Inc. – New Afton Project Technical Report NI 43-101 – December 31, 2009 Page 17-1
17 MINERAL RESOURCE AND MINERAL RESERVE ESTIMATES MINERAL RESOURCES
HISTORY Mr. Gary Giroux, P. Eng., completed an initial resource estimate for the Project in May
2003, which was then updated in January 2004. The estimate was prepared using a
block model constrained by a wireframe model of the mineralized body. Grade was
interpolated into the blocks using Ordinary Kriging (OK). The January 2004 Measured
and Indicated Mineral Resource estimate for the Afton Main Zone at a cut-off grade of
0.7% copper equivalent (CuEq) was 68.7 Mt at a grade of 1.08% Cu, 0.85 g/t Au, 2.62
g/t Ag, and 0.12 g/t Pd. Total contained metal was 1,640 million pounds of Cu and 1.9
million ounces of Au. There was an additional Inferred Mineral Resource of 7.45 Mt at
0.92% Cu, 0.78 g/t Au, 2.34 g/t Ag, 0.12 g/t Pd (Behre Dolbear, 2004).
Following completion of definition drilling, in 2006, Scott Wilson RPA re-estimated the
Mineral Resources at New Afton using a block model constrained by wireframe models
of the principal mineralized zones. Grades for Ag, Au, Cu, and Pd were interpolated into
the blocks using OK. The wireframe models were constructed by New Gold personnel
and inspected by Scott Wilson RPA prior to their use in the block model. High grades for
all four elements were capped before compositing.
Measured and Indicated Mineral Resources totalled 65.7 Mt grading 1.02% Cu, 0.77 g/t
Au, and 2.59 g/t Ag. In addition, a modest Inferred Mineral Resource of 7.9 Mt grading
0.96% Cu, 0.88 g/t Au, and 1.6 g/t Ag was estimated for the C Zone.
INTRODUCTION The most recent Mineral Resource estimate, which is the subject of this audit, was
prepared by Messrs. Robert Sim, P. Geo., and Bruce Davis, FAusIMM, in September
2009 (Sim and Davis, 2009), hereafter referred to as the "2009 resource model" or "2009
resource estimate". A probability shell was generated using Indicator Kriging (IK) to
serve as a constraining wireframe model for the deposit. The estimate was made using
a block model method, with grades interpolated using OK for Cu, Au, Ag, and Pd. In

SCOTT WILSON RPA www.scottwilson.com
New Gold Inc. – New Afton Project Technical Report NI 43-101 – December 31, 2009 Page 17-2
addition, potentially deleterious components were estimated into the blocks, including
As, Hg, Sb, Bi, Cd, Fe, Ni, Pb, S, Se, Te, and Zn. These estimates were made using
Inverse Distance Squared (ID2) weighting.
The Mineral Resource estimate, as reported by Sim and Davis (2009) is shown in Table
17-1.
The model was constructed using MineSite software, which is an off-the-shelf
commercial package commonly used in the industry. Wireframe models of the
topography and the DMZ were generated by New Gold personnel. The probability grade
shell was created using IK, with some manual modifications afterward. The grade shell
encloses blocks with a greater than 50% probability of grading greater than 0.25% Cu.
The database for the grade interpolations was entirely composed of diamond drill
samples collected by New Gold over the period 2000 to the present.
TABLE 17-1 MINERAL RESOURCE SUMMARY New Gold Corp. – New Afton Project
Cut-off Grade
Mtonnes Cu% Au g/t Ag g/t Pd g/t (Cu%)
Measured 0.2 37.7 1.19 0.85 2.6 0.10 0.3 34.5 1.28 0.92 2.8 0.11 0.4 33.1 1.32 0.94 2.9 0.11 0.5 31.8 1.35 0.97 2.9 0.11 0.6 30.3 1.39 0.99 3.0 0.11 0.7 28.5 1.44 1.02 3.1 0.11 0.8 26.6 1.49 1.05 3.2 0.11 0.9 24.5 1.55 1.08 3.3 0.11 1.0 22.4 1.60 1.11 3.5 0.11
Indicated 0.2 40.4 0.69 0.52 1.8 0.08 0.3 27.6 0.90 0.68 2.3 0.10 0.4 23.0 1.01 0.76 2.6 0.11 0.5 20.0 1.10 0.82 2.8 0.11 0.6 17.7 1.17 0.87 2.9 0.11
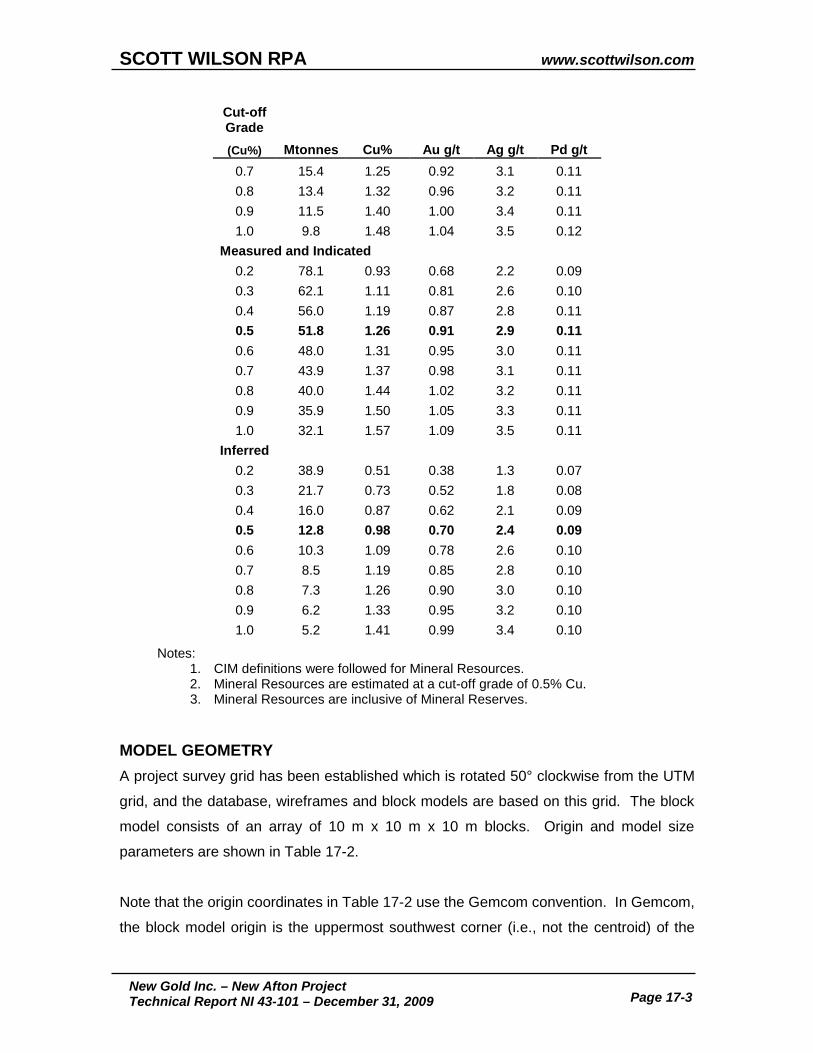
SCOTT WILSON RPA www.scottwilson.com
New Gold Inc. – New Afton Project Technical Report NI 43-101 – December 31, 2009 Page 17-3
Cut-off Grade
Mtonnes Cu% Au g/t Ag g/t Pd g/t (Cu%)
0.7 15.4 1.25 0.92 3.1 0.11 0.8 13.4 1.32 0.96 3.2 0.11 0.9 11.5 1.40 1.00 3.4 0.11 1.0 9.8 1.48 1.04 3.5 0.12
Measured and Indicated 0.2 78.1 0.93 0.68 2.2 0.09 0.3 62.1 1.11 0.81 2.6 0.10 0.4 56.0 1.19 0.87 2.8 0.11 0.5 51.8 1.26 0.91 2.9 0.11 0.6 48.0 1.31 0.95 3.0 0.11 0.7 43.9 1.37 0.98 3.1 0.11 0.8 40.0 1.44 1.02 3.2 0.11 0.9 35.9 1.50 1.05 3.3 0.11 1.0 32.1 1.57 1.09 3.5 0.11
Inferred 0.2 38.9 0.51 0.38 1.3 0.07 0.3 21.7 0.73 0.52 1.8 0.08 0.4 16.0 0.87 0.62 2.1 0.09 0.5 12.8 0.98 0.70 2.4 0.09 0.6 10.3 1.09 0.78 2.6 0.10 0.7 8.5 1.19 0.85 2.8 0.10 0.8 7.3 1.26 0.90 3.0 0.10 0.9 6.2 1.33 0.95 3.2 0.10 1.0 5.2 1.41 0.99 3.4 0.10
Notes: 1. CIM definitions were followed for Mineral Resources. 2. Mineral Resources are estimated at a cut-off grade of 0.5% Cu. 3. Mineral Resources are inclusive of Mineral Reserves.
MODEL GEOMETRY A project survey grid has been established which is rotated 50° clockwise from the UTM
grid, and the database, wireframes and block models are based on this grid. The block
model consists of an array of 10 m x 10 m x 10 m blocks. Origin and model size
parameters are shown in Table 17-2.
Note that the origin coordinates in Table 17-2 use the Gemcom convention. In Gemcom,
the block model origin is the uppermost southwest corner (i.e., not the centroid) of the
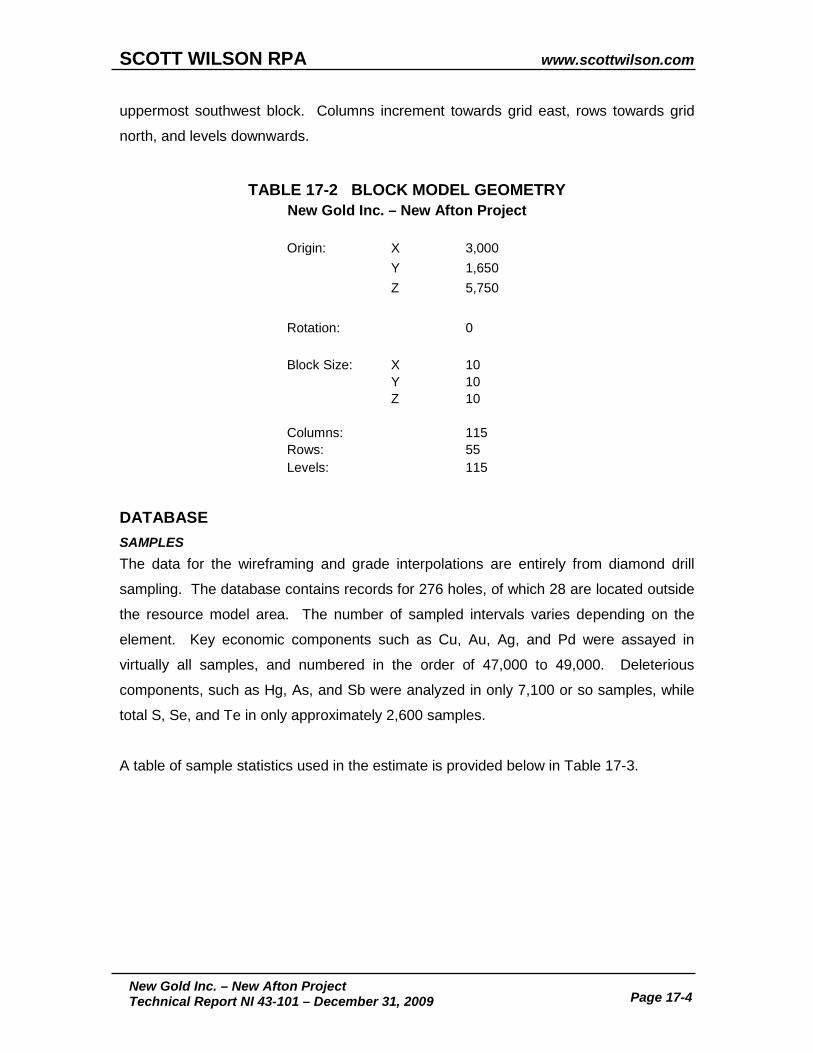
SCOTT WILSON RPA www.scottwilson.com
New Gold Inc. – New Afton Project Technical Report NI 43-101 – December 31, 2009 Page 17-4
uppermost southwest block. Columns increment towards grid east, rows towards grid
north, and levels downwards.
TABLE 17-2 BLOCK MODEL GEOMETRY New Gold Inc. – New Afton Project
Origin: X 3,000 Y 1,650 Z 5,750
Rotation:
0
Block Size: X 10 Y 10 Z 10
Columns:
115 Rows:
55
Levels: 115
DATABASE SAMPLES The data for the wireframing and grade interpolations are entirely from diamond drill
sampling. The database contains records for 276 holes, of which 28 are located outside
the resource model area. The number of sampled intervals varies depending on the
element. Key economic components such as Cu, Au, Ag, and Pd were assayed in
virtually all samples, and numbered in the order of 47,000 to 49,000. Deleterious
components, such as Hg, As, and Sb were analyzed in only 7,100 or so samples, while
total S, Se, and Te in only approximately 2,600 samples.
A table of sample statistics used in the estimate is provided below in Table 17-3.

SCOTT WILSON RPA www.scottwilson.com
New Gold Inc. – New Afton Project Technical Report NI 43-101 – December 31, 2009 Page 17-5
TABLE 17-3 STATISTICAL SUMMARY OF SAMPLE ASSAY DATA New Gold Inc. – New Afton Project
Element No. of Samples
Total Length (m) Min Max Mean Std Dev
Copper (%) 48,670 101,588.9 0.01 13.70 0.325 0.695
Gold (g/t) 48,969 102,279.2 0.00 22.10 0.279 0.655
Silver (g/t) 46,977 98,134.9 0.00 1,880.00 0.971 8.896
Palladium (g/t) 48,971 102,283.2 0.00 14.10 0.048 0.141
Arsenic (ppm) 7,161 14,918.2 0.10 10,001.00 142.910 643.170
Iron (%) 7,153 14,902.2 0.62 21.78 5.010 1.909
Mercury (ppb) 7,064 14,724.4 2.00 94,600.00 635.020 2,882.070
Antimony (ppm) 7,161 14,918.2 0.00 2,365.00 23.830 94.970
Selenium (ppm) 2,651 5,296.3 0.10 36.40 2.620 2.980
Tellurium (ppm) 2,610 5,214.3 0.01 2.88 0.140 0.267
Bismuth (ppm) 7,159 14,914.2 0.01 190.00 4.986 10.776
Cadmium (ppm) 7,159 14,914.2 0.01 163.81 0.828 2.347
Nickel (ppm) 7,159 14,914.2 0.50 1,480.00 61.73 122.640
Lead (ppm) 7,159 14,914.2 0.01 410.00 22.561 23.655
Sulphur (%) 2,610 5,214.3 0.01 10.10 1.537 1.797
Zinc (ppm) 7,159 14,914.2 0.50 1,346.00 82.480 98.620 COMPOSITES The sample data were composited to two-metre downhole lengths. The two-metre
interval was selected because approximately 93% of the samples are two metres in
length and because this length results in the least change to the original data. In Scott
Wilson RPA’s opinion, this is a reasonable criterion for selection of the composite
interval.
In reviewing the data, Sim and Davis (2009) noted that there were several sections of
the drill holes that were not sampled (termed “missing intervals”). Some of the
unsampled intervals were non-mineralized and deliberately ignored to save assay costs.
Other missing intervals occurred in the database where holes were wedged. The upper
portion of the pilot hole down to the wedge is carried in the record for that wedge to
ensure that it plots at the appropriate depth. The samples for this interval are assigned
to the pilot hole, and consequently, the upper portion of the wedge hole appears as
SCOTT WILSON RPA www.scottwilson.com
New Gold Inc. – New Afton Project Technical Report NI 43-101 – December 31, 2009 Page 17-6
“missing” in the sample record. Still other intervals are truly “missing” (i.e., they have
been lost and are unaccounted for).
It is conventional practice to assign zero grade to missing intervals, however, there are
several instances in the database where this would be unfairly conservative, and these
should be ignored. Sorting out which missing intervals should be assigned zero grade is
onerous and error-prone. Sim and Davis (2009) carried out a study to determine what
effect ignoring all of the missing intervals had on the global resource estimate and found
this effect to be negligible. Consequently, all missing intervals were ignored in the
compositing. In Scott Wilson RPA’s opinion, this is a reasonable approach.
ESTIMATION DOMAINS For the 2006 estimate, New Gold geologists had prepared wireframe models of what
they perceived to be the principal mineralogical zones within the deposit. There were
four principal zones of mineralization: supergene, mesogene, hypogene, and the C
Zone. The hypogene zone was simply the primary sulphide mineralization, consisting of
chalcopyrite and lesser bornite with accessory pyrite. The mesogene zone was defined
as encompassing material that had begun to show signs of oxidation, typified by the
emergence of chalcocite replacing primary Cu sulphides. The supergene zone was
interpreted to be the region of the deposit where the Cu minerals had been entirely
oxidized to native Cu or remnant chalcocite. The C Zone was (and still is) considered to
be a separate hypogene sulphide body residing below the main body of mineralization.
A fifth domain, the DMZ, was recognized and partially modelled but was not as well
understood as it is now. Further interpretive work by New Gold geologists has
determined that this is a distinct post-mineral intrusive phase that can be identified in drill
core, but had hitherto been considered an altered equivalent of the host units.
Additional wireframe modelling has also been completed on the fault zones which both
bracket and transect the deposit. The two principal fault zones, the Hanging Wall and
Footwall, have been modelled in some detail. Additional crossing structures and splays
have been modelled to a somewhat lesser degree of completeness yet still serve to
improve overall understanding of the controls to mineralization.

SCOTT WILSON RPA www.scottwilson.com
New Gold Inc. – New Afton Project Technical Report NI 43-101 – December 31, 2009 Page 17-7
For the updated model, a review was undertaken to determine if the various domains
from the 2006 models could be used. The following conclusions were made:
• The boundaries of the zones, as they appear in the drilling, are indistinct and somewhat subjective.
• The geologists responsible for interpreting the zones had since left the company, and the wireframes had not been fully updated with the newer drill information.
• There was scepticism and doubt as to the original interpreted zones and not
enough time or resources to reinterpret them.
• Statistical analyses and contact profiles demonstrated that there were no real differences in grade characteristics between the zones; therefore, constraining the grade interpolations on that basis did not appear to be relevant.
As a result, the decision was taken to construct a grade shell as the defining boundary of
the deposit. The 2006 wireframes were retained for assignment of bulk densities to the
blocks and for general characterization of the deposit.
The grade shell was derived from an IK model wherein material with a greater than 50%
probability of grading higher than 0.25% Cu was defined as “in the zone”. From this,
three principal estimation domains were established: the DMZ, the grade shell, and
outside of either the grade shell or the DMZ.
Scott Wilson RPA inspected the probability shell and attempted to re-create it from the
2009 resource model composite data. A semi-variogram analysis was carried out using
Sage, the same software used by Sim and Davis (2009). The variogram model derived
from this analysis was built into a model in GEMS, and a new indicator model generated.
Scott Wilson RPA notes that the GEMS software is more limited than MineSite and so it
was not possible to exactly copy the search parameters. The resulting probability shell
was compared to the 2009 resource model in plan and section views. For the most part,
the two wireframes were similar in size and shape, however, there were some notable
differences which have yet to be explained. As it happens, this turned out to be
inconsequential, as a resource estimate created from the GEMS probability shell yielded
almost identical results as those in the 2009 resource estimate. Scott Wilson RPA
concludes that there is very little sensitivity in the model to small changes in the
probability shell.

SCOTT WILSON RPA www.scottwilson.com
New Gold Inc. – New Afton Project Technical Report NI 43-101 – December 31, 2009 Page 17-8
The use of probability shells in resource estimation is an acceptable practice and, if
prepared by experienced practitioners (as in this case), a reasonable approach.
However, in Scott Wilson RPA’s opinion, it would be preferable to use deterministic
models of the geological domains interpreted from lithological or mineralogical
characteristics. In this case, time and cost constraints for completing the estimate left
little choice. Reverting to the grade shell has not had a significant impact on either the
Mineral Resource or Mineral Reserve estimates. The last three estimates for the New
Afton deposits have been prepared using markedly different methods, which all have
produced similar results. In Scott Wilson RPA’s opinion, this suggests that the estimate
is quite robust and is based on sufficient drilling information to be relatively insensitive to
changes in methodology.
In Scott Wilson RPA’s opinion, domains based on mineralogical parameters are useful
for reasons other than the Mineral Resource estimate. Metallurgical recoveries are
observed to vary between the different mineralogical zones. Similarly, the geotechnical
characteristics of the rock mass are observed to have a measurable impact on the
quality of the rock mass. Scott Wilson RPA recommends that for future block models
these components be included in the modelling process, if possible.
CAPPING OF HIGH GRADES Composite statistics for the economic components in the three principal domains are
shown in Table 17-4. Histograms and probability plots are provided in Appendix 1.
Scott Wilson RPA notes that the distributions of all components are positively skewed
and this generally results in overestimation of metal contents unless some remedial step
is taken. Mean values generated from non-normally distributed data are often times
biased in relation to the true average grade. A common practice in the industry is to cap
grades at some predetermined level, and in so doing, limit the impact of the highest
grade samples. The 2009 resource model incorporates grade caps that have been
applied to the composited sampled data prior to running the grade interpolation. A
summary of the caps applied is provided in Table 17-5.
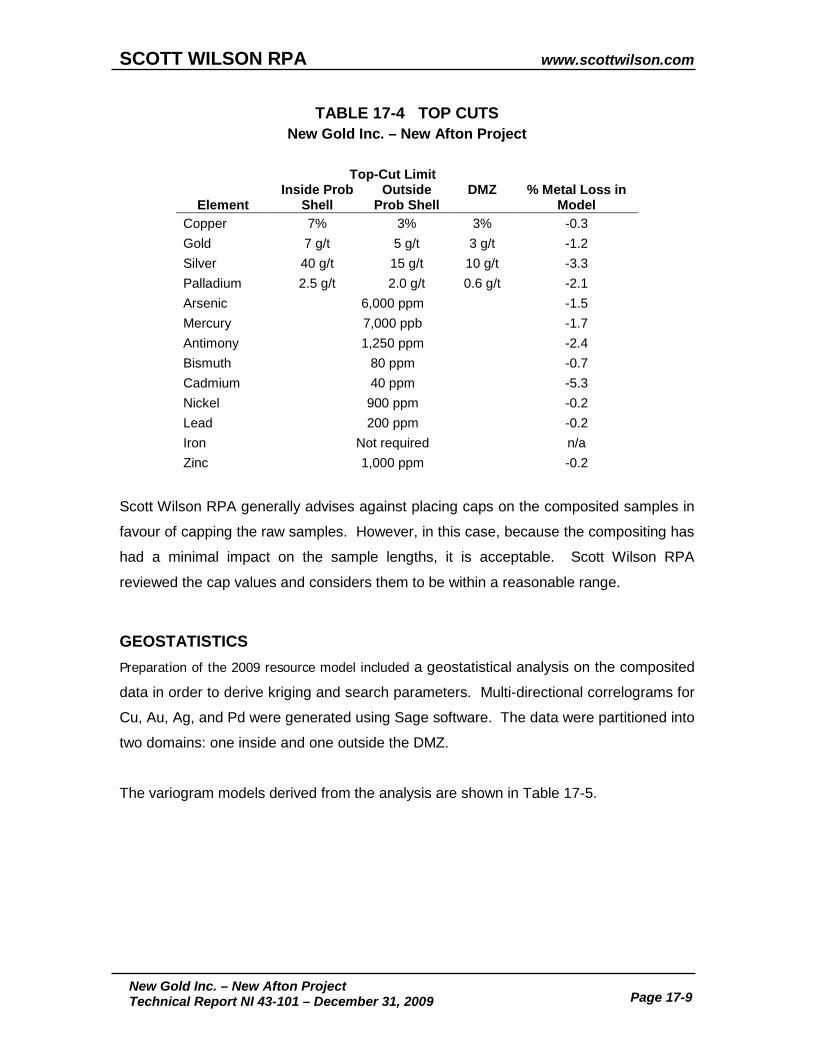
SCOTT WILSON RPA www.scottwilson.com
New Gold Inc. – New Afton Project Technical Report NI 43-101 – December 31, 2009 Page 17-9
TABLE 17-4 TOP CUTS New Gold Inc. – New Afton Project
Element
Top-Cut Limit % Metal Loss in
Model Inside Prob
Shell Outside
Prob Shell DMZ
Copper 7% 3% 3% -0.3 Gold 7 g/t 5 g/t 3 g/t -1.2 Silver 40 g/t 15 g/t 10 g/t -3.3 Palladium 2.5 g/t 2.0 g/t 0.6 g/t -2.1 Arsenic 6,000 ppm -1.5 Mercury 7,000 ppb -1.7 Antimony 1,250 ppm -2.4 Bismuth 80 ppm -0.7 Cadmium 40 ppm -5.3 Nickel 900 ppm -0.2 Lead 200 ppm -0.2 Iron Not required n/a Zinc 1,000 ppm -0.2
Scott Wilson RPA generally advises against placing caps on the composited samples in
favour of capping the raw samples. However, in this case, because the compositing has
had a minimal impact on the sample lengths, it is acceptable. Scott Wilson RPA
reviewed the cap values and considers them to be within a reasonable range.
GEOSTATISTICS Preparation of the 2009 resource model included a geostatistical analysis on the composited
data in order to derive kriging and search parameters. Multi-directional correlograms for
Cu, Au, Ag, and Pd were generated using Sage software. The data were partitioned into
two domains: one inside and one outside the DMZ.
The variogram models derived from the analysis are shown in Table 17-5.
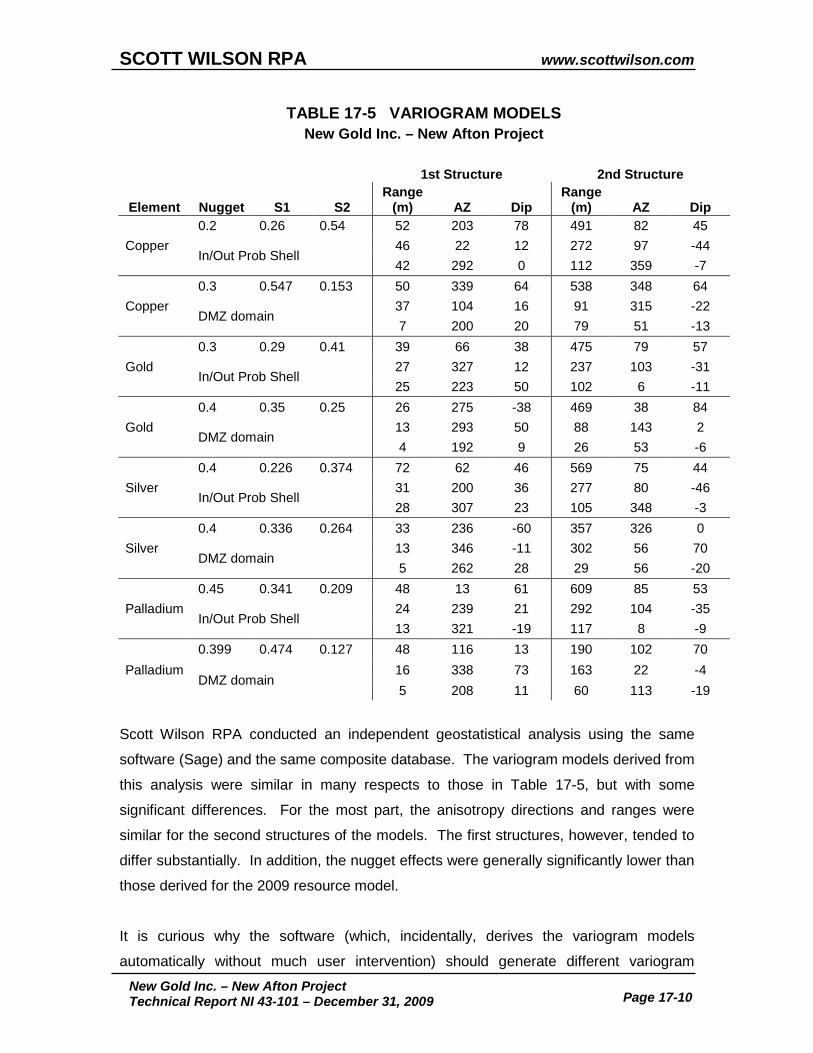
SCOTT WILSON RPA www.scottwilson.com
New Gold Inc. – New Afton Project Technical Report NI 43-101 – December 31, 2009 Page 17-10
TABLE 17-5 VARIOGRAM MODELS New Gold Inc. – New Afton Project
1st Structure 2nd Structure
Element Nugget S1 S2 Range
(m) AZ Dip Range
(m) AZ Dip
Copper 0.2 0.26 0.54 52 203 78 491 82 45
In/Out Prob Shell 46 22 12 272 97 -44 42 292 0 112 359 -7
Copper 0.3 0.547 0.153 50 339 64 538 348 64
DMZ domain 37 104 16 91 315 -22 7 200 20 79 51 -13
Gold 0.3 0.29 0.41 39 66 38 475 79 57
In/Out Prob Shell 27 327 12 237 103 -31 25 223 50 102 6 -11
Gold 0.4 0.35 0.25 26 275 -38 469 38 84
DMZ domain 13 293 50 88 143 2 4 192 9 26 53 -6
Silver 0.4 0.226 0.374 72 62 46 569 75 44
In/Out Prob Shell 31 200 36 277 80 -46 28 307 23 105 348 -3
Silver 0.4 0.336 0.264 33 236 -60 357 326 0
DMZ domain 13 346 -11 302 56 70 5 262 28 29 56 -20
Palladium 0.45 0.341 0.209 48 13 61 609 85 53
In/Out Prob Shell 24 239 21 292 104 -35 13 321 -19 117 8 -9
Palladium 0.399 0.474 0.127 48 116 13 190 102 70
DMZ domain 16 338 73 163 22 -4 5 208 11 60 113 -19
Scott Wilson RPA conducted an independent geostatistical analysis using the same
software (Sage) and the same composite database. The variogram models derived from
this analysis were similar in many respects to those in Table 17-5, but with some
significant differences. For the most part, the anisotropy directions and ranges were
similar for the second structures of the models. The first structures, however, tended to
differ substantially. In addition, the nugget effects were generally significantly lower than
those derived for the 2009 resource model.
It is curious why the software (which, incidentally, derives the variogram models
automatically without much user intervention) should generate different variogram

SCOTT WILSON RPA www.scottwilson.com
New Gold Inc. – New Afton Project Technical Report NI 43-101 – December 31, 2009 Page 17-11
models from, supposedly, the same data. However, it does not appear to be material to
the global estimate. As mentioned above, Scott Wilson RPA ran grade interpolation
models using an independently derived probability shell and variogram models and
obtained results very similar to those obtained by Sim and Davis (2009). This suggests
that the global estimate is insensitive to changes to the variogram models.
SEARCH PARAMETERS For the economic elements in the DMZ domain, the search was a 300 m spherical
ellipsoid, with a minimum of 8 and a maximum of 28 composites per estimate, and a
maximum of seven composites allowed from any one drill hole. Search parameters were
the same for the grade shell domain, except that for Au, and the estimates were limited
to a minimum of six and a maximum of 15 composites, with a maximum of five allowed
from any one drill hole. For outside of the probability shell, the composite constraints
were identical to those for the DMZ, except that the search ellipsoid was reduced to 200
m x 200 m x 100 m. For all domains, the estimates were constrained to using only one
hole per octant.
For the ID2 estimates (deleterious components), a 300 m spherical search was used,
with the block estimates limited to a minimum of four and a maximum of nine
composites, and again, a maximum of one hole per octant.
In Scott Wilson RPA’s opinion, the search parameters for the economic elements are
reasonable and supported by the variography. The 300 m search used for the
deleterious elements is somewhat aggressive. As a result, the estimates for these
elements are likely to be lower in confidence level than the economic elements. This is
particularly likely considering the lower number of samples for the deleterious elements.
BULK DENSITY Average bulk density was assigned to the block model according to mineralization type.
The average bulk densities were derived from 656 measurements collected from drill
core over the course of exploration work on the Project. Table 17-6 shows how the
assignments were made.

SCOTT WILSON RPA www.scottwilson.com
New Gold Inc. – New Afton Project Technical Report NI 43-101 – December 31, 2009 Page 17-12
TABLE 17-6 BULK DENSITY New Gold Inc. – New Afton Project
Minzone Domain
Bulk Density (t/m3)
Supergene 2.58 Mesogene 2.59 Hypogene 2.62
Other (Py-Mt) 2.59
VALIDATION Sim and Davis validated the 2009 resource block model using the following techniques:
• Visual inspection and comparison of block and composite grades in sections and plans.
• Hermitian Polynomial Change of Support analysis to check the degree of smoothing in the block grade interpolations.
• Comparison with ID2 and Nearest Neighbour (NN) estimates.
• Swath plots.
The validation exercises conducted by Sim and Davis (2009) indicated that the block
grade interpolations were unbiased and honoured the local drill hole grades. In Scott
Wilson RPA’s opinion, the validation work by Sim and Davis (2009) was done at a
reasonable and appropriate level.
Scott Wilson RPA prepared an independent estimate for Cu, Au, Ag, and Pd and
compared it to the 2009 resource estimate. As already stated in this report, a new
probability shell was derived from an independently generated set of kriging parameters.
This shell was then used, along with the DMZ solid, to assign domains to the blocks and
composites. Geostatistical analyses were carried out to derive variogram models, which,
as already mentioned, were somewhat different from those generated by Sim and Davis
(2009). Capping, search parameters, and classification criteria (see subsection on
Classification) were kept the same as for the original models.
The Scott Wilson RPA block model results at the 0.5% Cu cut-off are compared to the
2009 resource model in Table 17-7. There is very little difference between the two

SCOTT WILSON RPA www.scottwilson.com
New Gold Inc. – New Afton Project Technical Report NI 43-101 – December 31, 2009 Page 17-13
estimates, which, in Scott Wilson RPA’s opinion, provides additional validation of the
2009 resource model. Scott Wilson RPA also notes that the global estimate appears to
be quite insensitive to variations in either the probability shell or the variogram models.
CLASSIFICATION The estimate has been classified according to the CIM Definition Standards for Mineral
Resources and Mineral Reserves as adopted by the CIM Council on December 11, 2005
(CIM definitions). Criteria for classification were as follows:
MEASURED
Assigned to blocks with Cu grades estimated by a minimum of three drill holes with composites at an average spacing of 30 m (nominal drill spacing of approximately 50 m).
INDICATED
Assigned to blocks with Cu grades estimated by a minimum of three drill holes with composites at an average spacing of 50 m (nominal drill spacing of approximately 80 m).
INFERRED
Assigned to blocks that do not meet the criteria for Measured or Indicated but are within 50 m of a drill hole.
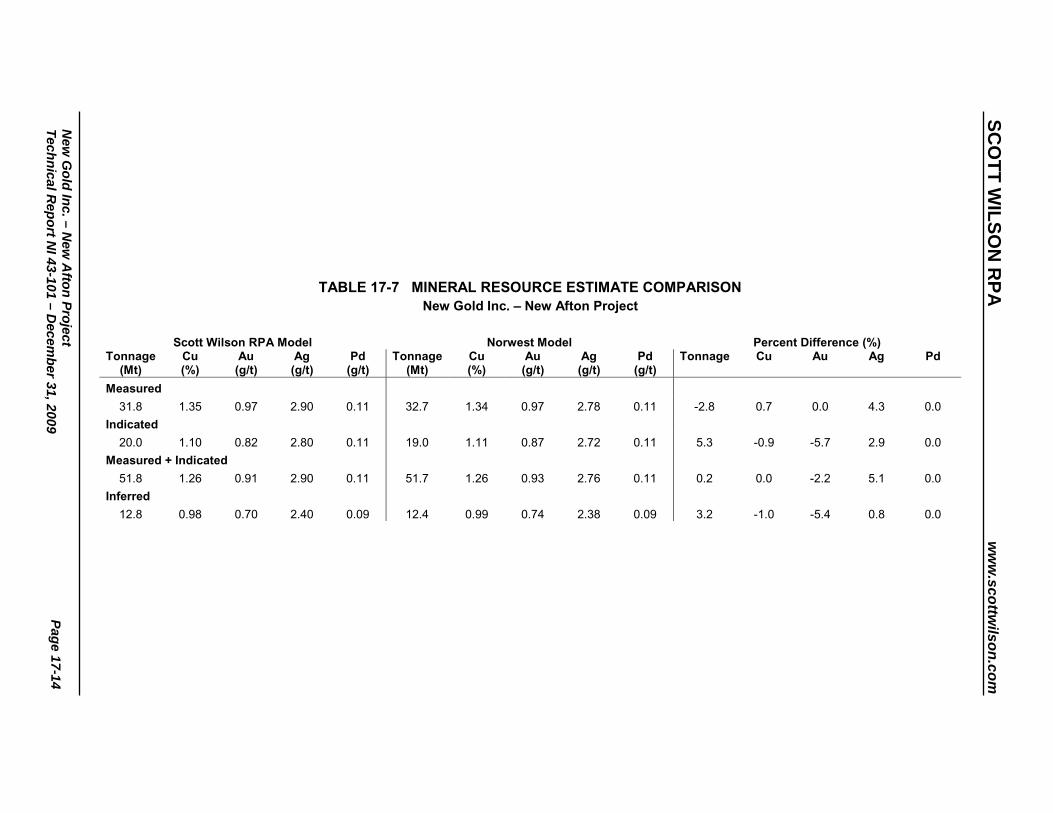
TABLE 17-7 MINERAL RESOURCE ESTIMATE COMPARISONNew Gold Inc. – New Afton Project
Scott Wilson RPA Model Norwest Model Percent Difference (%)Tonnage
(Mt)Cu(%)
Au(g/t)
Ag(g/t)
Pd(g/t)
Tonnage(Mt)
Cu(%)
Au(g/t)
Ag(g/t)
Pd(g/t)
Tonnage Cu Au Ag Pd
Measured
31.8 1.35 0.97 2.90 0.11 32.7 1.34 0.97 2.78 0.11 -2.8 0.7 0.0 4.3 0.0
Indicated
20.0 1.10 0.82 2.80 0.11 19.0 1.11 0.87 2.72 0.11 5.3 -0.9 -5.7 2.9 0.0
Measured + Indicated
51.8 1.26 0.91 2.90 0.11 51.7 1.26 0.93 2.76 0.11 0.2 0.0 -2.2 5.1 0.0
Inferred
12.8 0.98 0.70 2.40 0.09 12.4 0.99 0.74 2.38 0.09 3.2 -1.0 -5.4 0.8 0.0
SCO
TT WILSO
N R
PA
ww
w.scottw
ilson.com
N
ew G
old Inc. – New
Afton Project
Technical Report N
I 43-101 – Decem
ber 31, 2009 Page 17-14
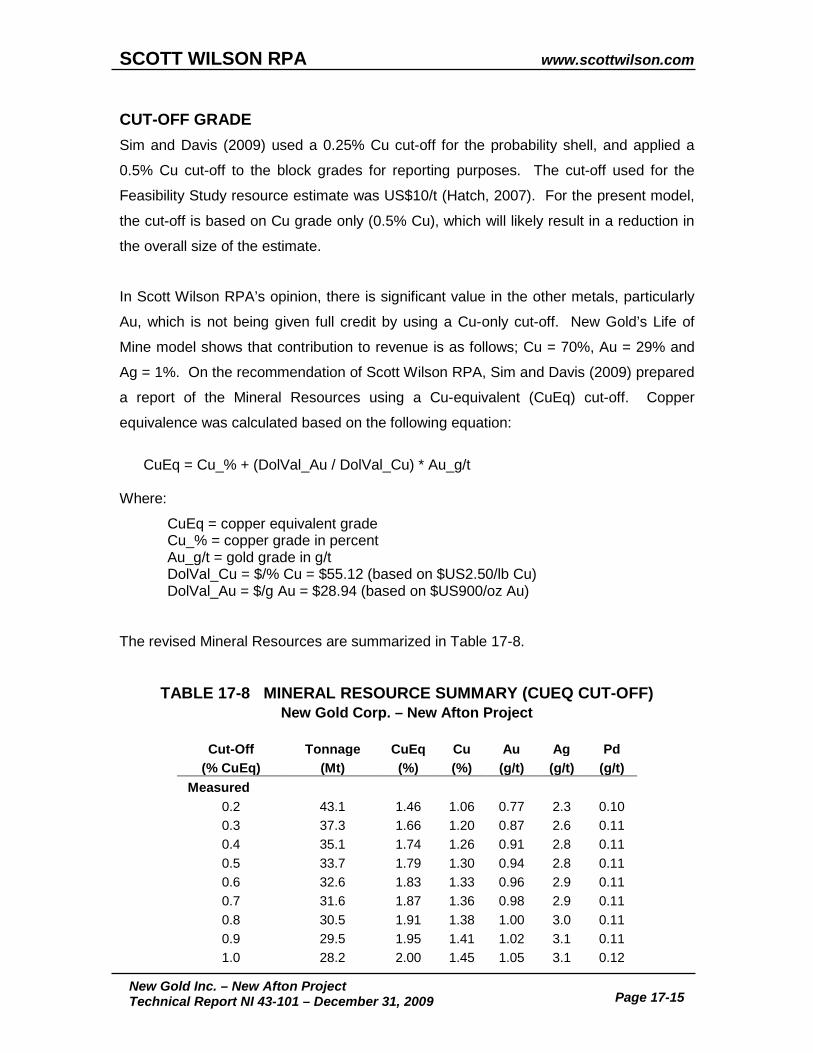
SCOTT WILSON RPA www.scottwilson.com
New Gold Inc. – New Afton Project Technical Report NI 43-101 – December 31, 2009 Page 17-15
CUT-OFF GRADE Sim and Davis (2009) used a 0.25% Cu cut-off for the probability shell, and applied a
0.5% Cu cut-off to the block grades for reporting purposes. The cut-off used for the
Feasibility Study resource estimate was US$10/t (Hatch, 2007). For the present model,
the cut-off is based on Cu grade only (0.5% Cu), which will likely result in a reduction in
the overall size of the estimate.
In Scott Wilson RPA’s opinion, there is significant value in the other metals, particularly
Au, which is not being given full credit by using a Cu-only cut-off. New Gold’s Life of
Mine model shows that contribution to revenue is as follows; Cu = 70%, Au = 29% and
Ag = 1%. On the recommendation of Scott Wilson RPA, Sim and Davis (2009) prepared
a report of the Mineral Resources using a Cu-equivalent (CuEq) cut-off. Copper
equivalence was calculated based on the following equation:
CuEq = Cu_% + (DolVal_Au / DolVal_Cu) * Au_g/t Where:
CuEq = copper equivalent grade Cu_% = copper grade in percent Au_g/t = gold grade in g/t DolVal_Cu = $/% Cu = $55.12 (based on $US2.50/lb Cu) DolVal_Au = $/g Au = $28.94 (based on $US900/oz Au)
The revised Mineral Resources are summarized in Table 17-8.
TABLE 17-8 MINERAL RESOURCE SUMMARY (CUEQ CUT-OFF) New Gold Corp. – New Afton Project
Cut-Off Tonnage CuEq Cu Au Ag Pd
(% CuEq) (Mt) (%) (%) (g/t) (g/t) (g/t) Measured
0.2 43.1 1.46 1.06 0.77 2.3 0.10 0.3 37.3 1.66 1.20 0.87 2.6 0.11 0.4 35.1 1.74 1.26 0.91 2.8 0.11 0.5 33.7 1.79 1.30 0.94 2.8 0.11 0.6 32.6 1.83 1.33 0.96 2.9 0.11 0.7 31.6 1.87 1.36 0.98 2.9 0.11 0.8 30.5 1.91 1.38 1.00 3.0 0.11 0.9 29.5 1.95 1.41 1.02 3.1 0.11 1.0 28.2 2.00 1.45 1.05 3.1 0.12
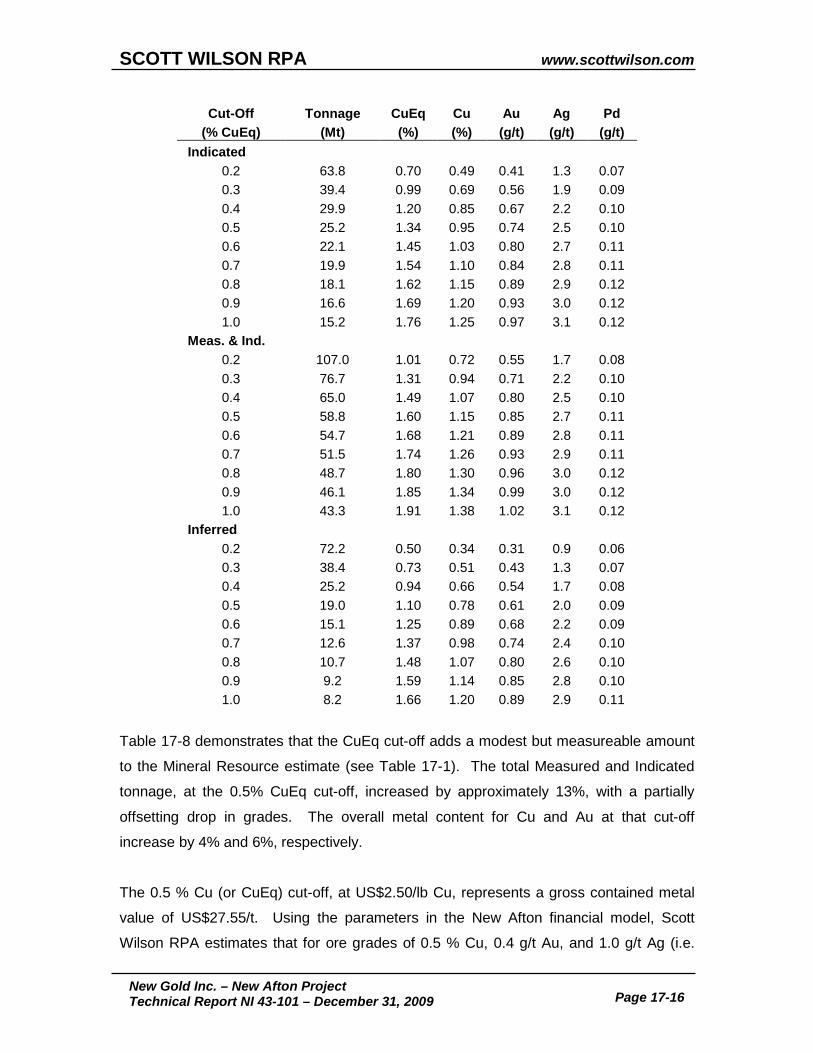
SCOTT WILSON RPA www.scottwilson.com
New Gold Inc. – New Afton Project Technical Report NI 43-101 – December 31, 2009 Page 17-16
Cut-Off Tonnage CuEq Cu Au Ag Pd (% CuEq) (Mt) (%) (%) (g/t) (g/t) (g/t)
Indicated 0.2 63.8 0.70 0.49 0.41 1.3 0.07
0.3 39.4 0.99 0.69 0.56 1.9 0.09 0.4 29.9 1.20 0.85 0.67 2.2 0.10 0.5 25.2 1.34 0.95 0.74 2.5 0.10 0.6 22.1 1.45 1.03 0.80 2.7 0.11 0.7 19.9 1.54 1.10 0.84 2.8 0.11 0.8 18.1 1.62 1.15 0.89 2.9 0.12 0.9 16.6 1.69 1.20 0.93 3.0 0.12 1.0 15.2 1.76 1.25 0.97 3.1 0.12
Meas. & Ind. 0.2 107.0 1.01 0.72 0.55 1.7 0.08
0.3 76.7 1.31 0.94 0.71 2.2 0.10 0.4 65.0 1.49 1.07 0.80 2.5 0.10 0.5 58.8 1.60 1.15 0.85 2.7 0.11 0.6 54.7 1.68 1.21 0.89 2.8 0.11 0.7 51.5 1.74 1.26 0.93 2.9 0.11 0.8 48.7 1.80 1.30 0.96 3.0 0.12 0.9 46.1 1.85 1.34 0.99 3.0 0.12 1.0 43.3 1.91 1.38 1.02 3.1 0.12
Inferred 0.2 72.2 0.50 0.34 0.31 0.9 0.06
0.3 38.4 0.73 0.51 0.43 1.3 0.07 0.4 25.2 0.94 0.66 0.54 1.7 0.08 0.5 19.0 1.10 0.78 0.61 2.0 0.09 0.6 15.1 1.25 0.89 0.68 2.2 0.09 0.7 12.6 1.37 0.98 0.74 2.4 0.10 0.8 10.7 1.48 1.07 0.80 2.6 0.10 0.9 9.2 1.59 1.14 0.85 2.8 0.10 1.0 8.2 1.66 1.20 0.89 2.9 0.11
Table 17-8 demonstrates that the CuEq cut-off adds a modest but measureable amount
to the Mineral Resource estimate (see Table 17-1). The total Measured and Indicated
tonnage, at the 0.5% CuEq cut-off, increased by approximately 13%, with a partially
offsetting drop in grades. The overall metal content for Cu and Au at that cut-off
increase by 4% and 6%, respectively.
The 0.5 % Cu (or CuEq) cut-off, at US$2.50/lb Cu, represents a gross contained metal
value of US$27.55/t. Using the parameters in the New Afton financial model, Scott
Wilson RPA estimates that for ore grades of 0.5 % Cu, 0.4 g/t Au, and 1.0 g/t Ag (i.e.
SCOTT WILSON RPA www.scottwilson.com
New Gold Inc. – New Afton Project Technical Report NI 43-101 – December 31, 2009 Page 17-17
precious metal grades that are roughly proportional to the average Cu grade in the
deposit), the NSR value of the rock is C$33.74/t. The estimated cash costs for LOM at
New Afton are C$17.19/t, suggesting that the 0.5% Cu cut-off is very conservative,
particularly for a Mineral Resource estimate. At a 0.3% Cu grade, the same NSR
analysis indicates that the NSR value is C$20.24, which compares more favourably to
the LOM cash costs per tonne.
In Scott Wilson RPA’s opinion, a cut-off in the order of 0.3% Cu is probably more
appropriate for the Mineral Resource estimate than 0.5% Cu. At the 0.3% Cu-only cut-
off, the additional metal values contributed by Au and to a much lesser degree, Ag, are
in the order of an additional 0.1% CuEq. This implies that the CuEq cut-off would be in
the order of 0.4% CuEq. Comparison between Tables 17-1 and 17-8 indicates that the
tonnage reporting at the 0.3% Cu cut-off is roughly equal to that at the 0.4% CuEq.
Consequently, Scott Wilson RPA recommends that the Mineral Resources be quoted at
a CuEq cut-off of 0.4% CuEq.
COMPARISON WITH THE PREVIOUS ESTIMATE Table 17-9 compares the 2009 Mineral Resource estimate, at the 0.4% CuEq cut-off,
with the 2006 Mineral Resource estimate, at the $10/t cut-off, as reported in the
Feasibility Study (Hatch, 2007). The tonnage of the Measured Resources dropped,
while there was a significant increase for the Indicated Resources. Total tonnage of the
Measured and Indicated Mineral Resources did not change appreciably, nor did the total
metal contents. The Inferred Resources essentially tripled in volume, with a marked
decrease in grades.
In Scott Wilson RPA’s opinion, the variance between the Measured plus Indicated
Mineral Resources in the two estimates is not significant, and can be explained by
differences in methodology. The changes in the Inferred Mineral Resources are due to
additional drilling has expanded the C Zone, resulting in an increase in total Inferred
tonnage. Additional drilling has also likely affected the resources in the area of the
Hanging Wall Zones.
In Scott Wilson RPA’s opinion, the difference between the 2006 and present estimates is
not significant on a global basis and should not make a material difference to the Mineral
Reserve estimate.
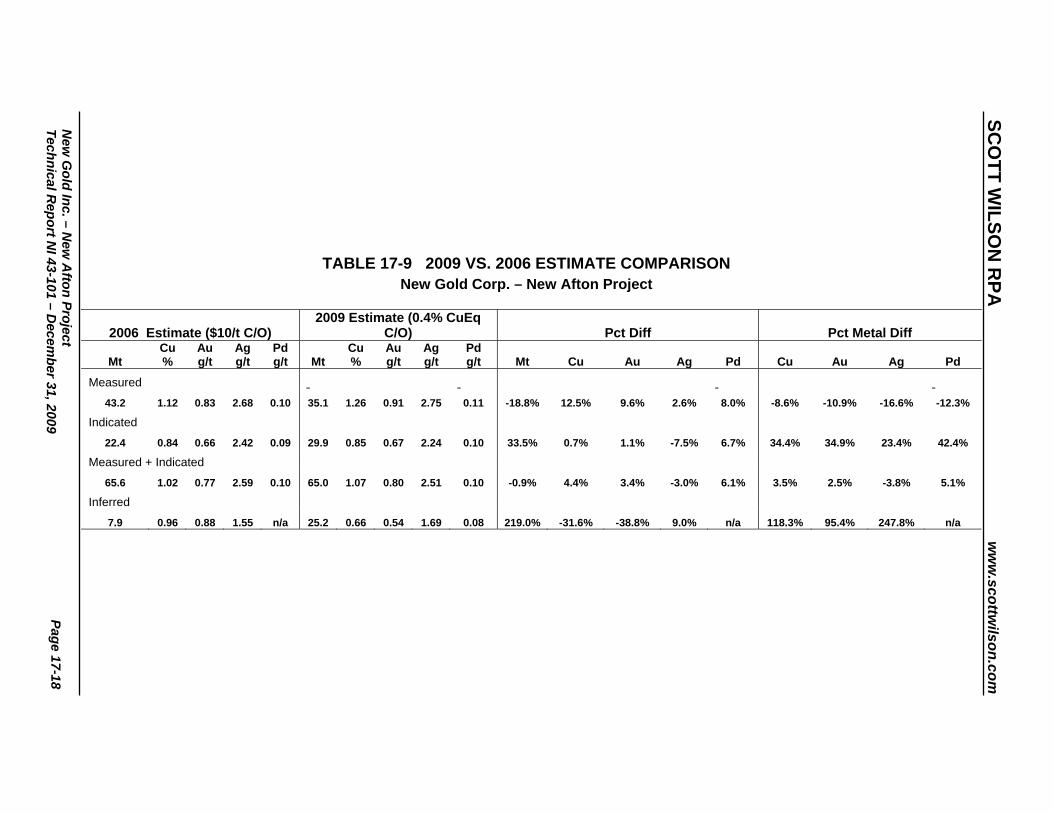
TABLE 17-9 2009 VS. 2006 ESTIMATE COMPARISON New Gold Corp. – New Afton Project
2006 Estimate ($10/t C/O) 2009 Estimate (0.4% CuEq
C/O) Pct Diff Pct Metal Diff
Mt Cu %
Au g/t
Ag g/t
Pd g/t Mt
Cu%
Aug/t
Agg/t
Pdg/t Mt Cu Au Ag Pd Cu Au Ag Pd
Measured
43.2 1.12 0.83 2.68 0.10 35.1 1.26 0.91 2.75 0.11 -18.8% 12.5% 9.6% 2.6% 8.0% -8.6% -10.9% -16.6% -12.3%
Indicated
22.4 0.84 0.66 2.42 0.09 29.9 0.85 0.67 2.24 0.10 33.5% 0.7% 1.1% -7.5% 6.7% 34.4% 34.9% 23.4% 42.4%
Measured + Indicated
65.6 1.02 0.77 2.59 0.10 65.0 1.07 0.80 2.51 0.10 -0.9% 4.4% 3.4% -3.0% 6.1% 3.5% 2.5% -3.8% 5.1%
Inferred
7.9 0.96 0.88 1.55 n/a 25.2 0.66 0.54 1.69 0.08 219.0% -31.6% -38.8% 9.0% n/a 118.3% 95.4% 247.8% n/a
SCO
TT WILSO
N R
PA
ww
w.scottw
ilson.com
N
ew G
old Inc. – New
Afton Project
Technical Report N
I 43-101 – Decem
ber 3 1, 2009 Page 17-18

SCOTT WILSON RPA www.scottwilson.com
New Gold Inc. – New Afton Project Technical Report NI 43-101 – December 31, 2009 Page 17-19
MINERAL RESERVES For the 2007 Feasibility Study, AMC Consultants Pty Ltd. (AMC) prepared a Mineral
Reserve estimate based on the block caving method. The key inputs and processes
used to develop and validate the estimate are described below. The 2007 Mineral
Reserve estimate was based upon a geological block model prepared by Scott Wilson
RPA which formed the basis of the Mineral Resource estimate published by New Gold in
September 2006.
The 2007 reserve estimation was completed based upon the use of two separate
modelling approaches (Cave-Sim and Gemcom PCBC). In September 2009, New Gold
provided a new resource model which was reviewed and accepted by Scott Wilson RPA
as described above. AMC again used the PCBC modelling software to generate a
Mineral Reserve estimate. Based upon the similar results from the two software
packages in the 2007 estimate, this 2009 estimate was based solely on the PCBC model
for its ease of use.
Scott Wilson RPA has reviewed the assumptions and results of the estimation process
and concurs that the estimate is consistent with the CIM definitions and NI 43-101. The
Mineral Reserve estimate is summarized in Table 17-10 and described in more detail in
the following subsections.
TABLE 17-10 MINERAL RESERVE ESTIMATE – SEPTEMBER 2009 New Gold Inc. – New Afton Project
Category Tonnage
(M tonnes) Cu (%)
Au (g/t)
Ag (g/t)
Probable 47.4 0.95 0.69 2.03
Notes: 1. CIM definitions were followed for Mineral Reserves. 2. Mineral Reserves are estimated at an NSR cut-off grade of $19/t. 3. Mineral Reserves are estimated at US$2.00/lb Cu and US$800/oz Au and a C$/US$
exchange rate of 0.85. 4. Metallurgical recoveries for copper vary from 69% to 89%.
2007 MINERAL RESERVE ESTIMATE The 2009 Mineral Reserve estimate is based on the fundamental assumptions and
parameters that were developed for the 2007 Mineral Reserve estimate and are

SCOTT WILSON RPA www.scottwilson.com
New Gold Inc. – New Afton Project Technical Report NI 43-101 – December 31, 2009 Page 17-20
described below. In preparing the 2007 estimate, AMC used geotechnical data and
geological interpretations of faults and other structures provided by New Gold.
A detailed analysis of the deposit was first carried out to identify the most suitable
positions of the block cave extraction levels and the extent of the area to be undercut to
induce caving (the block cave footprint). During this analysis a large number of iterations
were carried out.
After selection of appropriate extraction levels and footprints and an overall development
sequence, taking into account geotechnical and practical mining constraints, a detailed
production schedule was developed using commercially available block cave modelling
software (PCBC).
An alternative software program (Cave-Sim) was also used to model material flow in the
cave and produce the production estimates for the Feasibility Study. Sensitivities to
changes in key parameters influencing the reserve estimate were modelled using both
PCBC and Cave-Sim.
INITIAL REVIEW OF RESOURCE GRADE DISTRIBUTION Those parts of the deposit suitable for mining were initially identified by visual inspection
of the grade distribution within the deposit, and by analysis of the value generated by
mining various areas. The Hanging Wall Zones are isolated from the Main Zone and are
low grade. Because of their location, they cannot utilize the underground infrastructure
required for mining the Main Zone and would require separate access, ore handling and
ventilation systems. These zones were considered to be uneconomic.
The Main Zone was split into east and west blocks at 3525E, which coincides with the
approximate position of a low-grade zone running through the deposit. Both the east
and west portions of the Main Zone were used for further analysis to determine the most
suitable extraction levels and footprints.
SELECTION OF EXTRACTION LEVEL AND FOOTPRINT AMC reviewed a number of possible undercut positions by visual inspection of the
resource. The block size in the resource model was reset to 15 m x 15 m x 20 m high to
match a preliminary estimate of drawpoint spacing. A series of block models were then
SCOTT WILSON RPA www.scottwilson.com
New Gold Inc. – New Afton Project Technical Report NI 43-101 – December 31, 2009 Page 17-21
created, one for each potential undercut position. In each model, blocks below the
undercut were removed from the model, while those above the undercut were subjected
to a mixing algorithm to simulate the effect of drawing material from drawpoints.
AMC added a value field (Net Smelter Return, or NSR, Value) to the diluted model. The
NSR Value is an estimate of the theoretical value received for the concentrate produced
from one tonne of resource, net of all costs and losses incurred in the off-site
transportation and processing of concentrate.
After calculating the unit NSR Value of the material in each diluted block, an amount
equivalent to $14 per tonne was deducted from the NSR Value to reflect the mining,
onsite processing, and administration costs. No account was taken of the time value of
money. Columns of blocks having a positive cumulative NSR Value were assembled,
progressing up from the undercut. The final height of each column was determined by
the position of the last block to add value to the column. An amount reflecting a
preliminary estimate of the cost of establishing the portions of the undercut, extraction
level, drawpoint, and drawbell necessary to mine each column was subtracted from the
total column value.
A perimeter or footprint was drawn on the undercut level around groups of profitable
columns. The footprint was adjusted to ensure that a minimum north-south span was
maintained. A number of footprints were prepared for each model to test the sensitivity
of the Project to minimum span criteria of 105 m, 90 m, and 75 m. Unprofitable columns
were added to the footprint where necessary, to achieve the minimum span. The height
of unprofitable columns was limited to 60 m to minimize the mining of unprofitable
material, while ensuring full cave establishment.
A large number of possible extraction level options were initially tested, leading to the
conclusion that the most suitable arrangement was to establish three panels – Block 1
(B1), Block 2 (B2), and Block 3 (B3) - with B1 and B2 on the same elevation and B3 on a
lower elevation. B3 would mine the down-plunge western extension of the deposit and
could mine underneath B2 if necessary.
SCOTT WILSON RPA www.scottwilson.com
New Gold Inc. – New Afton Project Technical Report NI 43-101 – December 31, 2009 Page 17-22
Further work was then carried out to establish the optimum elevation of the B1 and B2
undercut, the western limit of B2, and the elevation and eastern limit of the B3 undercut.
The undercut level for B1 and B2 was set at a nominal elevation of 5,085 m and for B3,
at 4,965 m.
To enable a single cut-off parameter to be used, AMC added an NSR Value field to the
Combined Resource Model. Each of the different rock types - supergene, mesogene,
and hypogene - have different recoveries and concentrate grades, which impact on the
NSR Value calculation.
PRODUCTION ESTIMATES USING PCBC An assessment of the recoverable tonnage and grade from the deposit was carried out
on behalf of AMC by Stratavision Pty Ltd. (Stratavision). The PCBC software program
was used for this assessment. Key inputs to the PCBC modelling process include the
estimated shape of the draw cones, the percentage of fines, the mixing horizon and the
sequence of extraction. Three cases were modelled using a set of Expected, Best
Credible, and Worst Credible parameters.
PCBC PRODUCTION SEQUENCING An extraction sequence starting in the southwest corner of B2 and progressing to the
northwest corner of B1 was used in all cases. B3 was scheduled to commence after
completion of the western drawpoints in B2. The undercut face was maintained at a
nominal angle of 45° to the strike of the orebody. The production schedule for B3 was
run independently of B1 and B2. In reality, the far eastern drawpoints of B3 will incur
slightly more dilution than indicated, due to the presence of caved waste in the depleted
western portion of B2.
The scheduling method used takes the total required tonnage and divides it amongst all
the active drawpoints in proportion to the amount of material remaining in each draw
column. Thus the higher columns are drawn down faster and the lower ones more
slowly. The aim is to close off all the drawpoints at approximately the same time. This is
more difficult to achieve if there are significant variations in economic column heights
between drawpoints. This was experienced in B1 where the far eastern drawpoints had
to be “trimmed” to a maximum Height of Draw (HOD) of 350 m
SCOTT WILSON RPA www.scottwilson.com
New Gold Inc. – New Afton Project Technical Report NI 43-101 – December 31, 2009 Page 17-23
PRODUCTION ESTIMATES USING CAVE-SIM In addition to using PCBC, an assessment of the recoverable tonnage and grade from
the deposit was carried out using the three-dimensional particle flow code Cave-Sim.
The code is broadly based on the concept of cellular automata, in which cells are
considered as discrete objects that are categorized by individual "state" parameters that
evolve dynamically. This allows very large systems to be studied with very simple
discrete equations that are calibrated against empirical knowledge. The three
dimensional cellular automata in Cave-Sim consider particle friction, particle size
distributions, and state of stress. The user has full control over draw rates from
individual drawpoints and tracking of the instantaneous and cumulative grade and
particle size distribution through each drawpoint.
COMPARISONS BETWEEN PCBC AND CAVE-SIM RESULTS In the Expected and Best Credible cases, Cave-Sim modelling indicates marginally
higher levels of dilution than PCBC resulting in higher tonnages (+5%) and lower grades
(-2% to -3%). However, the differences are small and within the accuracy of the
estimating process.
ADJUSTMENT FOR ORE LOSSES Both PCBC and Cave-Sim programs provide estimates of the tonnage and grade of the
material that can potentially be recovered under a given set of draw control rules. In
practice, events will occur that limit the ability to achieve these estimates. Adjustments
to the schedules resulted in an overall reduction of approximately 4% in the tonnage
output.
2009 MINERAL RESERVE ESTIMATE A Mineral Reserve estimate was compiled by AMC based upon a revised resource
model as described in the Mineral Resource section of this report. The 2009 Mineral
Reserve estimate was based upon the use of the PCBC software for estimation of the
mineral reserves within the planned block cave operation. The undercut elevations were
unchanged from the 2007 Mineral Reserve estimate, however, the operating cost
assumptions for the drawpoint shut-off grade were revised to match the current cost
estimates. PCBC parameters were the same as the “expected” case in the feasibility
study work.

SCOTT WILSON RPA www.scottwilson.com
New Gold Inc. – New Afton Project Technical Report NI 43-101 – December 31, 2009 Page 17-24
A lower grade pillar previously left between the B1 and B2 blocks has been mined and
the B2 block has been expanded by rows of drawpoints to the west. This expansion to
the west reduces the amount of material in the B3 block bring some production ahead
and reducing haulage costs. There are two rows of B3 drawpoints which are located
beneath the B2 cave.
The PCBC program includes dilution material and the draw height has been limited to a
maximum of 350 m to account for the losses that will occur due to less than ideal draw
control, damage to drawpoints and the loss of drawpoints that have not reached the
shut-off grade at the end of the mine life.
The drawpoint production predicted from the PCBC model is shown in Table 17-11 along
with the resource classification of material within the total.
TABLE 17-11 DRAWPOINT PRODUCTION BY RESOURCE CLASSIFICATION
New Gold Inc. – New Afton Project
Mt
Cu %
Au g/t
Ag g/t
As ppm
Hg ppb
NSR C$
Measured 33.5 1.03 0.74 2.21 306 903 52.66 Indicated 12.6 0.77 0.58 1.66 265 970 39.82 Subtotal 46.1 0.96 0.70 2.06 295 921 49.16 Inferred 0.8 0.79 0.52 1.44 189 961 37.17 Unclassified 0.1 1.04 0.54 1.73 200 1,533 42.68 Subtotal 1.0 0.82 0.52 1.48 191 1,041 37.94 Total 47.0 0.96 0.69 2.05 293 923 48.92
In addition to the material generated from the drawpoints, there will be resources
extracted in the course of mine development. This material and the resource
classification is shown in Table 17-12.
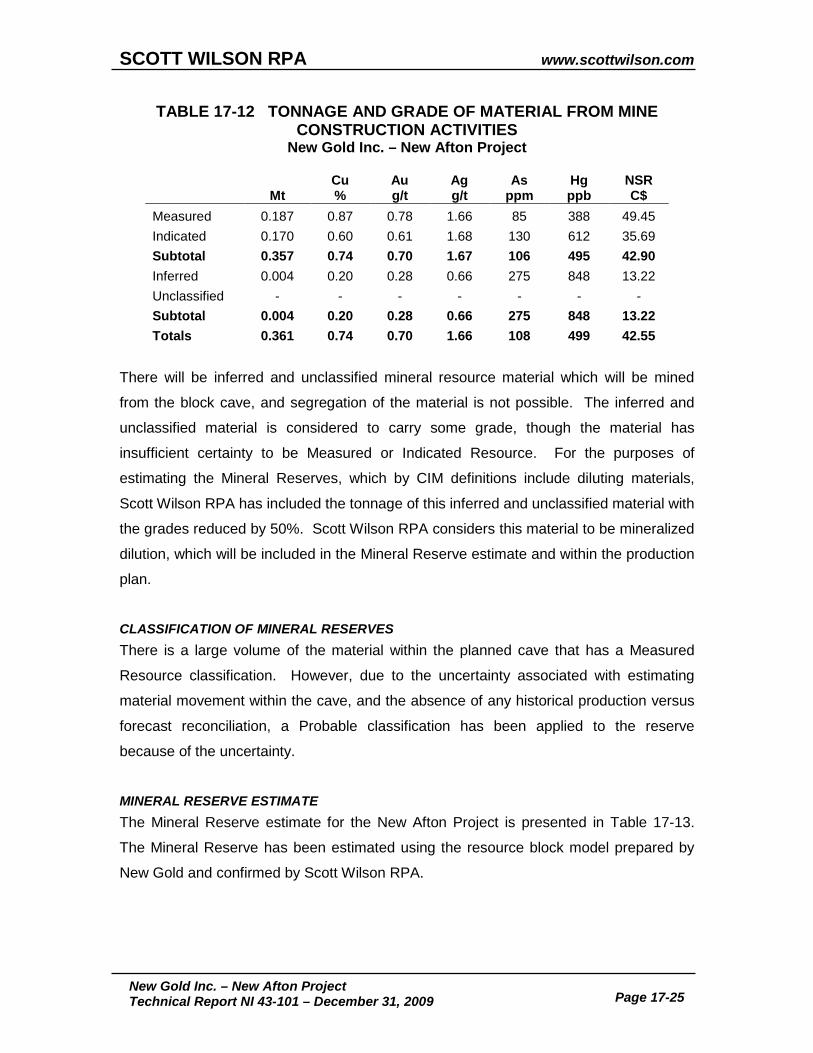
SCOTT WILSON RPA www.scottwilson.com
New Gold Inc. – New Afton Project Technical Report NI 43-101 – December 31, 2009 Page 17-25
TABLE 17-12 TONNAGE AND GRADE OF MATERIAL FROM MINE CONSTRUCTION ACTIVITIES
New Gold Inc. – New Afton Project
Mt
Cu %
Au g/t
Ag g/t
As ppm
Hg ppb
NSR C$
Measured 0.187 0.87 0.78 1.66 85 388 49.45 Indicated 0.170 0.60 0.61 1.68 130 612 35.69 Subtotal 0.357 0.74 0.70 1.67 106 495 42.90 Inferred 0.004 0.20 0.28 0.66 275 848 13.22 Unclassified - - - - - - - Subtotal 0.004 0.20 0.28 0.66 275 848 13.22 Totals 0.361 0.74 0.70 1.66 108 499 42.55
There will be inferred and unclassified mineral resource material which will be mined
from the block cave, and segregation of the material is not possible. The inferred and
unclassified material is considered to carry some grade, though the material has
insufficient certainty to be Measured or Indicated Resource. For the purposes of
estimating the Mineral Reserves, which by CIM definitions include diluting materials,
Scott Wilson RPA has included the tonnage of this inferred and unclassified material with
the grades reduced by 50%. Scott Wilson RPA considers this material to be mineralized
dilution, which will be included in the Mineral Reserve estimate and within the production
plan.
CLASSIFICATION OF MINERAL RESERVES There is a large volume of the material within the planned cave that has a Measured
Resource classification. However, due to the uncertainty associated with estimating
material movement within the cave, and the absence of any historical production versus
forecast reconciliation, a Probable classification has been applied to the reserve
because of the uncertainty.
MINERAL RESERVE ESTIMATE The Mineral Reserve estimate for the New Afton Project is presented in Table 17-13.
The Mineral Reserve has been estimated using the resource block model prepared by
New Gold and confirmed by Scott Wilson RPA.

SCOTT WILSON RPA www.scottwilson.com
New Gold Inc. – New Afton Project Technical Report NI 43-101 – December 31, 2009 Page 17-26
TABLE 17-13 MINERAL RESERVE ESTIMATE New Gold Inc. – New Afton Project
Mt
Cu %
Au g/t
Ag g/t
As ppm
Hg ppb
PCBC Resources 46.1 0.96 0.70 2.06 295 921 Internal dilution 1.0 0.41 0.26 0.74 96 521 Development 0.36 0.74 0.70 1.67 106 495 Total 47.4 0.95 0.69 2.03 290 911
Scott Wilson RPA is of the opinion the Mineral Reserve estimate conforms to the CIM
definitions.

SCOTT WILSON RPA www.scottwilson.com
New Gold Inc. – New Afton Project Technical Report NI 43-101 – December 31, 2009 Page 18-1
18 OTHER RELEVANT DATA AND INFORMATION Scott Wilson RPA is not aware of any other relevant data or information that should be
included in this Technical Report.
SCOTT WILSON RPA www.scottwilson.com
New Gold Inc. – New Afton Project Technical Report NI 43-101 – December 31, 2009 Page 19-1
19 ADDITIONAL REQUIREMENTS The New Afton deposit is being developed as a block cave mining operation to produce
4 Mtpa of copper-gold ore for processing in a flotation plant for the recovery of copper in
concentrates and gold in concentrates. Underground development is underway using
New Gold crews which replaced the mining contractor crews and resumed development
in February 2009. There is supporting infrastructure at the site including access, offices,
staff, equipment, and a concrete batch plant. The new mill building has been erected
and the grinding mills are mechanically installed. No significant surface construction was
underway at the time of the site visit and the focus is on underground development and
project planning and engineering. This report considers the development of the Project
from the end of the second quarter of 2009 onwards.
Previous underground mining studies related to the New Afton Project were completed
by AMC as part of the Feasibility Study prepared by Hatch Ltd. (Hatch) in 2007. AMC
completed additional engineering work subsequent to the Feasibility Study. AMC based
its work on geotechnical, hydrological and geological information, including the Mineral
Resource estimates, provided either directly by New Gold or other consultants involved
in the Feasibility Study.
In the preparation of this Technical Report, Scott Wilson RPA has reviewed the mine
design work by AMC, as well as the capital and operating cost estimates prepared for
and after the 2007 Feasibility Study. It is Scott Wilson RPA’s opinion that the precision
and level of detail applied to the design, scheduling, and cost estimation work is
appropriate and consistent with the level of engineering and the state of the Project
development. Scott Wilson RPA has used the design and descriptions as generated by
AMC as the basis for this section of the report.
In the Feasibility Study, a staged start-up over a period of years was proposed, however,
with the changes to the Project execution plan, the strategy is to move directly to the
planned production rate of 4 Mtpa.
Development of the underground mine is the longest lead time item in the Project
development. The Project construction schedule has been designed such that

SCOTT WILSON RPA www.scottwilson.com
New Gold Inc. – New Afton Project Technical Report NI 43-101 – December 31, 2009 Page 19-2
interconnections between independent development areas are established as soon as
possible. Refuge chambers will be installed at suitable locations in each development
area until the interconnections are established.
Initial ore from development, undercutting, and production drawpoints will be stockpiled
in a temporary run-of-mine stockpile area adjacent to the mill. Milling operations were
scheduled to commence in month 37, when the mine production and surface stockpile
will provide sufficient ore for the mill to ramp up to 4 Mtpa over a three-month period.
MINING OPERATIONS
MINE DESIGN During the mining method selection process for the feasibility study, studies were carried
out to determine the most suitable production rate the Project. Initially, a staged
production build was proposed starting with an annualized rate of 1.6 Mtpa for a nominal
two-year period and then increasing to a maximum production rate of 4.0 Mtpa. With the
break in the construction schedule caused by New Gold’s response to the global
financial crisis, there has been time to advance the planning and mine development and
the current strategy is to commence operations and ramp up to the 4.0 Mtpa rate
immediately after start-up.
MINING METHOD Block caving is proposed for the New Afton deposit after consideration of the following
mining methods:
• Non-Caving Methods
• Open pit mining
• Sublevel open stoping (SLOS) with cemented backfill
• SLOS with uncemented backfill
• Post pillar cut & fill
• Caving Methods
• Core & shell (open stoping with mass blasting of pillars)
• Sublevel caving (SLC)
• Block caving

SCOTT WILSON RPA www.scottwilson.com
New Gold Inc. – New Afton Project Technical Report NI 43-101 – December 31, 2009 Page 19-3
AMC concluded that open pit mining was uneconomical, open stoping methods would
not be practical, and caving methods that started from the top (sublevel caving) would
commence in the poorest ground conditions and in the supergene ore. Therefore, block
caving was chosen because this method starts from the bottom and is conducive to
large-scale low-cost mining.
A number of block cave footprints were prepared to test the sensitivity of the Project to
minimum span criteria and a large number of possible extraction level options were
initially tested. It was concluded that the most suitable arrangement was to establish
three panels, with Block 1 (B1) and Block 2 (B2) on the same elevation and Block 3 (B3)
on a lower elevation. The locations of the blocks relative to the open pit are shown in
Figure 19-2.

Source: New Gold Inc., 2009.December 2009
Location of Mine Workings asRelated to Surface
New Afton Gold Project
New Gold Inc.
British Columbia, Canada
Figure 19-1
19-4
SCOTT WILSON RPA www.scottwilson.com
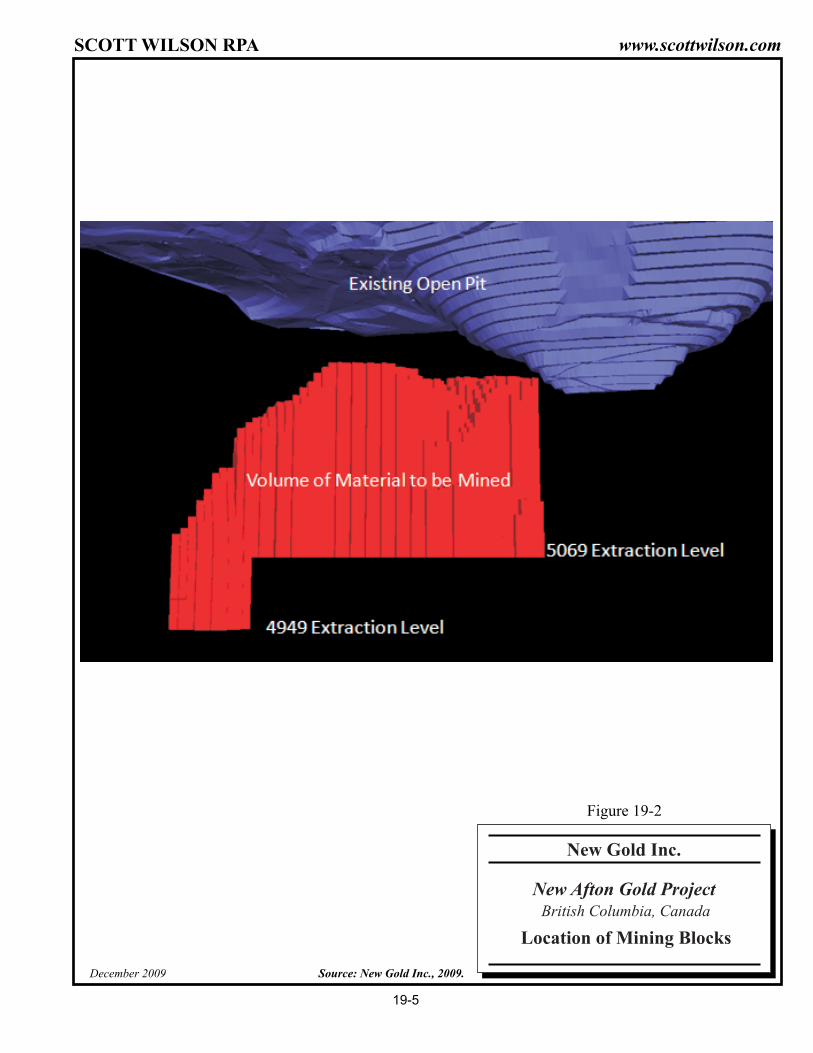
December 2009 Source: New Gold Inc., 2009.
Location of Mining Blocks
New Afton Gold Project
New Gold Inc.
British Columbia, Canada
Figure 19-2
19-5
SCOTT WILSON RPA www.scottwilson.com

SCOTT WILSON RPA www.scottwilson.com
New Gold Inc. – New Afton Project Technical Report NI 43-101 – December 31, 2009 Page 19-6
GEOMECHANICS Geotechnical investigations of the New Afton deposit were completed by AMC for the
Feasibility Study. AMC compiled a report setting out the relevant geotechnical aspects
of the Project. The key geotechnical considerations relating to the design and operation
of the Project are summarized below.
GEOTECHNICAL DOMAINS The deposit is divided into three geological domains, based on the nature of the copper
mineralization:
• Hypogene (primary): Chalcopyrite ± chalcocite, with silicification and K-spar flooding, and variable calcite veins.
• Mesogene (transition): Chalcopyrite, chalcocite, bornite, plus calcite veins and argillic alteration.
• Supergene: Native copper, chalcocite, plus variable hematite and argillic alteration.
The following geotechnical domains were defined:
• Supergene mineralization • Transitional (mesogene) mineralization • Primary (hypogene) mineralization • Fault Impacted Zone • Footwall (waste) rock.
With further drilling and underground exposures, the geotechnical domains may be
refined in future.
The Fault Impacted Zone (FIZ) is a narrow (up to 20 m wide) zone of extremely poor
ground conditions immediately adjacent and parallel to the Hanging Wall Fault. In
addition to geotechnical domains, there is a picrite body to the south of the Hanging Wall
Fault in close proximity to the orebody for a short strike length. Rockmass properties for
this material were determined separately.
Alteration is highly variable and complex and is an important feature influencing rock
mass quality. Alteration has not been explicitly modelled.
The structural geology of the deposit is complex. A number of different faulting
orientations and styles are recognized (and have been wireframed). Lamprophyre and
SCOTT WILSON RPA www.scottwilson.com
New Gold Inc. – New Afton Project Technical Report NI 43-101 – December 31, 2009 Page 19-7
diabase dykes also intersect the deposit. Tertiary volcanic and sedimentary rocks lie to
the north of the deposit, but do not impact directly on the underground project, although
these areas will be partially impacted by surface settlement.
The most prominent fault sets which impact on mine design are:
• Hanging Wall Fault Zone • Footwall Fault • Northeast faults • Northwest faults • North faults • Various picrite intrusives associated with major fault zones
Microfracturing is pervasive throughout the deposit and is most intensely developed
where alteration is most intense. The intensity of microfracturing has not been recorded
in geological logs. However, it is expected that microfracturing will prove to be a
significant factor in cave development and fragmentation, and to a lesser degree in
development stability.
Rock quality varies broadly from extremely poor to good, with an average of fair. The
best ground conditions are found within the hypogene mineralization and the worst,
within the intensely altered FIZ, the Hanging Wall Fault Zone, the adjacent picrite, and
where major faults intersect the supergene mineralization.
GEOTECHNICAL DATABASE AND MODEL There is a geotechnical database which includes the majority of the total drilling. Drilling
coverage is good within and close to the mineralized zones, but decreases as the
distance from the main mineralized areas increases. Specific drilling has provided
geotechnical information in areas of key mine infrastructure. There is clear evidence of
deterioration of the core over time, particularly in the weaker materials.
All geotechnical logging by New Gold has been based upon Bieniawski’s original 1976
version of his rock mass rating system, the RMR76. AMC reviewed the raw
geotechnical data provided by New Gold, and generated RMR76 values during post-
processing. The resulting database has been incorporated into a geotechnical block
model.

SCOTT WILSON RPA www.scottwilson.com
New Gold Inc. – New Afton Project Technical Report NI 43-101 – December 31, 2009 Page 19-8
The New Afton drill hole database includes the following geotechnical data:
• Core recovery and RQD • Fractures per metre • Jointing intensity and condition (as per Bieniawski, 1976) • Joint roughness (recorded separately to joint condition) • Fracture / faulting code with core angle • RMR76 (Bieniawski) – calculated field from the above • RMR90 (Laubscher) – estimated from RMR76.
A database of small-scale structures (joints, fractures and veins) has been prepared
from surface pit and underground mapping, and, based on a limited program of
laboratory strength testing and field point load index testing, the rock mass unconfined
compressive strengths were estimated. The virgin rock stress was measured during the
study by overcoring of Hollow Inclusion (HI) cells in hypogene mineralization, exposed in
the underground exploration crosscut.
To facilitate an empirical assessment of cavability, a conversion to Laubscher’s RMR
(1990 version) was completed based on relogging of selected boreholes. This
correlation is considered satisfactory for broad indications of behaviour, such as in a
cavability assessment.
A geotechnical block model was prepared for both the mineralized zones and the host
rocks. The block model is based upon simple kriging, with search ellipses based on
geometry and statistical analyses, and criteria applied for minimum samples per cell.
The model contains blank cells where there is insufficient drilling to satisfy the search
criteria. Underground exposures provided a good opportunity to compare the block
model with actual conditions, and the comparisons were good on the scale of groups of
cells (tens of metres).
CAVABILITY The cavability of a deposit defines the ability of the orebody and overlying rock mass to
cave freely and spontaneously, once undercut to a sufficient dimension. Experience has
shown there is a relationship between the competence of a rock mass and the
dimensions of the undercut required to initiate and sustain caving. One of the design
challenges is to determine the undercut dimensions required for caving of the given rock
mass and to relate that to the orebody geometry available.
SCOTT WILSON RPA www.scottwilson.com
New Gold Inc. – New Afton Project Technical Report NI 43-101 – December 31, 2009 Page 19-9
Once initiated, caving is ideally a continuous process, providing sufficient void remains
below the cave back to enable new failures to occur. This void is created by continuous
production from the base of the cave, drawing down the broken caved material.
At New Afton, the dominant failure mechanism is projected to be structural collapse of
the rock mass, i.e., there are sufficient natural planes of weakness in a variety of
orientations for the rock mass to be unstable when undercut by a sufficient area.
The cavability of the New Afton deposit is represented by two end-members of a range
of changing orebody geometries and ground conditions. In the east, the deposit is
relatively wide, close to surface, and with a higher proportion of poorer ground
conditions. Outside the FIZ domain, some of the poorest ground conditions are located
in the Supergene ore at the far eastern ends of the deposit. Conversely, in the west, the
hypogene orebody is more narrow, deeper, and located within some of the most
competent ground conditions in the deposit.
As mentioned earlier in this section, it is proposed that the deposit will be mined using
three block cave panels, B1, B2, and B3. Figure 19-3 shows the undercut footprints
(blue outlines) for B1 and B2. Using these outlines the hydraulic radii (area/perimeter)
for the three panels are as follows:
• B1 and B2: HR = 34 m • B3: HR = 31 m
Based upon experience, there is no doubt the eastern areas of the orebody will cave
readily. Further assessment of cavability is, however, required for the central and
western areas of the deposit, especially where the orebody geometry narrows in the far
west (and at depth). The cavability of the New Afton deposit has been assessed using
two techniques: empirical and numerical stress analysis.
The empirical assessments of cavability indicate adequate cave development in B1 and
B2, and marginal cavability for B3. Although B3 is indicated to be cavable, from the
Laubscher Cavability Chart (Figure 19-4), the margin from the indicated “non-caving”
zone is small. The north-south span for B3 in particular is recognized as a potential
issue.
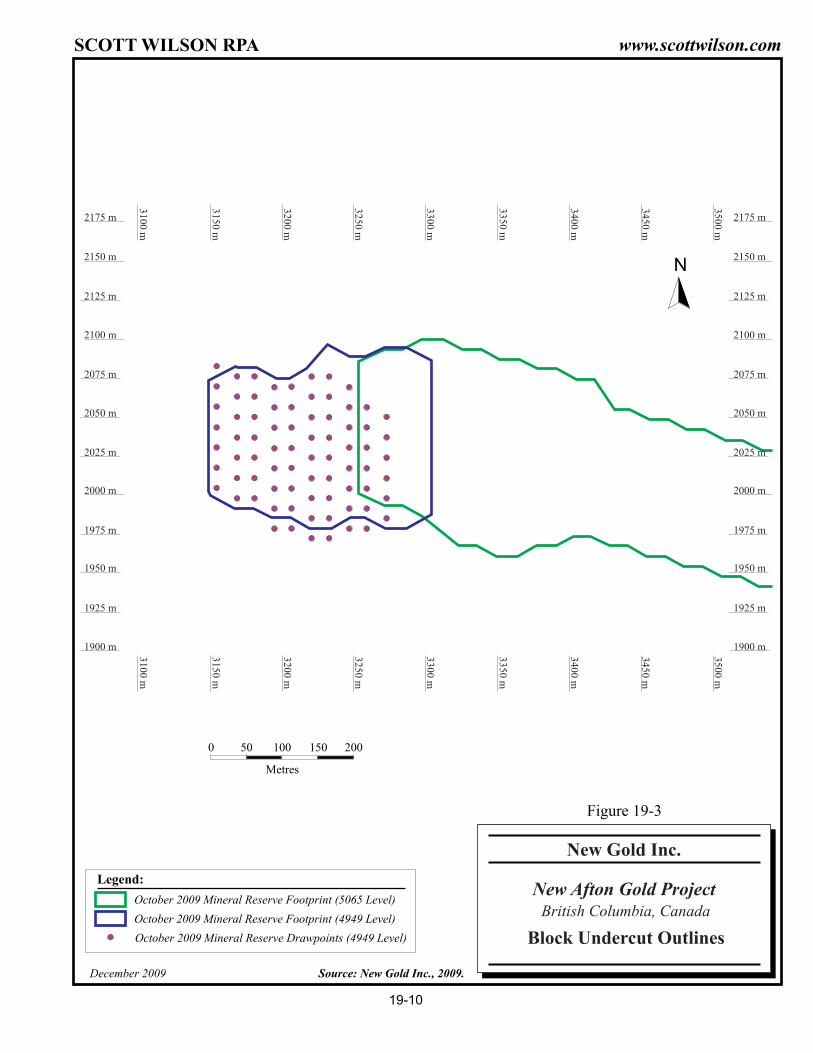
2175 m
2050 m
2075 m
2100 m
2125 m
2150 m
1950 m
1975 m
2000 m
2025 m
3100 m
1900 m
1925 m
2175 m
2050 m
2075 m
2100 m
2125 m
2150 m
1950 m
1975 m
2000 m
2025 m
1900 m
1925 m3150 m
3200 m
3250 m
3300 m
3350 m
3400 m
3450 m
3500 m
3100 m
3150 m
3200 m
3250 m
3300 m
3350 m
3400 m
3450 m
3500 m
Legend:
October 2009 Mineral Reserve Drawpoints (4949 Level)
October 2009 Mineral Reserve Footprint (4949 Level)
October 2009 Mineral Reserve Footprint (5065 Level)
0 50
Metres
100 150 200
N
Source: New Gold Inc., 2009.December 2009
Block Undercut Outlines
New Afton Gold Project
New Gold Inc.
British Columbia, Canada
Figure 19-3
19-10
SCOTT WILSON RPA www.scottwilson.com

Source: New Gold Inc., 2009.December 2009
Caving Stability Chart(after Laubscher, 1990)
New Afton Gold Project
New Gold Inc.
British Columbia, Canada
Figure 19-4
19-11
SCOTT WILSON RPA www.scottwilson.com

SCOTT WILSON RPA www.scottwilson.com
New Gold Inc. – New Afton Project Technical Report NI 43-101 – December 31, 2009 Page 19-12
The Abaqus non-linear finite element stress analyses indicated that a minimum north-
south span of 95 m was required and that caving would initiate at a hydraulic radius (HR)
of ≈ 32 m. This was based on hypogene rock properties. Again, this provides for
adequate cavability for B1 and B2, but marginal cavability for B3.
The role of major structures has not been considered in either the empirical or numerical
assessments of cavability. Major faults will assist cave development, especially in B1
which contains a high proportion of the weaker mesogene rock mass. The structural
environment associated with B3 is not currently well defined and it is recommended that
this be a focus for future data collection and investigative programs. B3 production is
significantly later than B1 and B2, providing time for such studies.
UNDERCUTTING SEQUENCE A number of undercutting sequencing alternatives were evaluated, but the sequence
selected was B2 first, followed closely by B1, both adopting a southwest to northeast
undercut direction. B3 (far west, and deeper) would be mined last.
The preferred undercutting sequence included consideration of the predominant
structural fabric, the principal stress direction and the results of numerical modelling.
The numerical modelling indicated that a significant zone of yield is likely to occur
beneath the undercut level, as caving extends upwards. Damage zones also extend a
significant distance into the surrounding rock mass adjacent to the caves, and suggest
the undercuts should extend 30 m to 40 m ahead of drawbell construction. This has
been implemented in the Project schedules.
CAVE CONTINGENCY PLANNING Two options are considered to mitigate any potential risks of poor cave performance:
• Pre-conditioning, and/or
• Cave assistance.
Pre-conditioning refers to the use of various techniques to generate additional fracturing
in the rock mass, to reduce rock mass strength, prior to the commencement of
undercutting. Cave assistance refers to methods used to weaken the rock mass within
the desired cave column, after caving has commenced, in response to areas of poor
cave performance. It is not envisaged that pre-conditioning will be required in B1 and B2
SCOTT WILSON RPA www.scottwilson.com
New Gold Inc. – New Afton Project Technical Report NI 43-101 – December 31, 2009 Page 19-13
at New Afton. However, pre-conditioning using blasting or hydraulic fracturing
techniques is an option for B3.
FRAGMENTATION An assessment of the size distribution of broken rock at the extraction level drawpoints
was carried out by Stratavision Pty Ltd. The block cave fragmentation (BCF) software
program was used for this assessment. The program provides an indication of the
primary fragmentation resulting from the initial caving processes and the secondary
fragmentation that occurs when material higher up in the orebody is broken up as it is
drawn down towards the drawpoints.
The work indicates that the New Afton deposit is highly fractured within all geotechnical
domains and the proportion of the caved rock mass that will pass 2 m3 (a standard
industry guideline) will be close to 100% for all areas, but with some potential for more
coarse material during the early stages of caving in the hypogene material.
Sensitivity analysis of the fragmentation estimates to changes in fracture frequency in
the potentially more competent hypogene domain in the lower portion of B3 indicates
that a primary fragmentation of 77% <2 m³ is possible. The secondary fragmentation
remains high with 98% <2 m³. Some large blocks may therefore be expected to report to
the drawpoints in the early stages of production within this domain.
Only a small percentage of hang-ups and oversize rock (greater than 2 m3) reporting to
the drawpoints are expected.
SURFACE SUBSIDENCE Underground mining by caving methods will result in surface subsidence. Subsidence
from massive underground three-dimensional orebodies is not well defined, the methods
of analysis are not standardized, and the subsidence is normally discontinuous.
The impact of the subsidence above the New Afton deposit has been evaluated by both
empirical and numerical methods. The empirical assessment of cave limits is only a
crude analysis, but is sufficient as a preliminary guide to possible surface effects.

SCOTT WILSON RPA www.scottwilson.com
New Gold Inc. – New Afton Project Technical Report NI 43-101 – December 31, 2009 Page 19-14
The Crater Zone (cave limit; discontinuous deformations) developed using empirical
methods is shown in Figure 19-5. The diagram also shows an exclusion zone (equivalent
to the Cave Influence Zone) within which there is potential for (elastic, continuous)
subsidence effects to occur. Permanent or difficult to replace surface infrastructure has
been excluded from this area.
The numerical assessment used a novel design approach, combining the merits of draw
simulation using Cave-Sim with a non-linear stress analysis of the ultimate cave
geometry. However, the model is uncalibrated, and naturally such a model includes a
number of important simplifying assumptions. The numerical analyses considered two
variations on rock mass material properties, “Best” and “Worst”, but did not include
discrete geological structures.
Figure 19-6 shows the extent of subsidence effects estimated using numerical modelling.
The diagram shows two surface outlines resulting from the Abaqus modelling of the
cave, termed “Best Credible” and “Worst Credible”, together with the surface outline
resulting from the analysis of ‘underground mining on pit slope’ stability. Slope damage
in the northern slopes occurs during the mining of B1. This zone grows during the
subsequent mining of B3, and the failure zone extends along the Tertiary contact in the
northern slope.
The subsidence crater and the influence zone will expand gradually as underground
mining progresses. Monitoring of ground behaviour will follow the progression of
underground and surface effects, and provide early indications of any unexpected
behaviour, to allow contingency plans to be implemented. Automated pit slope
monitoring is an ongoing exercise at the site.

Source: New Gold Inc., 2009.December 2009
Surface Subsidence Projections
New Afton Gold Project
New Gold Inc.
British Columbia, Canada
Figure 19-5
19-15
SCOTT WILSON RPA www.scottwilson.com
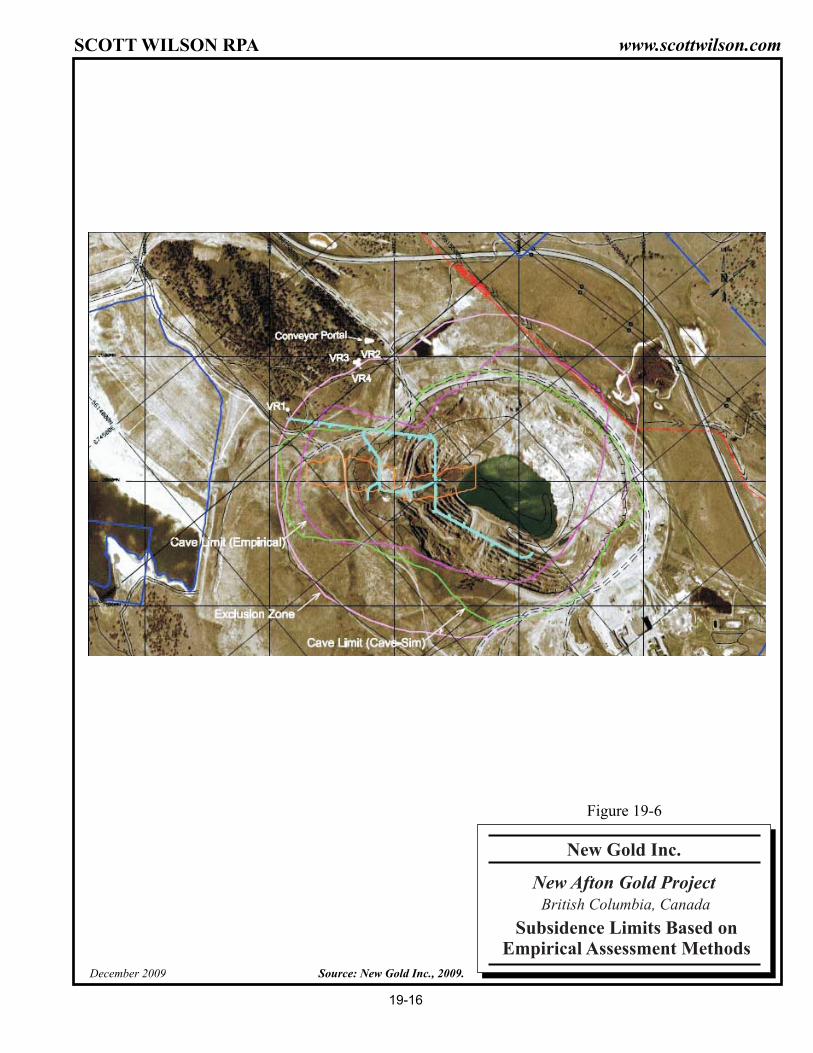
Source: New Gold Inc., 2009.December 2009
Subsidence Limits Based onEmpirical Assessment Methods
New Afton Gold Project
New Gold Inc.
British Columbia, Canada
Figure 19-6
19-16
SCOTT WILSON RPA www.scottwilson.com

SCOTT WILSON RPA www.scottwilson.com
New Gold Inc. – New Afton Project Technical Report NI 43-101 – December 31, 2009 Page 19-17
GROUND SUPPORT Stress analyses were undertaken to determine the likely stability of the undercut and
extraction levels for B1 and B2, where production for the initial years will take place, and
where ground conditions are slightly poorer. Specific assessments for B3 were not
carried out but will be required in the future, during a period of refinement of B3 layout
and designs.
The support systems include 24 mm diameter full-column grouted rockbolts, cable bolts,
F56 gauge weldmesh, mesh straps, and fibre-reinforced shotcrete. Two or three
Henderson-style steel sets will be used in each drawpoint brow, and special measures
are recommended to protect drawpoint pillar noses. The proportions of ground
conditions in different categories were considered based upon statistical analyses of
geotechnical data and the block model.
MAJOR EXCAVATIONS STABILITY Stress analysis studies of the proposed crusher chamber demonstrated there is no
interaction expected with the cave zones, and that the extent of yield around the crusher
chamber will be limited to local re-entrants and brows. No other specific stability
assessments were undertaken for other mine infrastructure.
MANAGEMENT PLAN AND MONITORING PROGRAM A Ground Control Management Plan (GCMP) will be required. This is a ‘live’ document
which captures all the key features of the operation’s ground control policies, practices,
and procedures. The GCMP would include:
• Details of the standard support designs.
• An outline of the conditions under which variations from those standards are permitted.
• The authorities / responsibilities for making any changes.
• The support specifications in use at the mine.
• A summary of the geotechnical monitoring programs in use at the mine.
A Geotechnical Monitoring Program will be an essential component of the Project’s rock
mechanics program. The program will need to be established, operated, and maintained
by a qualified rock mechanics engineer throughout the life of the Project. The objective
SCOTT WILSON RPA www.scottwilson.com
New Gold Inc. – New Afton Project Technical Report NI 43-101 – December 31, 2009 Page 19-18
of the monitoring program will be to provide data to enable the safe management of the
mine in respect of the major mine hazards.
These hazards include but are not limited to:
• Cave initiation, propagation, and surface impact/subsidence.
• Inrush risk (mud, water, and airblast).
• Major excavation stability (undercut and extraction levels, crusher).
• Mine seismicity.
CAVE MONITORING Monitoring of the cave is important and is planned to be done via borehole monitors and
remote sensing. Draw control is also important and the draw must be managed. The
recommended monitoring programs for both surface and underground are outlined
below.
Surface monitoring should include the following:
• Precise levelling across an array of monitoring stations distributed within and outside the predicted subsidence zone.
• Open holes for monitoring of cave progression. These holes will be focused on the central and western areas of the deposit. A total of 12 holes are recommended.
• Extensometers or time-domain reflectometry (TDR) cables also placed in surface boreholes drilled down to intersect the proposed cave at different elevations.
Underground monitoring should include the following:
• ‘Smart’ extensometers for monitoring ground movements on the undercut and extraction levels.
• Additional absolute virgin stress measurements.
• A Seismic Monitoring System.
A draw control plan should be designed and monitored, recording and managing the
production from the drawpoints as well as recording and monitoring conditions at the
drawpoints.
SCOTT WILSON RPA www.scottwilson.com
New Gold Inc. – New Afton Project Technical Report NI 43-101 – December 31, 2009 Page 19-19
MUDRUSH POTENTIAL An assessment of the mudrush potential was completed for the 2007 Feasibility Study.
There is a potential for mudrush hazard to develop during the life of the mine, due to the
following:
• Potentially mud-forming rock types exist within the cave material.
• Potential for significant water inflow from terrestrial sources.
• Potential for localized ingress of groundwater into the cave material along prominent structures and ungrouted drill holes.
• Potential for ingress of wet mud and fines from the Afton pit as the cave breaks through the pit floor.
• The generation of progressively increasing volumes of fines, due to comminution of the cave material as the cave matures.
The generation of fines within the Afton block cave is an unavoidable product of the
caving process. As a result, it is recommended that engineering measures and
procedures be developed, with the focus on minimizing the passage of water into the
cave muck pile and on reducing the accumulation of fines within the cave muck pile by
developing strict draw control strategies.
The following specific controls are recommended to minimize the potential for the
development of mudrush hazards:
• Develop and implement a draw management plan.
• Conduct a drawpoint monitoring program to identify the nature of the material (particle size and moisture content).
• Maximize use of remote-loaders.
• Appoint a responsible person who is accountable for the ongoing task of assessing the mudrush potential.
• Remove all free water from the New Afton open pit before mining commences.
• Reduce the water content of the debris in the bottom of the pit such that the material is not subject to liquefaction when disturbed by subsidence or movement within the cave.
• Minimize and control water inflow into the cave muck pile at every opportunity.
SCOTT WILSON RPA www.scottwilson.com
New Gold Inc. – New Afton Project Technical Report NI 43-101 – December 31, 2009 Page 19-20
The potential mudrush hazard has been based on limited information especially as
related to the potential for fines generation within the cave muck pile. Additional rock
property tests are recommended, including slake durability tests, for the specific rock
types representative of those expected within the cave muck pile.
HYDROGEOLOGY A hydrogeological evaluation was carried out to determine the present pit water balance
and to predict likely inflows to the block cave. Total groundwater inflow to the pit/block
cave is predicted to increase from about 4 L/s to 5 L/s under present pre-mining
conditions, rising to about 8 L/s during block cave operations.
The highest transient inflows are predicted to occur once the back of the cave starts to
fail and the zone of fracturing starts to migrate to the surface. Based on a six month
period between the completion of the undercut and the initiation of surface subsidence,
simulated flows ranged from 11 L/s to 17 L/s for the 0.5% and 1.0% porosity cases, with
short term peak flows up to about 26 L/s. The transient flows are considered upper
bound and will be re-assessed during initial mine developed and once the undercut
development is initiated.
PIT DEWATERING AND DEBRIS STABILIZATION Based upon a bathymetric survey and the final pit survey, it has been estimated that the
pit contains approximately 2.6 Mm3 of supernatant water and 0.6 Mm3 of rock and soil
debris. That volume was estimated to be increasing by about 0.15 Mm3 per year.
It is proposed to stabilize the debris material prior to block caving operations. The
strategy involves removal of the supernatant water by pumping. Once the free water has
been removed, a road will be constructed across the pit on top of the debris to access a
series of up to 40 dewatering wells that will penetrate the full thickness of the debris to
the base of the pit. Submersible pumps in each of the wells will continue to remove
water until the moisture content of the debris has been reduced to approximately its
liquid limit. Further consolidation will be achieved by either vacuum pumping from the
existing wells or mechanical compaction.
The objective is to dewater to fines content of the debris, to approximately midway
between its liquid limit and its plastic limit, so that a mudflow cannot occur. A period of

SCOTT WILSON RPA www.scottwilson.com
New Gold Inc. – New Afton Project Technical Report NI 43-101 – December 31, 2009 Page 19-21
approximately two years has been allowed for this process to be completed and verified,
prior to commencement of caving in B1.
At the time of this report, the dewatering of the pit was underway with a forecast 280
days of pumping left to complete the initial dewatering. This would lead to completion of
the first phase of dewatering near the end of the second quarter of 2010.
BLOCK CAVE DESIGN UNDERCUT DESIGN The undercut design is shown in Figure 19-7. The undercut will be mined from crosscuts
driven at a nominal centreline spacing of 13 m. A low height undercut is proposed with a
flat section over the drawbell and an “A” shape forming the crown of the major apex. A
vertical interval of 17 m floor to floor has been adopted between the undercut level and
the extraction level below. This distance is a reasonable compromise between the
reduced stress effects on the extraction level achieved by increasing the interval and the
practical issues associated with mining drawbells with a high level of consistency and
reliability.
It is proposed that the undercut crosscuts will be mined 3.6 m wide by 4.0 m high. An
access drive 5.5 m wide and 5.5 m high will be mined on the north side of the deposit. A
slot drive will link the southern extremities of the crosscuts. The undercut crosscuts will
be mined at a nominal gradient of 1:50 (2.0%) to the south. As the development will be
driven down grade, face pumps will be necessary during the development stage. Drain
holes down to the extraction level will be drilled where necessary. Each undercut
crosscut will be ventilated using an auxiliary ventilation duct, both during development
and when retreating the undercut.

Source: New Gold Inc., 2009.December 2009
Undercut Design
New Afton Gold Project
New Gold Inc.
British Columbia, Canada
Figure 19-7
19-22
SCOTT WILSON RPA www.scottwilson.com
SCOTT WILSON RPA www.scottwilson.com
New Gold Inc. – New Afton Project Technical Report NI 43-101 – December 31, 2009 Page 19-23
It is estimated that approximately 45% of the material blasted in the undercut will be
extracted on the undercut level using 6-tonne to 7-tonne capacity load-haul-dump (LHD)
units. This material will be tipped in ore passes leading to the ore transfer level. Five
2.4 m diameter passes from the B1 and B2 undercut level are proposed for this purpose.
In order to maintain an overall undercut face angle of approximately 60° to the strike of
the deposit, the cave face position in each crosscut will need to lag the face in the
adjacent westerly crosscut by a minimum of 22.5 m.
The undercut will be drilled using 64 mm diameter holes at a ring spacing of 2.1 m. The
inclination of the rings will be designed to reduce the lag between undercut face
positions in adjacent crosscuts to a minimum. Approximately 93 m of drilling per ring will
be required. A number of slot raises, up to 12 m long, will be required to initiate the
undercut, a Cubex in-the-hole (ITH) drill rig with pneumatic hammers mounted on a
Roger V-30 reaming head is proposed for this work.
DRAWBELL DESIGN AND CONSTRUCTION Drawbell drives were designed at 4.0 m high x 3.6 m wide to provide adequate clearance
for the drilling equipment. Drawbells will be constructed by drilling twin 760 mm pilot
raises with a Cubex rig, and approximately 1,360 m of 64 mm blastholes with a hydraulic
top hammer production drill. Pumped emulsion explosives and electronic detonators will
be required to give the highest level of control and predictability over the blast.
Drawpoint support work will be completed prior to firing the drawbell.
EXTRACTION LEVEL DEVELOPMENT The extraction level crosscuts will be accessed from a 5.5 m wide x 5.5 m high access
drive on the north side of the deposit. An offset herringbone layout is proposed, with the
access crosscuts being 3.6 m wide by 3.6 m high, after application of surface support.
These dimensions are suitable for the use of either diesel or electric LHD units.
Ore will be trammed back to short 2.4 m diameter ore passes connected to the
production crosscut. Only one LHD will operate in a crosscut at any time and will only
enter the access drive when moving from one production crosscut to the next, or when
travelling to the workshop for maintenance. This arrangement avoids interaction with
other LHDs or with development and ground support equipment that will need to use the
access drive.
SCOTT WILSON RPA www.scottwilson.com
New Gold Inc. – New Afton Project Technical Report NI 43-101 – December 31, 2009 Page 19-24
To allow for the long life required, ground support standards will be high with extensive
use of fibrecrete, rockbolts, and cables. Concrete roadways will be constructed in the
extraction level crosscuts.
Intake air will enter the level from the access drive and flow past the drawpoints to
exhaust ventilation raises at the southern end of the crosscuts leading to the ventilation
level below. Ventilation raises will be fitted with small fans to control airflow.
Crosscuts will be graded down at 1:50 (2.0%), towards the ventilation raise such that
water from the drawpoint dust suppression system, plus any groundwater emanating
from the cave, flows to the raise and thus to the main collection sumps. It is proposed
that water sprays installed at the drawpoints will be automatically controlled by vehicle
movement sensors.
DRAWPOINTS Drawpoints were designed to accommodate 6-tonne to 7-tonne capacity LHDs at 3.4 m
wide by 3.4 m high. Drawpoints will be heavily supported with rockbolts, fibrecrete, and
Henderson style sets. Figures 19-8 and 19-9 show a typical drawpoint arrangement.
The tonnage drawn through each drawpoint will vary from 14,000 tonnes for those
drawpoints whose purpose is only to extend the cave footprint to achieve the minimum
span required for caving, up to 165,000 tonnes. Concrete roadways will be constructed
in all drawpoints, with steel wear rails embedded in the concrete in those drawpoints
where in excess of 75,000 tonnes is planned to be extracted. Drawpoints will be fitted
with automatic dust suppression sprays, activated when a loader enters the drawpoint.

Source: New Gold Inc., 2009.December 2009
Drawpoint Arrangement
New Afton Gold Project
New Gold Inc.
British Columbia, Canada
Figure 19-8
19-25
SCOTT WILSON RPA www.scottwilson.com
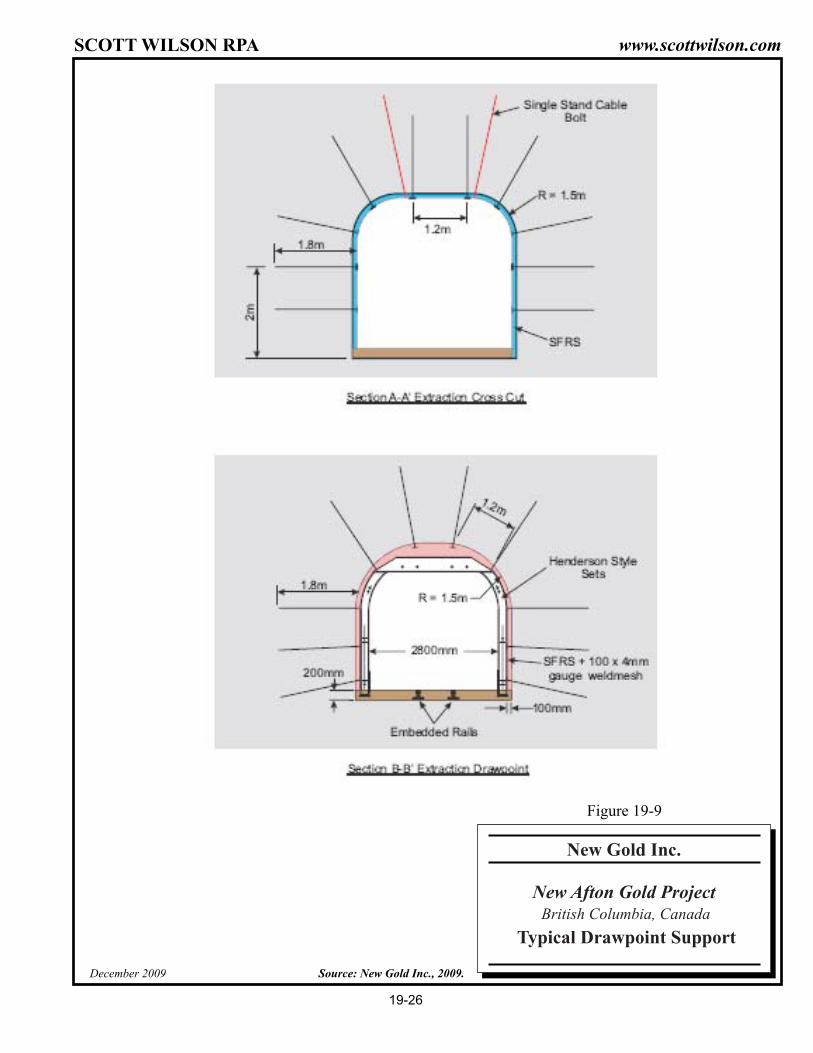
Source: New Gold Inc., 2009.December 2009
Typical Drawpoint Support
New Afton Gold Project
New Gold Inc.
British Columbia, Canada
Figure 19-9
19-26
SCOTT WILSON RPA www.scottwilson.com
SCOTT WILSON RPA www.scottwilson.com
New Gold Inc. – New Afton Project Technical Report NI 43-101 – December 31, 2009 Page 19-27
ORE AND WASTE HANDLING As part of the Feasibility Study, a trade-off study to assess the merits of using either
shaft or conveyor haulage for ore transfer to surface was completed. Conveyor handling
was chosen as a lower overall cost alternative.
ORE AND WASTE HANDLING REQUIREMENTS During the initial development of the mine, all ore and waste will be trucked to the
surface. Following commissioning of the underground crushing and conveying system,
truck haulage in the conveyor decline will be limited to delivery of bulk materials to the
mining areas and possibly some waste transfer to surface.
Approximately 12% of the ore to be mined will originate from B3, located approximately
120 m below the crusher feed position. Ore from this area will be mined later in the mine
life and will be trucked up to the crusher via a decline.
A summary of the estimated total quantity of ore and waste mined over the life of the
Project is shown in Table 19-1 and Figure 19-10.
Prior to installation of the underground crusher and conveyors, ore and waste will be
trucked to the surface using a fleet of 50 tonne capacity articulated haul trucks. Trucking
routes out of the mine will include the conveyor ramp, except during installation of the
conveyor, and the existing exploration ramp. Either route could be used for ore and
waste but, in general, ore will be trucked via the conveyor ramp to a stockpile adjacent to
the mill and waste, via the exploration ramp for disposal in the open pit. It is envisaged
that waste hauled to the surface via the conveyor ramp will be placed on top of the future
subsidence area.
The estimated total average annual ore and waste movement during the initial
construction period is shown in Figure 19-10. Material movement requirements will peak
at approximately 2,400 tonnes per day prior to crusher commissioning (Q2 2012). The
material movement increases to 4,900 tonnes per day when the crusher is
commissioned and ramps up to a peak of 11,900 tonnes per day.
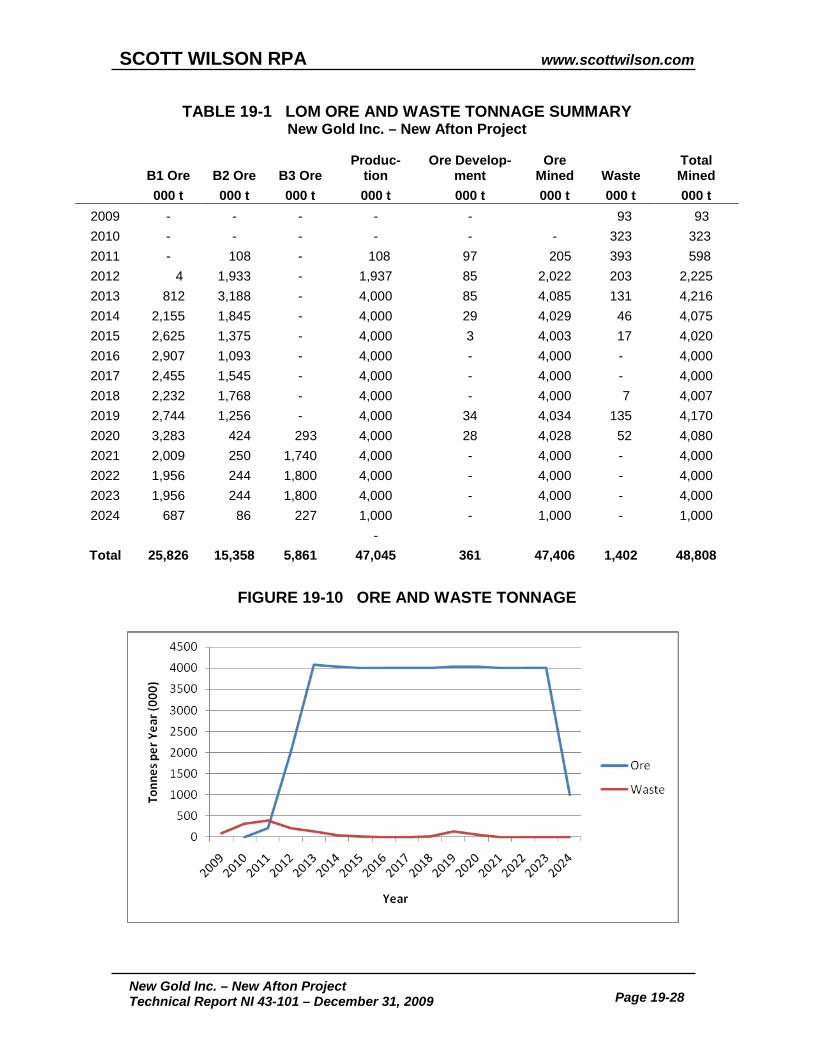
SCOTT WILSON RPA www.scottwilson.com
New Gold Inc. – New Afton Project Technical Report NI 43-101 – December 31, 2009 Page 19-28
TABLE 19-1 LOM ORE AND WASTE TONNAGE SUMMARY New Gold Inc. – New Afton Project
B1 Ore B2 Ore B3 Ore Produc-
tion Ore Develop-
ment Ore
Mined Waste Total Mined
000 t 000 t 000 t 000 t 000 t 000 t 000 t 000 t
2009 - - - - -
93 93 2010 - - - - - - 323 323 2011 - 108 - 108 97 205 393 598 2012 4 1,933 - 1,937 85 2,022 203 2,225 2013 812 3,188 - 4,000 85 4,085 131 4,216 2014 2,155 1,845 - 4,000 29 4,029 46 4,075 2015 2,625 1,375 - 4,000 3 4,003 17 4,020 2016 2,907 1,093 - 4,000 - 4,000 - 4,000 2017 2,455 1,545 - 4,000 - 4,000 - 4,000 2018 2,232 1,768 - 4,000 - 4,000 7 4,007 2019 2,744 1,256 - 4,000 34 4,034 135 4,170 2020 3,283 424 293 4,000 28 4,028 52 4,080 2021 2,009 250 1,740 4,000 - 4,000 - 4,000 2022 1,956 244 1,800 4,000 - 4,000 - 4,000 2023 1,956 244 1,800 4,000 - 4,000 - 4,000 2024 687 86 227 1,000 - 1,000 - 1,000
-
Total 25,826 15,358 5,861 47,045 361 47,406 1,402 48,808
FIGURE 19-10 ORE AND WASTE TONNAGE

SCOTT WILSON RPA www.scottwilson.com
New Gold Inc. – New Afton Project Technical Report NI 43-101 – December 31, 2009 Page 19-29
CONVEYOR DECLINE The conveyor decline has been designed at a gradient of 1:6 (16.7%) with four legs,
varying in length from 700 m to 1,200 m. Transfer stations were designed at the head
and tail end of each leg. The cross-sectional dimensions, at 5.5 m wide by 6.5 m high,
provide adequate clearance for a loaded 50-tonne capacity truck and the conveyor
structure. A typical cross-section through the conveyor decline is shown in Figure 19-12.
The decline is being developed using drill and blast techniques with diesel powered
trucks and large capacity LHDs. Ground support for the decline includes the use of rock
bolts and fibrecrete.
It is proposed that the conveyor structures would be of modular construction and
suspended from chains attached to the back of the decline. The following belt
specification was used in the Feasibility Study:
• 1,050 mm wide ST3150
• 13 mm top cover, abrasion, cut, gouge and fire resistant 7 mm bottom cover
• fabric breaker cover above cords
• rip detection loops at 50 m spacing
• fire detection systems installed along the length of the belt with automatic water sprays installed in head and tail areas
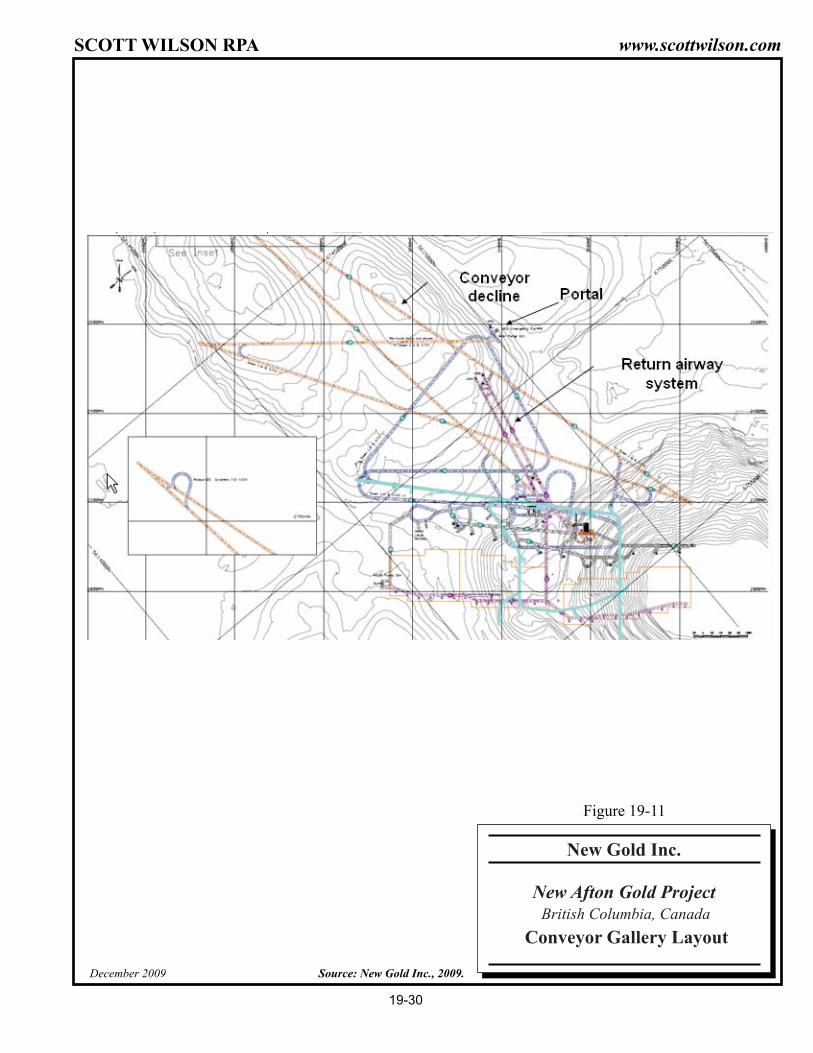
Source: New Gold Inc., 2009.December 2009
Conveyor Gallery Layout
New Afton Gold Project
New Gold Inc.
British Columbia, Canada
Figure 19-11
19-30
SCOTT WILSON RPA www.scottwilson.com
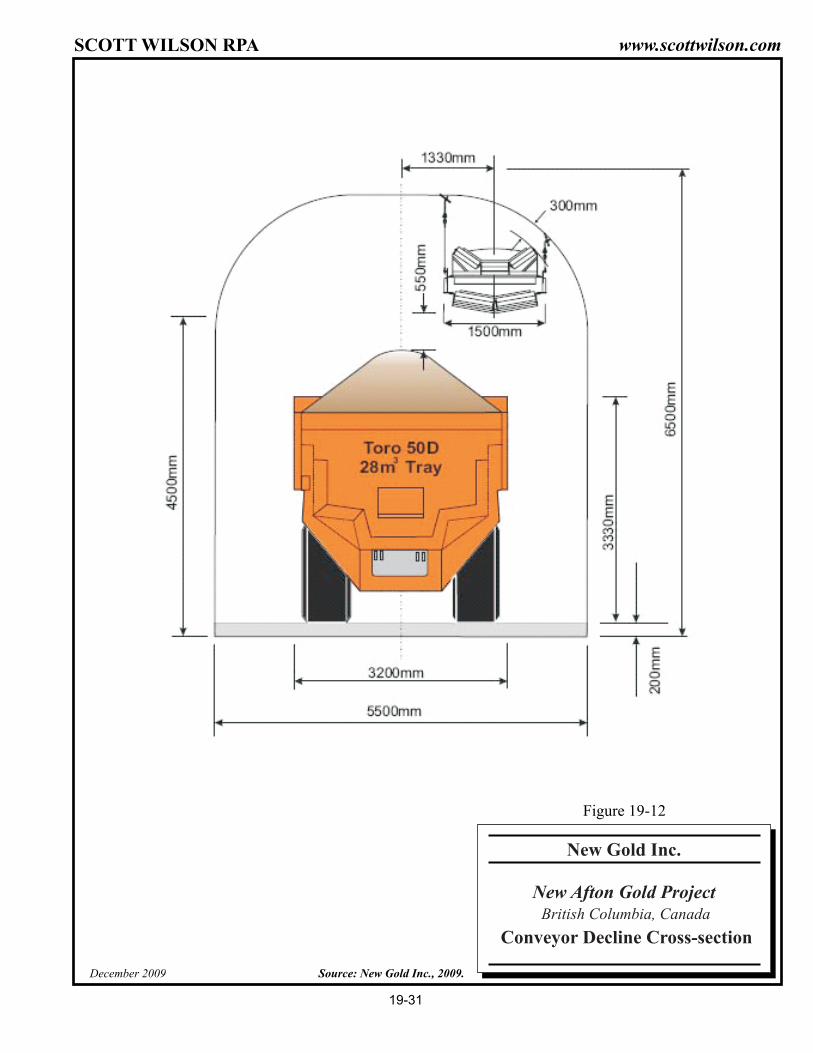
Source: New Gold Inc., 2009.December 2009
Conveyor Decline Cross-section
New Afton Gold Project
New Gold Inc.
British Columbia, Canada
Figure 19-12
19-31
SCOTT WILSON RPA www.scottwilson.com
SCOTT WILSON RPA www.scottwilson.com
New Gold Inc. – New Afton Project Technical Report NI 43-101 – December 31, 2009 Page 19-32
CONVEYOR TRANSFER ARRANGEMENTS The design philosophy for the transfer stations is to minimize the excavation volume
required; to keep maximum excavation spans below 10 m; to simplify installation,
maintenance and belt replacement activity; and to provide belt replacement facilities at
the head end using a 4.5 m high roll of belting.
The geometry of the conveyor decline results in shallow angles at the transfer points. A
transfer arrangement having separate head end and tail end chambers with a short
interconnecting ore bin was selected on the basis of its relative simplicity and lower cost.
With the exception of the portal conveyor, each conveyor will be driven from the head
end using dual drives. The head end drive floor will be elevated, providing a roadway
beneath the floor for maintenance vehicle access to the head end chamber and belt
reeling station.
A tail end belt take-up arrangement was selected for all transfer stations as it provides
the best combination of minimizing excavation spans and overall excavation volume.
The conveyor decline and transfer stations were designed such that trucks and other
vehicles using the decline do not have to pass through the transfer chambers.
INSTALLATION OF CONVEYOR SYSTEM At various stages during the installation of the conveyor system, it will be necessary to
suspend trucking activities in the conveyor decline. During these periods, ore will be
trucked to surface via the alternative route through the open pit portal and the open pit
access road to the mill stockpile.
To speed the installation process, it is envisaged that idler frames in 6 m lengths
complete with idlers will be pre-assembled on surface and delivered down the decline
and installed using a suitably modified scissor-lift truck. Laser survey control will be
used to align the holes for the conveyor suspension bolts and the idler frames.
ORE TRANSFER FROM THE EXTRACTION LEVEL TO THE CRUSHER LHDs operating on the extraction level will feed ore to short ore passes leading to the
ore transfer level located approximately 17 m below. No grizzlies are proposed at the
SCOTT WILSON RPA www.scottwilson.com
New Gold Inc. – New Afton Project Technical Report NI 43-101 – December 31, 2009 Page 19-33
top of the passes, which will be sized to accept the largest possible rock capable of
being delivered by the 6-tonne to 7-tonne capacity LHDs.
Two 17-tonne capacity LHDs will load ore from the base of the ore passes and tram it to
the crusher dump pocket. In order to protect the ore pass brows from excessive wear,
steel sets embedded in high strength fibrecrete similar to those proposed for the
production drawpoints will be installed at the base of each pass. Brow chains will also
be fitted at the bottom of the passes. The passes will be fitted with level sensors and
lights on both the extraction and transfer levels to ensure the brow of the pass is always
kept closed.
Dual tramming routes were designed on the transfer level to avoid interaction between
haulage units. There is the potential for fully automated operation of the loaders on this
level.
The transfer drives were designed at 5.5 m wide by 4.0 m high and will be mined at a
nominal gradient of 1:40 (2.5%). A high strength concrete road bed will be installed
along with embedded steel wear bars in the crosscuts leading to the base of each pass.
CRUSHER A 150-tonne to 600-tonne capacity crusher dump pocket designed to allow two-sided
tipping by LHDs and single side tipping by 50-tonne capacity trucks will be installed
above a 2.4 m wide apron feeder. The feeder will control the feed rate to a 2,000 mm x
1,500 mm nominal size single toggle jaw crusher. A fixed rock breaker installed at the
crusher feed hopper will minimize production delays due to crusher bridges.
The crushed material is discharged into a pocket and bin of approximately 200-tonne
capacity located directly below the crusher outlet cavity. The crushed ore bin discharges
onto the picking conveyor belt, where a tramp metal detection and collection system will
remove metal objects before ore is fed to the main decline belt system.
Ore from B3 will be trucked from a truck loading bay near the extraction drift directly to
the crusher dump pocket or to a short pass adjacent to the crusher. A maximum
production rate of approximately 1.8 Mtpa has been scheduled from B3.
SCOTT WILSON RPA www.scottwilson.com
New Gold Inc. – New Afton Project Technical Report NI 43-101 – December 31, 2009 Page 19-34
WASTE HANDLING It is envisaged that waste mined after commissioning of the crusher and conveyor
system will be trucked to surface via the conveyor decline, however, provision has also
been made for waste to be batched through the system on an as-needs basis. The
short ore pass adjacent to the crusher designed to handle ore from B3 will be used as a
waste storage pass. Very little waste will be mined once ore production commences
from B3.
The transfer tower at the head end of the portal conveyor will be fitted with a head chute
and a two-way transfer to either the mill feed conveyor or waste conveyor.
PRE-PRODUCTION SCHEDULE Exploration of the New Afton deposit included an underground drive and access from the
512 m elevation of the open pit. This development provided a starting point for the mine
development coupled with a new portal for the conveyor gallery collared near the mill.
Mine development commenced in 2007 and continued until November 2008, when it
was halted to conserve cash in the difficult financial markets. The mine development in
2007 and 2008 was carried out by a mining contractor, Cementation Inc.
Mine development restarted in February 2009 as New Afton changed from contractor
mining to owner mining. The mine development is advancing the conveyor galleries and
the main access. Initial ore from development, undercutting, and production drawpoints
will be stockpiled in a temporary stockpile area adjacent to the mill. Milling operations
were scheduled to commence in month 37 and will increase to the planned production
rate of 4 Mtpa over a three-month period. Operations are proposed to continue at the
planned rate for 11 years.
Lateral development scheduling has been completed using the following assumptions:
• All remuck bays have been designed and included in the estimate of total drift metres.
• An allowance for overbreak of 10% of the designed excavation volume is added when estimating tonnages of waste from development.
• Waste is assigned a density of 2.6 t/m³. The density of development ore is taken from the resource block model.
SCOTT WILSON RPA www.scottwilson.com
New Gold Inc. – New Afton Project Technical Report NI 43-101 – December 31, 2009 Page 19-35
• The advance of any single heading is limited to a maximum of 30 m/week. In the case of the extraction level crosscuts and undercut development, this is reduced to 20 m/week.
• The maximum drawpoint development rate is scheduled at 10 m/week.
• In multiheading development situations, the maximum development rate scheduled per development jumbo is limited to 50 m/week.
• Development of the extraction level crosscuts and drawpoints are scheduled in two stages. Initially, the crosscut is advanced to its southern extremity. A minimum period of four weeks is scheduled to pour and cure the concrete roadway before development of the first drawpoint.
• Construction of drawpoints and drawbell crosscuts is scheduled after the roadway is complete and the undercut has passed overhead.
• All bored raises are scheduled at an average advance rate (including rig up, piloting, reaming, and rig down activities) of 30 m/week.
• All distances are based on the centreline to centreline distance. The exception to this is the extraction level drawpoints where the length is measured from the wall of the extraction crosscuts.
PROGRESS TO SEPTEMBER 30, 2009 Actual development by Company crews for the period February to September 2009
totalled 1,072 m vs. the budget of 1,490 m. The shortfall in advance reflects the
development and training of new mining crews and limited heading availability.
Management indicates that this development shortfall is being addressed by moving
from 5 day per week 10.5 hour shifts to 7 day per week 11 hour shifts. Development
rates will also benefit from the availability of close-spaced multiple headings in 2010.
Productivity rates used in the LOM reflect actual productivity to date. Development cost
to date is $6,829/m to the end of September based on mining and maintenance costs,
but excluding indirects, such as general and administration (G&A) costs. Comparable
LOM development costs are $5,733/m. The LOM cost estimate reflects increasing
expertise within the crews, increased efficiencies resulting from 24:7 operation and
longer shifts, and multiple close-spaced headings. Actual productivity to date was taken
into account in estimating advance rates for the LOM.
SCOTT WILSON RPA www.scottwilson.com
New Gold Inc. – New Afton Project Technical Report NI 43-101 – December 31, 2009 Page 19-36
INFRASTRUCTURE MINE ACCESS The deposit is bounded on the southern side by a major fault structure (the Hanging Wall
Fault and Picrite), which is considered to be difficult to cross; therefore, the permanent
access and underground infrastructure has been designed on the north (footwall) side of
the deposit.
The existing exploration portal (located within the open pit) and decline provided early
access for the undercut and extraction level development and a conveyor decline portal
has been developed close to the proposed mill site at an elevation of 674 m.
After the commencement of production, caving will cause access through part of the
exploration decline to be lost. Prior to this occurring, a service raise (VR5), equipped
with an emergency hoisting system will be installed to provide a separate connection
between the mine workings and surface. During the remaining life of the mine, the main
access will be via the conveyor decline, with the service raise and hoisting system
providing a second means of egress for use in an emergency.
MINE VENTILATION The primary ventilation circuit will be a push-pull system with six main surface fans
installed on three intake shafts and three exhaust shafts. The conveyor decline will be
an exhaust airway. The total required airflow has been estimated at 500 m3/s. Exhaust
raises will be 3.5 m diameter and will each have an airflow of approximately 140 m3/s,
with an additional 80 m3/s returning via the conveyor decline. The three intake raises will
be 3.5 m diameter and will each have an airflow of approximately 167 m3/s.
Flow rates and pressures in the proposed ventilation circuit were modelled using
Ventsim software. Six horizontally mounted axial flow fans are proposed to meet the
required duty. A number of secondary and booster fan arrangements within the mine will
ensure distribution of air to all working areas.
Simple, robust and automated circuit control devices are proposed to create an efficient
ventilation system. Automatically activated water sprays will be fitted to production
drawpoints on the extraction level to minimize dust. Dust extraction systems will be
installed on orepasses, at conveyor transfer points and in the crusher station.

SCOTT WILSON RPA www.scottwilson.com
New Gold Inc. – New Afton Project Technical Report NI 43-101 – December 31, 2009 Page 19-37
AMC has estimated an average surface rock temperature at New Afton of approximately
12°C and a geothermal gradient of approximately 3°C per 100 m depth. There is some
potential for hot working conditions to be encountered in the deeper parts of the mine
while intensive development is being undertaken (particularly during summer), but these
situations can be avoided provided that secondary ventilation systems are properly
designed, installed, and maintained.
Between 1978 and 1993, approximately 23% of days at New Afton had average
temperatures below freezing. To avoid the problems associated with air intake
temperatures consistently below freezing, it is proposed to install natural gas, direct fired
heating plants on each of the intakes. These plants will be installed near the portals with
warm air ducted to the portal entrances and the intake raises. Only a portion of the air
entering the portals will be heated. The quantity and temperature of the heated air will be
adjusted to maintain the overall temperature of air entering the mine above freezing.
UNDERGROUND SHOPS AND SERVICES An underground workshop will be constructed adjacent to the extraction level for the
mobile equipment fleet maintenance. An underground fuel bay will be installed with a
dedicated return airway and a fire suppression system. An underground magazine has
been designed to hold approximately one week’s consumption of explosives, with supply
from surface through regular visits from explosives suppliers.
Lunch room and refuge station facilities will also be installed on the extraction level.
MINE DEWATERING The underground pumping system is designed as a staged system with an installed
pumping capacity of 50 L/s. The main pumps will be remotely monitored and controlled.
COMPRESSED AIR AND ELECTRICITY A mine-wide compressed air system is not planned for the entire mine. A local system
will be installed in the workshop and crusher area for maintenance and other
miscellaneous activities. Compressed air for other activities will be provided by on-board
and mobile compressors. Electrical power will be reticulated through the mine at 13.8 kV
via a ring main system.
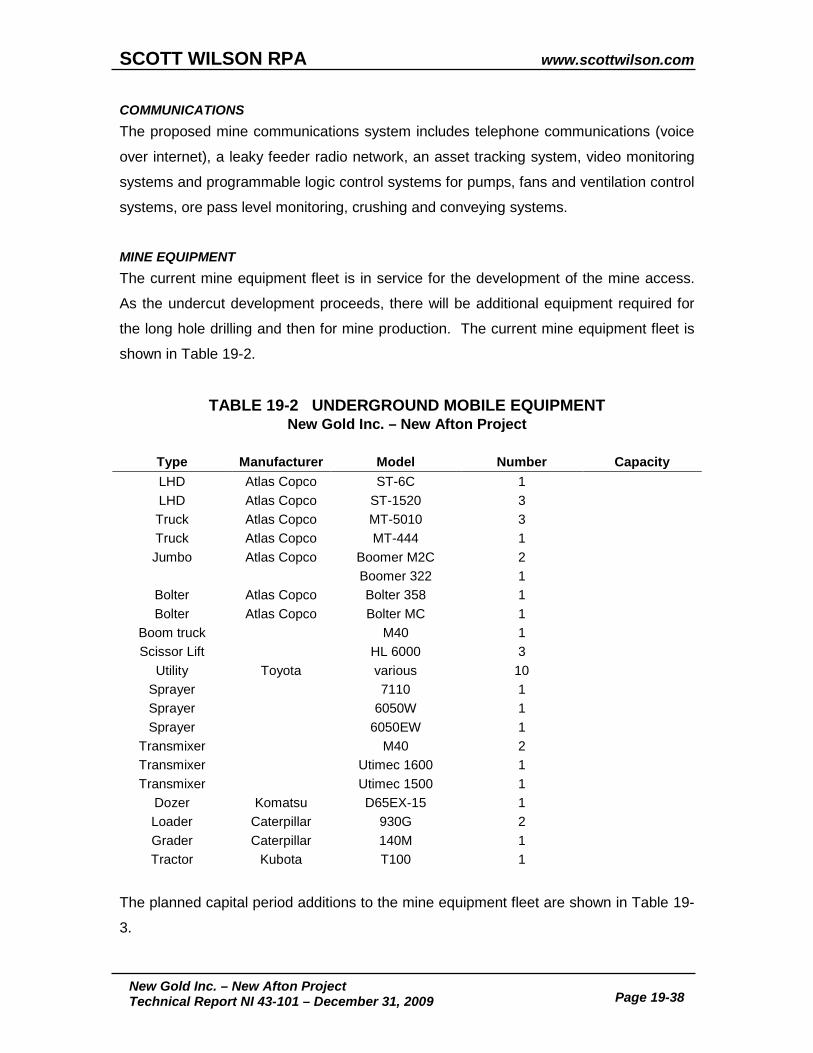
SCOTT WILSON RPA www.scottwilson.com
New Gold Inc. – New Afton Project Technical Report NI 43-101 – December 31, 2009 Page 19-38
COMMUNICATIONS The proposed mine communications system includes telephone communications (voice
over internet), a leaky feeder radio network, an asset tracking system, video monitoring
systems and programmable logic control systems for pumps, fans and ventilation control
systems, ore pass level monitoring, crushing and conveying systems.
MINE EQUIPMENT The current mine equipment fleet is in service for the development of the mine access.
As the undercut development proceeds, there will be additional equipment required for
the long hole drilling and then for mine production. The current mine equipment fleet is
shown in Table 19-2.
TABLE 19-2 UNDERGROUND MOBILE EQUIPMENT New Gold Inc. – New Afton Project
Type Manufacturer Model Number Capacity LHD Atlas Copco ST-6C 1 LHD Atlas Copco ST-1520 3 Truck Atlas Copco MT-5010 3 Truck Atlas Copco MT-444 1 Jumbo Atlas Copco Boomer M2C 2
Boomer 322 1 Bolter Atlas Copco Bolter 358 1 Bolter Atlas Copco Bolter MC 1
Boom truck M40 1 Scissor Lift HL 6000 3
Utility Toyota various 10 Sprayer 7110 1 Sprayer 6050W 1 Sprayer 6050EW 1
Transmixer M40 2 Transmixer Utimec 1600 1 Transmixer Utimec 1500 1
Dozer Komatsu D65EX-15 1 Loader Caterpillar 930G 2 Grader Caterpillar 140M 1 Tractor Kubota T100 1
The planned capital period additions to the mine equipment fleet are shown in Table 19-
3.
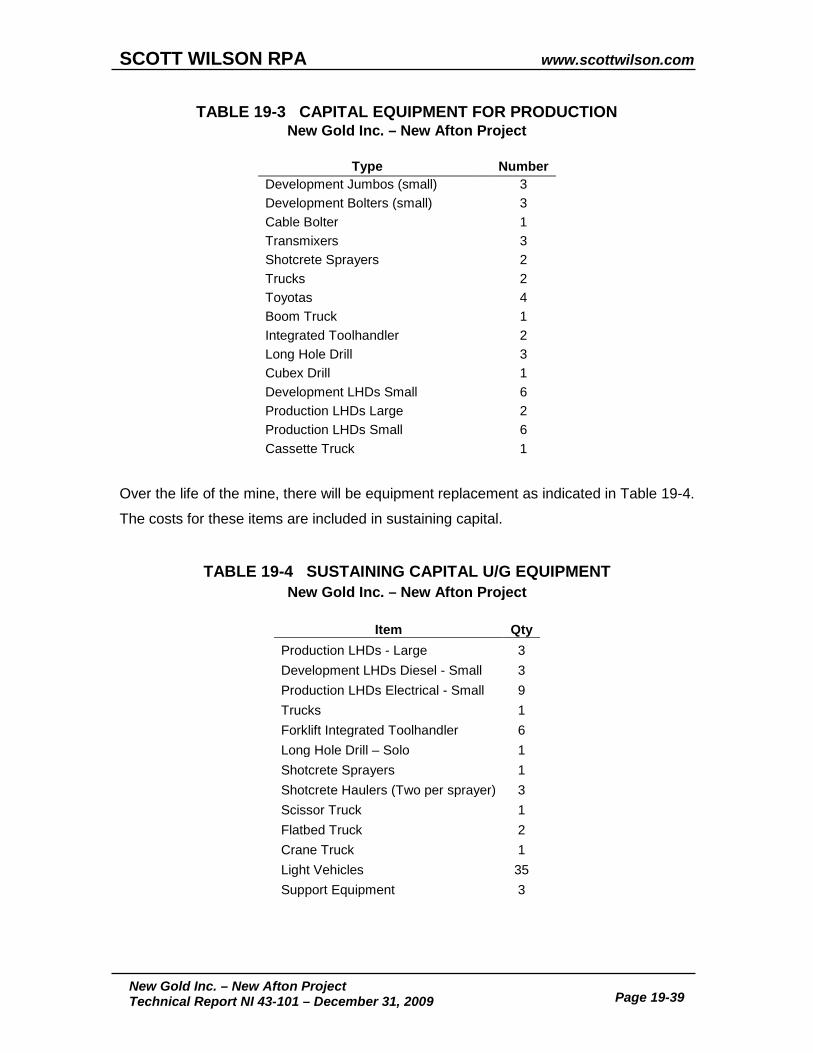
SCOTT WILSON RPA www.scottwilson.com
New Gold Inc. – New Afton Project Technical Report NI 43-101 – December 31, 2009 Page 19-39
TABLE 19-3 CAPITAL EQUIPMENT FOR PRODUCTION New Gold Inc. – New Afton Project
Type Number
Development Jumbos (small) 3 Development Bolters (small) 3 Cable Bolter 1 Transmixers 3 Shotcrete Sprayers 2 Trucks 2 Toyotas 4 Boom Truck 1 Integrated Toolhandler 2 Long Hole Drill 3 Cubex Drill 1 Development LHDs Small 6 Production LHDs Large 2 Production LHDs Small 6 Cassette Truck 1
Over the life of the mine, there will be equipment replacement as indicated in Table 19-4.
The costs for these items are included in sustaining capital.
TABLE 19-4 SUSTAINING CAPITAL U/G EQUIPMENT New Gold Inc. – New Afton Project
Item Qty
Production LHDs - Large 3 Development LHDs Diesel - Small 3 Production LHDs Electrical - Small 9 Trucks 1 Forklift Integrated Toolhandler 6 Long Hole Drill – Solo 1 Shotcrete Sprayers 1 Shotcrete Haulers (Two per sprayer) 3 Scissor Truck 1 Flatbed Truck 2 Crane Truck 1 Light Vehicles 35 Support Equipment 3
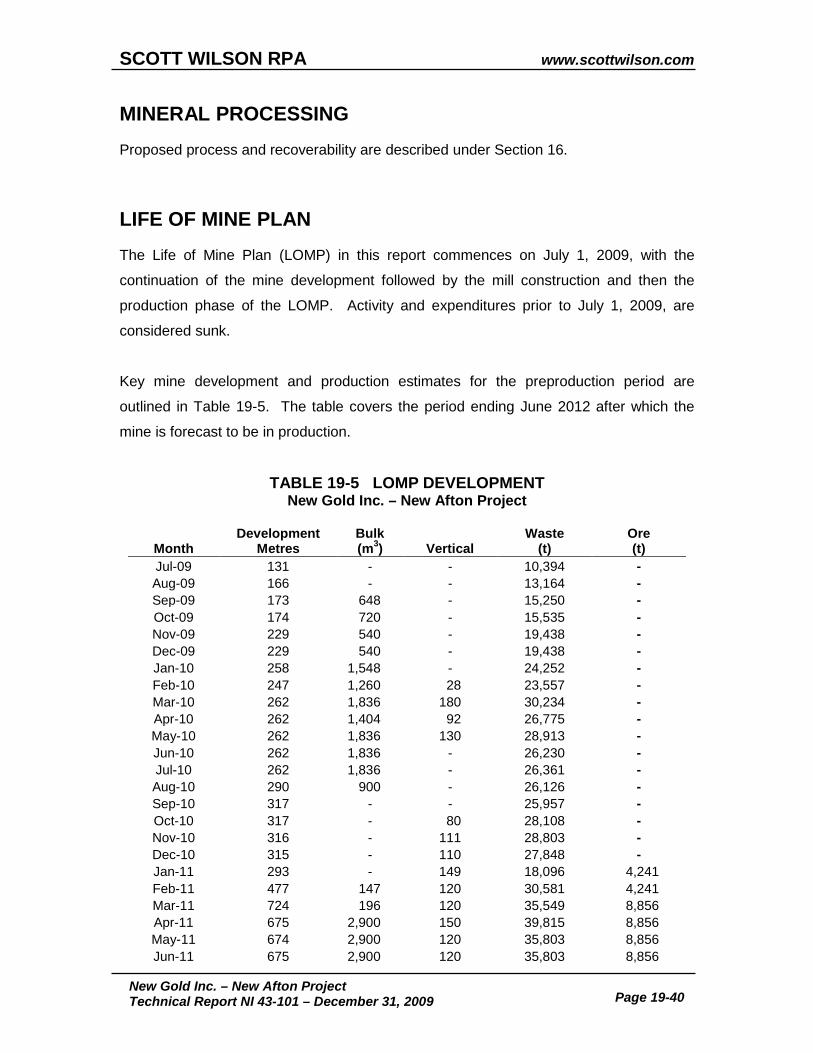
SCOTT WILSON RPA www.scottwilson.com
New Gold Inc. – New Afton Project Technical Report NI 43-101 – December 31, 2009 Page 19-40
MINERAL PROCESSING Proposed process and recoverability are described under Section 16.
LIFE OF MINE PLAN The Life of Mine Plan (LOMP) in this report commences on July 1, 2009, with the
continuation of the mine development followed by the mill construction and then the
production phase of the LOMP. Activity and expenditures prior to July 1, 2009, are
considered sunk.
Key mine development and production estimates for the preproduction period are
outlined in Table 19-5. The table covers the period ending June 2012 after which the
mine is forecast to be in production.
TABLE 19-5 LOMP DEVELOPMENT New Gold Inc. – New Afton Project
Month Development
Metres Bulk (m3) Vertical
Waste (t)
Ore (t)
Jul-09 131 - - 10,394 - Aug-09 166 - - 13,164 - Sep-09 173 648 - 15,250 - Oct-09 174 720 - 15,535 - Nov-09 229 540 - 19,438 - Dec-09 229 540 - 19,438 - Jan-10 258 1,548 - 24,252 - Feb-10 247 1,260 28 23,557 - Mar-10 262 1,836 180 30,234 - Apr-10 262 1,404 92 26,775 - May-10 262 1,836 130 28,913 - Jun-10 262 1,836 - 26,230 - Jul-10 262 1,836 - 26,361 - Aug-10 290 900 - 26,126 - Sep-10 317 - - 25,957 - Oct-10 317 - 80 28,108 - Nov-10 316 - 111 28,803 - Dec-10 315 - 110 27,848 - Jan-11 293 - 149 18,096 4,241 Feb-11 477 147 120 30,581 4,241 Mar-11 724 196 120 35,549 8,856 Apr-11 675 2,900 150 39,815 8,856 May-11 674 2,900 120 35,803 8,856 Jun-11 675 2,900 120 35,803 8,856

SCOTT WILSON RPA www.scottwilson.com
New Gold Inc. – New Afton Project Technical Report NI 43-101 – December 31, 2009 Page 19-41
Month Development
Metres Bulk (m3) Vertical
Waste (t)
Ore (t)
Jul-11 695 1,944 120 34,799 17,018 Aug-11 684 1,944 132 33,137 17,018 Sep-11 696 1,704 120 33,137 17,018 Oct-11 735 - 153 31,559 36,703 Nov-11 741 - 166 32,296 36,703 Dec-11 727 - 140 32,333 36,703 Jan-12 643 - 140 30,521 42,075 Feb-12 566 - 153 23,808 42,075 Mar-12 522 - 37 17,079 42,075 Apr-12 471 - 20 13,081 132,249 May-12 471 - 26 13,424 132,249 Jun-12 471 - 45 13,613 132,249
The annual production and development activity is summarized in Table 19-6. This table
commences in July 2009 and is for annual periods, with only six months in 2009.
TABLE 19-6 LOMP DEVELOPMENT TONNAGE New Gold Inc. – New Afton Project
Year Development
Metres Bulk (m3) Vertical Waste
(t) Ore (t)
2009 1,101 2,448 - 93,220 - 2010 3,371 12,456 731 323,166 205,071 2011 7,799 14,635 1,610 392,907 2,021,904 2012 6,091 - 542 203,216 4,084,882 2013 5,126 - 179 131,482 4,029,197 2014 2,034 - 80 45,628 4,002,627 2016 580 - 17,420 4,000,029 2017 - - - 3,999,979 2018 - - - 3,999,965 2019 93 - 6,936 4,034,421 2020 2,872 219 135,450 4,027,975 2021 2,221 37 52,430 4,000,000 2022 - 4,000,000 2023 - 4,000,000
- 999,690 Totals 31,288 29,539 3,398 1,401,856 47,405,739
The LOMP mill production estimates are shown in Table 19-7.

SCOTT WILSON RPA www.scottwilson.com
New Gold Inc. – New Afton Project Technical Report NI 43-101 – December 31, 2009 Page 19-42
TABLE 19-7 LOM MILL FEED New Gold Inc. – New Afton Project
Year Hypogene
(kt) Mesogene
(kt) Supergene
(kt) Ore Milled
(kt) Cu (%)
Au (g/t)
Ag (g/t)
Hg (ppb)
As (ppm)
2012 2,217 10 - 2,227 0.84 0.74 1.47 412 131 2013 4,011 74 - 4,085 0.86 0.72 1.39 503 162 2014 3,767 262 - 4,029 0.82 0.69 1.66 582 159 2015 3,465 538 - 4,003 0.91 0.77 2.14 886 234 2016 3,242 758 - 4,000 1.07 0.81 2.66 1,330 415 2017 3,327 673 0 4,000 1.17 0.83 2.59 1,150 406 2018 3,423 577 0 4,000 1.12 0.75 2.42 1,057 393 2019 3,363 655 17 4,034 1.14 0.66 2.74 1,248 499 2020 3,207 533 288 4,028 1.04 0.59 2.45 1,236 427 2021 3,406 178 416 4,000 0.95 0.67 1.90 760 205 2022 3,390 98 511 4,000 0.87 0.64 1.71 818 218 2023 3,395 53 553 4,000 0.63 0.46 1.25 751 188
791 12 197 1,000 0.50 0.36 1.04 757 142 Total 41,003 4,421 1,982 47,406 0.95 0.69 2.03 909 289
The recovery of metals and the concentrate production is shown in Tables 19-8 and 19-
9.
TABLE 19-8 LOM METAL RECOVERY New Gold Inc. – New Afton Project
Year Cu (%) Au (%) Ag (%) 2012 76.34 75.47 66.52 2013 89.68 88.37 77.06 2014 88.99 87.55 77.63 2015 89.28 87.25 75.81 2016 90.00 87.85 75.12 2017 90.70 88.34 73.92 2018 90.57 88.55 75.26 2019 90.43 88.70 76.65 2020 87.83 87.09 74.85 2021 86.36 86.93 73.84 2022 84.83 85.94 74.92 2023 81.07 83.56 78.29 2024 74.96 79.12 75.44 Total 87.82 86.74 75.27

SCOTT WILSON RPA www.scottwilson.com
New Gold Inc. – New Afton Project Technical Report NI 43-101 – December 31, 2009 Page 19-43
The average recovery of mercury and arsenic to the concentrate is estimated to be
70.7% and 67.6%, respectively. Recovery for copper, gold, and silver was estimated as
outlined in Section 16, plus a factor of 87% was applied to 2012 recoveries to account
for start-up uncertainty.
TABLE 19-9 CONCENTRATE PRODUCTION New Gold Inc. – New Afton Project
Year Con (dmt)
Con (wmt)
Cu (%)
Au (g/t)
Ag (g/t)
Hg (ppm)
As (%)
2012 61,500 66,848 23.24 20.11 35.42 9,281 2,441 2013 113,071 122,903 28.00 23.00 38.66 12,946 3,507 2014 104,775 113,885 28.00 23.36 49.44 15,767 3,702 2015 116,610 126,750 28.00 23.17 55.70 20,462 5,009 2016 137,390 149,337 28.00 20.73 58.27 26,245 7,964 2017 151,468 164,639 28.00 19.48 50.49 20,651 7,395 2018 145,346 157,985 28.00 18.25 50.05 20,409 7,695 2019 147,879 160,738 28.08 15.94 57.37 24,671 10,042 2020 126,765 137,788 29.07 16.37 58.34 26,516 8,707 2021 111,502 121,198 29.30 21.03 50.24 17,552 4,223 2022 98,664 107,243 29.93 22.24 52.02 21,686 5,042 2023 65,542 71,241 31.06 23.55 59.58 31,706 6,782 2024 11,381 12,370 32.94 25.10 68.82 44,123 7,122 Total 1,391,892 1,512,927 28.32 20.29 52.05 21,165 6,419
MARKETS The New Afton mine’s principal commodities are copper concentrates containing copper
and gold and doré containing gold. The principal commodities are freely traded at prices
that are widely known so that the prospects for the sale of production are virtually
assured.
Copper is a principal metal traded on the London Metal Exchange (LME) and has total
price transparency. Prices are quoted on the LME for Copper Grade A and can be
found at www.lme.com. The average copper price for the first nine months of 2009 was
$2.11 per pound. Current prices as of September 30, 2009, are $2.81 per pound. The
three-year and five-year rolling average prices through the end of September 2009 are
$2.92 and $2.61 per pound, respectively. This Technical Report uses the long-term
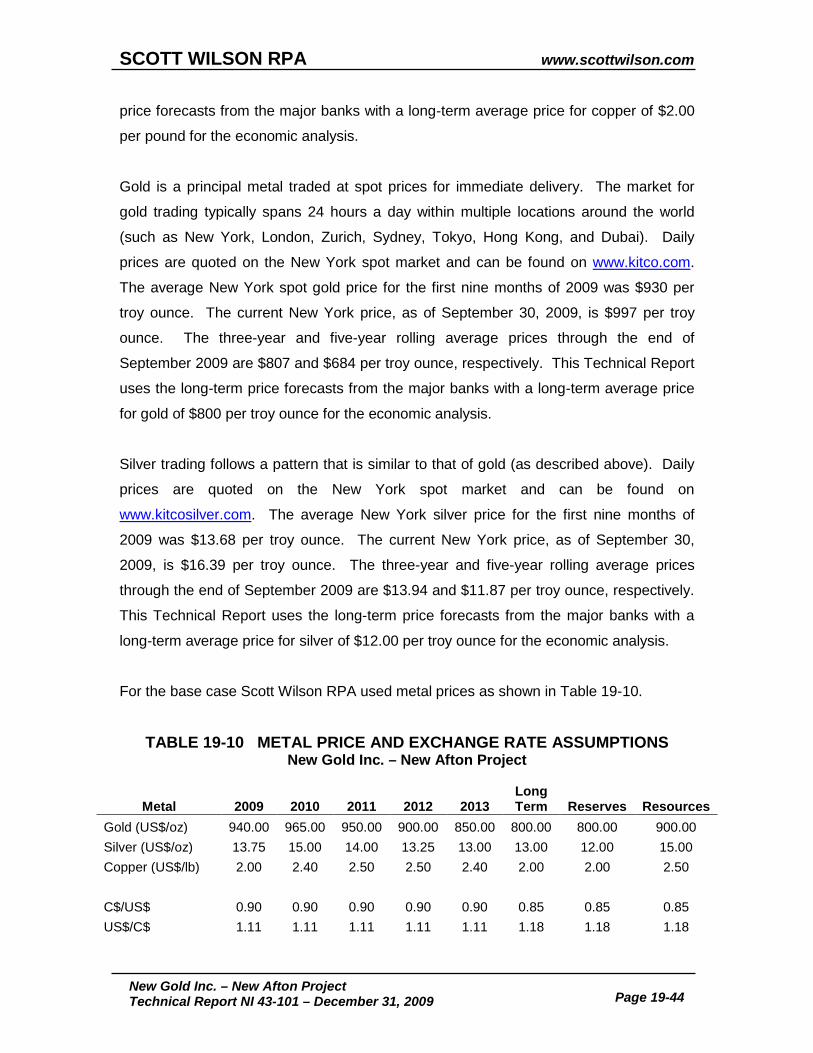
SCOTT WILSON RPA www.scottwilson.com
New Gold Inc. – New Afton Project Technical Report NI 43-101 – December 31, 2009 Page 19-44
price forecasts from the major banks with a long-term average price for copper of $2.00
per pound for the economic analysis.
Gold is a principal metal traded at spot prices for immediate delivery. The market for
gold trading typically spans 24 hours a day within multiple locations around the world
(such as New York, London, Zurich, Sydney, Tokyo, Hong Kong, and Dubai). Daily
prices are quoted on the New York spot market and can be found on www.kitco.com.
The average New York spot gold price for the first nine months of 2009 was $930 per
troy ounce. The current New York price, as of September 30, 2009, is $997 per troy
ounce. The three-year and five-year rolling average prices through the end of
September 2009 are $807 and $684 per troy ounce, respectively. This Technical Report
uses the long-term price forecasts from the major banks with a long-term average price
for gold of $800 per troy ounce for the economic analysis.
Silver trading follows a pattern that is similar to that of gold (as described above). Daily
prices are quoted on the New York spot market and can be found on
www.kitcosilver.com. The average New York silver price for the first nine months of
2009 was $13.68 per troy ounce. The current New York price, as of September 30,
2009, is $16.39 per troy ounce. The three-year and five-year rolling average prices
through the end of September 2009 are $13.94 and $11.87 per troy ounce, respectively.
This Technical Report uses the long-term price forecasts from the major banks with a
long-term average price for silver of $12.00 per troy ounce for the economic analysis.
For the base case Scott Wilson RPA used metal prices as shown in Table 19-10.
TABLE 19-10 METAL PRICE AND EXCHANGE RATE ASSUMPTIONS New Gold Inc. – New Afton Project
Metal 2009 2010 2011 2012 2013 Long Term Reserves Resources
Gold (US$/oz) 940.00 965.00 950.00 900.00 850.00 800.00 800.00 900.00 Silver (US$/oz) 13.75 15.00 14.00 13.25 13.00 13.00 12.00 15.00 Copper (US$/lb) 2.00 2.40 2.50 2.50 2.40 2.00 2.00 2.50
C$/US$ 0.90 0.90 0.90 0.90 0.90 0.85 0.85 0.85 US$/C$ 1.11 1.11 1.11 1.11 1.11 1.18 1.18 1.18
SCOTT WILSON RPA www.scottwilson.com
New Gold Inc. – New Afton Project Technical Report NI 43-101 – December 31, 2009 Page 19-45
CONTRACTS New Afton does not have contracts in place for mining, construction, Engineering,
Procurement and Construction Management (EPCM), operating supplies and reagents,
concentrate shipping or concentrate treatment. Scott Wilson RPA expects that all of
these items can be organized in a timely manner before operations commence. New
Afton does not plan to engage mining contractors for the underground development or
production.
ENVIRONMENTAL CONSIDERATIONS The New Afton Project lies within the Interior Plateau subdivision of south-central British
Columbia. The area’s complex geology, glacial history and continental, semi-arid
climate have given rise to many regional landscapes. The Project area lies at about 720
MASL and drains into Kamloops Lake, the second-largest water body contained in the
Thompson River watershed, a major tributary of the Fraser River. Much of the Project
area has been greatly altered such that natural undulating grasslands formed on till-
covered drumlinoid terrain and interspersed by numerous small, alkaline water bodies
have been replaced by level rock dumps, open pits, and severely compacted borrow
areas. The dominant water bodies are now related to mining-related impoundments.
The baseline environmental studies undertaken considered both the natural and
anthropogenic landscapes. The two primary landscape types are:
• Extensively disturbed areas, reconfigured and/or reclaimed as a result of historic mining activities and infrastructure development; and
• Undisturbed landforms, which are similar to those that existed prior to the development of the New Afton mine, consist of Ponderosa Pine–bunchgrass vegetation interspersed by discontinuous alkaline water bodies and ephemeral drainage altered by grazing land use.
Environmental studies undertaken for the Project included:
a) Climate studies, air quality, meteorology b) Noise c) Emissions analysis d) Surficial geology, topography, terrain and soils e) Surface water quality and quantity
SCOTT WILSON RPA www.scottwilson.com
New Gold Inc. – New Afton Project Technical Report NI 43-101 – December 31, 2009 Page 19-46
f) Groundwater quality and quantity g) Hydrological modelling for water balance management h) Pit Lake bathymetry i) Aquatic resources including fish and fish habitat, wetlands, primary and
secondary producers, physical limnology j) Terrestrial ecosystems and vegetation k) Invasive plants l) Wildlife, including species at risk m) Land status and use n) Land capability o) Archaeology p) Metal leaching and Acid Rock Drainage status and potential
Environmental baseline studies were undertaken on the Project site between April and
December 2006. All baseline studies were implemented in accordance with provincial
data collection guidelines where applicable, and generally accepted scientific
procedures. The objectives and results of baseline studies were reviewed with the
Kamloops Indian Band and Skeetchestn Indian Band in support of project-related
consultations.
PERMITTING On October 31, 2007, the Ministry of Energy, Mines and Petroleum Resources (MEMPR)
issued Mine Permit M229 approving the work system and reclamation program in
respect of the New Afton Project. The Mine Permit obligates the New Gold to post
reclamation security in the aggregate amount of $9.5 million. The initial installment of
$3.5 million was posted by the New Gold pursuant to a Safekeeping Agreement dated
November 6, 2007, between New Gold, Bank of Montreal, and the MEMPR.
In addition to the Mine Permit, a number of permits, consents, and authorizations are
required to develop the Project. Table 19-11 sets out the permits which have been
obtained, permits required by the Province of British Columbia, and permits required by
the Government of Canada.

SCOTT WILSON RPA www.scottwilson.com
New Gold Inc. – New Afton Project Technical Report NI 43-101 – December 31, 2009 Page 19-47
TABLE 19-11 AUTHORIZATIONS AND LICENCES New Gold Inc. – New Afton Project
Government Authorizations, Licences and Permits obtained by New Gold
Act (Authority) Permit Purpose Mines Act (MEMPR)
Mines Act Permit MX 3-217
Issued to the Company Authorizes mineral exploration subject to provisions of Mine Health, Safety and Reclamation Code for Mines S(10).
Mineral Tenure Act (MEMPR)
Mineral Claims Issued to the Company Conveys title to subsurface mineral rights. Annual fee as work commitment or cash in lieu to maintain in good standing. Issued to the Company.
Mining Lease – Tenure Number 546063
Transportation Act (MOTH)
Permit / Licence 1. Authorization to construct a High Voltage (“HV”) line crossing of the Trans-Canada Highway. Will be applied for by B.C. Hydro prior to construction of HV line. This may no longer be required with a potential modification to the alignment of the connecting HV line to the minesite substation. 2. Legal access agreements required over certain lands – Pending; 3. Industrial access permit for the access easement to Afton Mine Road. – Pending. 4. Access permit for the existing service road (water pipeline access) to Trans-Canada Highway.
Environmental Management Act (MOE)
Waste Management Permit (Effluent)
Application by Company pending. Authorizes introduction of waste into the environment (tailings, waste rock), subject to conditions, regulations or Codes of practice.
Waste Management Permit (Sewage)
Application by Company pending (will be included in Effluent Application). Authorizes discharge of sewage into the environment, subject to conditions. Authorizes solid waste storage and disposal subject to conditions.
Waste Management Permit (Air Emissions)
Pre-Application meeting February 14, 2008. Application by Company pending. Authorizes emissions to the air, subject to conditions.
Water Act (MOE) Licence Application by Company pending. (Notice of Intention) Authorizes licensing, storage, diversion and use of
water. (Diversion) Required to secure water withdrawal, e.g.
Kamloops Lake, develop diversion or impoundment structures on lease.
(Use) Issued by Comptroller of Water Rights. Wildlife Act (MOE) Permit (to relocate any
wildlife) Applicability subject to seasonal requirements. Authorizes removal of wildlife to another approved site by qualified individual. Requirement to be assessed for listed amphibians in Pothook Pit, Waste Dump Pond and NW Emergency Pond prior to works.

SCOTT WILSON RPA www.scottwilson.com
New Gold Inc. – New Afton Project Technical Report NI 43-101 – December 31, 2009 Page 19-48
Act (Authority) Permit Purpose No permit is required at present. Requirement to be reviewed prior to construction commencing.
Forest Act (Ministry of Forests)
Licence to Cut Free Use Permit issued October, 2007. Authorizes cutting of Crown timber not exceeding 50 cubic metres
Pipeline Act (OGC)
Permit – Pipeline Regulation
Application by Pembina Pipelines to OGC on behalf of Company – not immediately required. Authorization of work to relocate a section of oil pipeline north of the Afton Pit outside of subsidence zone. Status – pending.
Health Act (MOH – Interior Health Inspector) or Environmental Management Act (MOE)
Industrial Camps Health Regulation Permit or Camp Construction and Operating Permit – Applicable permit will be for water treatment plant.
Application by Company pending. Establishes health and sanitary conditions as per scale of camp and nature of facilities on site. Tied in with SRMDRC 60 - day review and inspection during construction phase. Approval for source and waterworks(domestic water treatment facility) and issuance of operating permit
Fire Services Act Authorization Fuel storage approval; routine, may be subject to inspection.
Agricultural Land Commission Act
Application Agricultural Land Commission approved nonfarm use of Agricultural Land Reserve lands in October, 2007.
Terasen Gas Permit Application by B.C. Hydro on behalf of Company pending. Permit to authorize crossing of natural gas pipeline with overhead HV electrical power line (138 kV).
Integrated Pest Management Act (MOE)
Permit pursuant to S(6) Application by Company pending. Provides authorization to apply chemical treatments for control of noxious weeds.
Explosives Act R.S. C-E15
Licence To authorize an explosives storage magazine. Licence (Explosives Factory)
To authorize the manufacture of explosives on site.
Permit To authorize vehicles used for transportation of explosives.
Radio Communication Act
Radio Licences To establish and operate radio frequencies and related infrastructure.
Atomic Energy Control Act
Radio-Isotope Licence To authorize nuclear devices, such as slurry density flowmeters.
Fisheries Act Section 35 – authorization of works in and about fish habitat.
Permit requirement assessed for water pipeline intake maintenance. Department of Fisheries and Oceans approved conceptual design of works and will issue applicable authorizations when works are to commence.
Notes: MEMPR – Ministry of Energy, Mines and Petroleum Resources; MOTH – Ministry of Transportation and Highways; MOE – Ministry of Environment; OGC – Oil and gas Commission; MOH – Ministry of Health
SOCIOECONOMIC AGREEMENTS Two first nations, the Kamloops Indian Band and the Skeetchestn Indian Band
(collectively, the “Bands”) have asserted aboriginal rights and interests in an area
SCOTT WILSON RPA www.scottwilson.com
New Gold Inc. – New Afton Project Technical Report NI 43-101 – December 31, 2009 Page 19-49
comprising the New Afton Project. Discussions with these Bands commenced in
February 2006. After a number of meetings, information exchanges and discussions,
the Bands and New Gold signed letters of intent in September 2006 which provided
among other things for an exchange of information and continued dialogue between the
parties. Further discussions with the Bands during 2007 and 2008 culminated in the
execution and delivery of a formal agreement between the Bands and New Gold dated
March 20, 2008 (the “Participation Agreement”).
One of the principal objectives of the Participation Agreement is to establish a
cooperative and mutually beneficial working relationship between the Bands and New
Gold with respect to the development and operation of the New Afton Project. The
Participation Agreement provides that the Bands consent to the New Afton Project and
agree not to challenge before a court of law any New Gold interests or permits related to
the Project. New Gold undertakes to provide the Bands with certain economic and
social benefits including preferential hiring, education, training and business
opportunities.
The Participation Agreement contemplates that New Gold will pay to a socioeconomic
trust to be created for the benefit of Band members an amount of $250,000 in 2009.
Thereafter, each year in which commercial production occurs at the mine, an amount of
0.5% NSR, or a minimum of $250,000 a year, shall be paid to the trust, with the
minimum payment to be increased to $500,000 for a given year if copper prices in that
year exceed $2.50 a pound.
After the costs of developing, permitting, constructing, and equipping the mine have
been repaid to New Gold, the payment to the trust will increase to the greater of
$1,000,000 a year, or 1% of NSR in that year. Should copper prices exceed $2.50 a
pound in a given year, this payment will increase to 1.5% of NSR for that year. Should
copper prices exceed $3.00 a pound in a given year, this payment will increase to 2% of
NSR for that year.
The Participation Agreement also grants the Bands a right of first refusal to purchase
that portion of the Afton Surface Rights lying to the north of the Trans-Canada Highway

SCOTT WILSON RPA www.scottwilson.com
New Gold Inc. – New Afton Project Technical Report NI 43-101 – December 31, 2009 Page 19-50
and south of Kamloops Lake in the event New Gold decides to sell these lands in the
future separately and distinctly from the New Afton Project.
DECOMMISSIONING PLAN Information on successful practices for reclamation from past mining operations at the
New Afton site will assist in the design of future reclamation efforts. The New Afton mine
decommissioning process will involve three distinct phases:
• pre-decommissioning • decommissioning • post-decommissioning
The objective for all three phases will be to dispose of fixed machinery and buildings and
to return the site to a condition acceptable to the Chief Inspector of Mines, MEMPR, as
outlined in the Mines Act Permit. This work will be in accordance with the objectives of
Part 10, Health, Safety and Reclamation Code for Mines in British Columbia. The Code
requires that:
• All machinery, equipment, and building superstructures shall be removed;
• Concrete foundations shall be covered and revegetated unless, they have been exempted by the inspector because of demonstrated impracticality;
• All scrap material shall be disposed of in a manner acceptable to the inspector. PRE-DECOMMISSIONING PHASE Decommissioning activities will commence in the final year of mine operations with
establishment of the decommissioning management team and submission of a tailings
decommissioning plan.
DECOMMISSIONING PHASE The decommissioning process will be undertaken by a number of contractors with
special skills or equipment. Those contractors are:
• A mechanical contractor to clean, dismantle and crate process and/or large pieces of mobile equipment;

SCOTT WILSON RPA www.scottwilson.com
New Gold Inc. – New Afton Project Technical Report NI 43-101 – December 31, 2009 Page 19-51
• An electrical contractor to disconnect, remove and crate for sale; controls, cabinets and transformers;
• A civil contractor to dismantle buildings, prepare the tailings dam for shutdown, and remove-tailing lines;
• A civil contractor to reclaim roads and waste dumps; • A scrap dealer to cut up structural steel structures that cannot be sold;
• A crushing plant contractor equipped with a dozer/ripper, drop ball, magnet and
crushing plant to crush the building floor slabs and piers;
• A hydro seeding contractor to revegetate reclaimed areas;
• An auctioneer to sell the process and mobile equipment, buildings and office furniture.
ENVIRONMENTAL MONITORING AND SURVEILLANCE The stockpiles, Pothook pit earth dam, the visibility berm, and the dam slopes will be
monitored for bare spots, slumping, and erosion. Any failures will be rectified. The
stockpiles and the earth dam will be assessed on a monthly basis until the cover is
stabilized and annually until it is required for reclamation. The surface cover of the berm
will be assessed in the spring and fall for erosion. Any areas exhibiting erosion will be
rectified.
The side slopes of the tailings storage facility will not be reclaimed until closure.
However, slopes will be monitored on a monthly basis for water and wind erosion during
operation. Surfaces exhibiting erosion will be amended.
Other reseeded areas such as the pipeline corridor and the access road side slopes will
be monitored for surface erosion and reseeded where required.
POST-CLOSURE MONITORING All reclaimed areas will require monitoring until vegetation is well established. Indicators
of successful reclamation are high vegetative surface coverage and the absence of rills,
gullies, and other erosional features. A soil specialist will be on-site periodically to
provide guidance and make recommendations.
The flat areas will be checked for surface coverage in the spring and fall for the first five
years and annually for the next three years. Any issues related to plant establishment
SCOTT WILSON RPA www.scottwilson.com
New Gold Inc. – New Afton Project Technical Report NI 43-101 – December 31, 2009 Page 19-52
will be rectified. Records of inspection and a description of the conditions will be
recorded on-site.
Reclamation of the TSF will require special attention because of the length of the slopes,
the low fertility of the materials, the fine texture, the absence of soil structure, the
potential for compaction, and the arid climate. Monitoring will be carried out regularly to
ensure that reclamation has been successful. Areas exhibiting surface erosion will be
amended. Records will be kept to assess the changes in percent bare ground or surface
cover as well as plant health.
At closure, a range management plan will be developed for the areas which will be used
for grazing. No animals will be allowed on the site for a minimum of three years to allow
the bunch grasses to spread, establish, and produce seed. Range quality will be
assessed in the spring and fall each year by a qualified professional who will determine
range readiness. Range will be assessed every three years once it is in use to ensure
the range plan is suitable.
All of the land which will be disturbed for the Project will be reclaimed. Traditional use in
the area is cattle grazing on a landscape dominated by grasslands. The final end land
use will be to develop grasslands which will be used for cattle grazing. Rangeland in
British Columbia also includes wildlife use. Therefore, the final reclamation plan will
include wildlife considerations, such as appropriate fencing and the development of
shelter areas for various birds and small animals.
SUMMARY OF AREAS REQUIRING RECLAMATION The stockpiles, Pothook Pit Dam, and the visual berm are classified as temporary
infrastructures. Approximately 112.5 ha of flat surfaces will have received final
reclamation treatment upon closure. As well, the TSF, which comprises 37 ha of surface
and 4.6 ha of access road slopes, will be reclaimed. Therefore, a total surface area of
154.1 ha will have received final reclamation, with the remaining infrastructure treated to
prevent wind and water erosion during the construction and operation of the mine.
CLOSURE COST For the 2007 Feasibility Study, Hatch made preliminary factored estimates of the cost of
removing all equipment from the surface, demolishing the buildings, sealing the
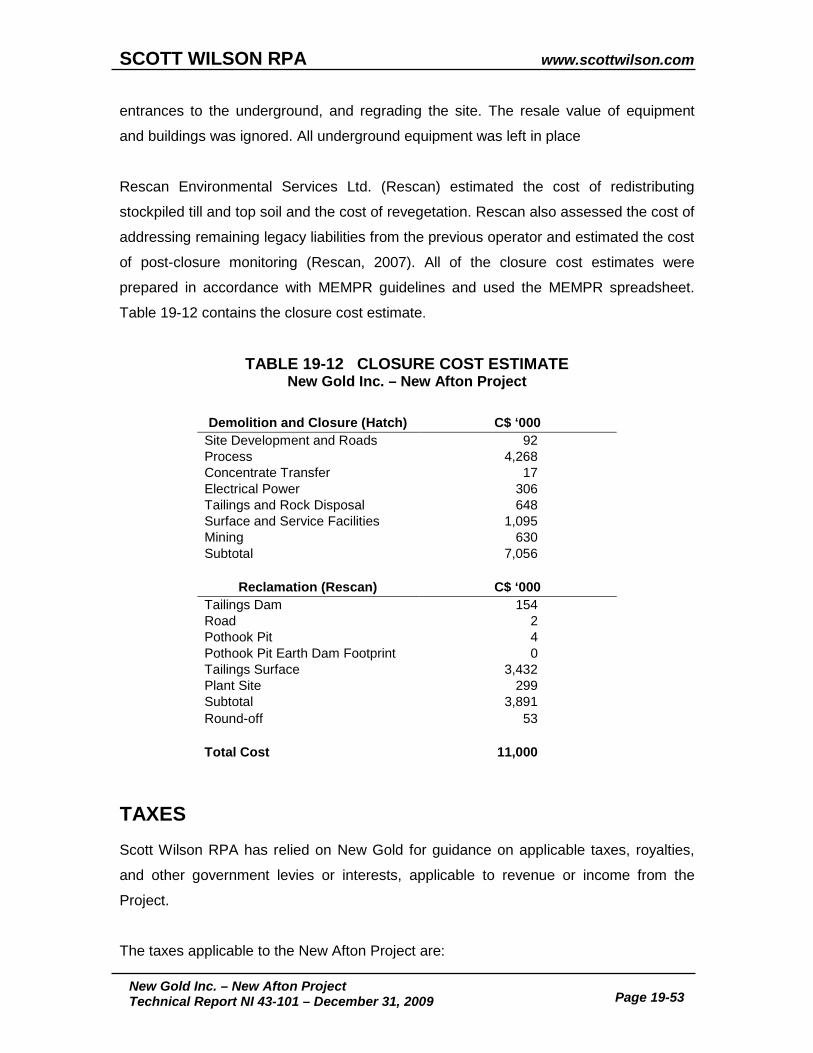
SCOTT WILSON RPA www.scottwilson.com
New Gold Inc. – New Afton Project Technical Report NI 43-101 – December 31, 2009 Page 19-53
entrances to the underground, and regrading the site. The resale value of equipment
and buildings was ignored. All underground equipment was left in place
Rescan Environmental Services Ltd. (Rescan) estimated the cost of redistributing
stockpiled till and top soil and the cost of revegetation. Rescan also assessed the cost of
addressing remaining legacy liabilities from the previous operator and estimated the cost
of post-closure monitoring (Rescan, 2007). All of the closure cost estimates were
prepared in accordance with MEMPR guidelines and used the MEMPR spreadsheet.
Table 19-12 contains the closure cost estimate.
TABLE 19-12 CLOSURE COST ESTIMATE New Gold Inc. – New Afton Project
Demolition and Closure (Hatch) C$ ‘000
Site Development and Roads 92 Process 4,268 Concentrate Transfer 17 Electrical Power 306 Tailings and Rock Disposal 648 Surface and Service Facilities 1,095 Mining 630 Subtotal 7,056
Reclamation (Rescan) C$ ‘000
Tailings Dam 154 Road 2 Pothook Pit 4 Pothook Pit Earth Dam Footprint 0 Tailings Surface 3,432 Plant Site 299 Subtotal 3,891 Round-off 53 Total Cost 11,000
TAXES Scott Wilson RPA has relied on New Gold for guidance on applicable taxes, royalties,
and other government levies or interests, applicable to revenue or income from the
Project.
The taxes applicable to the New Afton Project are:
SCOTT WILSON RPA www.scottwilson.com
New Gold Inc. – New Afton Project Technical Report NI 43-101 – December 31, 2009 Page 19-54
• BC net proceeds tax of 2% • BC revenue tax of 13% • BC income tax at a rate of 11% • Federal income tax at a rate of 15%.
The BC net proceeds tax is taken against the revenue less operating costs including
concentrate treatment and transportation. The agreed royalty to First Nations is not
deductible.
The BC revenue tax is charged on gross proceeds less the cumulative expenditure
account, which is the sum of operating and capital costs, with a 33% premium added to
preproduction capital.
The federal and provincial income taxes are based on income less applicable capital
allowances.
CAPITAL AND OPERATING COST ESTIMATES The preproduction capital budget for the Project is summarized in Table 19-13. The
capital is stated in Q2 2009 Canadian dollars. Sunk costs are not included in the capital
summary. Capital cost estimates have been prepared by AMEC, New Gold, and AMC in
the course of the detailed engineering work which was being done by AMEC until mid-
2009 at which time the activity was essentially put on hold pending final financing. The
cost estimate included sunk costs and Project costs, with over 5,300 line items with cost
estimates for labour materials and contracts. Capital cost estimate revisions and
adjustments continue as Project optimization tasks are still underway. The mine capital
costs are built up from first principles for the mine development activities together with
quotations for major equipment items.
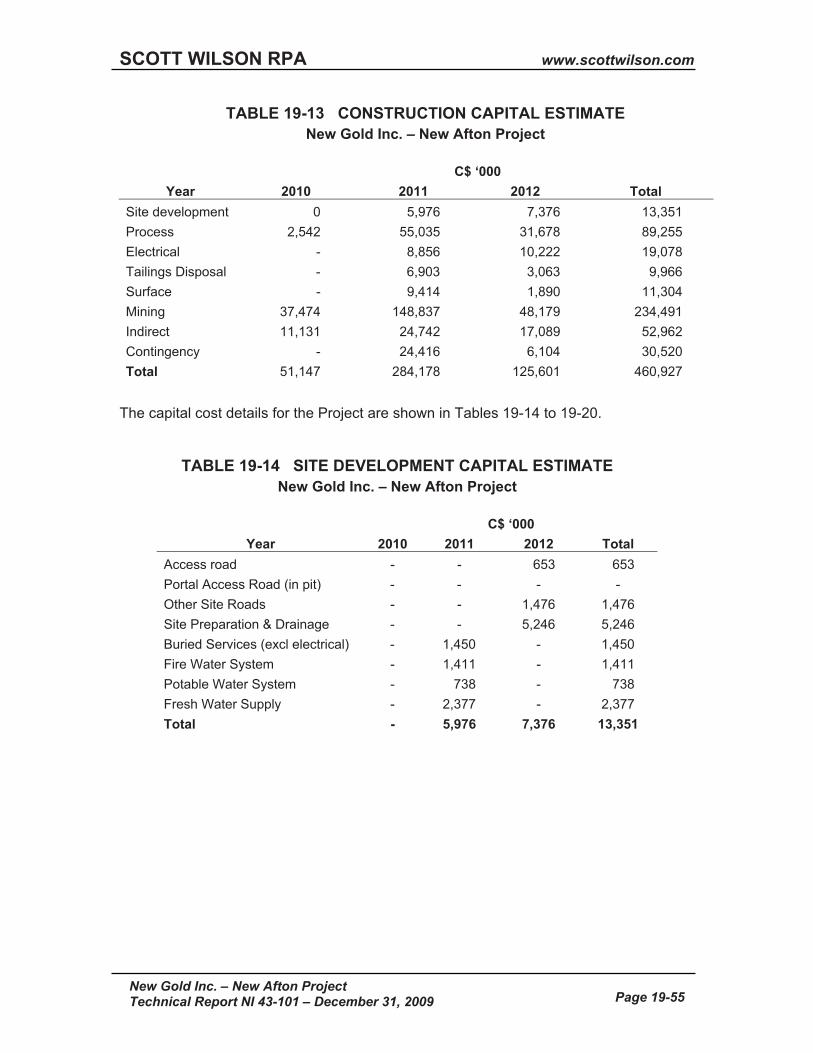
SCOTT WILSON RPA www.scottwilson.com
New Gold Inc. – New Afton Project Technical Report NI 43-101 – December 31, 2009 Page 19-55
TABLE 19-13 CONSTRUCTION CAPITAL ESTIMATE New Gold Inc. – New Afton Project
C$ ‘000 Year 2010 2011 2012 Total
Site development 0 5,976 7,376 13,351 Process 2,542 55,035 31,678 89,255 Electrical - 8,856 10,222 19,078 Tailings Disposal - 6,903 3,063 9,966 Surface - 9,414 1,890 11,304 Mining 37,474 148,837 48,179 234,491 Indirect 11,131 24,742 17,089 52,962 Contingency - 24,416 6,104 30,520 Total 51,147 284,178 125,601 460,927
The capital cost details for the Project are shown in Tables 19-14 to 19-20.
TABLE 19-14 SITE DEVELOPMENT CAPITAL ESTIMATE New Gold Inc. – New Afton Project
C$ ‘000 Year 2010 2011 2012 Total
Access road - - 653 653 Portal Access Road (in pit) - - - - Other Site Roads - - 1,476 1,476 Site Preparation & Drainage - - 5,246 5,246 Buried Services (excl electrical) - 1,450 - 1,450 Fire Water System - 1,411 - 1,411 Potable Water System - 738 - 738 Fresh Water Supply - 2,377 - 2,377 Total - 5,976 7,376 13,351
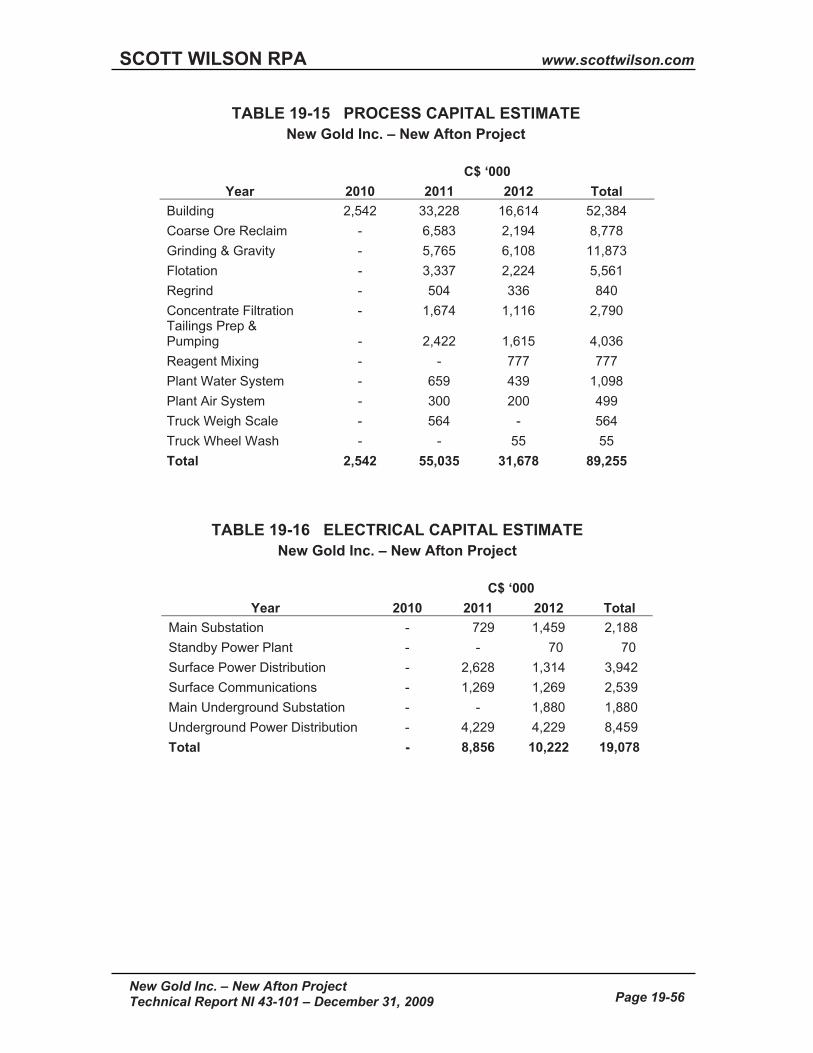
SCOTT WILSON RPA www.scottwilson.com
New Gold Inc. – New Afton Project Technical Report NI 43-101 – December 31, 2009 Page 19-56
TABLE 19-15 PROCESS CAPITAL ESTIMATE New Gold Inc. – New Afton Project
C$ ‘000 Year 2010 2011 2012 Total
Building 2,542 33,228 16,614 52,384 Coarse Ore Reclaim - 6,583 2,194 8,778 Grinding & Gravity - 5,765 6,108 11,873 Flotation - 3,337 2,224 5,561 Regrind - 504 336 840 Concentrate Filtration - 1,674 1,116 2,790 Tailings Prep & Pumping - 2,422 1,615 4,036 Reagent Mixing - - 777 777 Plant Water System - 659 439 1,098 Plant Air System - 300 200 499 Truck Weigh Scale - 564 - 564 Truck Wheel Wash - - 55 55 Total 2,542 55,035 31,678 89,255
TABLE 19-16 ELECTRICAL CAPITAL ESTIMATE New Gold Inc. – New Afton Project
C$ ‘000 Year 2010 2011 2012 Total
Main Substation - 729 1,459 2,188 Standby Power Plant - - 70 70 Surface Power Distribution - 2,628 1,314 3,942 Surface Communications - 1,269 1,269 2,539 Main Underground Substation - - 1,880 1,880 Underground Power Distribution - 4,229 4,229 8,459 Total - 8,856 10,222 19,078

SCOTT WILSON RPA www.scottwilson.com
New Gold Inc. – New Afton Project Technical Report NI 43-101 – December 31, 2009 Page 19-57
TABLE 19-17 TAILINGS CAPITAL ESTIMATE New Gold Inc. – New Afton Project
C$ ‘000 Year 2010 2011 2012 Total
Tailings Earthworks - - 653 653 Tailings Delivery System - 4,691 - 4,691 Water Reclaim System - 2,211 2,211 4,423 Wells & Pumps - - 199 199 Total - 6,903 3,063 9,966
TABLE 19-18 SURFACE SERVICES CAPITAL ESTIMATE New Gold Inc. – New Afton Project
C$ ‘000 Year 2010 2011 2012 Total
Dry and Offices - 1,270 635 1,905 Workshop - 2,605 - 2,605 Laboratory - 1,901 951 2,852 Sewage Plant - 466 - 466 Surface Mobile Equipment - 2,983 - 2,983 Fuel Store - 190 190 379 Security - - 115 115 Dry and Offices - 1,270 635 1,905 Total - 9,414 1,890 11,304
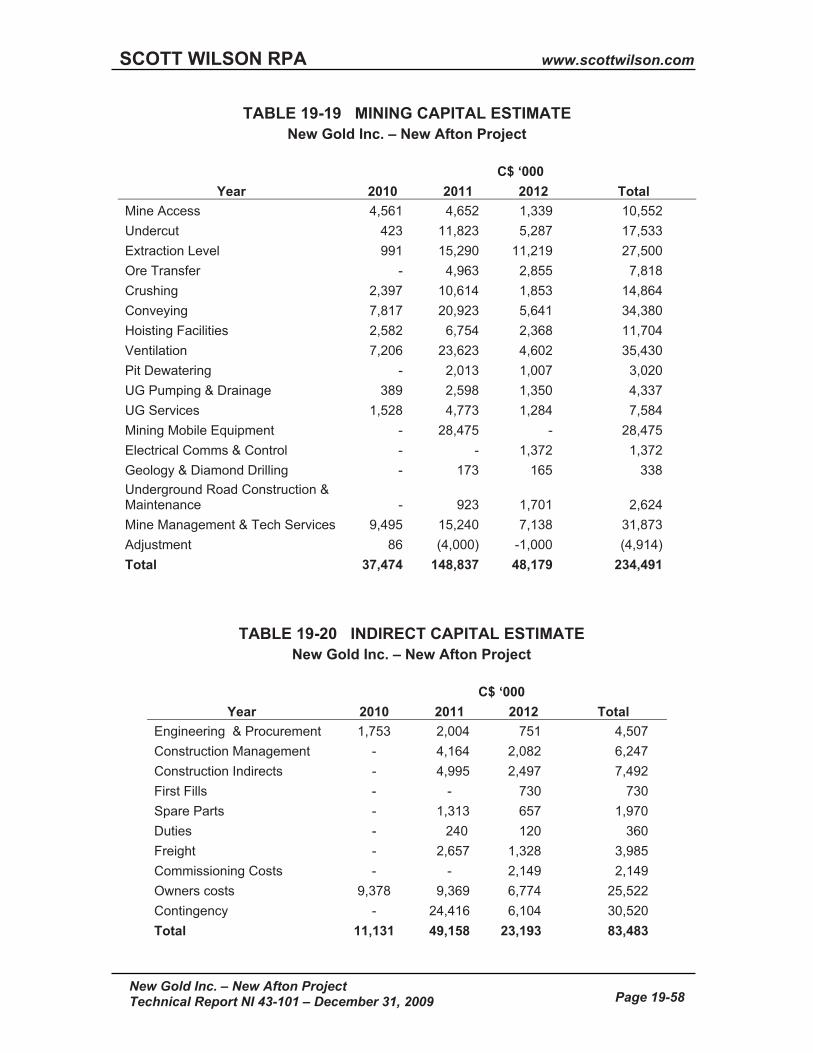
SCOTT WILSON RPA www.scottwilson.com
New Gold Inc. – New Afton Project Technical Report NI 43-101 – December 31, 2009 Page 19-58
TABLE 19-19 MINING CAPITAL ESTIMATE New Gold Inc. – New Afton Project
C$ ‘000 Year 2010 2011 2012 Total
Mine Access 4,561 4,652 1,339 10,552 Undercut 423 11,823 5,287 17,533 Extraction Level 991 15,290 11,219 27,500 Ore Transfer - 4,963 2,855 7,818 Crushing 2,397 10,614 1,853 14,864 Conveying 7,817 20,923 5,641 34,380 Hoisting Facilities 2,582 6,754 2,368 11,704 Ventilation 7,206 23,623 4,602 35,430 Pit Dewatering - 2,013 1,007 3,020 UG Pumping & Drainage 389 2,598 1,350 4,337 UG Services 1,528 4,773 1,284 7,584 Mining Mobile Equipment - 28,475 - 28,475 Electrical Comms & Control - - 1,372 1,372 Geology & Diamond Drilling - 173 165 338 Underground Road Construction & Maintenance - 923 1,701 2,624 Mine Management & Tech Services 9,495 15,240 7,138 31,873 Adjustment 86 (4,000) -1,000 (4,914) Total 37,474 148,837 48,179 234,491
TABLE 19-20 INDIRECT CAPITAL ESTIMATE New Gold Inc. – New Afton Project
C$ ‘000 Year 2010 2011 2012 Total
Engineering & Procurement 1,753 2,004 751 4,507 Construction Management - 4,164 2,082 6,247 Construction Indirects - 4,995 2,497 7,492 First Fills - - 730 730 Spare Parts - 1,313 657 1,970 Duties - 240 120 360 Freight - 2,657 1,328 3,985 Commissioning Costs - - 2,149 2,149 Owners costs 9,378 9,369 6,774 25,522 Contingency - 24,416 6,104 30,520 Total 11,131 49,158 23,193 83,483

SCOTT WILSON RPA www.scottwilson.com
New Gold Inc. – New Afton Project Technical Report NI 43-101 – December 31, 2009 Page 19-59
The following is excluded from the capital cost estimate:
� Project financing and interest charges � Escalation during construction � Any additional civil, concrete work due to the adverse soil condition and
location � Insurance during construction � Taxes � Import duties and custom fees � Cost of geotechnical investigation � Working capital � Sunk costs to December 31, 2009 � Exploration drilling � Costs of fluctuations in currency exchanges � Future expansion � Construction camp � Catering costs
The sustaining capital estimate for the Project is shown in Table 19-21.
TABLE 19-21 SUSTAINING CAPITAL BY AREA New Gold Inc. – New Afton Project
C$ ‘000 Mine Access 2,526 Undercut 28,431 Extraction Level 59,457 Ore Transfer 2,658 Hoisting Facilities 1,052 Ventilation 5,501 Diamond Drilling 4,051 UG Roads & Maintenance 7,637 Equipment and infrastructure 43,532 EPCM 631 Surface Mobile Equipment 4,777 Teck Royalty 12,000 Total Sustaining Capital 172,253

SCOTT WILSON RPA www.scottwilson.com
New Gold Inc. – New Afton Project Technical Report NI 43-101 – December 31, 2009 Page 19-60
TABLE 19-22 ANNUAL SUSTAINING CAPITAL New Gold Inc. – New Afton Project
Year C$ ‘000 2012 39,970 2013 35,881 2014 15,745 2015 24,372 2016 6,057 2017 6,490 2018 3,765 2019 15,256 2020 20,344 2021 3,575 2022 737 2023 62 Total 172,253
TABLE 19-23 ANNUAL SUSTAINING CAPITAL BREAKDOWN New Gold Inc. – New Afton Project
Access
Under- cut
Extrac- tion Xfer Hoist
Venti- lation DD
Ser-vices
Equip-ment EPCM Surface Royalty
2012 6 5,541 9,987 1,420 127 783 162 1,555 20,386 2 2013 8 9,932 18,158 804 167 1,066 321 2,451 1,038 5 1,933
2014 - 3,783 8,954 236 15 139 321 1,396 299 601 - 2015 - 997 6,047 - - - 996 681 2,347 20 1,284 12,000
2016 - - 707 - - - 321 79 4,949 1 - 2017 - - - - - - 321 - 6,083 1 85 2018 332 - 9 - 15 - 321 - 3,039 1 48 2019 2,181 3,645 2,704 197 493 3,449 321 - 1,709 - 557 2020 - 4,533 12,501 - 235 64 321 1,078 933 - 679 2021 - - 392 - - - 321 397 2,380 - 85 2022 - - - - - - 321 - 367 - 48 2023 - - - - - - 5 - - - 57
2,526 28,431 59,457 2,658 1,052 5,501 4,051 7,637 43,532 631 4,777 12,000

SCOTT WILSON RPA www.scottwilson.com
New Gold Inc. – New Afton Project Technical Report NI 43-101 – December 31, 2009 Page 19-61
The property operating costs are shown in Table 19-24. The costs are in Canadian
dollars per tonne of ore milled. The costs do not include concentrate shipping or
treatment, nor do they include corporate overheads. Operating costs have been
compiled by New Gold and AMC. The costs for all areas were built up from first
principles with a high level of detail in the cost build-up.
TABLE 19-24 OPERATING COSTS New Gold Inc. – New Afton Project
C$/Tonne Milled
2012 2013 2014 2015 2016 2017 2018 2019 2020 2021 2022 2023 2024 Total Mine 6.43 7.56 7.15 6.91 6.93 7.12 6.84 6.78 7.09 8.30 8.28 8.25 8.07 7.35 Mill 8.24 7.58 7.59 7.53 7.53 7.53 7.53 7.49 7.49 7.52 7.52 7.52 8.67 7.59
G&A 2.27 2.27 2.32 2.34 2.34 2.34 2.34 2.32 2.32 2.34 2.34 2.34 2.37 2.33 Total Cost 16.94 17.41 17.06 16.78 16.80 16.98 16.71 16.59 16.91 18.16 18.14 18.12 19.10 17.27
The site manpower is shown in Table 19-25. Note that the manpower levels are shown
at the end of specific quarters when significant changes in manpower are planned to
occur. The levels in this table include the owner’s team and underground development
personnel, but not the construction force that will be required for underground and
surface construction of the major facilities.
TABLE 19-25 MANPOWER New Gold Inc. – New Afton Project
2009 2010 2011 2012 2013 2014 2015 2016 2017 2018 2019 2020 2021 2022 2023 2024
Underground 64 71 271 263 194 144 116 140 172 172 130 130 130 130 121 130
Technical 11 11 23 23 19 16 16 15 15 15 16 15 15 13 12 12
Processing 8 9 12 74 80 80 80 80 80 80 80 80 80 80 80 80
G&A 20 23 23 23 23 23 23 23 23 23 23 23 23 23 23 23
Total 103 114 329 383 316 263 235 258 290 290 249 248 248 246 236 245
Management indicates that mine labour productivity has been adjusted for periods prior
to any significant changes in activity to account for training and recruiting.
SCOTT WILSON RPA www.scottwilson.com
New Gold Inc. – New Afton Project Technical Report NI 43-101 – December 31, 2009 Page 19-62
PROJECT EXECUTION PLAN Development of the New Afton Project is underway, with the underground development
being undertaken by company crews. A Project team is in place with administrative,
technical (geology, mine and mill) and mine development personnel on staff. There are
also engineering consultants supporting the group.
The current Project schedule is not in a finished form, this is an aspect of the Project
planning which Scott Wilson RPA recommends be addressed to generate a
comprehensive Project development schedule including all of the changes in the Project
since the 2007 Feasibility Study. The change in the production rate will have changed
the tailings requirements and the faster mining rate may have impacted on the timing of
the replacement access for the exploration access drift. At this time, the mine
development is clearly the critical path activity.
At the time of the site visit, mine development was underway, the mill building had been
erected, and the grinding mills were mechanically installed. Clearing and development
of the TSF had commenced and the dewatering of the Afton pit to the Pothook pit was
underway.
Mine development is scheduled to continue until and after the commencement of
production. The development of the B3 zone has been deferred to reduce the upfront
capital costs. Mill construction is forecast to recommence at the start of 2011, with the
mill planned to be in commissioning mode in Q2 of 2012 and operating at the start of Q3
2012.
New Gold will continue to use AMEC for engineering and procurement, but will do
construction management for the remaining mill construction packages with its own
team, led by a recently hired construction manager.
ECONOMIC ANALYSIS A Cash Flow Projection has been generated from the Life of Mine production schedule
and capital and operating cost estimates, and is summarized in Table 19-26. A
summary of the key criteria is provided below.
SCOTT WILSON RPA www.scottwilson.com
New Gold Inc. – New Afton Project Technical Report NI 43-101 – December 31, 2009 Page 19-63
ECONOMIC CRITERIA REVENUE
� 4 Mpta mining from underground
� Mill recovery by zone, as indicated by testwork, averaging 87.8%.
� Exchange rate US$1.00 = C$0.85.
� Metal prices as shown in Table 19-10.
� Net Smelter Return includes smelting, refining, transport, and penalty treatment costs.
� Revenue is recognized at the time of mill production,
COSTS � Pre-production period: 30 months (January 2010to July 2012).
� Mine life: 12 years.
� Life of Mine production plan as summarized in Tables 19-5 to 19-7.
� Pre-production capital C$460.9 million.
� Average operating cost over the mine life is $17.27 per tonne milled.

2010 2011 2012 2013 2014 2015 2016 2017 2018 2019 2020 2021 2022 2023 2024 2025 TotalPRODUCTION Mill Feed tonnes 000 2,227 4,085 4,029 4,003 4,000 4,000 4,000 4,034 4,028 4,000 4,000 4,000 1,000 47,406
Copper grade % 0.84 0.86 0.82 0.91 1.07 1.17 1.12 1.14 1.04 0.95 0.87 0.63 0.50 0.95 Gold grade g/t 0.74 0.72 0.69 0.77 0.81 0.83 0.75 0.66 0.59 0.67 0.64 0.46 0.36 0.69 Silver Grade g/t 1.47 1.39 1.66 2.14 2.66 2.59 2.42 2.74 2.45 1.90 1.71 1.25 1.04 2.03
Contained Copper tonnes 18,721 35,304 32,965 36,570 42,745 46,758 44,934 45,921 41,956 37,832 34,816 25,113 5,000 448,636Contained Gold kg 1,639 2,943 2,796 3,097 3,242 3,339 2,995 2,657 2,382 2,697 2,553 1,847 361 32,549Contained silver kg 3,275 5,673 6,673 8,568 10,657 10,345 9,667 11,068 9,880 7,586 6,851 4,988 1,038 96,269
Copper recovery % 76.34 89.68 88.99 89.28 90.00 90.70 90.57 90.43 87.83 86.36 84.83 81.07 74.96 87.87 Copper Con grade % 23.24 28.00 28.00 28.00 28.00 28.00 28.00 28.08 29.07 29.30 29.93 31.06 32.94 28.32%Copper con tonnes t 61,500 113,071 104,775 116,610 137,390 151,468 145,346 147,879 126,765 111,502 98,664 65,542 11,381 1,391,892 Contained Cu t 14,293 31,660 29,337 32,651 38,469 42,411 40,698 41,527 36,851 32,671 29,533 20,358 3,748 394,208 Arsenic grade % 0.24 0.35 0.37 0.50 0.80 0.74 0.77 1.00 0.87 0.42 0.50 0.68 0.71 0.64 Mercury grade ppm 9 13 16 20 26 21 20 25 27 18 22 32 44 21.17
Gold recovery % 75.47 88.37 87.55 87.25 87.85 88.34 88.55 88.70 87.09 86.93 85.94 83.56 79.12 0.86753415Recovered gold kg 1,237 2,601 2,448 2,702 2,848 2,950 2,652 2,357 2,075 2,345 2,194 1,543 286 28,237Con gold grade g/t 20.1 23.0 23.4 23.2 20.7 19.5 18.2 15.9 16.4 21.0 22.2 23.5 25.1 20.3
Silver Recovery % 66.52 77.06 77.63 75.81 75.12 73.92 75.26 76.65 74.85 73.84 74.92 78.29 75.44 0.7526279Recovered silver kg 2,178 4,372 5,180 6,495 8,006 7,647 7,275 8,484 7,395 5,602 5,133 3,905 783 72,454Con silver grade g/t 35.42 38.66 49.44 55.70 58.27 50.49 50.05 57.37 58.34 50.24 52.02 59.58 68.82 52.05
Con moisture 0.08Con Weight (wet) t 66,848 122,903 113,885 126,750 149,337 164,639 157,985 160,738 137,788 121,198 107,243 71,241 12,370 1,512,927
REVENUEPayable copper t 13,678 30,529 28,289 31,485 37,095 40,896 39,244 40,049 35,562 31,527 28,500 19,646 3,617 380,116 payable gold kg 1,206 2,536 2,387 2,634 2,777 2,861 2,573 2,286 2,013 2,286 2,139 1,505 279 27,481payable silver kg 1,960 3,934 4,662 5,846 7,205 6,883 6,547 7,636 6,656 5,041 4,619 3,514 705 65,209Metal price - NG use 1, other 0 1Copper price USD/lb 2.50 2.40 2.00 2.00 2.00 2.00 2.00 2.00 2.00 2.00 2.00 2.00 2.00 2.05 Gold price USD/oz 900.00 850.00 800.00 800.00 800.00 800.00 800.00 800.00 800.00 800.00 800.00 800.00 800.00 809.00 Silver price USD/oz 13.25 13.00 13.00 13.00 13.00 13.00 13.00 13.00 13.00 13.00 13.00 13.00 13.00 13.01 Exchange C:US 0.90 0.90 0.90 0.90 0.85 0.85 0.85 0.85 0.85 0.85 0.85 0.85 0.85 0.85 0.85 0.85 0.86
Copper revenue US$000 75,385 161,531 124,733 138,822 163,561 180,320 173,037 176,582 156,798 139,010 125,661 86,623 15,948 1,718,008Gold revenue US$000 34,893 69,299 61,392 67,760 71,423 73,600 66,167 58,803 51,767 58,800 55,026 38,703 7,164 714,800Silver revenue US$000 835 1,644 1,949 2,443 3,012 2,877 2,737 3,191 2,782 2,107 1,931 1,469 295 27,271Revenue US$000 111,113 232,475 188,073 209,025 237,995 256,797 241,940 238,577 211,347 199,917 182,618 126,795 23,407 2,460,079Losses in transit 0.30% 0.30% 0.30% 0.30% 0.30% 0.30% 0.30% 0.30% 0.30% 0.30% 0.30% 0.30% 0.30% 0.30%Rev after losses US$000 110,779 231,777 187,509 208,398 237,281 256,026 241,215 237,861 210,713 199,317 182,070 126,415 23,337 - 2,452,699
Treatment charge US$000 5,043 9,272 8,592 9,562 11,266 12,420 11,918 12,126 10,395 9,143 8,090 5,374 933 - 114,135Refining charge US$000 2,473 5,519 5,114 5,692 6,706 7,393 7,094 7,240 6,429 5,699 5,152 3,552 654 - 68,716Price participationArsenic penalty US$000 901 2,379 2,327 3,505 6,565 6,721 6,710 8,910 6,622 2,825 2,985 2,667 486 53,604Mercury penalty US$000 - 67 121 244 446 323 303 434 419 168 231 285 78 3,117Gold refining US$000 233 489 460 508 536 552 496 441 388 441 413 290 54 - 5,301Silver refining US$000 22 44 52 66 81 77 74 86 75 57 52 40 8 - 734
TransportationOcean Freight US$000 3,677 6,760 6,264 6,971 8,214 9,055 8,689 8,841 7,578 6,666 5,898 3,918 680 - 83,211Terminal Cost US$000 1,685 3,097 2,710 3,017 3,554 3,918 3,760 3,826 3,279 2,885 2,552 1,696 294 - 36,273Truck Transportation US$000 1,955 3,595 3,146 3,501 4,125 4,548 4,364 4,440 3,806 3,348 2,963 1,968 342 - 42,103
Supervision and Assaying (Umpires US$000 62 113 105 117 137 151 145 148 127 112 99 66 11 - 1,392Marine Insurance Costs US$000 111 232 188 209 238 257 242 239 211 200 183 127 23 - 2,460Charterer's Liability Insurance US$000 31 57 52 58 69 76 73 74 63 56 49 33 6 - 696
Total Costs US$000 16,191 31,624 29,132 33,450 41,938 45,492 43,869 46,804 39,393 31,599 28,666 20,014 3,570 - 411,743
NSR US$000 94,588 200,153 158,376 174,949 195,344 210,534 197,345 191,058 171,319 167,718 153,403 106,401 19,767 - 2,040,956NSR C$000 105,098 222,393 186,325 205,822 229,816 247,687 232,171 224,774 201,552 197,315 180,475 125,177 23,256 2,381,860
NSR/tonne ore C$/t 47.19 54.44 46.24 51.42 57.45 61.92 58.04 55.71 50.04 49.33 45.12 31.29 23.26 50.24 NSR/lb Cu USD/lb 3.14 2.97 2.54 2.52 2.39 2.34 2.28 2.16 2.19 2.41 2.44 2.46 2.48 2.44
New Gold Inc. – New Afton ProjectTABLE 19-26 AFTER-TAX CASH FLOW
SCO
TT WILSO
N R
PA
ww
w.scottw
ilson.com
N
ew G
old Inc. – New
Afton Project
Technical Report N
I 43-101 – Decem
ber 31, 2009 Page 19-64
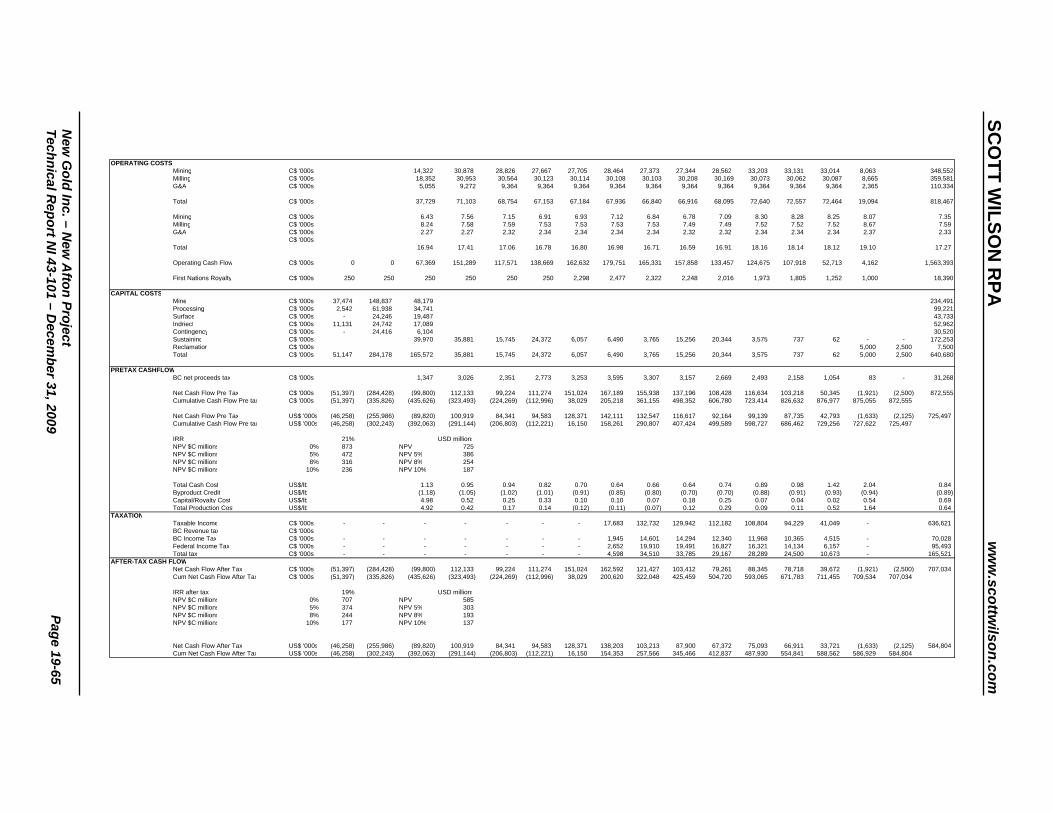
OPERATING COSTSMining C$ '000s 14,322 30,878 28,826 27,667 27,705 28,464 27,373 27,344 28,562 33,203 33,131 33,014 8,063 348,552Milling C$ '000s 18,352 30,953 30,564 30,123 30,114 30,108 30,103 30,208 30,169 30,073 30,062 30,087 8,665 359,581G&A C$ '000s 5,055 9,272 9,364 9,364 9,364 9,364 9,364 9,364 9,364 9,364 9,364 9,364 2,365 110,334
Total C$ '000s 37,729 71,103 68,754 67,153 67,184 67,936 66,840 66,916 68,095 72,640 72,557 72,464 19,094 818,467
Mining C$ '000s 6.43 7.56 7.15 6.91 6.93 7.12 6.84 6.78 7.09 8.30 8.28 8.25 8.07 7.35 Milling C$ '000s 8.24 7.58 7.59 7.53 7.53 7.53 7.53 7.49 7.49 7.52 7.52 7.52 8.67 7.59 G&A C$ '000s 2.27 2.27 2.32 2.34 2.34 2.34 2.34 2.32 2.32 2.34 2.34 2.34 2.37 2.33
C$ '000sTotal 16.94 17.41 17.06 16.78 16.80 16.98 16.71 16.59 16.91 18.16 18.14 18.12 19.10 17.27
Operating Cash Flow C$ '000s 0 0 67,369 151,289 117,571 138,669 162,632 179,751 165,331 157,858 133,457 124,675 107,918 52,713 4,162 1,563,393
First Nations Royalty C$ '000s 250 250 250 250 250 250 2,298 2,477 2,322 2,248 2,016 1,973 1,805 1,252 1,000 18,390
CAPITAL COSTSMine C$ '000s 37,474 148,837 48,179 234,491Processing C$ '000s 2,542 61,938 34,741 99,221Surface C$ '000s - 24,246 19,487 43,733Indriect C$ '000s 11,131 24,742 17,089 52,962Contingency C$ '000s - 24,416 6,104 30,520Sustaining C$ '000s 39,970 35,881 15,745 24,372 6,057 6,490 3,765 15,256 20,344 3,575 737 62 - - 172,253Reclamation C$ '000s 5,000 2,500 7,500Total C$ '000s 51,147 284,178 165,572 35,881 15,745 24,372 6,057 6,490 3,765 15,256 20,344 3,575 737 62 5,000 2,500 640,680
PRETAX CASHFLOWBC net proceeds tax C$ '000s 1,347 3,026 2,351 2,773 3,253 3,595 3,307 3,157 2,669 2,493 2,158 1,054 83 - 31,268
Net Cash Flow Pre Tax C$ '000s (51,397) (284,428) (99,800) 112,133 99,224 111,274 151,024 167,189 155,938 137,196 108,428 116,634 103,218 50,345 (1,921) (2,500) 872,555Cumulative Cash Flow Pre tax C$ '000s (51,397) (335,826) (435,626) (323,493) (224,269) (112,996) 38,029 205,218 361,155 498,352 606,780 723,414 826,632 876,977 875,055 872,555
Net Cash Flow Pre Tax US$ '000s (46,258) (255,986) (89,820) 100,919 84,341 94,583 128,371 142,111 132,547 116,617 92,164 99,139 87,735 42,793 (1,633) (2,125) 725,497 Cumulative Cash Flow Pre tax US$ '000s (46,258) (302,243) (392,063) (291,144) (206,803) (112,221) 16,150 158,261 290,807 407,424 499,589 598,727 686,462 729,256 727,622 725,497
IRR 21% USD millionsNPV $C millions 0% 873 NPV 725 NPV $C millions 5% 472 NPV 5% 386 NPV $C millions 8% 316 NPV 8% 254 NPV $C millions 10% 236 NPV 10% 187
Total Cash Cost US$/lb 1.13 0.95 0.94 0.82 0.70 0.64 0.66 0.64 0.74 0.89 0.98 1.42 2.04 0.84 Byproduct Credit US$/lb (1.18) (1.05) (1.02) (1.01) (0.91) (0.85) (0.80) (0.70) (0.70) (0.88) (0.91) (0.93) (0.94) (0.89) Capital/Royalty Cost US$/lb 4.98 0.52 0.25 0.33 0.10 0.10 0.07 0.18 0.25 0.07 0.04 0.02 0.54 0.69 Total Production Cost US$/lb 4.92 0.42 0.17 0.14 (0.12) (0.11) (0.07) 0.12 0.29 0.09 0.11 0.52 1.64 0.64
TAXATIONTaxable Income C$ '000s - - - - - - - 17,683 132,732 129,942 112,182 108,804 94,229 41,049 - 636,621 BC Revenue tax C$ '000sBC Income Tax C$ '000s - - - - - - - 1,945 14,601 14,294 12,340 11,968 10,365 4,515 - 70,028 Federal Income Tax C$ '000s - - - - - - - 2,652 19,910 19,491 16,827 16,321 14,134 6,157 - 95,493 Total tax C$ '000s - - - - - - - 4,598 34,510 33,785 29,167 28,289 24,500 10,673 - 165,521
AFTER-TAX CASH FLOWNet Cash Flow After Tax C$ '000s (51,397) (284,428) (99,800) 112,133 99,224 111,274 151,024 162,592 121,427 103,412 79,261 88,345 78,718 39,672 (1,921) (2,500) 707,034 Cum Net Cash Flow After Tax C$ '000s (51,397) (335,826) (435,626) (323,493) (224,269) (112,996) 38,029 200,620 322,048 425,459 504,720 593,065 671,783 711,455 709,534 707,034
IRR after tax 19% USD millionsNPV $C millions 0% 707 NPV 585 NPV $C millions 5% 374 NPV 5% 303 NPV $C millions 8% 244 NPV 8% 193 NPV $C millions 10% 177 NPV 10% 137
Net Cash Flow After Tax US$ '000s (46,258) (255,986) (89,820) 100,919 84,341 94,583 128,371 138,203 103,213 87,900 67,372 75,093 66,911 33,721 (1,633) (2,125) 584,804 Cum Net Cash Flow After Tax US$ '000s (46,258) (302,243) (392,063) (291,144) (206,803) (112,221) 16,150 154,353 257,566 345,466 412,837 487,930 554,841 588,562 586,929 584,804
SCO
TT WILSO
N R
PA
ww
w.scottw
ilson.com
N
ew G
old Inc. – New
Afton Project
Technical Report N
I 43-101 – Decem
ber 31, 2009 Page 19-65
SCOTT WILSON RPA www.scottwilson.com
New Gold Inc. – New Afton Project Technical Report NI 43-101 – December 31, 2009 Page 19-66
CASH FLOW ANALYSIS Considering the Project on a stand-alone basis, the undiscounted after tax cash flow
totals C$707 million over the mine life, and simple payback occurs after approximately
4.5 years.
The Total Cash Cost is US$0.84 per pound of copper. The mine life capital unit cost is
US$0.69 per pound of copper and the byproduct credits are US$0.89 per pound of
copper, for a Total Production Cost of US$0.64 per pound of copper. Average annual
production during operation is 72 M pounds of copper and 76,000 ounces of gold.
The after tax NPV at a 5% discount rate is C$374 million, and the IRR is 19%.
SENSITIVITY ANALYSIS Project risks can be identified in both economic and non-economic terms. Key economic
risks were examined by running cash flow sensitivities:
� Metal prices � Operating costs (Total Cash Cost) � Capital costs
The 5% NPV after tax sensitivity over the base case has been calculated for -20% to
+20% variations. The sensitivities are shown in Figure 19-13 and Table 19-27. The
Project is most sensitive to metal price and less sensitive to capital and operating costs,
which are almost equally sensitive.

SCOTT WILSON RPA www.scottwilson.com
New Gold Inc. – New Afton Project Technical Report NI 43-101 – December 31, 2009 Page 19-67
FIGURE 19-13 SENSITIVITY ANALYSIS
TABLE 19-27 SENSITIVITY ANALYSES New Gold Inc. – New Afton Project
Sensitivity to Metal Price
Cu US$/lb NPV @ 0%
millions NPV @ 5%
millions NPV @ 8%
millions 1.64 302 104 28 1.85 505 239 136 2.05 707 374 244 2.26 910 510 353 2.46 1,112 644 460
Sensitivity to Operating Cost
$/tonne NPV @ 0%
millions NPV @ 5%
millions NPV @ 8%
millions 13.81 825 452 306 15.54 766 413 275 17.27 707 374 244 18.99 648 336 213 20.72 591 298 184
Sensitivity to Capital Cost
$ Millions NPV @ 0%
millions NPV @ 5%
millions NPV @ 8%
millions 513 835 484 345 577 771 429 295 641 707 374 244 705 645 321 195 769 581 266 145
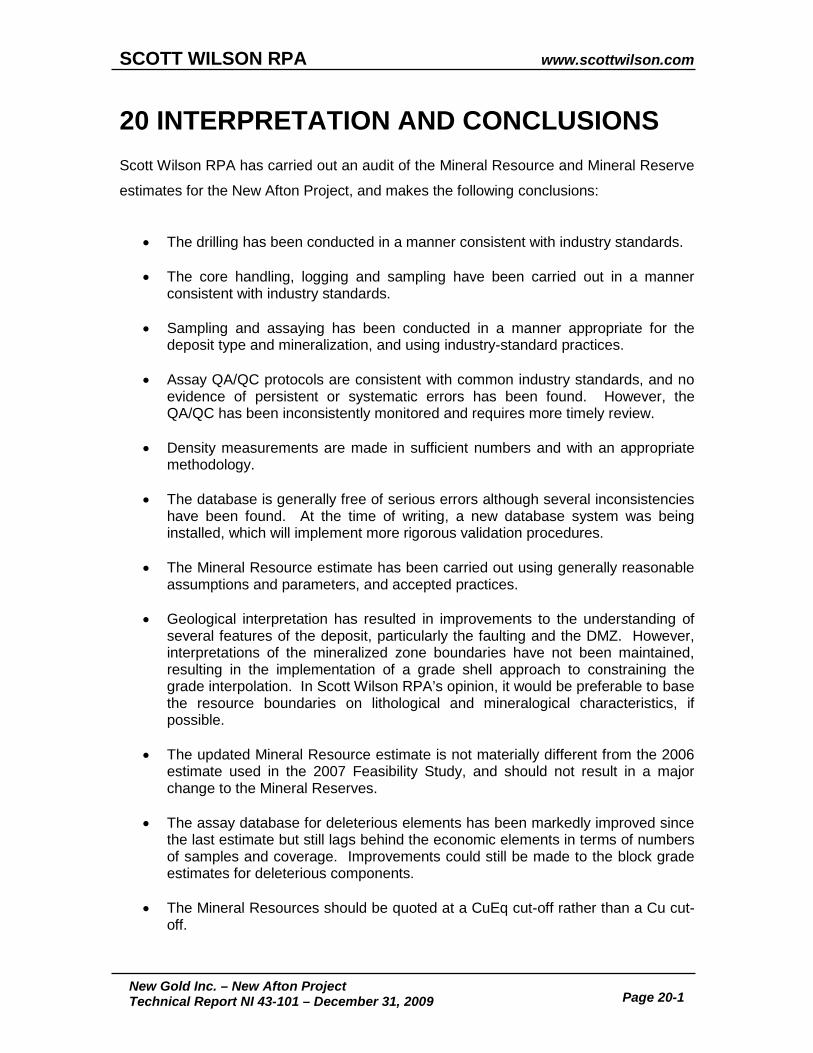
SCOTT WILSON RPA www.scottwilson.com
New Gold Inc. – New Afton Project Technical Report NI 43-101 – December 31, 2009 Page 20-1
20 INTERPRETATION AND CONCLUSIONS Scott Wilson RPA has carried out an audit of the Mineral Resource and Mineral Reserve
estimates for the New Afton Project, and makes the following conclusions:
• The drilling has been conducted in a manner consistent with industry standards.
• The core handling, logging and sampling have been carried out in a manner consistent with industry standards.
• Sampling and assaying has been conducted in a manner appropriate for the deposit type and mineralization, and using industry-standard practices.
• Assay QA/QC protocols are consistent with common industry standards, and no evidence of persistent or systematic errors has been found. However, the QA/QC has been inconsistently monitored and requires more timely review.
• Density measurements are made in sufficient numbers and with an appropriate methodology.
• The database is generally free of serious errors although several inconsistencies have been found. At the time of writing, a new database system was being installed, which will implement more rigorous validation procedures.
• The Mineral Resource estimate has been carried out using generally reasonable assumptions and parameters, and accepted practices.
• Geological interpretation has resulted in improvements to the understanding of several features of the deposit, particularly the faulting and the DMZ. However, interpretations of the mineralized zone boundaries have not been maintained, resulting in the implementation of a grade shell approach to constraining the grade interpolation. In Scott Wilson RPA’s opinion, it would be preferable to base the resource boundaries on lithological and mineralogical characteristics, if possible.
• The updated Mineral Resource estimate is not materially different from the 2006 estimate used in the 2007 Feasibility Study, and should not result in a major change to the Mineral Reserves.
• The assay database for deleterious elements has been markedly improved since the last estimate but still lags behind the economic elements in terms of numbers of samples and coverage. Improvements could still be made to the block grade estimates for deleterious components.
• The Mineral Resources should be quoted at a CuEq cut-off rather than a Cu cut-off.

SCOTT WILSON RPA www.scottwilson.com
New Gold Inc. – New Afton Project Technical Report NI 43-101 – December 31, 2009 Page 20-2
The Mineral Reserve is estimated to be 47.4 million tonnes of Probable Mineral Reserves grading 0.95% Cu, 0.69 g/t Au, and 2.03 g/t Ag.
The Mineral Reserves are considered to be amenable to underground mining through the use of block caving at a production rate of 4 Mtpa of ore.
The preproduction capital cost is estimated to be C$460.9 million plus sustaining capital of $172.3 million and not including sunk expenditures.
The estimated LOM operating cost is $17.27 per tonne milled.
Considering the Project on a stand-alone basis, the undiscounted after-tax cash flow totals C$707 million over the mine life, and simple payback occurs after approximately 4.5 years after the commencement of production.
The Total Cash Cost is US$0.84 per pound of copper. The mine life capital unit cost is US$0.69 per pound of copper and the byproduct credits are US$0.89 per pound of copper, for a Total Production Cost of US$0.64 per pound of copper. Average annual production during operation is 72 million pounds of copper and 76,000 ounces of gold.
The after-tax NPV at a 5% discount rate is C$374 million, and the IRR is 19%.

SCOTT WILSON RPA www.scottwilson.com
New Gold Inc. – New Afton Project Technical Report NI 43-101 – December 31, 2009 Page 21-1
21 RECOMMENDATIONS Scott Wilson RPA makes the following recommendations:
Based upon the assumptions and estimates within this study, the continued development of the Project is recommended.
Database validation protocols should be enhanced and rigorously observed.
Geological interpretation and wireframing should continue with focus on the ore zones, in order to improve the constraints to the grade interpolations. If possible, the grade shell should be replaced by wireframes based on geological characteristics.
The Mineral Resource estimate should be quoted at a 0.4% CuEq cut-off. Changing the cut-off does not materially affect the Mineral Reserves.
Analytical work on the deleterious elements should continue in order to allow improvements to be made to the block models for these components.
The review of the project execution plan which is currently underway should be continued and completed including incorporation of all of the modifications since completion of the 2007 Feasibility Study.
SCOTT WILSON RPA www.scottwilson.com
New Gold Inc. – New Afton Project Technical Report NI 43-101 – December 31, 2009 Page 22-1
22 REFERENCES Behre Dolbear & Company, Ltd. (2003): Mineral Resource Estimate for the Afton
Copper/Gold Project, Kamloops, B.C., 161 pp., filed on SEDAR. Behre Dolbear & Company, Ltd. (2004): Advanced Scoping Study for the Afton
Copper/Gold Project, Kamloops, B.C. Updated 2004, 187 pp., prepared for DRC Resources Corporation, filed on SEDAR.
Behre Dolbear & Company, Ltd. (2004): Mineral Resource Estimate for the Afton
Copper/Gold Project, Kamloops, B.C., 160 pp., filed on SEDAR. Bieniawski, Z.T. (1976): Rock Mass Classification of Jointed Rock Masses. Exploration
for Rock Engineering. Z.T. Bieniawski Ed. Balkema, Johannesburg, pp. 97-106. Darney, R., Friesen, R., Giroux, G. (2005): Summary Report on the 2003 and 2004
Exploration Program and Mineral Resource Estimate on the Rainbow Property, 55 pp., filed on SEDAR.
Hatch Ltd. (2007): New Afton Project Detailed Feasibility Study. Konst, R. (2006): New Afton Project 2005-2006 Drilling Program, Sample Preparation
and Analytical Quality Control Report, 17 pp., internal report to New Gold Inc. Laubschner, D.H. (1990): A Geomechanics classification system for the rating of rocks in
mine design, J. Of South African Institute for Mining and Metallurgy, Vol. 90, No. 10, Oct., pp. 257-273.
New Gold Annual Report (2008): filed on SEDAR. New Gold (2009): Various Press Releases as filed on SEDAR, and the company
website. SGS Minerals Services (2007): An Investigation into the Recovery of Copper and Gold
from the Afton Deposit Sim, R., and Davies, B. (Draft 2009): Draft internal report to New Gold, 19 pp. Wallis, S., and Giroux, G., (2006): Technical Report on the New Afton Project, 44 pp.,
internal report to New Gold Inc. AMC Consultants Pty Ltd. (2007) Afton Project Feasibility Study, Underground Mining
Study AMC Consultants Pty Ltd. (2009), New Afton Project, Mineral Reserve Estimate, New
Gold Inc. Rescan Environmental Services Ltd. (2007), Application for a Permit Approving The
Mine Plan and Reclamation Program Pursuant to the Mines Act R.S.B.C. 1996, C.293 New Afton Copper Gold Mine, British Columbia, Canada.

SCOTT WILSON RPA www.scottwilson.com
New Gold Inc. – New Afton Project Technical Report NI 43-101 – December 31, 2009 Page 22-2
Spreadsheets and internal documents provided by New Afton technical staff.
SCOTT WILSON RPA www.scottwilson.com
New Gold Inc. – New Afton Project Technical Report NI 43-101 – December 31, 2009 Page 23-1
23 DATE AND SIGNATURE PAGE This report titled “Technical Report on the New Afton Project, British Columbia, Canada”
and dated December 31, 2009, was prepared and signed by the following authors:
(Signed & Sealed) Dated at Vancouver, BC December 31, 2009 R. Dennis Bergen, P.Eng. Associate Principal Mining Engineer (Signed & Sealed) Dated at Vancouver, BC December 31, 2009 David W. Rennie, P.Eng. Principal Geologist (Signed & Sealed) Dated at Vancouver, BC December 31, 2009 Kevin C. Scott, P.Eng. Principal Metallurgist

SCOTT WILSON RPA www.scottwilson.com
New Gold Inc. – New Afton Project Technical Report NI 43-101 – December 31, 2009 Page 24-1
24 CERTIFICATE OF QUALIFIED PERSON R. DENNIS BERGEN I, Raymond Dennis Bergen, P.Eng., as an author of this report entitled “Technical Report on the New Afton Project, British Columbia, Canada”, prepared for New Gold Inc. and dated December 31, 2009, do hereby certify that: 1. I am Associate Principal Mining Engineer engaged by Scott Wilson Roscoe Postle
Associates Inc. of Suite 501, 55 University Ave Toronto, ON, M5J 2H7. 2. I am a graduate of the University of British Columbia, Vancouver, B.C., Canada, in
1979 with a Bachelor of Applied Science degree in Mineral Engineering. I am a graduate of the British Columbia Institute Technology in Burnaby, B.C. Canada, in 1972 with a Diploma in Mining Technology.
3. I am registered as a Professional Engineer in the Province of British Columbia
(Reg.# 16064) and as a Licensee with the Association of professional Engineers, Geologists and Geophysicists of the Northwest Territories (Licence L1660). I have worked as an engineer for a total of 27 years since my graduation. My relevant experience for the purpose of the Technical Report is:
• Practice as a mining engineer, production superintendent, mine manager, Vice President of Operations and a consultant in the design, operation and review of mining operations.
• Review and report, as an employee and as a consultant, on numerous mining operations and projects around the world for due diligence and operational review related to project acquisition and technical report preparation, including:
o Engineering and operating superintendent at the Con gold mine, a deep underground gold mine, Yellowknife, NWT, Canada
o Contribute to the Independent Report on the Reopening of the Cantung Mine at Tungsten, NWT, Canada
o General Manager in Charge of the Reopening of the Cantung Mine, NWT, Canada
o Detailed diligence review of the ERG Tailings Recovery Project, Ontario, Canada
o VP Operations in charge of the restart of the Golden Bear Mine, BC, Canada
• Mining engineer in underground gold and base metal mines. • Consulting engineer working on project acquisition and project design. • Mine Manager at three different mines with open pit and underground
operations • Vice President of Operations responsible for an operating gold mine,
development of a feasibility study for a project in Costa Rica and project review and evaluation related to project acquisition for numerous projects around the world including the successful acquisition of mines in Mexico and Australia and an interest in a mine in Argentina.
4. I have read the definition of "qualified person" set out in National Instrument 43-101
("NI43-101") and certify that by reason of my education, affiliation with a professional

SCOTT WILSON RPA www.scottwilson.com
New Gold Inc. – New Afton Project Technical Report NI 43-101 – December 31, 2009 Page 24-2
association (as defined in NI43-101) and past relevant work experience, I fulfill the requirements to be a "qualified person" for the purposes of NI43-101.
5. I visited the New Afton Project on September 3 and 4, 2009, and on October 23,
2009. 6. I am responsible for preparation of Items 5, 18 and 19, as well as parts of Items 1, 2,
3, 17 (Mineral Reserves), 20, and 21 of the Technical Report. 7. I am independent of the Issuer applying the test set out in Section 1.4 of National
Instrument 43-101. 8. I have had no prior involvement with the property that is the subject of the Technical
Report. 9. I have read National Instrument 43-101, and the Technical Report has been
prepared in compliance with National Instrument 43-101 and Form 43-101F1. 10. To the best of my knowledge, information, and belief, the Technical Report contains
all scientific and technical information that is required to be disclosed to make the technical report not misleading.
Dated this 31st day of December, 2009
(Signed & Sealed)
Raymond Dennis Bergen, P.Eng.
SCOTT WILSON RPA www.scottwilson.com
New Gold Inc. – New Afton Project Technical Report NI 43-101 – December 31, 2009 Page 24-3
DAVID W. RENNIE I, David W. Rennie, P.Eng., as an author of this report entitled “Technical Report on
the New Afton Project, British Columbia, Canada”, prepared for New Gold Inc. and dated December 31, 2009, do hereby certify that:
1. I am a Principal Geologist with Scott Wilson Roscoe Postle Associates Inc. My office
address is Suite 388, 1130 West Pender Street, Vancouver, British Columbia, Canada V6E 4A4.
2. I am a graduate of the University of British Columbia in 1979 with a Bachelor of
Applied Science degree in Geological Engineering. 3. I am registered as a Professional Engineer in the Province of British Columbia
(Reg.# 13572). I have worked as a geological engineer for a total of 30 years since my graduation. My relevant experience for the purpose of the Technical Report is:
• Review and report as a consultant on numerous exploration and mining projects around the world for due diligence and regulatory requirements
• Consultant Geologist to a number of major international mining companies providing expertise in conventional and geostatistical resource estimation for properties in North and South Americas, and Africa.
• Chief Geologist and Chief Engineer at a gold-silver mine in southern B.C. • Exploration geologist in charge of exploration work and claim staking with two
mining companies in British Columbia. 4. I have read the definition of "qualified person" set out in National Instrument 43-101
("NI43-101") and certify that by reason of my education, affiliation with a professional association (as defined in NI43-101) and past relevant work experience, I fulfill the requirements to be a "qualified person" for the purposes of NI43-101.
5. I visited the New Afton Project on April 19 and 20, 2009 and again on September 3
and 4, 2009. 6. I am responsible for preparation of Items 4 and 6 to 15 inclusive, as well as parts of
Items 1, 17 (Mineral Resources), 20, and 21 of the Technical Report. 7. I am independent of the Issuer applying the test set out in Section 1.4 of National
Instrument 43-101. 8. I have had no prior involvement with the property that is the subject of the Technical
Report. 9. I have read National Instrument 43-101, and the Technical Report has been
prepared in compliance with National Instrument 43-101 and Form 43-101F1.
SCOTT WILSON RPA www.scottwilson.com
New Gold Inc. – New Afton Project Technical Report NI 43-101 – December 31, 2009 Page 24-4
10. To the best of my knowledge, information, and belief, the Technical Report contains all scientific and technical information that is required to be disclosed to make the technical report not misleading.
Dated this 31st day of December, 2009
(Signed & Sealed)
David W. Rennie, P. Eng.
SCOTT WILSON RPA www.scottwilson.com
New Gold Inc. – New Afton Project Technical Report NI 43-101 – December 31, 2009 Page 24-5
KEVIN C. SCOTT I, Kevin C. Scott P.Eng., as an author of this report entitled “Technical Report on the
New Afton Project, British Columbia, Canada”, prepared for New Gold Inc. and dated December 31, 2009, do hereby certify that:
1. I am a Principal Metallurgist with Scott Wilson Roscoe Postle Associates Inc. of Suite
388, 1130 West Pender Street, Vancouver, British Columbia, Canada V6E 4A4.
2. I am a graduate of University of British Columbia, Vancouver, Canada in 1989 with a Bachelor of Applied Science degree in Metals and Materials Engineering.
3. I am registered as a Professional Engineer in the Province of British Colombia (Licence # 25314) and the Province of Ontario (License # 90443342). I have worked as a metallurgical engineer for a total of 18 years since my graduation. My relevant experience for the purpose of the Technical Report is: • Reviews and reports as a metallurgical consultant on a number of mining
operations and projects for due diligence and financial monitoring requirements • Process engineer at three Canadian base metals mineral processing operations • Senior metallurgical engineer working for three multi-national engineering and
construction companies on feasibility studies and in engineering design of mineral processing plants in Canada and South America
• Senior process manager in charge of process design and engineering for a metallurgical processing plant in South America
4. I have read the definition of "qualified person" set out in National Instrument 43-101
(NI43-101) and certify that by reason of my education, affiliation with a professional association (as defined in NI43-101) and past relevant work experience, I fulfill the requirements to be a "qualified person" for the purposes of NI43-101.
5. I have not visited the New Afton Project.
6. I am responsible for preparation of Item 16 and parts of Items 1, 19, 20, and 21 of the Technical Report.
7. I am independent of the Issuer applying the test set out in Section 1.4 of National Instrument 43-101.
8. I have had no prior involvement with the property that is the subject of the Technical Report.
9. I have read National Instrument 43-101, and the Technical Report has been prepared in compliance with National Instrument 43-101 and Form 43-101F1.

SCOTT WILSON RPA www.scottwilson.com
New Gold Inc. – New Afton Project Technical Report NI 43-101 – December 31, 2009 Page 24-6
10. To the best of my knowledge, information, and belief, the Technical Report contains all scientific and technical information that is required to be disclosed to make the technical report not misleading.
Dated this 31st day of December, 2009
(Signed & Sealed)
Kevin C. Scott, P.Eng.
SCOTT WILSON RPA www.scottwilson.com
New Gold Inc. – New Afton Project Technical Report NI 43-101 – December 31, 2009 Page 25-1
25 APPENDIX 1 This section contains the results of statistical analyses carried out on the composited drill
hole data.

Fre
quen
cy
Aggpt
0.01 0.1 1 10 100
.000
.050
.100
.150
.200
.250
Histogram - Ag Comps (All)Number of Data 48876
number trimmed 2097
mean .9704std. dev. 8.8997
coef. of var 9.1712
maximum 1880.0000upper quartile .6000
median .2000lower quartile .0500
minimum .0000
Cum
ulat
ive
Pro
babi
lity
Aggpt
Probability plot - Ag Comps (All)
.01
.1
.2
125
10
20304050607080
90959899
99.899.9
99.99
.010 .10 1.0 10. 100.
Fre
quen
cy
Augpt
0.01 0.1 1 10
.000
.100
.200
.300
Histogram - Au Comps (All)Number of Data 50929
number trimmed 44
mean .2786std. dev. .6452
coef. of var 2.3157
maximum 22.1000upper quartile .1900
median .0400lower quartile .0200
minimum .0000
Cum
ulat
ive
Pro
babi
lity
Augpt
Probability plot - Au Comps (All)
.01
.1
.2
125
10
20304050607080
90959899
99.899.9
99.99
.010 .10 1.0 10.
Fre
quen
cy
Cupct
0.01 0.1 1 10
.000
.100
.200
.300
Histogram - Cu Comps (All)Number of Data 50973
mean .3244std. dev. .6890
coef. of var 2.1241
maximum 12.3900upper quartile .2000
median .0300lower quartile .0100
minimum .0100
Cum
ulat
ive
Pro
babi
lity
Cupct
Probability plot - Cu Comps (All)
.01
.1
.2
125
10
20304050607080
90959899
99.899.9
99.99
.010 .10 1.0 10.
Fre
quen
cy
Pdgpt
0.01 0.1 1 10
.000
.100
.200
.300
.400
.500
.600
.700
Histogram - Pd Comps (All)Number of Data 50931
number trimmed 42
mean .0480std. dev. .1362
coef. of var 2.8381
maximum 14.1000upper quartile .0200
median .0200lower quartile .0200
minimum .0000
Cum
ulat
ive
Pro
babi
lity
Pdgpt
Probability plot - Pd Comps (All)
.01
.1
.2
125
10
20304050607080
90959899
99.899.9
99.99
.010 .10 1.0 10.
FIGURE A1-1 COMPOSITE STATISTICS, HISTOGRAMS AND PROBABILITY PLOTS
SCOTT WILSON RPA www.scottwilson.com
New Gold Inc. – New Afton Project Technical Report NI 43-101 – December 31, 2009 Page 25-2
![Civic Reception House Nagoya EntranceTechnical Tour2 Technical Tour3 Technical Tour4 Technical Tour5 [12] Technical Tour6 Technical Tour7 Technical Tour8 Technical Tour9 Technical](https://img.dokumen.tips/doc/110x75/60511276b5492f765a3fd03c/civic-reception-house-nagoya-entrance-technical-tour2-technical-tour3-technical.jpg)