Embed Size (px)
Citation preview

Technical Report No: ND12-03
FATE OF BIODEGRADABLE DISSOLVED ORGANIC NITROGEN IN
FARGO WASTEWATER
by
Halis Simsek
Eakalak Khan
Dept. of Civil Engineering
North Dakota State University
Fargo, North Dakota
February 2012
North Dakota Water Resources Research Institute
North Dakota State University, Fargo, North Dakota

Technical Report No: ND12-03
FATE OF BIODEGRADABLE DISSOLVED ORGANIC NITROGEN IN
FARGO WASTEWATER
by
Halis Simsek1
Eakalak Khan2
WRRI Graduate Research Fellow1 and Professor
2
Department of Civil Engineering
North Dakota State University
Fargo, ND 58108
February 2012
The work upon which this report is based was supported in part by federal funds provided by the
United States of Department of Interior in the form of ND WRRI Graduate Research Fellowship for
the graduate student through the North Dakota Water Resources Research Institute.
Contents of this report do not necessarily reflect the views and policies of the US Department of
Interior, nor does mention of trade names or commercial products constitute their endorsement or
recommendation for use by the US government.
Project Period: March 1, 2009 - February 28, 2011
Project Number: 2009ND191B
North Dakota Water Resources Research Institute Director: G. Padmanabhan
North Dakota State University
Fargo, North Dakota 58108
ii
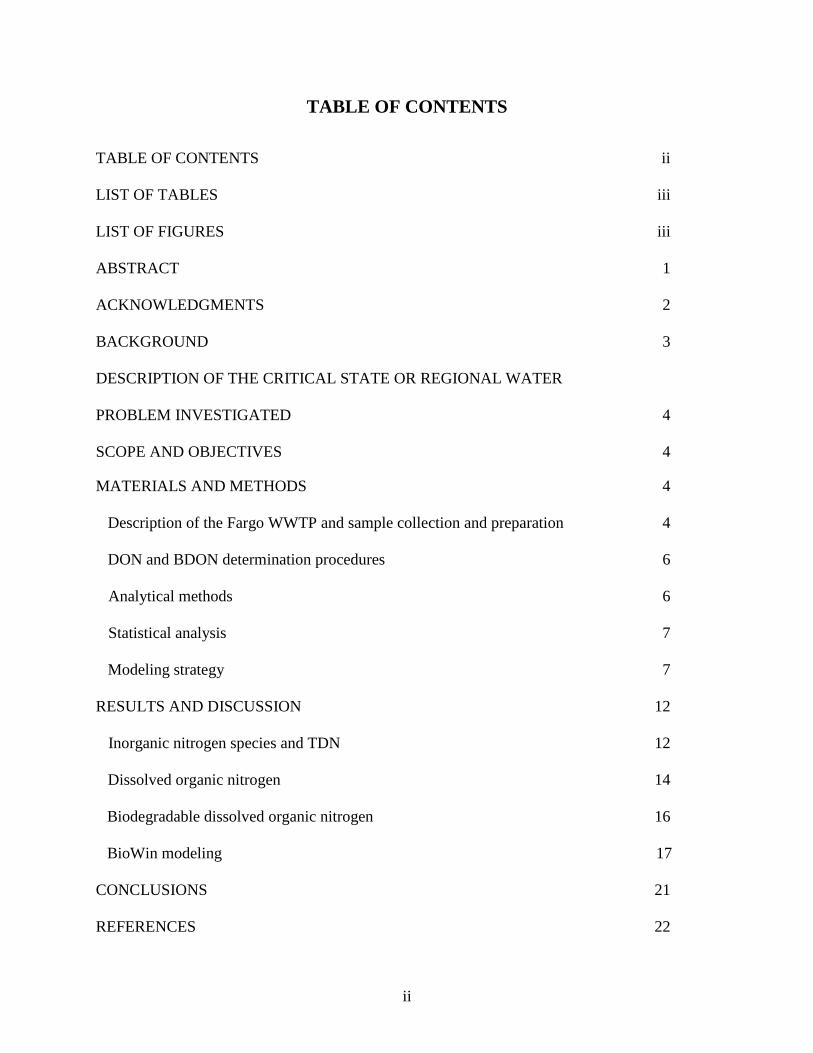
TABLE OF CONTENTS
TABLE OF CONTENTS ii
LIST OF TABLES iii
LIST OF FIGURES iii
ABSTRACT 1
ACKNOWLEDGMENTS 2
BACKGROUND 3
DESCRIPTION OF THE CRITICAL STATE OR REGIONAL WATER
PROBLEM INVESTIGATED 4
SCOPE AND OBJECTIVES 4
MATERIALS AND METHODS 4
Description of the Fargo WWTP and sample collection and preparation 4
DON and BDON determination procedures 6
Analytical methods 6
Statistical analysis 7
Modeling strategy 7
RESULTS AND DISCUSSION 12
Inorganic nitrogen species and TDN 12
Dissolved organic nitrogen 14
Biodegradable dissolved organic nitrogen 16
BioWin modeling 17
CONCLUSIONS 21
REFERENCES 22
iii
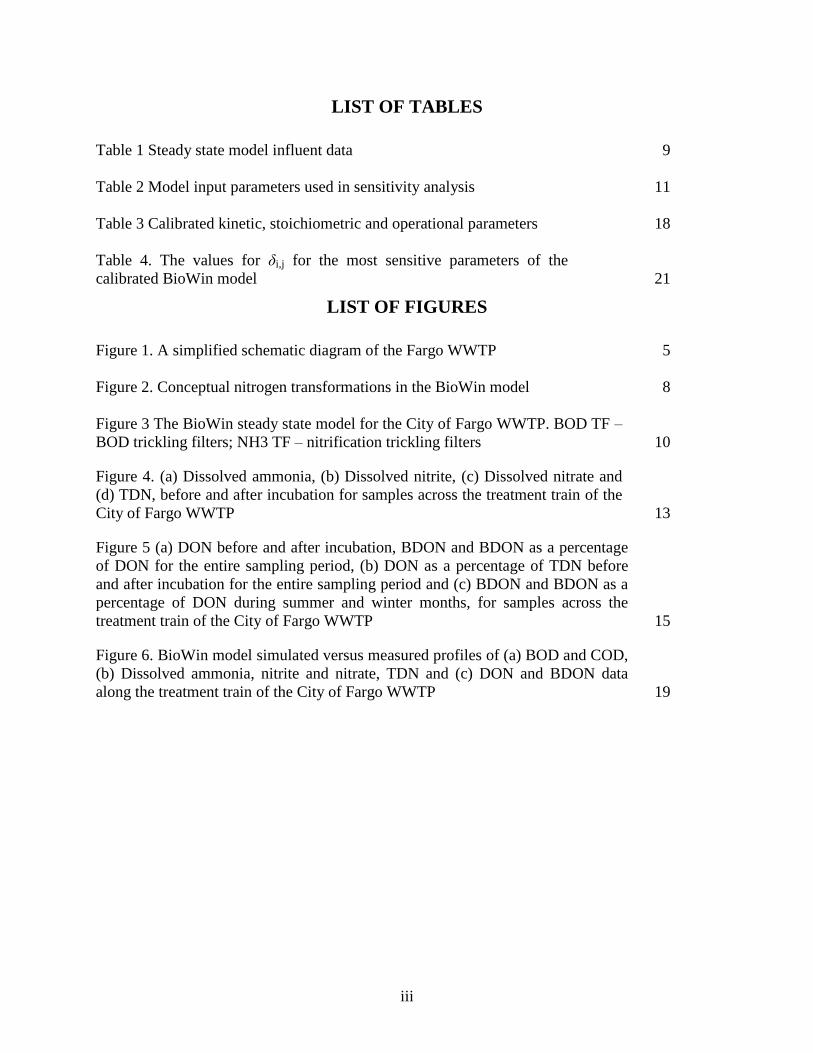
LIST OF TABLES
Table 1 Steady state model influent data 9
Table 2 Model input parameters used in sensitivity analysis 11
Table 3 Calibrated kinetic, stoichiometric and operational parameters 18
Table 4. The values for δi,j for the most sensitive parameters of the
calibrated BioWin model 21
LIST OF FIGURES
Figure 1. A simplified schematic diagram of the Fargo WWTP 5
Figure 2. Conceptual nitrogen transformations in the BioWin model 8
Figure 3 The BioWin steady state model for the City of Fargo WWTP. BOD TF –
BOD trickling filters; NH3 TF – nitrification trickling filters 10
Figure 4. (a) Dissolved ammonia, (b) Dissolved nitrite, (c) Dissolved nitrate and
(d) TDN, before and after incubation for samples across the treatment train of the
City of Fargo WWTP 13
Figure 5 (a) DON before and after incubation, BDON and BDON as a percentage
of DON for the entire sampling period, (b) DON as a percentage of TDN before
and after incubation for the entire sampling period and (c) BDON and BDON as a
percentage of DON during summer and winter months, for samples across the
treatment train of the City of Fargo WWTP 15
Figure 6. BioWin model simulated versus measured profiles of (a) BOD and COD,
(b) Dissolved ammonia, nitrite and nitrate, TDN and (c) DON and BDON data
along the treatment train of the City of Fargo WWTP 19

1
ABSTRACT
A comprehensive study to investigate the fate of dissolved organic nitrogen (DON) and
biodegradable DON (BDON) through the Fargo Wastewater Treatment Plant (WWTP)
was conducted. The Fargo WWTP has a two-stage trickling filter process and discharges
treated wastewater to the Red River. The fate of DON and BDON has not been studied
for trickling filter WWTPs. Results showed that DON concentrations in the influent and
effluent were 27% and 14% of total dissolved nitrogen (TDN). The plant removed about
62% and 72% of the influent DON and BDON mainly by the trickling filters. The final
effluent BDON values averaged 1.78 mg/L. BDON was found to be between 51% and
69% of the DON in raw wastewater and after various treatment units. The fate of DON
and BDON through the Fargo WWTP was modeled. The BioWin v3.1 model was
successfully applied to simulate ammonia, nitrite, nitrate, TDN, DON and BDON
concentrations along the treatment train. The maximum growth rates for ammonia
oxidizing bacteria (AOB) and nitrite oxidizing bacteria, and AOB half saturation constant
influenced ammonia and nitrate output results. Hydrolysis and ammonification rates
influenced all of the nitrogen species in the model output, including BDON. This study
provides valuable information on different types of nitrogen particularly BDON and their
amounts contributed by the Fargo WWTP to the Red River.

2
ACKNOWLEDGMENTS
Stipend support for the Research Fellow, Halis Simsek, was provided by the North
Dakota Water Resources Research Institute. The authors would like thank to Douglas
Doehlert, USDA-ARS Wheat Quality Laboratory, North Dakota State University for
providing a Varian Cary 50 UV-V spectrophotometer for the analyses of nitrate and total
nitrogen.
3
BACKGROUND
Availability of excess nutrients is known to cause eutrophication of water bodies such as
lakes and rivers, which leads to low dissolved oxygen (DO) conditions and eventually
makes the water body unsuitable for recreational purposes. Nitrogen is one of the primary
nutrients causing low DO conditions, with discharges from wastewater treatment plants
(WWTPs) being one of the major contributors. Due to recent advances in treatment
processes, WWTPs equipped with nitrification and denitrification processes (biological
nutrient removal) are able to achieve more than 95% removal of dissolved inorganic
nitrogen (DIN). Most of the WWTPs equipped with these advanced processes discharge
effluent total dissolved nitrogen (TDN) of 10 mg/L or less.
Recent studies indicate that a major portion of the wastewater effluent TDN is generally
in organic form, dissolved organic nitrogen (DON), ranging from 25% to 80% of the
effluent TDN (Pehlivanoglu-Mantas and Sedlak, 2006, Sattayatewa et al., 2009). DON
concentration in secondary treated effluent typically ranges from 1 to 5 mg/L as N. Since
high DIN removal has been achievable using the best available technologies, the future
target for the treatment plants to reach increasingly stringent regulations for receiving
water quality protection will be the removal of DON. For impaired receiving waters, the
total nitrogen limit for WWTP effluent discharges could be as low as 3 mg/L or less
(WERF, 2009).
Although effluent DON is recalcitrant to the current treatment processes, studies showed
that about 50% of the effluent DON is bioavailable or biodegradable to algae and/or
bacteria in long period incubation tests (2 to 6 weeks) (Murthy et al., 2006; Pehlivanoglu-
Mantas and Sedlak, 2006, Khan et al., 2009; Sattayatewa et al., 2009). Bioavailable DON
is the portion of DON that can support the growth of algae and/or bacteria (Pehlivanoglu
and Sedlak, 2004; Urgun-Demirtras et al., 2008), while biodegradable DON (BDON) is
the portion of DON that can be mineralized by an acclimated mixed bacterial culture
(Khan et al., 2009). BDON in denitrified effluent from four different WWTPs in
Washington, D.C. and Virginia was about 25% to 33% of DON (Murthy et al., 2006). All
four plants employ biological nutrient removal suspended growth systems. In batch
assays conducted by Sattayatewa et al. (2009), BDON was 57% of the effluent DON for
a 4-stage Bardenpho nutrient removal plant.
Due to a long incubation period (28 days) associated with the BDON procedure (Khan et
al., 2009), it is not possible for the treatment plants to make timely operational
adjustments to efficiently remove DON, which could lead to a possible permit violation.
Modeling WWTP processes to predict DON and BDON profiles could be a helpful
approach in this case. Limited work has been done on modeling the fate of DON and
BDON through wastewater treatment plants. Makinia et al. (2011) attempted to model the
fate of particulate organic nitrogen (PON), colloidal organic nitrogen (CON) and DON in
an activated sludge wastewater treatment plant. A modified Activated Sludge Model No.
2d (Henze et al., 1999) was used in their study by including these three forms of organic
nitrogen. The new model incorporated hydrolysis of PON and CON to DON and
ammonification of DON in all three environmental conditions (aerobic, anaerobic, and
anoxic).

4
DESCRIPTION OF THE CRITICAL STATE OR REGIONAL
WATER PROBLEM INVESTIGATED
The fate of DON and BDON in WWTPs has gained attention in recent years because of
more stringent regulations on total nitrogen concentration in treated wastewater effluent.
However, there has been no report on effluent DON and BDON from treatment plants
using trickling filters (TFs) since the process is less common in wastewater utilities. The
Fargo WWTP relies mainly on a TF process for treating wastewater. The plant employs
two sets of TFs in series. The first set of TFs, known as biochemical oxygen demand
(BOD) filters, treats mainly carbonaceous BOD materials and reduces ammonia nitrogen
(NH3-N) concentration slightly through the microbial uptake. The second set of TFs
converts NH3-N to nitrate nitrogen (NO3-N) through nitrification to accommodate the
minimal NH3-N removal in the BOD trickling filters. Currently, there is no regulation on
discharge of TDN by the Fargo WWTP, which discharges to the Red River. However,
along with the technological improvement, regulatory agencies force wastewater
treatment plants to reduce their effluent TDN concentration to certain amount. It is
possible that the Fargo WWTP will be regulated on TDN in near future. Therefore,
understanding the fate and characteristics of DON and BDON in the Fargo wastewater
treatment train is crucial.
SCOPE AND OBJECTIVES
The main scope of this research includes collecting DON and BDON data for a year-
round time scale between 08/10/2009 and 08/22/2010 along the Fargo wastewater
treatment train. The objectives of the research are as follows:
1. To investigate the fate of DON and BDON through the Fargo wastewater treatment
train;
2. To determine BDON degradability (BDON/DON) profile through the treatment
train;
3. To determine seasonal effect on DON and BDON profiles through the treatment
train; and
4. To apply a computer based model to predict DON and BDON through the treatment
train.
MATERIALS AND METHODS
Description of the Fargo WWTP, and sample collection and preparation
The Fargo WWTP has a two-stage tricking filter process with a peak pumping capacity of
29 million gallons per day (MGD) and an average flow of 11-15 MGD. A simplified
schematic diagram of the treatment plant is shown in Figure 1. The facility consists of an
influent pumping station, screening, grit removal, two pre-aeration channels, seven
primary clarifiers, three BOD trickling filters, two intermediate clarifiers, two
nitrification trickling filters, one final clarifier, chlorination, and dechlorination units. The
plant is not subject to fecal coliform regulations during the winter months; hence the
chlorination and dechlorination were not practiced during that period. The treated

5
wastewater from the plant is discharged continuously by gravity flow to the Red River.
However, in emergency situations such as during high river stage or when water quality
does not meet North Dakota State discharge standards, the treated water is pumped from
the plant to nearby stabilization ponds. The treated water is stored in these ponds until it
can be discharged into the Red River.
Grab samples were collected from eight different locations along the treatment train in
the plant. Sample identification and collection locations are shown in Figure 1. Sampling
was conducted bi-weekly between August 2009 and August 2010. It should be noted that
some of the sampling schedules were skipped due to severe weather conditions resulting
a total of 18 samples, 8 samples in winter (November to March) and 10 samples in
summer (April to October). Three hundred milliliters of each sample was filtered through
a 0.2 m pore size cellulose acetate membrane filter (PALL Co., Port Washington, NY,
USA) within an hour after collection and used for determining dissolved nitrogen species
(ammonia, nitrite, and nitrate, total nitrogen), DON, and BDON. Samples collected from
locations 1 and 2 were filtered through a 1.2 m pore size glass microfiber filter
(Whatman Inc., Kent, UK) before the filtration through the 0.2 m pore-size filter due to
higher solid concentrations.
Figure 1. A simplified schematic diagram of the Fargo WWTP.
Raw
wastewater
Bar
Screen
Vortex grit
chamber
Primary
clarifiers
Final
clarifiers
Nitrification
trickling filters
Intermediate
clarifiers
BOD
trickling filters
Chlorination
Sulfur
dioxide
dechlorinatio
n
Sludge digester
Stabilization ponds
(emergency or
during floods)
Belt presses and/or
drying beds
Red
Riv
er
Fargo
Landfill
Liquid stream
Solid stream
1, 2, … Sampling Locations
1 2
3 4 5 6
7 8

6
DON and BDON determination procedures
In this study, the procedure for BDON determination developed by Khan et al. (2009)
was followed with slight modifications. A 20-day incubation period and a mixed liquor
suspended solids (MLSS) seed were used in the BDON procedure by Khan et al. (2009).
However, a 28-day incubation period and a raw wastewater seed were used in this study.
The rationale for choosing 28 days for incubation is to further ensure that time was not a
limiting factor for ammonification of dissolved organic nitrogen in the sample. MLSS
and raw wastewater seeds were experimented with the first few sets of samples and
similar results were obtained (data not shown). Raw wastewater seed was chosen to be
consistent with the treatment plant that uses it for regular BOD measurement.
The BDON procedure is as follows. All the samples were filtered through a 0.2 µm pore-
size cellulose acetate membrane filter (Whatman Inc., Kent, UK) within an hour after
collection. A portion of the filtered sample was used for immediate analysis of total
nitrogen and inorganic nitrogen species (ammonia, nitrite, and nitrate). DON was
determined from the difference between measured TDN and measured DIN species using
equation 1. The value was recorded as initial DON (DONi). Two hundred milliliters of
the remaining filtered sample were mixed with 2 mL of acclimated inoculum in a 250 mL
amber bottle. Raw wastewater (collected from location 1 in Figure 1) was used as the
inoculum. The solution in the bottle was shaken thoroughly to aerate and placed in an
incubator in the dark at 20°C for 28 days. During the incubation period, the solution in
the bottle was manually shaken to aerate at least once every day to maintain aerobic
conditions. A seed control (sample b), which was treated the same way as the samples,
was prepared by adding the inoculum to 200 mL of de-ionized distilled water. After 28
days of incubation, all nitrogen species in the supernatant were measured to determine
final DON (DONf). BDON was calculated according to equation 2.
DON (mg/L as N) = TDN - DNH3 - DNO2 - DNO3 (1)
BDON (mg/L as N) = (DONi - DONf) - (DONbi - DONbf) (2)
Where
DNH3, DNO2, and DNO3 are dissolved ammonia, nitrite and nitrate,
respectively;
DONi and DONf are DON before and after incubation for samples; and
DONbi and DONbf are DON before and after incubation for control.
Analytical methods
All samples were analyzed in triplicates. The glassware were washed with soap, rinsed
with tap water, kept in a 5% v/v hydrochloric acid bath overnight and rinsed with de-
ionized water before use.
The salicylate methods (Hach method # 10023 and #10031) were used for ammonia
nitrogen measurement. Method # 10023 was used for values ranging between 0.02 and
2.50 mg/L while method # 10031 was applied for values ranging between 0.04 and 50
mg/L. The Test ‘N Tube AmverTM
test kits and a Hach DR5000 spectrophotometer at 655
nm were used.

7
The diazotization method (Hach method # 10019) was used for low range nitrite nitrogen
measurement (between 0.003 and 0.5 mg/L as NO2ˉ-N). The Test ‘N Tube NitriVer®3
test kits and a Hach DR 5000 spectrophotometer at 507 nm were used. The ferrous sulfate
method (Hach method #8153) was used for high range nitrite measurement (between 2.0
and 75 mg/L as NO2ˉ-N). The NitriVer®2 Nitrite Reagent powder pillows and Hach DR
5000 spectrophotometer at 373 nm were used.
Dissolved nitrate was measured by a second derivative UV spectrophotometric (SDUS)
method (APHA et al., 2005). The method was used for nitrate values ranging between 0
and 3.0 mg/L as N. Samples with higher nitrate concentrations were diluted to the
measureable range. A Varian Cary 50 UV-V spectrophotometer was used with a quartz
cuvette.
TDN was measured by the SDUS method (APHA et al., 2005) after modified persulfate
digestion (Sattayatewa and Pagilla, 2008). The method was used for TDN values ranging
between 0 and 3.0 mg/L as N. Samples with higher total nitrogen concentrations were
diluted to the measureable range. During the digestion, all nitrogen species (dissolved
inorganic and organic) in the sample are converted to nitrate.
Statistical analysis
Two-way analysis of variance (ANOVA) using a General Linear Models (GLM)
procedure of SAS (version 9.2; SAS Institute, Cary, NC) was conducted to determine the
statistical differences in DON and BDON concentrations and BDON degradability
(BDON to DON ratio between summer and winter data. In ANOVA, seasons were
treated as main plots and treatment processes were treated as subplots, considering
sampling dates as replications within each season.
Modeling strategy
BioWin version 3.1 (EnviroSim Associates Ltd., Canada) was used to simulate dissolved
organic nitrogen conversion in the Fargo wastewater treatment processes. Influent
fractionation was performed using historical plant data. A sensitivity analysis was
performed to identify the most influential calibration parameters. The model was
calibrated using a dataset obtained in this study. It should be noted that only a steady state
calibration was performed.
Model description
The software uses a general activated sludge/anaerobic digestion (ASDM) model (Jones
and Takacs, 2004). The ASDM model comprises 50 state variables and 60 process
expressions. These expressions are used to describe the biological processes occurring in
activated sludge and anaerobic digestion systems, several chemical precipitation
reactions, and gas-liquid mass transfer for six gases. BioWin uses a modified 1D biofilm
model (Takacs et al., 2007) that is integrated with the ASDM model. Biofilm thickness
growth is influenced by attachment and detachment processes.

8
PON
DON (Nos)
NH3
NO2
NO3
N2
Ammonification
Hydrolysis
Nitritation
Nitratation Denitrification
Biomass
Cell
Synthesis
Decay
Assimilative
reduction
Figure 2. Conceptual nitrogen transformations in the BioWin model.
DON in BioWin is modeled as illustrated in Figure 2. The model includes biomass decay,
hydrolysis of PON to DON, and ammonification of DON to ammonia. Both PON and
DON have biodegradable and unbiodegradable fractions. The biodegradable (SND) and
unbiodegradable (SNI) fractions of DON in BioWin are assumed to be same as BDON
and the difference between DON and BDON (also known as non-biodegradable DON or
NBDON). Hydrolysis of biodegradable portion of PON (XND) and ammonification of
DON can be modeled using Monod expressions. The influent NBDON (defined in
BioWin nomenclature as soluble unbiodegradable total Kjeldahl nitrogen, Fnus) is not
removed in any of the treatment processes. It should be noted that the influent NBDON
definition is valid because NH3-N within total Kjeldahl nitrogen (TKN) is considered
biodegradable (nitrifiable). BioWin requires two nitrogen species in the influent from the
user: TKN and nitrate. The model then estimates the remaining species shown in the
schematic in Figure 2 using the influent fractionation information given along with
influent data.

9
Influent fractionation
For accurate process modeling, detailed fractionation data of the influent is required.
According to Henze et al. (1987), the influent TKN can be fractionated as shown in
Equation 3 below, assuming that no biomass is present in the influent wastewater.
TKN = XNI + XND + SNI + SND + SNH (3)
where, XNI is particulate biodegradable organic nitrogen. More detailed information on
the fractions used in BioWin to represent influent TKN components may be found in the
software user manual (EnviroSim Associates, 2007). Historical plant sampling data and a
plant audit report by Ulteig Engineers, Inc. (Ulteig Engineers, Inc., 2010) were used for
influent wastewater characterization and fractionation calculations. BioWin allows user
to input soluble, particulate, biodegradable, and unbiodegradable fractions of chemical
oxygen demand (COD) and nitrogen species. A selected set of BioWin default
fractionation information is summarized in Table 1.
Table1. Steady state model influent data. Element name Value
1. Fractionation Data
Fbs - Readily biodegradable (including Acetate) [g COD/g of total COD] 0.16
Fac - Acetate [g COD/g of readily biodegradable COD] 0.15
Fxsp - Non-colloidal slowly biodegradable [g COD/g of slowly degradable COD] 0.75
Fus - Unbiodegradable soluble [g COD/g of total COD] 0.05
Fup - Unbiodegradable particulate [gCOD/g of total COD] 0.13
Fna - Ammonia [g NH3-N/g TKN] 0.66
Fnox - Particulate organic nitrogen [g N/g Organic N] 0.5
Fnus - Soluble unbiodegradable TKN [g N/g TKN] 0.02
FupN - N:COD ratio for unbiodegradable part. COD [g N/g COD] 0.035
2. Annual Average Flow Characteristics
Flow (MGD) 13
Total COD (mg/L) 721.6
Total Kjeldahl Nitrogen (mg/L) 33.1
Nitrate-N (mg/L) 0.2
Total P (mg/L) 10
Alkalinity (mmol/L) 2.2
Inorganic suspended solids (mg/L) 120
pH 7.35

10
Model setup, calibration and validation
Daily average flow rates and annual average concentrations for various model inputs
were used during the steady state model setup. The constant influent inputs used in the
model are summarized in Table 1. The steady state model configuration is presented in
Figure 3. Clarifiers were modeled using the modified Vesilind secondary settler model,
which simulates a settling tank as a one dimensional settling with multiple layers
(minimum of 5). The height of the trickling filters was discretized into four layers in the
BioWin model, with each layer representing one quarter of the trickling filter height. This
approach has been used successfully elsewhere (Bilyk et al., 2008). Each layer in BOD
trickling filter was configured with media having a specific area of 30 ft2/ft
3 and specific
volume of 0.75 ft2/ft
3. The model was configured using physical characteristics of
treatment units obtained from an audit report conducted in 2010 (Ulteig Engineers, Inc.,
2010), influent fractionation information (Table 1), and influent characteristics (Table 1).
The default BioWin kinetic and stoichiometric parameters were utilized during the initial
calibration steps. The model was calibrated by matching the model simulations with
averages of long-term intensive monitoring results for BOD, COD, NH3, NO2ˉ, NO3ˉ,
TDN, DON and BDON (Table 2) for different locations (Figure 1) along the treatment
train of the Fargo WWTP.
Figure 3. The BioWin steady state model for the City of Fargo WWTP. BOD TF – BOD
trickling filters; NH3 TF – nitrification trickling filters.

11
Table 2. Model input parameters used in sensitivity analysis.
Parameter Default value Units
1. Kinetic and stoichiometric parameters
Kinetic
Ammonia oxidizing bacteria (AOB)
Maximum specific growth rate
0.9
day-1
Substrate half saturation 0.7 mg N/L
Nitrite oxidizing bacteria (NOB)
Maximum specific growth rate
0.7
day-1
Substrate half saturation 0.1 mg N/L
Heterotrophs
Hydrolysis rate (AS)
2.1
day-1
Hydrolysis half saturation 0.06
Ammonification rate 0.04 L/(mg N d)
Nitrite oxidizer dissolved oxygen half
saturation
0.5 mgO2/L
Stoichiometric
N in endogenous residue 0.07 mg N/mg COD
N in biomass (for AOB, NOB, and
heterotrophs)
0.07 mg N/mg COD
2. Influent characterization
Soluble unbiodegradable TKN (Fnus) 0.02 g N/g TKN
N:COD ratio for unbiodegradable
particulate COD (FupN)
0.035 g N/g COD
Unbiodegradable soluble (Fus) 0.05 g COD/g of total
COD
Unbiodegradable particulate (Fup) 0.16 g COD/g of total
COD
3. Operating variables
Dissolved oxygen for the trickling filters 3£ mg/L
Combined recycle of settled solids from
intermediate and final clarifiers
0.35£ million gallons per
day
4. Biofilm characteristics
Thickness 100 µm
Layers 2 £Based on personal communication with plant operators.
Sensitivity analysis
A sensitivity analysis was performed to evaluate the extent to which the parameters used
in the model calibration can influence various model outputs. Sensitivity analyses help in
identifying those parameters that have little or negligible effect on model outputs, and
thus can be left at their default values. Additionally, the analysis helps in identifying the
parameters with high sensitivity, for which a small variation in their values causes a large
variation in the response predicted by the model. In a linear sensitivity analysis, a relative
12
change in the model output parameter (yj) in response to a change in the model input
variable (θi) can be expressed as:
ii
jj
ji,/Δ
/yΔy
(4)
The influence of a calibration parameter on a model output parameter was interpreted
using the following categories: if δi,j < 0.25, the model is insensitive to the calibration
parameter; if 0.25 < δi,j < 1, the calibration parameter is influential; if 1< δi,j < 2, the
calibration parameter is very influential; if δi,j > 2, the calibration parameter is extremely
influential (Peterson et al., 2003).
In the present study, a sensitivity analysis was performed on steady state simulations
around BioWin’s default parameters. The following parameter categories were
considered as input variables (θi) in the sensitivity analyses: influent fractionation (e.g.
biodegradable and soluble fractions), operating variables (e.g. recycle and wastage
flows), stoichiometric (e.g. N and P contents) and kinetic parameters (e.g. maximum
specific growth rates and half saturation constants), biofilm characteristics (e.g. thickness
and layers). Additionally, the effect of BioWin switching functions was also included as
one of the input variables. Ammonia, nitrite, nitrate, DON (calculated from BioWin
outputs: filtered TKN and ammonia), and soluble biodegradable organic nitrogen (or
BDON) were chosen as the model output variables (yj). The analysis was performed by
providing a 10% perturbation to the parameters summarized in Table 2.
RESULTS AND DISCUSSION
The profiles of different dissolved nitrogen species (ammonia, nitrite, nitrate, and total
nitrogen) along the treatment train of the Fargo WWTP are presented in Figure 4, and
DON and BDON profiles are shown in Figure 5. Model calibration results for BOD,
COD, ammonia, nitrite, nitrate, TDN, DON and BDON are presented in Figure 6. The
data and error bars are based on averages and standard deviations of 18 different samples
(from 18 different weeks). Due to weather conditions such as rain and snow, influent
nitrogen concentrations fluctuated. In summer, nitrogen concentrations were high since
there was minimal dilution involved.
Inorganic nitrogen species and TDN
Ammonia in the influent of the Fargo WWTP was typically around 24 mg/L as N. The
plant achieved almost complete ammonia removal through nitrification which occurred in
both BOD and nitrification trickling filters (Figure 4a). About 50% of ammonia was
removed in the BOD trickling filters, while about 90% of the remaining ammonia was
removed in the nitrification trickling filters. All of the ammonia in the samples was
nitrified during the BDON incubation except for raw and primary wastewater sample in
which there were low amounts of ammonia left (< 1 mg/L).

13
0
10
20
30
40
NH
3(m
g-N
/L) Before incubation
After incubation(a)
0
10
20
30
40
NO
2-(m
g-N
/L) Before incubation
After incubation(b)
0
10
20
30
40
NO
3-(m
g-N
/L) Before incubation
After incubation(c)
0
10
20
30
40
Before
primary
clarifiers
After
primary
clarifiers
After
BOD
trickling
filters
After
inter-
mediate
clarifiers
After
nitrifi-
cation
filters
After
final
clarifier
After
chlori-
nation
After
dechlori-
nation
TD
N (
mg-N
/L)
Before incubation
After incubation(d)
Figure 4. (a) Dissolved ammonia, (b) Dissolved nitrite, (c) Dissolved nitrate and (d)
TDN, before and after incubation for samples across the treatment train of the City of
Fargo WWTP.

14
Average nitrite concentration in all the samples was consistently very low (< 0.1 mg/L as
N). After the incubation, nitrite in the samples before and after primary clarification was
25.21 and 22.93 mg/L as N, while nitrate at these locations was 3.03 and 4.61 mg/L as N
respectively. This was likely due to inadequate DO for nitratation (nitrite conversion to
nitrate) during the incubation. However, the last several sets of samples, more frequent
manual DO recharging was experimented and almost full nitratation (nitrite < 0.01 mg/L
as N) was achieved in these samples after the incubation. Nitrate was usually present in
very low concentrations (at an average of 0.20 mg/L as N) in the raw wastewater samples
(Figure 4c). However, it was the major portion of DIN after the nitrification filters (93%).
Nitrate nitrogen in almost all of the nitrification trickling filter effluent samples was
substantially less than the ammonia nitrogen in the plant influent. An average of 4.50
mg/L as N difference was observed between influent ammonia-N and effluent nitrate-N.
Previous studies indicated two possible reasons for this nitrogen loss: assimilation of
ammonia by biomass in the trickling filters and/or possible denitrification in the deeper
portions of biofilm (Hanaki et al., 1990; Eiroa et al., 2005). Additionally, nitrate may also
be used for biomass synthesis in the event of insufficient ammonia (Grady et al., 1999).
The third scenario needs not be considered here as there was always sufficient amount of
ammonia present in the nitrification trickling filters (> 12 mg/L as N).
Average nitrate values after the incubation in the samples from the remaining locations
followed a similar trend as that of before the incubation. The nitrate nitrogen
concentrations in the samples after the incubation were however slightly higher than
before the incubation. A possible reason for this increase in nitrate concentration could be
nitrification of ammonia from two different sources, the residual (untreated) ammonia in
the samples and/or the ammonia generated due to ammonification of organic nitrogen
during the incubation. Increases of nitrate nitrogen during the incubation ranged from
1.88 to 3.41 mg/L as N, which were higher than ammonia nitrogen in the samples (before
incubation). Thus, both ammonia sources discussed should have contributed to the nitrate
increases after the incubation. The average TDN in the plant influent was 33.15 mg/L as
N while in the effluent was 25.22 mg/L as N. Although the treatment plant was not
equipped with nutrient removal processes, it achieved 24% removal of the influent TDN.
The removal was observed mainly through the two trickling filters (Figure 4d). The
removal of TDN can be explained using the same reasons that were discussed earlier for
nitrogen loss in the nitrification trickling filters (assimilation of ammonia by biomass
and/or denitrification). The TDN values after the incubation were almost the same and
followed the same trend as before the incubation.
Dissolved organic nitrogen
Average DON in the plant influent and effluent were 9.02 and 3.44 mg/L as N,
respectively (Figure 5a). The final effluent DON was substantially higher than a typical
range of 1.1 mg/L to 2.1 mg/L reported for activated sludge systems with nutrient
removal processes (Murthy et al., 2006). However, there has been no data on activated
sludge with no nutrient removal process to compare with. The treatment plant removed
62% of the influent DON. Similar to inorganic nitrogen removal, major removal of DON
was observed in the biological processes of the plant. The BOD trickling filters removed

15
Figure 5. (a) DON before and after incubation, BDON and BDON as a percentage of
DON for the entire sampling period, (b) DON as a percentage of TDN before and after
incubation for the entire sampling period and (c) BDON and BDON as a percentage of
DON during summer and winter months, for samples across the treatment train of the
City of Fargo WWTP.

16
37% of the influent DON while the nitrification trickling filters removed the same
percent from the remaining DON. DON fractions of TDN were 27% and 14% in the raw
wastewater and in the plant effluent, respectively (Figure 5b).
After the incubation, at least 50% of the DON decreased through ammonification for all
the locations (Figures 5a, 5b). The final DON values after the incubation for all the
samples from the WWTP were between 1.61 and 2.60 mg/L as N, and their fractions of
TDN were between 6.5% and 8% (Figure 5a). This indicates that there was about the
same fraction of inert DON (not biodegradable) from each treatment process. Statistical
analyses showed that there is no significant difference (p > 0.05) on DON concentrations
in all the locations of the treatment train between the summer and winter months (data
not shown). For the summer months, statistically DON concentrations can be categorized
into three groups and within each group there is no significant difference (p > 0.05).
These three groups are before and after primary clarifiers, after BOD trickling filters and
after intermediate clarifiers, and the rest of the sampling locations. The statistical
grouping for the winter months is exactly the same as that for the summer months.
Biodegradable dissolved organic nitrogen
The BDON profile had a similar trend as that of the DON profile along the treatment
trains (Figure 5a). BDON removal occurred mainly in the trickling filters. BDON in the
raw wastewater and plant effluent was 6.18 and 1.78 mg/L respectively corresponding to
72% removal. The BOD trickling filters removed 43% of BDON and the nitrification
trickling filters removed 43% of BDON. About 12% removal of BDON was also
observed in the chlorination basins. However, the DON concentration did not change
after chlorination. Chlorinating DON can form disinfection by-products (DBPs) that
contain a nitrogen functional group (Pehlivanoglu-Mantas and Sedlak, 2006; Mitch and
Sedlak, 2002). In summer (chlorine disinfection was performed), a portion of BDON
could have changed into a form of DON (DBP) that was recalcitrant to biodegradation in
the incubation process. The BDON was found to be between 51% and 69% of DON after
various treatment units in the plant (Figure 5a). In other words, there was 31% or more of
biodegradable DON that was not treated by each of the treatment processes.
The BDON plots for the summer and winter months are presented in Figure 5c.
Statistically, BDON concentrations were not different (p > 0.05) between the summer and
winter months for all locations. During the summer months, the statistical grouping of
BDON concentrations from different treatment units is identical to those of DON
concentrations as discussed above. For the winter months, the statistical grouping of
BDON concentrations (for no significant difference) is as follows: 1) Before primary
clarifier to after BOD trickling filters; 2) After BOD tricking filters to after nitrification
filters; 3) After nitrification filters to after dechlorination.
Figure 5a presents DON biodegradability of DON (BDON/DON) for the entire year
sampling (18 weeks). The biodegradability varied between 52% and 68% for all 8
locations in the treatment train. The final effluent DON was 52% biodegradable which is
within a range of previously reported values (Pehlivanoglu-Mantas and Sedlak, 2006,
Sattayatewa et al., 2009). The DON biodegradability gradually decreased along the
17
treatment train which is logical. The ranges of DON biodegradability in the summer and
winter months were 57% to 71% and 41% to 65%, respectively. The differences in
BDON concentrations between the summer and winter months, although not statistically
different (p > 0.05), occurred mainly in the last two units of the treatment train. In the
summer months, the decrease in BDON/DON was due to a slight decrease in BDON after
chlorination (0.23 mg/L as N), while no change occurred in DON. BDON reduction was
higher during the winter months since the plant did not employ disinfection in winter.
The chlorination and dechlorination basins were simply used as storage tanks, thus
providing longer residence time for nitrifiers that did not settle in the secondary clarifiers
to continue to remove BDON and eventually DON. This analogy is supported by almost
the same magnitude of removal observed for BDON and DON in the final two locations
of the plant.
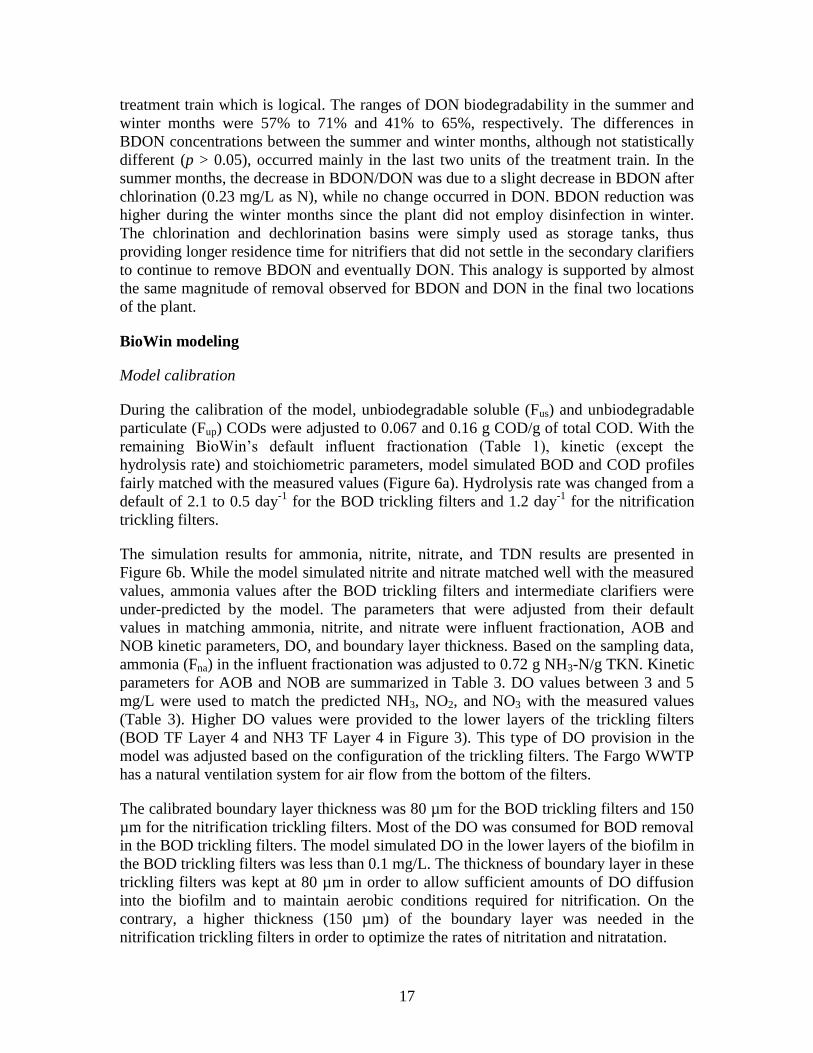
BioWin modeling
Model calibration
During the calibration of the model, unbiodegradable soluble (Fus) and unbiodegradable
particulate (Fup) CODs were adjusted to 0.067 and 0.16 g COD/g of total COD. With the
remaining BioWin’s default influent fractionation (Table 1), kinetic (except the
hydrolysis rate) and stoichiometric parameters, model simulated BOD and COD profiles
fairly matched with the measured values (Figure 6a). Hydrolysis rate was changed from a
default of 2.1 to 0.5 day-1
for the BOD trickling filters and 1.2 day-1
for the nitrification
trickling filters.
The simulation results for ammonia, nitrite, nitrate, and TDN results are presented in
Figure 6b. While the model simulated nitrite and nitrate matched well with the measured
values, ammonia values after the BOD trickling filters and intermediate clarifiers were
under-predicted by the model. The parameters that were adjusted from their default
values in matching ammonia, nitrite, and nitrate were influent fractionation, AOB and
NOB kinetic parameters, DO, and boundary layer thickness. Based on the sampling data,
ammonia (Fna) in the influent fractionation was adjusted to 0.72 g NH3-N/g TKN. Kinetic
parameters for AOB and NOB are summarized in Table 3. DO values between 3 and 5
mg/L were used to match the predicted NH3, NO2, and NO3 with the measured values
(Table 3). Higher DO values were provided to the lower layers of the trickling filters
(BOD TF Layer 4 and NH3 TF Layer 4 in Figure 3). This type of DO provision in the
model was adjusted based on the configuration of the trickling filters. The Fargo WWTP
has a natural ventilation system for air flow from the bottom of the filters.
The calibrated boundary layer thickness was 80 µm for the BOD trickling filters and 150
µm for the nitrification trickling filters. Most of the DO was consumed for BOD removal
in the BOD trickling filters. The model simulated DO in the lower layers of the biofilm in
the BOD trickling filters was less than 0.1 mg/L. The thickness of boundary layer in these
trickling filters was kept at 80 µm in order to allow sufficient amounts of DO diffusion
into the biofilm and to maintain aerobic conditions required for nitrification. On the
contrary, a higher thickness (150 µm) of the boundary layer was needed in the
nitrification trickling filters in order to optimize the rates of nitritation and nitratation.

18
Table 3. Calibrated kinetic, stoichiometric and operational parameters.
Parameter Default Value
1. Kinetic
AOB Max. spec. growth rate [1/d] 0.9 1.2
Substrate (NH4) half sat. [mg N/L] 0.7 0.7
NOB Max. spec. growth rate [1/d] 0.7 1
Substrate (NO2) half sat. [mg N/L] 0.1 0.1
2. Stoichiometric
AOB Yield [mg COD/mg N] 0.15 0.15
AOB Yield [mg COD/mg N] 0.09 0.09
N in biomass [mg N/mg COD] 0.07 0.07
3. Dissolved oxygen set points (mg/L)
BOD TF Layer 1 4.0
BOD TF Layer 2 4.0
BOD TF Layer 3 5.0
BOD TF Layer 4 5.0
NH3 TF Layer 1 3.0
NH3 TF Layer 2 3.0
NH3 TF Layer 3 4.0
NH3 TF Layer 4 4.0
Simulation results showed that partial nitrification (accumulation of nitrite) did not occur
in any of the BOD or nitrification trickling filter layers (data not presented here).
Moreover, the growth of anaerobic ammonia oxidizers was not observed in the
simulations. However, the model was able to simulate the loss of dissolved nitrogen,
which was observed as the difference between ammonia nitrogen removed and nitrate
nitrogen produced after the BOD and nitrification trickling filters in the measured data
(Figure 6b). The model simulations predicted this loss of dissolved nitrogen as the
production of particulate organic nitrogen.
TDN was calculated from the BioWin simulated TKN, nitrite and nitrate values. Similar
to ammonia removal, the model over-predicted the TDN removal in the BOD trickling
filters (Figure 6b). Overall, the TDN profile simulated by the model fairly matched with
the measured data. DON and BDON profiles are presented in Figure 6c. The simulation
results were quite agreeable with the measured data. The calibration parameters used in
matching the simulated values for DON and BDON with measured data were influent
fractionation parameters and kinetic parameters.

19
Figure 6. BioWin model simulated versus measured profiles of (a) BOD and COD, (b)
Dissolved ammonia, nitrite and nitrate, TDN and (c) DON and BDON data along the
treatment train of the City of Fargo WWTP.
(a)
(b)
(c)
20
The adjusted influent fractionation parameters were particulate organic nitrogen (Fnox) to
0.005 g N/g organic N, soluble unbiodegradable TKN (Fnus) to 0.065, and N:COD ratio
for unbiodegradable particulate COD (FupN) to 0.001. The majority of the measured
influent TDN was ammonia and organic nitrogen (> 99%). Hence, the measured TDN
value was used as the influent TKN for model simulations. Since the influent TKN was
dissolved, Fnox and FupN were assumed to be negligible. Measured DON and BDON
results showed that an average NBDON (DON - BDON) was 2.15 mg/L, which was
about 6.5% of the TDN (or Fnus = 0.065).
Hydrolysis rate and ammonification rate for heterotrophs were adjusted to match the
simulation results with the measured data; however, the values were different for the
BOD and nitrification filters. Calibrated hydrolysis rates were 0.5 day-1
for the BOD
trickling filters and 1.2 day-1
for the nitrification trickling filters, while the calibrated
ammonification rates were 0.01 L/mg N-day for the BOD trickling filters and 0.04 L/mg
N-day for the nitrification trickling filters. The slower ammonification rates indicate that
some of the hydrolyzed organic nitrogen could have been directly used for cell synthesis
(Warner, 1956). The measured data (from 28-day incubation) showed a variation in the
concentration of NBDON along the treatment processes. The NBDON was 2.57 ± 0.44
mg N/L in the influent and 1.62 ± 0.35 mg N/L in the effluent. However, BioWin
simulates NBDON as a constant fraction of the DON, which means that it does not
change along the treatment processes.
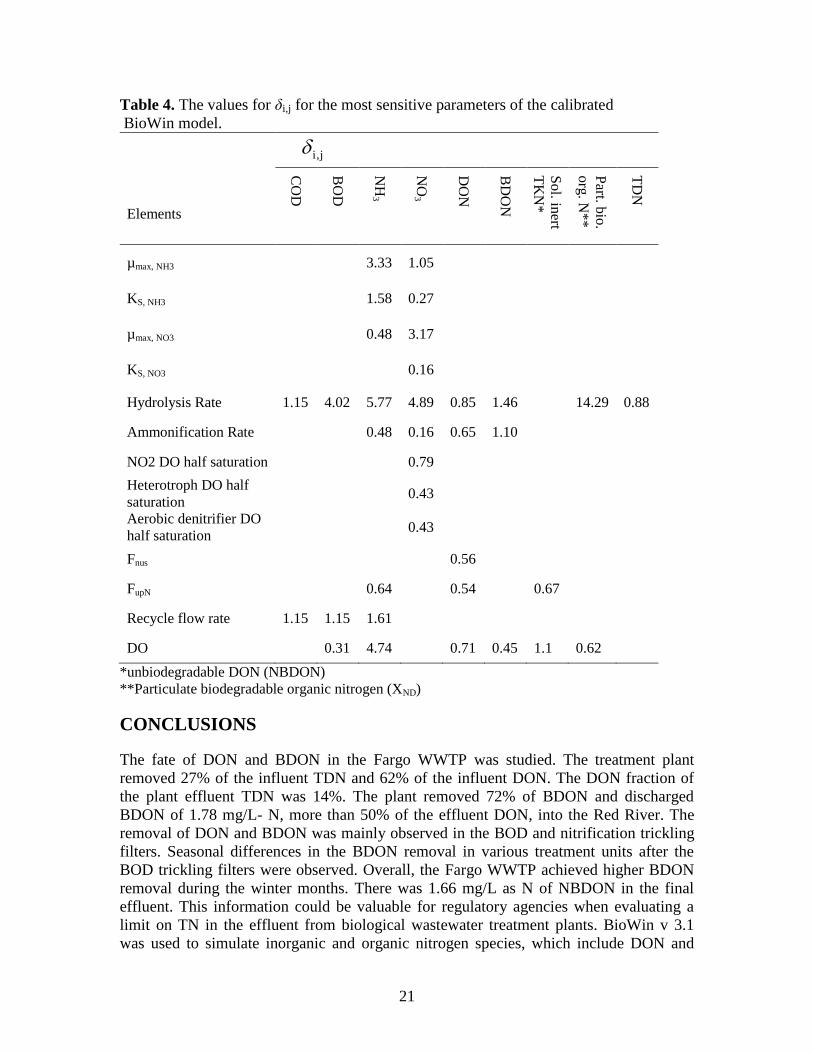
Sensitivity analysis
Results from the sensitivity analyses on calibrated BioWin model are summarized in
Table 4. The values for δi,j for model output parameter nitrite (NO2) and calibration
parameter KS,NO2 were less than 0.2. Hence, they were not included in Table 4. A large
number of calibrating parameters influenced the model output for ammonia, nitrate and
DON, while COD, BOD, NBDON, XND and TDN were influenced by two parameters
each.
Although the switching parameters were found to be less influential, they were necessary
to match the simulated values of nitrate with those of the measured. The influence
category for each calibrating parameter varied depending on the output variable. While
the maximum specific growth rate for AOB was found to be extremely influential for
ammonia, it was very influential for nitrate. The AOB half saturation constant was found
to be very influential for ammonia, but was influential for nitrate. Similarly, hydrolysis
rate was extremely influential for BOD, ammonia, nitrate, and particulate biodegradable
organic nitrogen, while it was very influential for COD and influential for DON and
TDN. Among operational variables, recycle flow rate had influence on ammonia alone,
while DO had varying levels of influence on most of the nitrogen species.
21
Table 4. The values for δi,j for the most sensitive parameters of the calibrated
BioWin model.
Elements
CO
D
BO
D
NH
3
NO
3
DO
N
BD
ON
So
l. inert
TK
N*
Part. b
io.
org
. N*
*
TD
N
µmax, NH3 3.33 1.05
KS, NH3 1.58 0.27
µmax, NO3 0.48 3.17
KS, NO3 0.16
Hydrolysis Rate 1.15 4.02 5.77 4.89 0.85 1.46
14.29 0.88
Ammonification Rate
0.48 0.16 0.65 1.10
NO2 DO half saturation
0.79
Heterotroph DO half
saturation 0.43
Aerobic denitrifier DO
half saturation 0.43
Fnus 0.56
FupN
0.64
0.54
0.67
Recycle flow rate 1.15 1.15 1.61
DO 0.31 4.74 0.71 0.45 1.1 0.62
*unbiodegradable DON (NBDON)
**Particulate biodegradable organic nitrogen (XND)
CONCLUSIONS
The fate of DON and BDON in the Fargo WWTP was studied. The treatment plant
removed 27% of the influent TDN and 62% of the influent DON. The DON fraction of
the plant effluent TDN was 14%. The plant removed 72% of BDON and discharged
BDON of 1.78 mg/L- N, more than 50% of the effluent DON, into the Red River. The
removal of DON and BDON was mainly observed in the BOD and nitrification trickling
filters. Seasonal differences in the BDON removal in various treatment units after the
BOD trickling filters were observed. Overall, the Fargo WWTP achieved higher BDON
removal during the winter months. There was 1.66 mg/L as N of NBDON in the final
effluent. This information could be valuable for regulatory agencies when evaluating a
limit on TN in the effluent from biological wastewater treatment plants. BioWin v 3.1
was used to simulate inorganic and organic nitrogen species, which include DON and
ji,

22
BDON, through the two-stage trickling filter process. For most of the nitrogen species,
the model was able to simulate with generalized kinetic and stoichiometric parameters
(without the need to locally specify for each treatment process). Hydrolysis and
ammonification rates for heterotrophic bacteria were the only two parameters that
differed between the two stages of the trickling filter processes and needed to be adjusted.
The model was found be most sensitive to hydrolysis and ammonification rates, and
maximum growth rates for AOB and NOB.
REFERENCES
APHA, 2005. Standard Methods for the Examination of Water and Wastewater, 21st ed.
American Public Health Association, Washington, DC.
Bilyk, K., Takács, I., Rohrbacher, J., Pitt, P., Latimer, R., Dold, P., 2008. Full-scale
dynamic testing advances fundamental understanding of denitrification filters.
Proceedings of the Water Environment Federation 81st Annual Technical Exhibition
& Conference, Chicago, Illinois.
Eiroa, M., Kennes, C., Veiga, M.C., 2005. Simultaneous nitrification and formaldehyde
biodegradation in an activated sludge unit. Bioresource Technology 96 (17),
1914−1918.
EnviroSim Associates Ltd., 2007. BioWin v 3.1 User Manual.
Grady, C.P.L., Daigger, G.T., Lim, H.C., 1999. Biological Wastewater Treatment, 2nd
ed.; Marcel Dekker, Inc., New York, NY.
Hanaki, K., Wantawin, C., Ohgaki, S., 1990. Effects of the activity of heterotrophs on
nitrification in a suspended-growth reactor. Water Research 24 (3), 289−296.
Henze, M., Grady, C.P.L., Gujer, W., Marais G.V.R., Matsuo, T., 1987. Activated Sludge
Model No. 1. IAWPRC Scientific and Technical Report no. 1, IAWPRC, London,
United Kingdom.
Henze, M., Gujer, W., Mino, T., Matsuo, T., Wentzel, M.C., Marais, G.V.R., van
Loosdrecht, M.C.M., 1999. Activated Sludge Model No 2D, ASM2D. Water Science
and Technology 39 (1), 165–182.
Jones, R., Takács, I., 2004. Modeling the impact of anaerobic digestion on the overall
performance of biological nutrient removal wastewater treatment plants. Proceedings
of the Water Environment Federation 77th Annual Technical Exhibition &
Conference, New Orleans, Louisiana.
Khan, E., Awobamise, M., Jones, K., Murthy, S., 2009. Method development for
measuring biodegradable dissolved organic nitrogen in treated wastewater. Water
Environment Research 81 (8), 779−787.

23
Makina, J., Pagilla, K., Czerwionka, K., Stensel, H.D., 2011. Modeling organic nitrogen
conversions in activated sludge bioreactors. Water Science and Technology 63 (7),
1418−1426.
Mitch, W.A., Sedlak, D.L., 2002. Factors controlling nitrosamine formation during
wastewater chlorination. Water Science and Technology 2 (3), 191−198.
Murthy, S., Jones, K., Baidoo, S., Pagilla, K., 2006. Biodegradability of dissolved
organic nitrogen: Adaptation of the BOD test. Proceedings of the Water
Environment Federation 79th Annual Technical Exhibition & Conference, Dallas,
Texas.
Pehlivanoglu, E., Sedlak, D.L., 2004. Bioavailability of wastewater-derived organic
nitrogen to alga Selenastrum capricornutum. Water Research 38 (14-15), 3189–
3196.
Pehlivanoglu-Mantas, E., Sedlak, D.L., 2006. Wastewater-derived dissolved organic
nitrogen: Analytical methods, characterization, and effects: A review. Critical
Review in Environmental Science and Technology 36 (3) 261–285.
Peterson, B., Gernaey, K., Henze, M., Vanrolleghem, P.A., 2003. Calibration of activated
sludge models: a critical review of experimental designs. In: Agathos, S.N. and
Reineke, W. Editors, Biotechnology for the Environment: Wastewater Treatment
and Modelling. Waste Gas Handling, Kluwer Academic Publishers, Dordrecht,
Netherlands.
Sattayatewa, C., Pagilla, K., 2008. Nitrogen species measurement in low total nitrogen
effluents. Proceedings of the Water Environment Federation 81st Annual Technical
Exhibition & Conference, Chicago, Illinois.
Sattayatewa, C., Pagilla, K., Pitt, P., Selock, K., Bruton, T., 2009. Organic nitrogen
transformations in a 4-stage Bardenpho nitrogen removal plant and bioavailability/
biodegradability of effluent DON. Water Research 43 (18), 4507–4516.
Takács, I., Bye, C.M., Chapman, K., Dold, P.L., Fairlamb, P.M., Jones, R.M., 2007. A
biofilm model for engineering design. Water Science and Technology 55 (8-9), 329–
336.
Ulteig Engineers, Inc., 2010. Facility Plan for Wastewater Treatment Facility, City of
Fargo, North Dakota. October 2010. UEI Project No. 10.00130, Fargo, North
Dakota.
Urgun-Demirtas, M., Sattayatewa, C., Pagilla, K.R., 2008. Bioavailability of dissolved
organic nitrogen in treated effluents. Water Environment Research 80 (5), 397–406.
Wang, R., Terada, A., Lackner, S., Smets, B.F., Henze, M., Xia, S., and Zhao, J., 2009.
Nitritation performance and biofilm development of co- and counter-diffusion

24
biofilm reactors: modeling and experimental comparison. Water Research 43 (10),
2699–2709.
Wanner, O., Reichert, P., 1996. Mathematical modeling of mixed-culture biofilms.
Biotechnology and Bioengineering 49 (2), 172–184.
Warner, A.C.I., 1956. The actual nitrogen sources for growth of heterotrophic bacteria in
non-limiting media. Biochemistry Journal 64 (1), 1–6.
WERF, 2009. Sustainable Technologies for Achieving Very Low Nitrogen and
Phosphorus Effluent Levels, Water Environment Research Foundation, Alexandria,
Virginia.