Embed Size (px)
Citation preview

BUY Market
SGX Nifty
(at 8.00 am IST)
Nifty Key Levels
BUY
BUY
BUY
Narnolia Financial Advisors Ltd | Market Strategy Desk
LALPATHLABS 13th June 2019
Scrip spurted from a low of 163, it showed pullback on upside marked
the high of marks and started consolidating there. This pullback rally
and consolidation has taken the form of inverted H&S price pattern on
an hourly chart where construction of right shoulder is going on.
Currently, it is awaiting for the breakout on upside so that it can
accelerate buying momentum further. Formation of Bullish Harami on
daily time frame of chart suggesting bullish momentum in the scrip.
Indicator and oscillator also showing conducive scenario in the coming
sessions. So based on the mentioned technical structure we expect that
price may see momentum on upside after giving the breakout above
173 and hit our target of 185 & 192 marks. BUY TATA MOTOR @ 168-
171 AND ON DIP TOWARDS 162-164 SL- 154 (CLOSING BASIS) TGT- 185,
192
ESCORTS 24th May 2019
Scrip is moving in a well defined ascending channel with multiple touch
point and appears to be having a strong support around 1020 levels as it
bounced back couple of time from the demand line. It also maintained
its uptrend on the long term chart and is trading well above its short and
long term moving averages. The momentum oscillator, RSI is also favors
the price pattern. One can accumulate the stock around 1075- 1065 &
1035-1045 for an upside target of 1200 & 1280 and a stop loss below
990.
Stocks is in the rising trend and it has taken multiple support at 540 on
weekly scale with good volume during its corrective fall. Last week
again it has taken support at 540 and near 200 SMA also with rising
volume. Momentum oscillator stochastic is trading in over sold zone and
trying to move up. Hence, we advice our client to buy in the range of
620-610 and on the decline towards 590-580 for the price targets of 662
and 683 with 540 on closing basis as stop loss.
S2 : 11425
Resistance R1 : 11760 R2 : 11820
TATAMOTOR 12th June 2019
Technical & Quant Update18-Jun-19
Edition 1333
Trading Calls
SBIN 17th June 2019 Value % Change
Market Outlook
Strong selloff is seen in all the sectors which caused Indian market to
tank on Monday amid concerns over liquidity crunch even as weak
global sentiment hurt investors’ risk appetite. The breakdown led to
the emergence of directional move on the downside. Sustainability
below 50-DMA can drag it down further into the previous bullish gap
zone between 11590 and 11425 levels, which ultimately looks like the
next leg of downswing. While upside hurdles are seen at 11760 &
11820 levels.
After contravention sustainability of consolidation chapter between 312
and 246, this script was on track to creation a flag pattern on weekly
chart, now it has given breakout of flag pattern. It also maintained its
uptrend on the long term chart and is trading well above its short and
long term moving averages. The momentum oscillator, RSI is also favors
the price pattern. One can accumulate the stock around 335-340 AND
ON DIP TOWARDS 305-310 SL 278 (CLOSING BASIS) TGT 398-450.
11720.50 0.19%
Support S1: 11590
1 Day 1 Week 1 Month 1 Year
Auto Components (0.98) (2.41) 0.03 (23.67)
Automobiles (1.83) (4.48) (2.94) (28.18)
Chemicals (1.21) (2.62) 3.14 0.95
Construction & Engineering (1.57) (1.79) 9.89 1.81
Construction Materials (2.11) (4.42) (0.15) 6.88
Diversified Financial Services (1.56) (2.82) 4.66 3.03
Electrical Equipment (0.98) (2.95) 6.69 1.13
Energy (2.51) (2.42) 0.59 9.92
Financials (1.32) (2.52) 3.47 8.23
Health Care (1.15) (2.55) (3.03) (11.88)
Household Durables (1.56) (2.95) 5.17 (7.92)
Household & Personal Products (0.59) (2.11) 3.56 3.23
Information Technology (0.29) (0.40) 3.88 16.26
Metals/Mining/Minerals (2.17) (2.09) 1.40 (20.27)
Telecom (2.35) (4.82) 2.79 (15.29)
Utilities (0.91) (1.46) 6.07 (2.94)
Sectoral Performance (%)
INDEX FUTURES
INDEX OPTIONS
STOCK FUTURES
STOCK OPTIONS (109)
FII DERIVATIVES POSITION FOR 17-June-2019
Net (Amt. in crs)
58
2,757
(490)
FII Buy(cr.) Sell(cr.) Net(cr.)
17-Jun-19 4,719 5,050 (331)
Jun-19 49,191 49,602 (411)
DII Buy(cr.) Sell(cr.) Net(cr.)
17-Jun-19 4,074 2,816 1,258
Jun-19 26,638 26,447 191
Institutional Turnover

Participant wise Open Interest In Equities Derivative (no. of contracts)
DII FII Pro Other DII FII Pro Other
Future Index 44258 151380 17650 153610 Future Index 24599 104427 47606 190266
Future Stock 14757 826267 161060 909704 Future Stock 942250 608675 94406 266457
Option Index Call 24397 194466 123246 750838 Option Index Call 0 76705 341315 674927
Option Index Put 80953 349887 143883 369802 Option Index Put 0 111725 188107 644693
Option Stock Call 0 18497 55877 347890 Option Stock Call 1848 24515 148097 247804
Option Stock Put 0 19721 57421 126185 Option Stock Put 0 16681 55802 130844
High ES & Low PS Stock Showing Strength
BSE Code 1 Month Return % BSE Code 1 Month Return %
500800 TATAGLOBAL 23.5 524742 CAPPL 25.6
532777 NAUKRI 17.3 500049 BEL 22.9
532921 ADANIPORTS 17.3 500266 MAHSCOOTER 22.6
500034 BAJFINANCE 15.5 505355 NESCO 18.9
532440 MPSLTD 15.3 532313 MAHLIFE 14.7
524200 VINATIORGA 13.3 511243 CHOLAFIN 12.9
523319 BALMLAWRIE 13.1 532430 BFUTILITIE 12.3
500490 BAJAJHLDNG 12.9 532814 INDIANB 12.1
500003 AEGISCHEM 12.4 531266 VSTTILLERS 11.7
532504 NAVINFLUOR 12.3 500710 AKZOINDIA 11.5
BSE Code BSE Code 1 Month Return %
502742 SINTEX (53.0) 517380 IGARASHI (29.0)
532617 JETAIRWAYS (44.8) 532612 INDOCO (17.1)
500111 RELCAPITAL (33.5) 532482 GRANULES (11.9)
511072 DHFL (29.1) 532296 GLENMARK (11.7)
500219 JISLJALEQS (28.9) 500257 LUPIN (9.7)
511431 VAKRANSOFT (23.7) 500124 DRREDDY (9.2)
532667 SUZLON (22.5) 501425 BBTC (8.3)
523204 ABAN (18.2) 500420 TORNTPHARM (8.3)
514034 JBFIND (17.8) 524404 MARKSANS (8.1)
532885 CENTRALBK (17.7) 502865 FORBESGOK (7.7)
* PS- Price Score is of a companiy is relative price performance in multiple time-frame
# Analysis shown here is only for companies with market cap more than Rs 1,000 Cr.
18-06-19
Narnolia Financial Advisors Ltd | Market Strategy Desk
Long Position Short Position
High ES & High PS Stock Maintaining Strength
NSE CODE NSE CODE
Low ES & Low PS Stock Maintaining Weakness Low ES & High PS Stock Showing Weakness
NSE CODE 1 Month Return % NSE CODE
* ES- Earning Score is average of EM (Earning Momentum defined as relative performance in terms of operating profit growth) and EQ
(Earning Quality defined as relative balance sheet strength in terms of debt and working capital)

No Date Type Buy/Sell Stock Entry1 Entry2 SL Tgt 1 Tgt 2
1 17-Jun-19 STDC BUY SBIN 337.5 307.5 278 398 450
2 13-Jun-19 STDC BUY LALPATHLABS 1070 1040 990 1200 1280
3 12-Jun-19 STDC BUY TATAMOTOR 169.5 163 154 185 192
4 24-May-19 STDC BUY ESCORTS 600 - 540 662 683
18-06-19
Narnolia Financial Advisors Ltd | Market Strategy Desk
STDC (4)
STDC / R25 Open Calls for 18-06-2019 (4)
17-Jun-19
NIFTY LEVEL
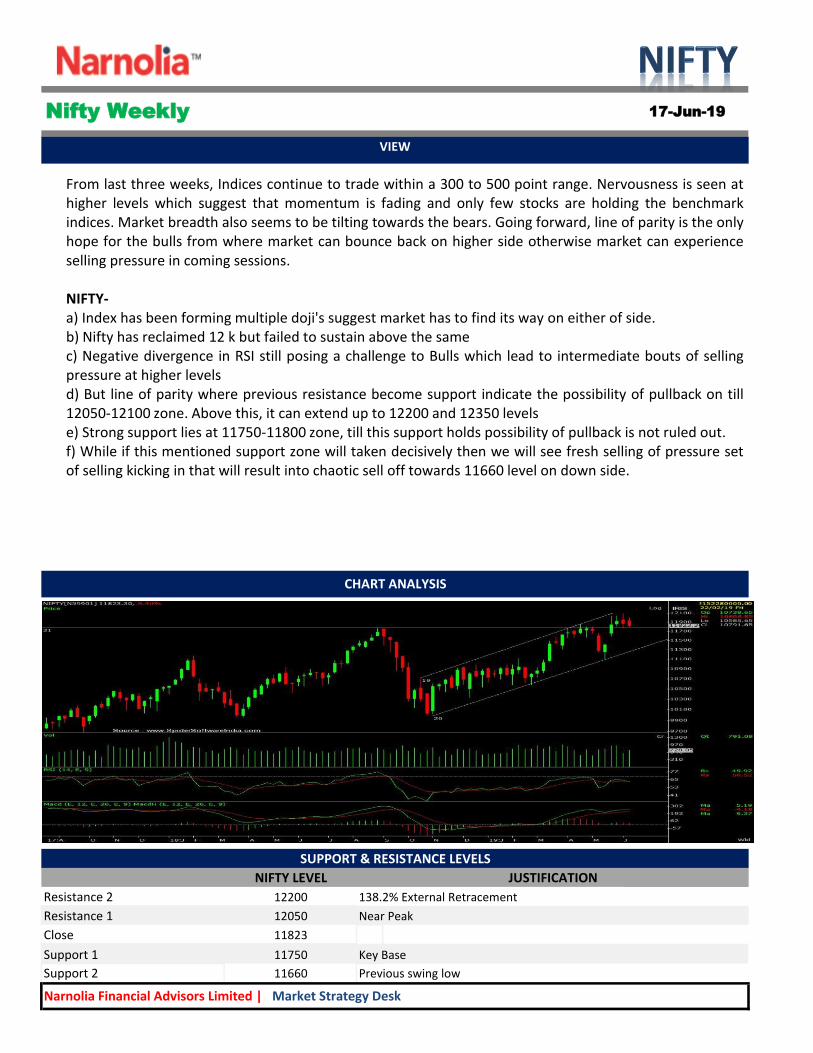
Resistance 2 12200 138.2% External Retracement
Resistance 1 12050 Near Peak
Close 11823
Support 1 11750 Key Base
Support 2 11660 Previous swing low
JUSTIFICATION
Narnolia Financial Advisors Limited | Market Strategy Desk
Nifty Weekly
VIEW
CHART ANALYSIS
SUPPORT & RESISTANCE LEVELS
From last three weeks, Indices continue to trade within a 300 to 500 point range. Nervousness is seen at higher levels which suggest that momentum is fading and only few stocks are holding the benchmark indices. Market breadth also seems to be tilting towards the bears. Going forward, line of parity is the only hope for the bulls from where market can bounce back on higher side otherwise market can experience selling pressure in coming sessions. NIFTY- a) Index has been forming multiple doji's suggest market has to find its way on either of side. b) Nifty has reclaimed 12 k but failed to sustain above the same c) Negative divergence in RSI still posing a challenge to Bulls which lead to intermediate bouts of selling pressure at higher levels d) But line of parity where previous resistance become support indicate the possibility of pullback on till 12050-12100 zone. Above this, it can extend up to 12200 and 12350 levels e) Strong support lies at 11750-11800 zone, till this support holds possibility of pullback is not ruled out. f) While if this mentioned support zone will taken decisively then we will see fresh selling of pressure set of selling kicking in that will result into chaotic sell off towards 11660 level on down side.

17-Jun-19
RESISTANCE/SUPPORT BANKNIFTY LEVEL
Resistance 2 31400
Resistance 1 31050
Close 30614
Support 1 30564
Support 2 30080
Narnolia Financial Advisors Limited | Market Strategy Desk
Banknifty Weekly
VIEW
CHART ANALYSIS
SUPPORT & RESISTANCE LEVELS
In line with our expectation Banknifty continued its downward movement throughout last week and after opening with a negative session, the index rose to make a weekly high of 31399. However it was unable to maintain at the higher level and continuous selling pressure forced the index to close with a net loss of 1.6% over its previous week's close. OBSERVATIONS: 1) Banknifty is trading above 50, 100 & 200 DMAs 2) A gap was left in between 29560 and 30111 in Banknifty. 3) RSI & Stochastic are approaching to their normal levels. According to the above observations it can be concluded that the short term and medium term trend of Banknifty is looking positive as the index is trading above all the major DMAs (50, 100, 200). Current profit booking process is also likely to complete very soon as the RSI & Stochastic are approaching to their normal levels. In the current week the index may come down further to fill the gap of (29560 - 30111) which was formed on 20th May 2019. However we should use this gap-filling activity as a fresh buying opportunity in Banknifty.

17-Jun-19
USDINR LEVEL
Resistance 2 70.70
Resistance 1 70.1
Close 69.83
Support 1 69
Support 2 68.40
Narnolia Financial Advisors Limited | Market Strategy Desk
USDINR Weekly
VIEW
CHART ANALYSIS
SUPPORT & RESISTANCE LEVELS
Sharp spike in crude oil prices amid tensions between saud arabia and Iran, limited production from Russia & OPEC and hiking of rates by the US FED are weighing on our domestic currency. Weakness can be expected in the coming sessions as ghost of trade dispute is still lingering which can create negative bias for the currency. TECHNICAL FACTORS- a) Pullback is seen after breaching the mentioned support of 69.30 mark b) Formation of bull marubozu on weekly chart suggest weakness for Rupee c) Moreover, bullish crossover in MACD also lending support to the price action of pair d) Any throwback above 70.10 can be used to initiate fresh long for a target of 70.70 and 71.50 marks f) A failure to sustain beyond the level would lead to strength for rupee and pair can drag to its lower level till 69 and 68.40 marks
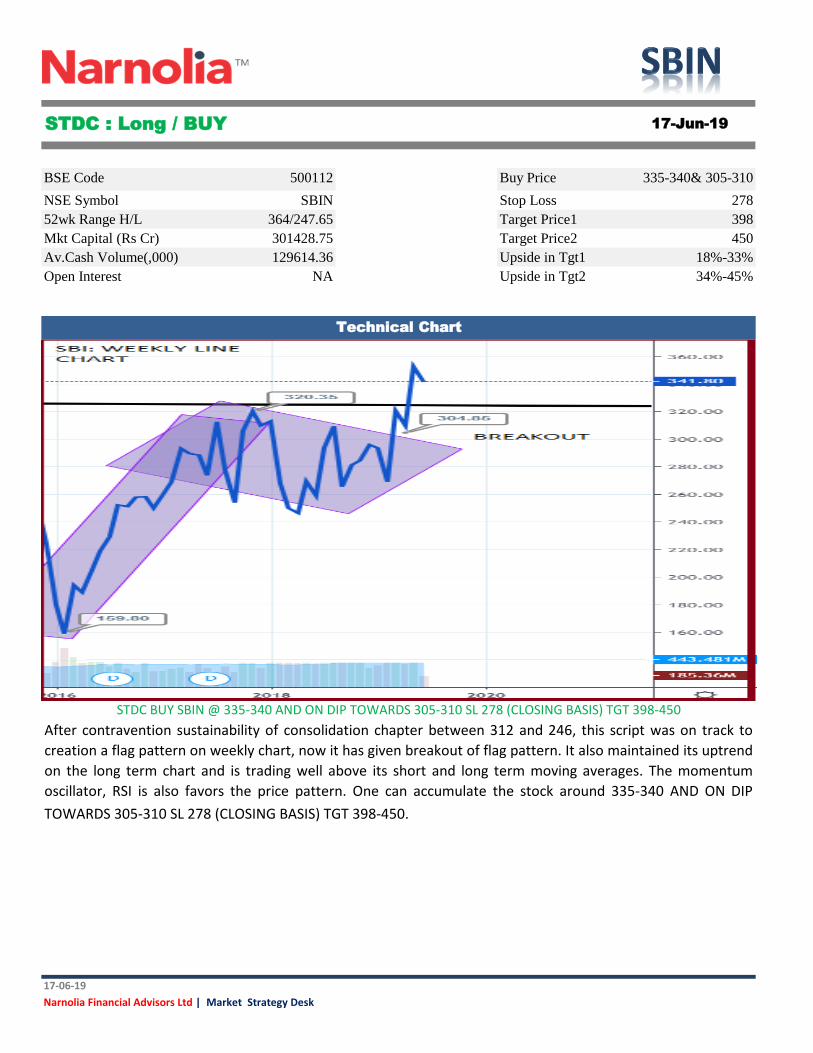
BSE Code 500112 Buy Price 335-340& 305-310
NSE Symbol SBIN Stop Loss 278
52wk Range H/L 364/247.65 Target Price1 398
Mkt Capital (Rs Cr) 301428.75 Target Price2 450
Av.Cash Volume(,000) 129614.36 Upside in Tgt1 18%-33%
Open Interest NA Upside in Tgt2 34%-45%
17-06-19
Narnolia Financial Advisors Ltd | Market Strategy Desk
STDC : Long / BUY 17-Jun-19
Technical Chart
STDC BUY SBIN @ 335-340 AND ON DIP TOWARDS 305-310 SL 278 (CLOSING BASIS) TGT 398-450
After contravention sustainability of consolidation chapter between 312 and 246, this script was on track to
creation a flag pattern on weekly chart, now it has given breakout of flag pattern. It also maintained its uptrend
on the long term chart and is trading well above its short and long term moving averages. The momentum
oscillator, RSI is also favors the price pattern. One can accumulate the stock around 335-340 AND ON DIP
TOWARDS 305-310 SL 278 (CLOSING BASIS) TGT 398-450.
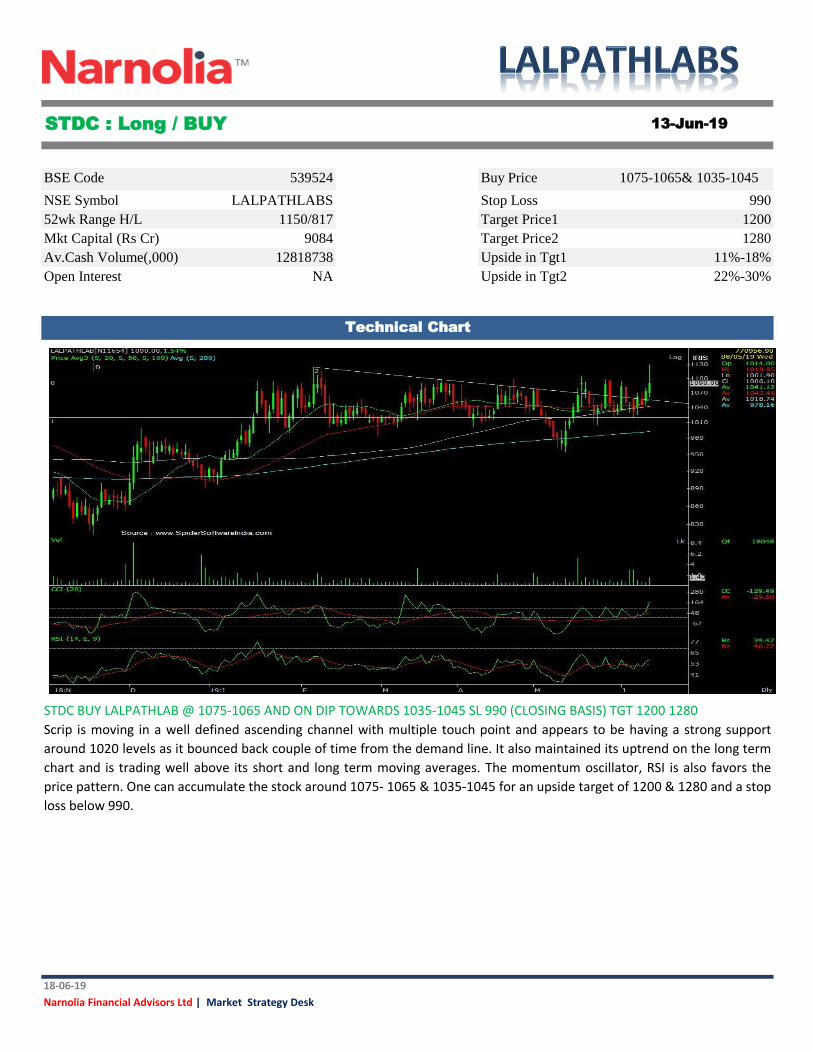
BSE Code 539524 Buy Price 1075-1065& 1035-1045
NSE Symbol LALPATHLABS Stop Loss 990
52wk Range H/L 1150/817 Target Price1 1200
Mkt Capital (Rs Cr) 9084 Target Price2 1280
Av.Cash Volume(,000) 12818738 Upside in Tgt1 11%-18%
Open Interest NA Upside in Tgt2 22%-30%
STDC BUY LALPATHLAB @ 1075-1065 AND ON DIP TOWARDS 1035-1045 SL 990 (CLOSING BASIS) TGT 1200 1280
18-06-19
STDC : Long / BUY 13-Jun-19
Technical Chart
Scrip is moving in a well defined ascending channel with multiple touch point and appears to be having a strong support
around 1020 levels as it bounced back couple of time from the demand line. It also maintained its uptrend on the long term
chart and is trading well above its short and long term moving averages. The momentum oscillator, RSI is also favors the
price pattern. One can accumulate the stock around 1075- 1065 & 1035-1045 for an upside target of 1200 & 1280 and a stop
loss below 990.
Narnolia Financial Advisors Ltd | Market Strategy Desk

BSE Code 500570 Buy Price 168-171 & 162-164
NSE Symbol TATAMOTOR Stop Loss 154
52wk Range H/L 313.5/141.9 Target Price1 185
Mkt Capital (Rs Cr) 48796 Target Price2 192
Av.Cash Volume(,000) 12818738 Upside in Tgt1 11%-18%
Open Interest NA Upside in Tgt2 22%-30%
STDC BUY TATA MOTOR @ 168-171 AND ON DIP TOWARDS 162-164 SL- 154 (CLOSING BASIS) TGT- 185, 192
18-06-19
STDC : Long / BUY 12-Jun-19
Technical Chart
Scrip spurted from a low of 163, it showed pullback on upside marked the high of marks and started consolidating there.
This pullback rally and consolidation has taken the form of inverted H&S price pattern on an hourly chart where
construction of right shoulder is going on. Currently, it is awaiting for the breakout on upside so that it can accelerate buying
momentum further. Formation of Bullish Harami on daily time frame of chart suggesting bullish momentum in the scrip.
Indicator and oscillator also showing conducive scenario in the coming sessions. So based on the mentioned technical
structure we expect that price may see momentum on upside after giving the breakout above 173 and hit our target of 185
& 192 marks. BUY TATA MOTOR @ 168-171 AND ON DIP TOWARDS 162-164 SL- 154 (CLOSING BASIS) TGT- 185, 192
Narnolia Financial Advisors Ltd | Market Strategy Desk
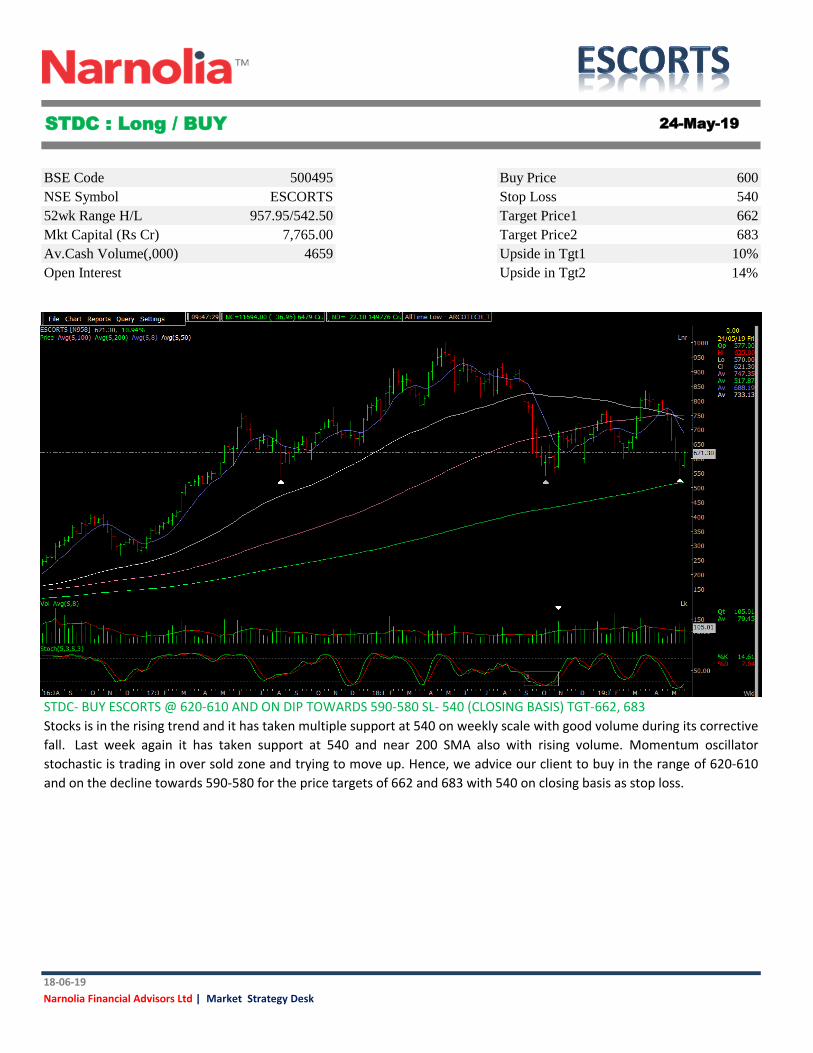
BSE Code 500495 Buy Price 600
NSE Symbol ESCORTS Stop Loss 540
52wk Range H/L 957.95/542.50 Target Price1 662
Mkt Capital (Rs Cr) 7,765.00 Target Price2 683
Av.Cash Volume(,000) 4659 Upside in Tgt1 10%
Open Interest Upside in Tgt2 14%
STDC- BUY ESCORTS @ 620-610 AND ON DIP TOWARDS 590-580 SL- 540 (CLOSING BASIS) TGT-662, 683
18-06-19
STDC : Long / BUY 24-May-19
Technical Chart
Stocks is in the rising trend and it has taken multiple support at 540 on weekly scale with good volume during its corrective
fall. Last week again it has taken support at 540 and near 200 SMA also with rising volume. Momentum oscillator
stochastic is trading in over sold zone and trying to move up. Hence, we advice our client to buy in the range of 620-610
and on the decline towards 590-580 for the price targets of 662 and 683 with 540 on closing basis as stop loss.
Narnolia Financial Advisors Ltd | Market Strategy Desk

18-Apr-18
18-06-19
Narnolia Financial Advisors Ltd - Market Strategy Desk
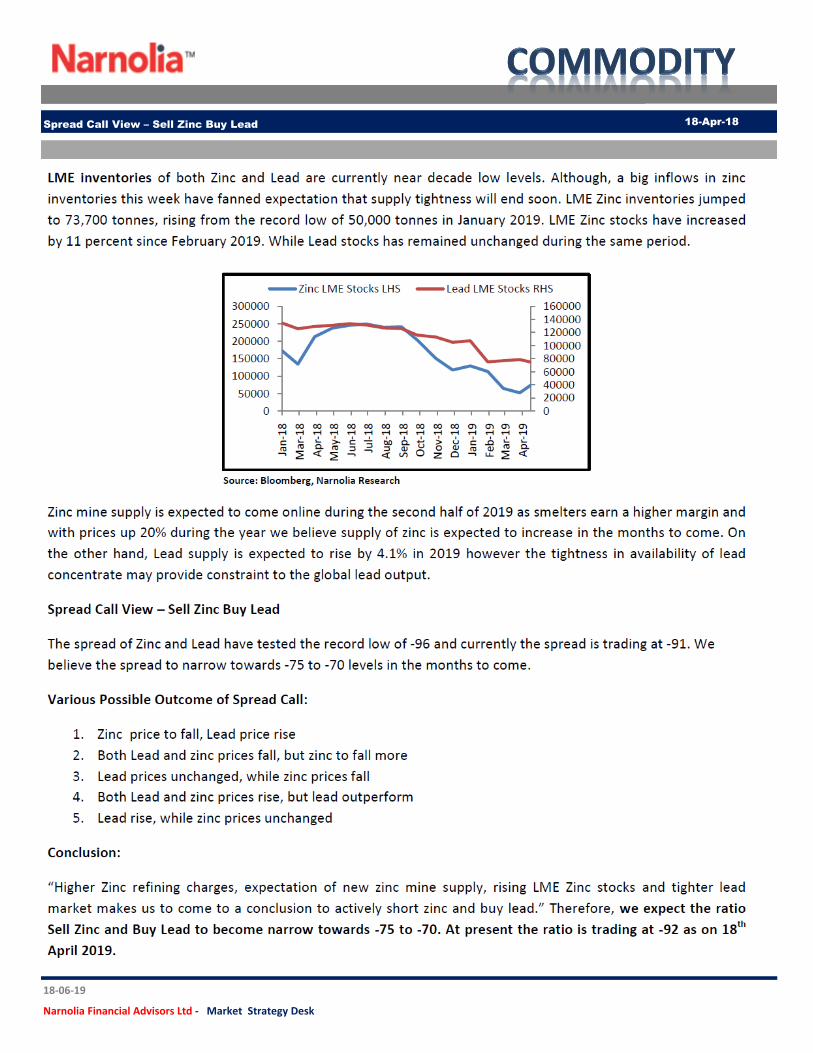
Spread Call View – Sell Zinc Buy Lead
18-Apr-18
18-06-19
Spread Call View – Sell Zinc Buy Lead
Narnolia Financial Advisors Ltd - Market Strategy Desk

Narnolia Financial Advisors Ltd. is a SEBI registered Research Analyst having SEBI Registration No. INH300006500. The Company/Analyst (s) does/do not have any holding in the stocks discussed but these stocks may have been recommended to clients in the past. Clients of Narnolia Financial Advisors Ltd. may be holding aforesaid stocks. The stocks recommended are based on our analysis which is based on information obtained from public sources and sources believed to be reliable, but no independent verification has been made nor is its accuracy or completeness guaranteed. Disclosures: Narnolia Financial Advisors Ltd. (NFAL) (FormerlyMicrosec Capital Ltd.) is a SEBI Registered Research Analyst having registration no. INH300006500. NFALis engaged in the business of providing Stock Broking, Depository Participant, Merchant Banking, Portfolio Management & distribution of various financial products. Details of associate entities of NFAL is available on the website at www.narnolia.com No penalties have been levied on NFAL by any Regulatory/Statutory authority. NFAL, it’s associates, Research Analyst or their relative may have financial interest in the subject company. NFAL and/or its associates and/or Research Analyst may have beneficial ownership of 1% or more securities in the subject company at the end of the month immediately preceding the date of publication of the Research Report. NFAL and its associate company(ies), their directors and Research Analyst and their relatives may; (a) from time to time, have a long or short position in, act as principal in, and buy or sell the securities or derivatives thereof of companies mentioned herein. (b) be engaged in any other transaction involving such securities and earn brokerage or other compensation or act as a market maker in the financial instruments of the company(ies) discussed herein or act as an advisor or lender/borrower to such company(ies) or may have any other potential conflict of interests with respect to any recommendation and other related information and opinions.; however the same shall have no bearing whatsoever on the specific recommendations made by the analyst(s), as the recommendations made by the analyst(s) are completely independent of the views of the associates of NFAL even though there might exist an inherent conflict of interest in some of the stocks mentioned in the research report. Research Analyst may have served as director/officer, etc. in the subject company in the last 12 month period. NFAL and/or its associates may have received compensation from the subject company in the past 12 months. In the last 12 months period ending on the last day of the month immediately preceding the date of publication of this research report, NFAL or any of its associates may have: a) managed or co-managed public offering of securities from subject company of this research report, b) received compensation for investment banking or merchant banking or brokerage services from subject company of this research report, c) received compensation for products or services other than investment banking or merchant banking or brokerage services from the subject company of this research report. d) Subject Company may have been a client of NFAL or its associates during 12 months preceding the date of distribution of the research report. NFAL and it’s associates have not received any compensation or other benefits from the Subject Company or third party in connection with the research report. NFAL and / or its affiliates may do and seek to do business including Investment Banking with companies covered in the research reports. As a result, the recipients of this report should be aware that NFAL may have a potential conflict of interest that may affect the objectivity of this report. Compensation of Research Analysts is not based on any specific Merchant Banking, Investment Banking or Brokerage service transactions. Research Analyst’s views on Subject Company may vary based on Fundamental research and Technical Research. Proprietary trading desk of NFAL or its associates maintains arm’s length distance with Research Team as all the activities are segregated from NFAL research activity and therefore it can have an independent view with regards to subject company for which Research Team have expressed their views. Analyst Certification The views expressed in this research report accurately reflect the personal views of the analyst(s) about the subject securities or issues, and no part of the compensation of the research analyst(s) was, is, or will be directly or indirectly related to the specific recommendations and views expressed by research analyst(s) in this report. Disclosure of Interest Statement- A graph of daily closing prices of securities is available at www.nseindia.com, www.bseindia.com. Correspondence Office Address: Arch Waterfront, 5th Floor, Block GP, Saltlake, Sector 5, Kolkata 700 091; Tel No.: 033-40541700; www.narnolia.com. Registered Office Address: Marble Arch, Office 201, 2nd Floor, 236B, AJC Bose Road, Kolkata 700 020; Tel No.: 033-4050 1500; www.narnolia.com Compliance Officer: Manish Kr Agarwal, Email Id: [email protected], Contact No.:033-40541700. Registration details of Company: Narnolia Financial Advisors Ltd. (NFAL): SEBI Stock Broker Registration: INZ000166737 (NSE/BSE/MSEI); NSDL/CDSL: IN-DP-380-2018; Research Analyst: INH300006500, Merchant Banking: (Registration No.: INM000010791), PMS: (Registration No.: INP000002304), AMFI Registered Mutual Fund distributor: ARN 3087 Registration Details of Group entities: G. Raj & Company Consultants Ltd (G RAJ)-BSE Broker INZ260010731; NSDL DP: IN-DP-NSDL-371-2014 || Narnolia Commerze Limited (Formerly Microsec Commerze Ltd.)-MCX/NCDEX Commodities Broker: INZ000051636 || NarnoliaVelox Advisory Ltd.- SEBI Registered PMS: INP000005109 || Eastwind Capital Advisors Pvt Ltd. (EASTWIND)-SEBI Registered Investment Adviser: INA300005439 || Narnolia Insurance Brokers Limited (Formerly Microsec Insurance Brokers Ltd.)-IRDA Licensed Direct Insurance Broker (Life & Non-Life) Certificate No. 134, License No. DB046/02 || Narnolia Securities Ltd. (NSL)-AMFI Registered Mutual Fund distributor: ARN 20558, PFRDA NPS POP: 27092018 || Narnolia Capital Advisors Pvt. Ltd. - RBI Registered NBFC:B.05.02568. Disclaimer: This report has been prepared by Narnolia Financial Advisors Ltd. (NFAL)and is meant for sole use by the recipient and not for public circulation. The report and information contained herein is strictly confidential and may not be altered in any way, transmitted to, copied or distributed, in part or in whole, to any other person or to the media or reproduced in any form, without prior written consent of NFAL. The report is based on the facts, figures and information that are considered true, correct, reliable and accurate. The intent of this report is not recommendatory in nature. The information is obtained from publicly available media or other sources believed to be reliable. Such information has not been independently verified and no guaranty, representation of warranty, express or implied, is made as to its accuracy, completeness or correctness. All such information and opinions are subject to change without notice. The report is prepared solely for informational purpose and does not constitute an offer document or solicitation of offer to buy or sell or subscribe for securities or other financial instruments for the clients. Nothing in this report constitutes investment, legal, accounting and tax advice or a representation that any investment or strategy is suitable or appropriate to your specific circumstances.The securities discussed and opinions expressed in this report may not be suitable for all investors, who must make their own investment decisions, based on their own investment objectives, financial positions and needs of specific recipient. Certain transactions -including those involving futures, options, another derivative products as well as non-investment grade securities - involve substantial risk and are not suitable for all investors.Each recipient of this document should make such investigations as it deems necessary to arrive at an independent evaluation of an investment in the securities of companies referred to in this document (including the merits and risks involved), and should consult his/her/its own advisors to determine the merits and risks of such an investment. Though disseminated to all the customers simultaneously, not all customers may receive this report at the same time. NFAL will not treat recipients as customers by virtue of their receiving this report. Neither the Company, not its directors, employees, agents or representatives shall be liable for any damages whether direct or indirect, incidental, special or consequential including lost revenue or lost profits or lost opportunities that may arise from or in connection with the use of the information/report. The person accessing this information specifically agrees to exempt NFAL or any of its affiliates or employees from, any and all responsibility/liability arising from such misuse and agrees not to hold NFAL or any of its affiliates or employees responsible for any such misuse and further agrees to hold NFAL or any of its affiliates or employees free and harmless from all losses, costs, damages, expenses that may be suffered by the person accessing this information due to any errors and delays. This report is not directed or intended for distribution to or use by any person or entity resident in a state, country or any jurisdiction, where such distribution, publication, availability or use would be contrary to law, regulation or which would subject NFAL & its group companies to registration or licensing requirements within such jurisdictions.
Analyst’s ownership of the stocks mentioned in the Report NIL