Embed Size (px)
Citation preview
Technical Memorandum No. 1 Arsenic Mitigation Feasibility Study
Farr West Engineering FINAL Plumas Eureka Community Services District
2 Arsenic Mitigation – Preferred Alternative Evaluation
2.0 BACKGROUND
Since the U.S. EPA reduced the maximum contaminant level (MCL) for arsenic from 50 µg/L to
10 µg/L in 2006, the District has been out of compliance with primary drinking water standards.
Under a compliance order from the State Water Resource Control Board (SWRCB), the District
commissioned Stantec Consulting Services, Inc. (Stantec) to prepare a Preliminary Engineering
Report (PER) to identify a preferred arsenic mitigation project. In October of 2015, the PER
prepared by Stantec was submitted to the State of California Division of Drinking Water (DDW)
and SWRCB for review. The DDW determined that the recommended alternative for arsenic
compliance was not shown to be the “most cost effective and expeditious solution to bring the
District into compliance with the requirements of the Compliance Order…” and should not be
considered for State funding.
The DDW has since requested the District provide an acceptable feasibility analysis of alternatives
to allow funding allocation for the design, construction and operation of an arsenic mitigation
solution that will meet regulatory standards. The primary goal of this TM is to identify a cost
effective arsenic mitigation method that is compliant with the California SWRCB and meets all
California Environmental Quality Act (CEQA) requirements by a compliance order date of
November 1, 2017.
3.0 INTRODUCTION
The District provides water and sewer service to the community around the Plumas Pines Golf
Course in Plumas County, California. Out of the 563 properties that receive water services from
the District, 315 receive sewer services as well. Two groundwater wells, Well 1-B and Well 2,
located on the Plumas Pines Golf Course serve as the District’s water supply. For the majority of
the year, the District’s water supply contains levels of arsenic (As) higher than the MCL standard
of 10 parts per billion (ppb) will allow. Arsenic levels in the water supply range from 5 ppb to 22
ppb, with higher levels primarily occurring during the summer months. Levels of iron (Fe), 158
ppb to 1022.8 ppb, and manganese (Mn), 64.5 ppb to 106.9 ppb, which exceed secondary MCLs,
are present in the water as well. To address the contamination issues, Farr West has developed a
list of criteria to evaluate the most feasible treatment alternative.
The scope of work for the complete alternatives analysis includes:
• Non-economic evaluation,
• Economic evaluation,
• Pilot Study, and
• Preferred alternative description.
4.0 ARSENIC MITIGATION METHOD ALTERNATIVES
Potential mitigation methods were developed by Farr West, and are summarized in Table 1 below.
The mitigation methods presented are planning level at this time and will be further developed and
evaluated during the detailed evaluation.

Technical Memorandum No. 1 Arsenic Mitigation Feasibility Study
Farr West Engineering FINAL Plumas Eureka Community Services District
3 Arsenic Mitigation – Preferred Alternative Evaluation
Table 1 – Arsenic Contamination Mitigation Methods
Number Alternative
1 Adsorption
2 Coagulation and Filtration
3 No Action
4 Intertie with Graeagle Water Company
5 New Well Site
6 Well Rehabilitation/Modification
4.1 DESCRIPTION OF MITIGATION METHODS
Adsorption
In this alternative, the District would utilize adsorptive media to treat the high-levels of As. An
adsorption treatment plant could be located at any of the location alternatives. Adsorptive
technology utilizes a filter media with a strong affinity for arsenic under natural pH (under 8.0)
conditions. Typically, the adsorptive treatment process is not highly dependent on chemical
additives and requires less frequent backwashing than that of other technologies.
The process is highly effective as long as there is sufficient surface area on the media for the
arsenic ions to adhere. The process is also highly susceptible to fouling from organics, Mn,
phosphates, silica, and other metals. Regeneration of the filter media is either limited or not a
viable option for filters which exhibit poor As reduction or contaminant breakthrough. Adsorptive
medias are typically replaced more frequently than medias used in other technologies, which
results in increased operations and maintenance (O&M) costs.
Due to the water quality at both District wells, adsorptive technology would only be a feasible
treatment technology as a polishing process downstream of a sand or greensand filter process.
These filters ahead of the adsorptive media are necessary to remove the secondary contaminants
(i.e. Fe and Mn). While these upstream filters are very similar to those in the coagulation/filtration
technology approach, significant chemical addition should not be needed to effectively remove
constituents which may compete for media sites or foul the media. Annual O&M costs associated
with chemical addition and pH adjustment are expected to be lower for adsorptive technology.
However, O&M costs for media replacement are expected to be much greater than that of
coagulation/filtration. To accommodate an adsorption treatment plant, telemetry controls, and
necessary piping, a building size of 1,200 sf. is needed.
Coagulation and Filtration
For this alternative, the District would utilize a coagulation/filtration treatment process to remove
high levels of As, Fe and Mn from the drinking water supply. A coagulation/filtration treatment
plant could be located at any of the location alternatives. The process requires pre-oxidation of Fe
and As and the co-precipitation of As to a ferric precipitate. This coagulant is then filtered from
the water supply through a sand, greensand, or Manganese Dioxide (MnO2) filter media. Mn is

Technical Memorandum No. 1 Arsenic Mitigation Feasibility Study
Farr West Engineering FINAL Plumas Eureka Community Services District
4 Arsenic Mitigation – Preferred Alternative Evaluation
also removed in the same filter media by way of adsorption. Although, more significant pH
adjustment may be required to effectively remove Mn.
High levels of Fe aid in the removal of As, which is applicable to this water supply.
Coagulation/filtration provides the most efficient results when pH levels fall in the range of 6-7.
Since the District’s groundwater is just under a pH of 8, frequent pH adjustments may be necessary
for optimal contaminant removal. This treatment technology would provide the District with the
ability to treat for varying levels of water contamination. Additionally, it will allow the District to
treat down to a specific concentration of As (e.g. 7 or 8 ppb), whereas adsorption technology will
treat down to the lowest level possible (e.g. <2 ppb) prior to breakthrough or media exhaustion.
Coagulation/filtration will also require more frequent backwashing to keep filters effective and
head loss across the treatment plant to a minimum. To accommodate a coagulation/filtration
treatment plant, telemetry controls, and necessary piping, a building size of 1,200 sf. is needed.
No Action
In this alternative, the District would not make any modifications to water quality or to how water
is pumped from the existing groundwater sources. This alternative would result in non-compliance
with drinking water quality standards and potential regulatory action from the California State
Water Resources Control Board.
Intertie with Graeagle Water Company
In this alternative, the District would coordinate with the Graeagle Water Company to provide a
master metered connection to the Graeagle Water Company’s existing system. An intertie would
require obtaining a United States Forest Service (USFS) special use permit, as Plumas County
does not own the Johnsville-Graeagle Road right-of-way (ROW). The feasibility of this alternative
is directly dependent on proving that no other mitigation alternative is available to the District.
New Well Site
In this alternative, a new well would be drilled in a location where raw water quality meets all
drinking water standards and production capacity meets the annual demands of the existing system.
Areas for the material staging and new well location must be considered and identified. There are
additional factors that need to be taken into consideration, such as finding favorable hydrogeologic
conditions, determining water right allocations, and finding a desirable area for the well that would
not impact the golf course or existing land uses. Drilling a new well and connecting it to the
existing water system would take one to two years to accomplish.
Well Rehabilitation/Modification
In this alternative, either Well 1-B or Well 2 must be rehabilitated or modified to produce source
water which meets all drinking water standards. There are mitigation options available to modify
the existing well structure if the condition of existing well components is contributing to the
fouling of source water or the ability to isolate zones of favorable water quality and production
yield. Deeper wells with large, multiple-screened zones are preferred for rehabilitation over
shallow wells with only a single-screened interval.

Technical Memorandum No. 1 Arsenic Mitigation Feasibility Study
Farr West Engineering FINAL Plumas Eureka Community Services District
5 Arsenic Mitigation – Preferred Alternative Evaluation
4.2 PRELIMINARY EVALUATION METHOD - MITIGATION ALTERNATIVES
The purpose of the preliminary evaluation is to identify any alternative which is not feasible and
does not require further development or evaluation. Each alternative deemed infeasible in the
preliminary evaluation will have to exhibit a fatal flaw due to either constructability, a potential
for continued non-compliance, or result in a schedule which greatly exceeds the current
compliance date of November 1, 2017.
Each alternative eliminated in this stage will be described below:
No Action
Taking no action is an unacceptable alternative since the system will perpetually remain out of
compliance with drinking water standards. This alternative has been eliminated from further
consideration.
Intertie with Graeagle Water Company
Tying into the Graeagle Water Company’s system would require a service agreement between the
District and the Graeagle Water Company, approval of the agreement by the Public Utilities
Commission (PUC), the potential dedication of groundwater rights to the Graeagle Water
Company, and construction of an 8,000 linear feet (lf) transmission main from Jamison Road to
Madera Lake Road. Related items, including the length of time it could take to receive PUC
approval and the length of time it would take to receive a special use permit from the USFS for
the transmission main are significant flaws of this alternative. The special use permit would also
require an absence of other feasible alternatives which may be extremely difficult to prove. For
these reasons, this alternative will no longer be considered as feasible.
New Well Site
There is little reason to believe that drilling a new well would result in a water source which meets
all drinking water standards. First, the two test wells drilled in 2012 yielded aquifers with poor
water quality and low production yield. While additional study could be made to identify a third
or fourth test location, the length of time it would take to develop and connect a new groundwater
source could take anywhere from 12 to 18 months. There are additional factors that would need
to be taken into consideration, such as determining water rights allocation, finding a desirable area
for the well that will not impact the golf course, and a very small probability that a highly
productive, reliable aquifer will be identified. For these reasons, this alternative will no longer be
considered as feasible.
Well Rehabilitation/Modification
Well 1-B is 12 in. in diameter, 270 ft. deep and contains a single 60 ft. screened interval at the
bottom of the well column. The well was recently repaired in 2013 with a 10-in. sleeve. The
existing condition and construction of Well 1-B does not lend itself to any mitigation alternative
which could result in improved water quality.
Technical Memorandum No. 1 Arsenic Mitigation Feasibility Study
Farr West Engineering FINAL Plumas Eureka Community Services District
6 Arsenic Mitigation – Preferred Alternative Evaluation
Well 2 is a 250 ft., 14-in. diameter groundwater well which has a single 60 screened interval from
180 ft. to 240 ft. below the ground surface. Historically, Well 2 has not shown any structural
degradation or failure. However, due to the limitations of the single screened interval it is not
realistic to expect improved water quality as a result of modifications to the existing well.
For these reasons, this alternative will no longer be considered as feasible.
4.3 PILOT STUDY RESULTS
In the fall of 2016 it was determined that the coagulation/filtration treatment technology was
preferred to that of the adsorptive technology for the following reasons:
1. Coagulation/filtration systems are expected to have lower annual O&M costs and longer
life cycles than adsorptive systems.
2. The duration of a pilot study for coagulation/filtration systems is significantly shorter than
that for adsorption. Pilot studies for adsorptive media can run between 60 and 90 days.
Therefore, it was mutually agreed that a pilot study of a coagulation/filtration system would
provide verification of a treatment process and will best meet project schedule requirements. A
pilot study of coagulation/filtration treatment technology on the District’s water supply was
conducted at Well 1-B from 11/2/16 to 11/8/16 and at Well 2 from 11/10/16 to 11/18/16 by Linkan
Engineering (Linkan). Well 1-B was found to be in regulatory compliance for As and Fe but not
for Mn at the time of testing. Mn was successfully treated below the SMCL during the pilot testing
with As and Fe concentrations remaining below the MCL. With Well 2 being out of compliance
for all three constituents, the conditions for verification of treatment technology were much better
than those at Well 1-B. Three observations were made during pilot testing of Well 2:
1. The raw water Fe concentration ranged from 0.3 to 0.5 mg/L. While the pilot skid removed
Fe as part of the addition of ferric chloride (FeCl), Fe remained at levels above 0.3 mg/L
in the treated effluent stream throughout the testing. This remaining Fe was determined to
be naturally occurring and additional testing would be required to identify the form of Fe
in the raw water supply.
2. The treatment medias removed constituents better after 2 to 6 hours of testing than they did
immediately after a backwash cycle.
3. There was only a single test result where As was reduced to below 10 ppb after the FeCl
addition was eliminated. This condition is atypical of a classic coagulation/filtration
process.
The results of this pilot study were deemed inconclusive and a subsequent scope of work was
prepared for additional study in a laboratory setting. Detailed findings of this study can be found
in Appendix A.
The second phase of pilot testing was completed on April 18, 2017 and resulted in four key findings
related to the treatment of the District’s raw water supply.

Technical Memorandum No. 1 Arsenic Mitigation Feasibility Study
Farr West Engineering FINAL Plumas Eureka Community Services District
7 Arsenic Mitigation – Preferred Alternative Evaluation
1. The Fe present in the Well 2 raw water was found to be colloidal iron.
2. The most effective process for removing the colloidal iron is to oxidize the Fe with
hydrogen peroxide, add a polymer, and filter out the Fe with a 5-micron filter.
3. It was determined that the reason As passed through the filter media when FeCl was added
was high phosphate concentrations.
4. As was successfully reduced below 10 ppb for five separate test results totaling over 26-
hours of column testing of MnO2 media with zero FeCl addition.
However, these results should not be interpreted as a proof of concept of coagulation/filtration
technology. Even though arsenic was being reduced below 10 ppb, it was through an adsorptive
process and not through filtration. The MnO2 media is not capable of providing adequate removal
for extended periods of time (e.g. one or more years). Therefore, it has been determined that a
dual-stage process of oxidation/filtration and adsorption polishing be implemented for the full-
scale facility. The adsorptive media type will be selected as a part of the preliminary design phase
for the Water Treatment Plant (WTP).
5.0 WATER TREATMENT PLANT LOCATION ALTERNATIVES
In order to construct a dual-stage treatment facility, an acceptable location must be identified for
construction. Thirteen potential site alternatives were developed by Farr West and the District,
and are summarized in Table 2 below and in Figure 1. The location alternatives will be further
explored during the detailed evaluation.
Table 2 – Water Treatment Plant Alternative Locations
Site Description
1 Poplar Valley-Cottonwood Drive
2 208 Poplar Valley
3 12 Evergreen Circle
4 6 Pine Tree Court
5 103 Lundy Lane
6 118 Lundy Lane
7 200 Lundy Lane
8 208 Lundy Lane
9 Well 1-B
10 Well 2
11 Next to WWTP #7
12 Open Space
13 Forest Service Property

TAMARACK CT
MADORA LAKE RD
JACKS CT
POPLAR VALLEY RD
POPL
ARCT
ALDE
RCT
RED
WILL
OWCT
VANESSACT
OAKCT
PINE
TREE
CT
LUNDY LN
CEDA
RLN
SEQUOIACIR
COTTONWOOD
DR
EUREKA SPRINGS DR
TAMARACK PL
EVER
GREE
NCI
R
TIMBER LN
Source: Esri, DigitalGlobe, GeoEye, Earthstar Geographics, CNES/Airbus DS, USDA, USGS, AeroGRID, IGN, and the GIS User Community
Q:\client\PlumasEureka\Maps\ProposedLocMap24x36.mxd, Editor: areid, Printed: 5/4/2017
Plum
as E
urek
a Pr
opos
ed W
ater
Tre
atm
ent P
lant
Loc
atio
ns
1 " = 120 '
5510 Longley LaneReno, NV 89511(775) 851-4788
www.farrwestengineering.com
The data contained herein does not represent survey delineation and should not be construed as a replacement for the authoritative source. No liability is assumed by Farr West Engineering as to the sufficiency or accuracy of the data.
¯
2
3
4
5
7
6
8
10
9
1112
13
1
1. Poplar Valley - Cottonwood Drive2. 208 Poplar Valley Road3. 12 Evergreen Circle4. 6 Pine Tree Court5. 103 Lundy Lane6. 118 Lundy Lane7. 200 Lundy Lane8. 208 Lundy Lane9. Well #1-B10. Well #211. Next to the WWTP #712. Open Space13. Forest Service Property
PROPOSED LOCATIONS

Technical Memorandum No. 1 Arsenic Mitigation Feasibility Study
Farr West Engineering FINAL Plumas Eureka Community Services District
9 Arsenic Mitigation – Preferred Alternative Evaluation
5.1 DESCRIPTION OF ALTERNATIVE LOCATIONS
Poplar Valley-Cottonwood Drive
The Plumas Pines Golf Course has proposed to sell a portion of undeveloped land (located to the
west of the Poplar Valley Road and Cottonwood Drive intersection on APN 129-010-43) to the
District for the WTP. The parcel would need to be split from the existing large parcel owned by
the golf course, requiring more survey work than any other alternative. Currently, the area is
heavily wooded with trees and has relatively flat topography. The site would also require
significant environmental clearances prior to being approved for development.
The site provides a reduced potential for public opposition as the adjacent properties are currently
undeveloped; however, the future development potential of these adjacent areas is unknown. This
location provides probable opportunities for a future well site as well. To connect the treatment
facility to the existing transmission main, 3,160 lf of high pressure transmission main must be
installed. The main will connect to the existing water line through Poplar Valley Road.
208 Poplar Valley
APN 129-084-002, to the south of Jacks Court, is an alternative location for the WTP. This vacant
parcel has an approximate area of 17,500 sf., is wooded, and has mild existing topography.
Construction of a treatment plant structure would require a building with aesthetic features that
meet the approval of surrounding residents. The WTP will not generate a significant amount of
noise or emissions; however, noise and air pollution will be increased from existing conditions
since the lot is currently vacant.
This Poplar Valley site has a high potential for public opposition since it is in a residential
neighborhood and has neighbors on all sides. The site would require minimal grading, and would
be easily accessible to District personnel. Currently, homes in this area are utilizing septic systems.
A new waste line would need to be installed and connected to the existing sewer service area
located in Basin 7. Sewer flows would need to be verified to assure the existing system could
accommodate the new waste discharge. Approximately 700 lf of high pressure transmission main
must be installed in Poplar Valley to connect the treatment plant to the existing water supply. The
District does not own this property and would need to purchase it from the owner. The likelihood
for a new well is currently unknown since previous hydrologic studies have not been completed in
this area.
12 Evergreen Circle
APN 129-122-07, located on Evergreen Circle next to an existing home on 10 Evergreen Circle,
is a potential location for the WTP. This parcel has an approximate area of 16,000 sf., is heavily
wooded with mature pine trees, and has mild existing topography. Construction of a treatment
plant structure may require a building with architectural improvements to match residential homes
in the area. The WTP will not generate a significant amount of noise or emissions; however, noise
and air pollution will be increased from existing conditions since the parcel is currently vacant.
This site has already received public opposition from neighborhood residents. The site would
require minimal grading, would be easily accessible, and could drain all waste to an adjacent
Technical Memorandum No. 1 Arsenic Mitigation Feasibility Study
Farr West Engineering FINAL Plumas Eureka Community Services District
10 Arsenic Mitigation – Preferred Alternative Evaluation
gravity sewer pipe. Approximately 850 lf of high pressure transmission main must be installed in
Evergreen Circle to connect the facility to the existing water supply. The District does not own
this property and would need to purchase it from the owner. The site does provide a potential for
a new well location in the future.
6 Pine Tree Court
APN 129-123-007, to the west of Pine Tree Court, is a potential site location for the WTP. This
parcel has an approximate area of 17,000 sf., is heavily wooded with mature pine trees, and has
mild existing topography. Construction of a treatment plant structure would require a building
with architectural improvements to match residential homes in the area. The WTP will not
generate a significant amount of noise or emissions; however, noise and air pollution will be
increased from existing conditions since the parcel is currently vacant. There is high likelihood
this site could house a new well because the site is adjacent to a District owned parcel which has
an existing spring on it.
This site has a moderate potential for public opposition since it is located in a residential
neighborhood, although it does not have any homes adjacent to it. The site would require minimal
grading and would be easily accessible. Currently, this area is utilizing septic systems. A new
waste line would need to be installed in Pine Tree Court and Evergreen Circle to connect to the
existing collection system. Sewer flows would need to be verified to ensure the existing system
could accommodate the new waste. Approximately 1,800 lf of high pressure transmission main
must be installed in Pine Tree Court and Evergreen Circle to connect the treatment plant to the
existing water transmission main. The District does not own this property and would need to
purchase it from the owner.
103 Lundy Lane
103 Lundy Lane, located on APN 129-084-014, is currently for sale. This parcel has an
approximate area of 16,500 sf. and with an existing 1,780 sf. house. The existing home would
need to be modified to accommodate a WTP. The WTP will not generate a significant amount of
noise or emissions above the level that currently exists on the parcel.
This Lundy Lane site has potential for public opposition, is located in a residential neighborhood,
and has one adjacent neighbor. The site would require minimal grading or site work as it is already
developed and would be easily accessible. Currently, this area is utilizing septic systems. A new
200 lf waste line would need to be installed to connect to the existing collection system. Sewer
flows would need to be verified to ensure the existing system could accommodate the new waste.
Approximately 700 lf of high pressure transmission main must be installed in Lundy Lane and
Poplar Valley Road to connect the treatment plant to the existing water transmission main. The
District does not own this property and would need to purchase it from the owner. It is currently
listed for sale for $230,000.
118 Lundy Lane
There is another home on Lundy Lane which is currently up for sale which may provide an
adequate location for the WTP. Parcel 129-085-018 has an approximate area of 20,500-sf. and
contains an 1,836-sf. house plus garage. The existing house would need to be modified to

Technical Memorandum No. 1 Arsenic Mitigation Feasibility Study
Farr West Engineering FINAL Plumas Eureka Community Services District
11 Arsenic Mitigation – Preferred Alternative Evaluation
accommodate the WTP. The WTP will not generate a significant amount of noise or emissions
above that of the current use on the parcel.
This Lundy Lane site has potential for public opposition since it is an existing residence located in
a neighborhood with two adjacent neighbors. The site would require minimal grading as it is
already developed and would be easily accessible. Currently, this area is utilizing septic systems.
A new 100-lf waste line would need to be installed in Lundy Lane to connect to the existing
collection system. Sewer flows would need to be verified to assure the existing system could
accommodate the new waste. Approximately 2,300 lf of high pressure transmission main must be
installed in Lundy Lane and Poplar Valley Road to connect the WTP to the existing water
transmission main. The District does not own this property and would need to purchase it from
the owner. It is currently listed for sale for $349,000.
200 Lundy Lane
200 Lundy Lane is the existing location of the District office, storage garage and fire house. This
site alternative assumes that the existing garage could be modified to house the WTP. The
approximate area of the garage is 900 sf. (28 ft. x 33 ft.) with three 9 ft. x 9ft. roll up doors. A site
inspection has deemed the garage as feasible for installation of water treatment equipment. The
WTP will not generate a significant amount of noise or emissions above those which are present
under the current use; however, the existing emergency generator will need to be upgraded for the
WTP.
This Lundy Lane site should have a very low potential for public opposition. The site would
require minimal grading as it is already developed and would be easily accessible. One drawback
to this location is that the District would need to construct another storage garage to accommodate
equipment and tools currently stored in the 200 Lundy Lane facility. Currently, this building is
utilizing a septic system. A new 200 lf waste line would need to be installed in Lundy Lane to
connect to the existing system in Cottonwood Drive. Sewer flows would need to be verified to
assure the existing system could accommodate the new waste. Approximately 1,800 lf of high
pressure transmission main must be installed in Lundy Lane and Poplar Valley Road to connect
the treatment plant to the existing water supply. The District currently owns this property,
eliminating any purchase costs.
208 Lundy Lane
A portion of undeveloped land on parcel 129-010-036 (located to the east of the Lundy Lane and
Cottonwood Drive intersection) could be improved to accommodate the WTP. This parcel has an
approximate area of 4.11 acres, is heavily wooded with mature pine trees and has mild topography
with an existing drainage channel running through it. While the site appears to be within a flood
zone per the current Federal Emergency Management Agency (FEMA) map, the area of the parcel
which would be improved is above the drainage channel and outside of any flood threat. It has
been determined that an engineering analysis should be sufficient to prove this condition without
flood map revision.
The WTP will not generate a significant amount of noise or emissions; however, noise and air
pollution will be increased from existing conditions since the parcel is currently vacant. This site

Technical Memorandum No. 1 Arsenic Mitigation Feasibility Study
Farr West Engineering FINAL Plumas Eureka Community Services District
12 Arsenic Mitigation – Preferred Alternative Evaluation
alternative should not have a high potential for public opposition and does not have any adjacent
neighbors. The site would require minimal grading and would be easily accessible from
Cottonwood Drive. A new waste line would need to be installed in Cottonwood Drive to connect
to the existing system. Sewer flows would need to be verified to assure the existing system could
accommodate the new waste and could drain all waste to an adjacent gravity sewer pipe.
Approximately 2,700 lf of high pressure transmission main must be installed in Cottonwood Drive
to connect the WTP to the existing water supply. The District owns this property, eliminating any
purchase costs.
Well 1-B
Well 1-B is located near the 16th hole of the Plumas Pines Golf Course in a densely-vegetated area,
surrounded by private residences and a fairway. Utilizing Well 1-B as the site alternative would
require a significant amount of grading, site work and vegetation removal. Proposed
improvements to Well 1-B would have moderate impacts to golf course functions as the site is
somewhat secluded; however, golf course ownership has issued notification in writing that they
are opposed to any expansion of District facilities on or adjacent to golf course property. Aesthetic
changes to the area, such as the removal of trees and a more visible well house building, could
potentially create opposition from the nearby property owners as well.
In addition to the aesthetic impacts, Well 1-B is located near a FEMA designated floodplain (map
06063C1275E) and appears to be within a wetland area. Significant grading, site work and
environmental clearances appear to be necessary to mitigate these conditions. A sewer lift station
would also be necessary at this site to allow for discharging waste to the community sewer
collection system.
The existing well house at Well 1-B would need to be replaced or expanded to house the necessary
treatment components. Well 1-B is located on APN 129-170-01, where there appears to be enough
room to accommodate the building enlargement. Another major flaw for this site alternative is
that the WTP could only treat Well 1-B water unless considerable improvements are made to the
transmission main piping. Easements granted by the golf course and private residents would be
necessary to accommodate the piping improvements.
Well 2
Well 2 is located between the 13th and 17th hole in a wooded area, surrounded entirely by the golf
course. Site changes to Well 2 would have the greatest impact to the functionality of the golf
course, but would have no impacts to the surrounding private residents. Aesthetic changes would
be moderate as there are only three trees requiring removal for the facility, and the public is already
accustomed to seeing an existing structure in this area. Well 2 is located farthest from any wetlands
area or FEMA designated floodplain.
The existing well house at Well 2 would require replacement or expansion to house the necessary
treatment components. Located on APN 129-010-43, there appears to be more than enough room
to accommodate a building enlargement within the current parcel. Inside the building, the new
treatment components would need to be tied into the existing water system, and an approximate
310-ft. gravity waste line would need to be constructed to tie into the existing sewer system.

Technical Memorandum No. 1 Arsenic Mitigation Feasibility Study
Farr West Engineering FINAL Plumas Eureka Community Services District
13 Arsenic Mitigation – Preferred Alternative Evaluation
Treating water at Well 2 would provide the District with full redundancy in treating their
groundwater sources. Unfortunately, the golf course has strongly opposed construction at this
location and any development at this site would require significant legal fees and CEQA
mitigation.
Next to WWTP #7
A site location which has been identified by the District is on APN 129-190-027, adjacent to the
existing wastewater treatment plant (WWTP). This parcel has an approximate area of 0.34 acres
available for use. The WTP will not generate a significant amount of noise or emissions and with
an existing WWTP next door, the existing area receptors are already familiar with the operational
conditions of a public utility facility.
This location should not have a large potential for public opposition as the area is already being
utilized for treatment needs, but there could be public perception concerns with a wastewater and
water treatment plant being located adjacent to one another. Moderate site work and a low-
pressure sewer line would be necessary to provide waste discharge to WWTP #7. Approximately
2,200 lf of water transmission main must be installed in Sequoia Circle and Cottonwood Drive to
connect the WTP to the existing water supply. The District owns this parcel, eliminating any
purchase costs.
Sequoia Circle Open Space
This potential site location is located on APN 129-181-047, adjacent to the existing WWTP #7.
This parcel has an approximate area of 1.49 acres of open space available for improvement.
Because the parcel is currently vacant, there will be impacts to area receptors because of WTP
construction.
This location should not have a large potential for public opposition even though residential
properties surround it. Moderate site work would be necessary and a waste line would be required
for discharges. Approximately 2,200 lf of high pressure transmission main must be installed
through the common area and Cottonwood Drive to connect the treatment plant to the existing
water supply. Based on the existing path from the common area to the transmission main,
treatment redundancy might not be the most feasible option from this location. The District owns
this parcel, eliminating any purchase costs.
Forest Service Property
Currently, the District water storage tanks are located on USFS land to the west of the community
on Madora Lake Road. This site alternative proposes to build a treatment plant adjacent to the two
storage tanks. This location would require a special use permit from the USFS. To be granted a
special use permit, the District would be required to display that no other feasible alternative exists
beyond this one and would require approximately 18 to 24 months to be granted.

Technical Memorandum No. 1 Arsenic Mitigation Feasibility Study
Farr West Engineering FINAL Plumas Eureka Community Services District
14 Arsenic Mitigation – Preferred Alternative Evaluation
6.0 SITE ALTERNATIVES EVALUATION APPROACH
The site alternatives evaluation will occur in two stages, with the level of detail increasing in each
subsequent stage. The stages include:
• Preliminary Evaluation, and
• Detailed Alternatives Evaluation.
These stages are presented in more detail below.
6.1 PRELIMINARY EVALUATION METHOD
The purpose of the preliminary evaluation is to identify any alternatives which are not feasible and
do not require further development or evaluation. Each alternative deemed infeasible in the
preliminary evaluation will have a fatal flaw due to either constructability, a potential for continued
non-compliance, or result in a schedule which greatly exceeds the current compliance date of
November 1, 2017.
Each alternative eliminated in this stage will be described below:
Well 1-B
Due to staunch opposition by the golf course and environmental conditions, this alternative has
been deemed infeasible and will not be considered further in this study. These conditions will
increase project costs and timeframes to unacceptable levels.
Well 2
For the WTP to be constructed at Well 2, significant time and resources would need to be placed
into environmental and legal costs. Beyond the cost impacts, these factors would push the project
schedule far beyond the compliance date of November 2017. This location has been deemed
infeasible and will not be considered further in this study.
Forest Service Property
This location alternative has been eliminated due to the nature of the site. It would be a time-
consuming process to gain permission from USFS and is not a feasible or pursuable option at this
point in time.
These three site alternatives have been deemed infeasible locations for a WTP and will not be
evaluated further.
6.2 DETAILED EVALUATION METHOD
The detailed evaluation of site alternatives will include both non-economic and economic
components. The following sections include descriptions of each evaluation method as well as a
presentation of the criteria and subcriteria that will be used to perform the detailed non-economic
evaluation of the site alternatives.

Technical Memorandum No. 1 Arsenic Mitigation Feasibility Study
Farr West Engineering FINAL Plumas Eureka Community Services District
15 Arsenic Mitigation – Preferred Alternative Evaluation
The results from the non-economic evaluation will ultimately be paired with a cost based analysis
that will identify the economic impacts of each alternative. Construction and O&M costs for a
dual-stage treatment facility will be used for each site alternative. Any difference in project costs
between alternatives will be a result of site improvement conditions and will not be related to the
type of treatment proposed. The economic evaluation will also provide a means to weigh the
potential cost advantages or disadvantages associated with an alternative relative to its non-
economic benefits. For example, if the second highest ranked site alternative is much less costly,
it will be important to consider the possibility of potential savings when recommending the
proposed alternative(s).
6.2.1. NON-ECONOMIC EVALUATION METHOD
The site alternatives will be evaluated using a matrix comparison. The matrix will be used as a
tool to identify the best alternative relative to the competing alternatives based on direct
comparison. This section includes a brief description of the methodology used for the comparison.
Descriptions of the various criteria and the specific weighting assigned to each criterion are
discussed in the sections below.
Each alternative under consideration is scored based on a number of criteria developed by the
District and Farr West. The relative value assigned to each criterion determines its importance, or
weight, compared to the other criteria used in the evaluation. Ultimately, a final score will be
summed for each alternative based on the alternative’s performance for each of the criteria. This
final score represents the alternative’s overall ranking relative to the other alternatives with a
higher score being preferable to a lower one. The final score will be used in the selection of the
recommended alternative(s).
Each set of criteria, subcriteria, and evaluation metrics will be assigned a weight based on the
importance to the project as a whole, with a maximum of ten (10), representing critical importance,
and a minimum of zero (0), representing least importance. Table 3 presents the scale used in the
weighting of criteria.
Table 3 – Criteria/Subcriteria Weighting Scale
Verbal Scale Numeric Scale
Critical 10
Very Important 7.5
Important 5
Less Important 2.5
Least Important 0
The sections below describe in more detail the weighting of the primary evaluation criteria,
subcriteria, and evaluation metrics.
6.2.2. EVALUATION CRITERIA
With careful consideration given to the goals and objectives of the project and the needs of District,
the project team initially developed the evaluation criteria, subcriteria, and weighting convention
Technical Memorandum No. 1 Arsenic Mitigation Feasibility Study
Farr West Engineering FINAL Plumas Eureka Community Services District
16 Arsenic Mitigation – Preferred Alternative Evaluation
assigned to each. The District was then solicited for review, input and acceptance of these
parameters.
Six evaluation criteria were used to compare the site alternatives:
1. Operations and Maintenance
2. Engineering
3. Public/Regional Impacts
4. Environmental
5. Property Acquisition
6. Permitting Requirements
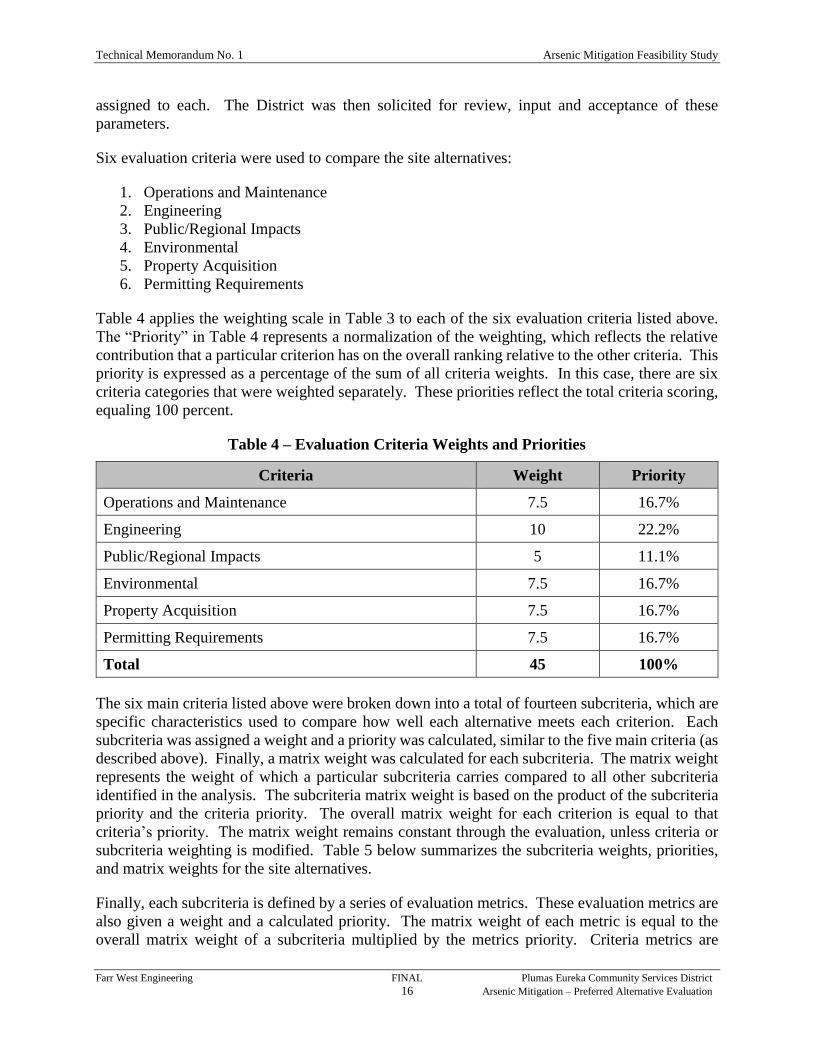
Table 4 applies the weighting scale in Table 3 to each of the six evaluation criteria listed above.
The “Priority” in Table 4 represents a normalization of the weighting, which reflects the relative
contribution that a particular criterion has on the overall ranking relative to the other criteria. This
priority is expressed as a percentage of the sum of all criteria weights. In this case, there are six
criteria categories that were weighted separately. These priorities reflect the total criteria scoring,
equaling 100 percent.
Table 4 – Evaluation Criteria Weights and Priorities
Criteria Weight Priority
Operations and Maintenance 7.5 16.7%
Engineering 10 22.2%
Public/Regional Impacts 5 11.1%
Environmental 7.5 16.7%
Property Acquisition 7.5 16.7%
Permitting Requirements 7.5 16.7%
Total 45 100%
The six main criteria listed above were broken down into a total of fourteen subcriteria, which are
specific characteristics used to compare how well each alternative meets each criterion. Each
subcriteria was assigned a weight and a priority was calculated, similar to the five main criteria (as
described above). Finally, a matrix weight was calculated for each subcriteria. The matrix weight
represents the weight of which a particular subcriteria carries compared to all other subcriteria
identified in the analysis. The subcriteria matrix weight is based on the product of the subcriteria
priority and the criteria priority. The overall matrix weight for each criterion is equal to that
criteria’s priority. The matrix weight remains constant through the evaluation, unless criteria or
subcriteria weighting is modified. Table 5 below summarizes the subcriteria weights, priorities,
and matrix weights for the site alternatives.
Finally, each subcriteria is defined by a series of evaluation metrics. These evaluation metrics are
also given a weight and a calculated priority. The matrix weight of each metric is equal to the
overall matrix weight of a subcriteria multiplied by the metrics priority. Criteria metrics are

Technical Memorandum No. 1 Arsenic Mitigation Feasibility Study
Farr West Engineering FINAL Plumas Eureka Community Services District
17 Arsenic Mitigation – Preferred Alternative Evaluation
described in more detail below. A summary of criteria, subcriteria, and metric weights, priorities
and matrix weights is provided in Table 6.
Ultimately, the last step in the evaluation will be to rank each of the site alternatives on a four-
point scale for each subcriteria and calculate the resulting score. The four-point scale will use a
value of 4 for alternatives which exhibit the “Best” qualities, a value of 3 for alternatives which
exhibit “Good” qualities, a value of 2 for alternatives which exhibit “Satisfactory” qualities, and a
value of 1 for alternatives with “Poor” qualities for the individual metric being scored. An
alternative’s metric score for a given metric is the one through four-point value assigned to the
alternative divided by the maximum possible score (i.e. 4) and then multiplied by the metric matrix
weight. These scores are then summed for all metrics to result in a subcriteria score. Subcriteria
scores are summed for each site alternative to determine the highest scoring alternative.
Table 5 – Subcriteria Weights, Priori ties, and Matrix Weights
Subcriteria Weight Priority Matrix Weight
Operation & Maintenance Weight = 7.5, Priority = 16.7%
Accessibility 5 40.0% 6.7
Operational Considerations 7.5 60.0% 10.0
Subtotal 12.5 100% 16.7
Engineering Weight = 10, Priority – 22.2%
Constructability 10 33.3% 7.4
Power Supply 7.5 25.0% 5.6
Connection to Existing System 7.5 25.0% 5.6
Additional Work Needed 5 16.7% 3.7
Subtotal 30.0 100% 22.2
Public/Regional Impacts Weight = 5, Priority = 11.1%
Potential for Opposition 10 44.4% 4.9
Aesthetic Impacts 7.5 33.3% 3.7
Public Perception 5 22.2% 2.5
Subtotal 22.5 100% 11.1
Environmental Weight = 7.5, Priority = 16.7%
Sensitivity 10 100% 16.7
Subtotal 10 100% 16.7
Property Acquisition Weight = 7.5, Priority = 16.7%
Ownership 10 57.1% 9.5
Probability of Securing Property 7.5 42.9% 7.1
Subtotal 17.5 100% 16.7
Permitting Requirements Weight = 7.5, Priority = 16.7%
Easements 10 57.1% 9.5
Type 7.5 42.9% 7.1
Subtotal 22.5 100% 16.7

Criteria Weight Priority (%) Subcriteria Weight Metric Weights Priority (%) Matrix Weight
O & M 7.5 16.7% Accessibility 5 40.0 % Distance to other District facilities 7.5 38% 2.5Access type (i.e. truck, golf cart, etc.) 7.5 38% 2.5Length of access road 5 25% 1.7
Sub-total 20 100% 6.7
Operational Considerations 7.5 60.0 % Blending possible 7.5 33% 3.3Future well site 10 44% 4.4Communications between facilities 5 22% 2.2
Sub-total 22.5 100% 10.0Sub-total 12.5 100.0 % 16.7
Engineering 10 22.2% Constructability 10 33.3 % Site Work 7.5 19% 1.4Structural Improvements Req'd 5 13% 0.9Material Staging 7.5 19% 1.4Construction Vehicle Access 5 13% 0.9Traffic Control 5 13% 0.9Start of Construction 5 13% 0.9Additional Facilities Needed 5 13% 0.9
Sub-total 40 100% 7.4
Power Supply 7.5 25.0 % Distance to Power Supply 10 100% 5.6Sub-total 10 100% 5.6
Connection to Existing System 7.5 25.0 % Length of Waste Line 7.5 38% 2.1Lift Station Required 5 25% 1.4Length of Connection to Existing Water Main 7.5 38% 2.1
Sub-total 20 100% 5.6
Additional Work Needed 5 16.7 % Distance to FEMA Defined Floodplain 10 57% 2.1Additional Survey Needed 7.5 43% 1.6
Sub-total 17.5 100% 3.7Sub-total 30 100.0 % 22.2
Public/Regional Impacts 5 11.1% Potential for Opposition 10 44.4 % # of Receptors for Traffic, Noise, and Air Quality Impacts 5 20% 1.0Proximity to Residences 10 40% 2.0Potential Impacts to Commercial Interests 10 40% 2.0
Sub-total 25 100% 4.9
Aesthetic Impacts 7.5 33.3 % Short term construction impacts (grading, staging areas) 5 40% 1.5Long term impacts (change in topography, removal of 7.5 60% 2.2vegetation, visibility of appurtenances)
Sub-total 12.5 100% 3.7
Public Perception 5 22.2 % Water Treatment Facility near Sewer Treatment Facility 10 100% 2.5Sub-total 10 100% 2.5
Sub-total 22.5 100.0 % 11.1Environmental 7.5 16.7% Sensitivity 10 100.0 % Aesthetics 10 6% 1.0
Agriculture and Forestry Resources 10 6% 1.0Air Quality 10 6% 1.0Biological Resources 10 6% 1.0Cultural Resources 10 6% 1.0Geology/Soils 10 6% 1.0Greenhouse Gas Emissions 10 6% 1.0Hazards & Hazardous Materials 10 6% 1.0Hydrology/Water Quality 10 6% 1.0Land Use/Planning 10 6% 1.0Mineral Resources 10 6% 1.0Noise 10 6% 1.0Population/Housing 10 6% 1.0Public Services 10 6% 1.0Recreation 10 6% 1.0Transportation/Traffic 10 6% 1.0Utilities/Service Systems 10 6% 1.0
Sub-total 170 100% 16.7Sub-total 10 100.0 % 16.7
Property Acquisition 7.5 16.7% Ownership 10 57.1 % Owned by District or Private Party 10 100% 9.5Sub-total 10 100% 9.5
Probability of Securing Property 7.5 42.9 % Willing Seller 7.5 60% 4.3Current Offer in Hand 5 40% 2.9
Sub-total 12.5 100% 7.1Sub-total 17.5 100.0 % 16.7
Permitting Requirements 7.5 16.7% Easements 10 57.1 % Temporary construction easements needed 7.5 43% 4.1Probability of securing easements 10 57% 5.4
Sub-total 17.5 100% 9.5
Type 7.5 42.9 % CC&R Changes 7.5 100% 7.1Sub-total 7.5 100% 7.1
Sub-total 17.5 100.0 % 16.7Total 45 100% Total
Weight = value assigned to given criterion (or subcriterion) with respect to other criteria (or subcriteria). 1 PoorPriority = the value of weights after normalization. 2 Satisfactory
Matrix Weight = the metric priority multiplied by the criterion priority. 3 Good
4 Best
Priority (%)
TABLE 6 - NON ECONOMIC EVALUATION - WTP SITE SELECTION
Criteria Subcriteria Subcriteria Metric

Technical Memorandum No. 1 Arsenic Mitigation Feasibility Study
Farr West Engineering FINAL Plumas Eureka Community Services District
19 Arsenic Mitigation – Preferred Alternative Evaluation
6.3 NON-ECONOMIC CRITERIA AND SUBCRITERIA
Table 6 summarizes the criteria, subcriteria, and evaluation metrics serving as the primary basis
for selecting the proposed site alternative for the WTP. Detailed descriptions and assigned
weightings for the criteria and subcriteria are discussed in the sections below. The weight assigned
to each of the criteria has significant bearing on the final score for each alternative. Weights reflect
the judgment of Farr West with input provided by the District.
A. Operations & Maintenance
The operations and maintenance of the WTP are a significant consideration in the site alternative
evaluation and preliminary design. Only certain operational subcriteria are pertinent to a
comparative evaluation and ultimately the selection of the most preferable site. For these reasons,
this criteria gives a “Very Important” consideration to the operational advantages of any one WTP
site over another. This criterion attempts to evaluate for each alternative the long-term
accessibility for maintenance purposes, the ease of access the site provides, the comparative
operational benefit a site may provide over another and the future benefits a site may offer to the
District.
Accessibility
The treatment site will require routine inspections and/or maintenance. Therefore, the site should
have long term accessibility, preferably via paved or well graded dirt roads. Access to the facility
is weighted “Important” under the operations and maintenance criteria. This subcriteria evaluates
the ability for maintenance crews to access the treatment site for long term maintenance. Site
alternatives that are located in remote areas, difficult to access by vehicle, and without existing
roadways will receive lower scores than those that are easily accessible by vehicle, either within
or near existing roads. Alternatives that require sharing a road with the golf course will receive a
lower score than one which is accessible by a public road.
Operational Considerations
Operation of the new WTP will become a significant component of the water system and site which
provides benefits beyond that of just water treatment will be favorable to those which do not. For
example, a site which will allow the District to reach regulatory compliance by blending raw water
with a small quantity of treated water will be preferred over an alternative which requires a larger
volume of water to be treated. Also, a site which may allow for the drilling of a new water source
in the future is preferred to a site which does not.
B. Engineering
The design and constructability of the WTP site is a “Critical” criteria to consider when selecting
alternatives. This is because construction challenges have the potential to cause a significant
increase in project costs and/or delays in schedule, and could impact the feasibility of the project
all together. The engineering criteria considers the difficulty of construction and the scope of
improvements required for each site alternative. The following four subcriteria are used to
determine the overall score for engineering for each site alternative.
Technical Memorandum No. 1 Arsenic Mitigation Feasibility Study
Farr West Engineering FINAL Plumas Eureka Community Services District
20 Arsenic Mitigation – Preferred Alternative Evaluation
Constructability
Constructability plays a “Critical” role in the evaluation and selection of the site alternative.
Alternatives that require more site work or structural improvements will also require more
intensive design and more time to construct. Site alternatives with challenging terrain, narrow
access, or lack of room for material staging will be ranked less favorably in this subcriteria.
Alternatives that lend themselves to an economical use of the existing site, a multi-disciplined
construction process, and will allow for an immediate start to construction will be given the highest
scores.
Power Supply
The availability of power supply is “Very Important” to the location of the treatment facility. This
subcriteria will evaluate each site alternative for proximity to existing power lines, with closer
being preferable to farther away, and existing service being preferred over a site which would
require a new service connection. The size and phase of existing power is assumed to be equivalent
at each site alternative.
Connection to Existing System
Location of the facility will dictate the difficulty in connecting the treatment facility to the existing
water and wastewater system. This subcriteria is considered “Very Important” and relates to the
lengths of the connecting water and wastewater pipelines and their difficulty of construction.
Shorter pipeline lengths, as well as those that can be constructed within existing roadways or
easements, at mild slopes will be ranked more favorable. A site which provides a gravity
connection to the existing sewer collection system will be preferred over a site which requires a
lift station and low-pressure force main.
Additional Work Needed
The engineering and design review of the WTP is anticipated to be significant. For this reason, a
site which requires more engineering or survey work as compared to another alternative will be
scored unfavorably. This subcriteria is determined to be “Important” in the site selection process.
C. Public and Regional Impacts
It is important to acknowledge the concerns of the public in the Plumas Eureka area. The issues
of political sensitivity and public perception will be mitigated throughout the project through
public outreach and education. This criteria and associated subcriteria acknowledges the potential
aesthetic impacts to the public as well as the potential for opposition are considered “Important”
to the evaluation.
Potential for Opposition
This subcriteria evaluates the potential for public opposition as it relates to traffic; noise and air
quality impacts; proximity of the WTP to residents; and any other potential impacts to private
property. Alternatives that are within private property and residential/commercial corridors will
be given lower scores since they are more likely to receive opposition from local landowners. This

Technical Memorandum No. 1 Arsenic Mitigation Feasibility Study
Farr West Engineering FINAL Plumas Eureka Community Services District
21 Arsenic Mitigation – Preferred Alternative Evaluation
subcriteria will have a “Critical” consideration in an alternative’s public and regional impact
criteria score.
Aesthetic Impacts
This subcriteria evaluates the short and long-term impacts that will exist during and after
construction. Short term impacts include construction related tasks such as clearing and grubbing,
grading, material and equipment staging areas, and construction vehicle access. Construction
related aesthetic impacts will be greater for site alternatives in close proximity to residential areas.
Long term impacts include those realized after construction is complete. These include changes
in topography, removal of vegetation, visibility of appurtenances, and maintenance related
activities. These impacts will also be higher when near residential areas. This subcriteria will
have a “Very Important” consideration in an alternative’s public and regional impact criteria score.
Public Perception
Construction of a new WTP will be a visible reminder to the community of where their drinking
water comes from and that it must be treated prior to being consumed. Placing the WTP in a
location next to an existing WWTP or flood zone may cause the public some concern about the
quality of the potable water supply. This subcriteria will carry an “Important” consideration in the
site alternative’s public and regional impact score.
D. Environmental
Environmental considerations are weighted “Very Important” because alternatives that require
environmental permits, California Environmental Quality Act (CEQA) compliance, and/or
National Environmental Policy Act (NEPA) have the potential to significantly change the outcome
of a project. Increases in project costs and schedule, ability to obtain permits, and the
environmental mitigations placed on permits may become prohibitively costly or unreasonable.
California’s public agencies under CEQA must disclose and avoid or mitigate to the extent
feasible, all probable significant environmental impacts that could result from the District’s
proposed discretionary action or project.
An ideal project alternative would not have the potential to significantly affect the environment,
requiring few, if any mitigation measures. The recommended alternative would require
compliance with CEQA, Clean Water Act Section 401 and 404, Federal Endangered Species Act
Section 7, National Historic Preservation Act Section 106, California Endangered Species Act,
California Fish and Game Code Section 1602, and other local permits. Additionally, NEPA and
special use permits could be required depending on the alternative selected.
Within the environmental consideration criteria, the overall level of difficulty, potential to trigger
additional compliance, potential costs of obtaining individual permits, and costs for mitigation
measures anticipated for each alternative is assessed. The score for this criteria is comprised of
the scores of the subcriteria that are listed below.
Technical Memorandum No. 1 Arsenic Mitigation Feasibility Study
Farr West Engineering FINAL Plumas Eureka Community Services District
22 Arsenic Mitigation – Preferred Alternative Evaluation
Sensitivity
The metrics developed for this subcriteria are identical to the seventeen environmental factors
listed in Appendix G of the CEQA guidelines. Since each factor could negatively impact the
project equally, all seventeen metrics will be weighed the same with a “Critical” consideration.
The alternative with the highest score for each of these metrics will be the alternative that has been
assessed to have the least impact for each category, or is expected to be the least difficult to take
through the environmental permitting processes.
E. Property Acquisition
The ability of the District to acquire the land for the WTP is a “Very Important” factor in
determining the feasibility of a site alternative. The only reason the property acquisition criteria
was not deemed “Critical” is because there are District-owned site options available if property
acquisition is not possible with private owners.
Ownership
The entity which owns the property will significantly impact the District’s ability to acquire the
property. Alternative’s which are currently owned by the District were given a “Best” score of 4
while properties owned by others were given a “Satisfactory” score of 2. This subcriteria will have
a “Critical” consideration in an alternative’s property acquisition criteria score.
Probability of Securing Property
In addition to understanding the property owner of each site alternative is to estimate the
probability of acquiring the property if it needs to be purchased. This subcriteria will have a “Very
Important” consideration in an alternative’s property acquisition criteria score. Properties which
are currently for sale will score higher than those which are not, and properties which are owned
by the District or have been presented to the District with an offer will score the highest of all.
F. Permitting Requirements
The scope of constructing the WTP goes beyond the limits of the parcel and will possibly require
easements or code changes prior to commencing construction. Sites which do not require
easements to be granted or do not need to be approved by area residents will be favored over those
that are dependent on other parties. Because these items have the potential to increase project
costs and extend project schedule, this criteria will play a “Very Important” factor in a site
alternative’s non-economic evaluation score.
Easements
For all alternatives, easements will be required for connections to the existing water mains and
possibly the wastewater collection system. Since it is infeasible to expect the District to purchase
property for a utility line, an access and utility easement will be necessary for installation,
maintenance, and operation of this newly constructed infrastructure. Alternatives which require a
greater number of easements or have a high degree of uncertainty tied to the acquisition of an
easement will rank lower than those which do not. Additionally, alternatives which do not require

Technical Memorandum No. 1 Arsenic Mitigation Feasibility Study
Farr West Engineering FINAL Plumas Eureka Community Services District
23 Arsenic Mitigation – Preferred Alternative Evaluation
temporary construction easements for materials staging, trench spoils, and equipment access
during construction will be scored more favorably than those which do need permission from
adjacent landowners. This subcriteria will have a “Critical” consideration in an alternative’s
permitting requirements criteria score.
Type
The type of additional permissions needed to construct the WTP will play a “Very Important” role
in determining the feasibility of the site alternative. Sites which will not require changes to existing
CC&R’s will score much higher than those that do. This document assumes that the only sites
which will require changes to the CC&R’s will be sites 2, 3 and 4.
6.4 NON-ECONOMIC EVALUATION RESULTS
This section includes the scored evaluation of the site alternatives. The main objective of this
evaluation is to compare and rank alternatives, evaluate the non-economic impacts, and identify a
recommended preferred alternative. The results of this analysis are only a recommendation, and
may vary from the preferred alternative of the District. Table 7 provides a summary of the weight
and priority for each criterion and subcriteria, their associated matrix weights, and presents the
overall score for each alternative.

Criteria Weight Priority (%) Subcriteria Weight Metric Weights Priority (%) Matrix Weight
Rank Score Rank Score Rank Score Rank Score Rank Score Rank Score Rank Score Rank Score Rank Score Rank ScoreO & M 7.5 16.7% Accessibility 5 40.0 % Distance to other District facilities 7.5 38% 2.5 1 0.6 2 1.3 2 1.3 2 1.3 2 1.3 3 1.9 3 1.9 3 1.9 3 1.9 3 1.9
Access type (i.e. truck, golf cart, etc.) 7.5 38% 2.5 4 2.5 4 2.5 4 2.5 4 2.5 4 2.5 4 2.5 4 2.5 4 2.5 4 2.5 3 1.9Length of access road 5 25% 1.7 4 1.7 4 1.7 4 1.7 4 1.7 4 1.7 4 1.7 4 1.7 4 1.7 4 1.7 3 1.3
Sub-total 20 100% 6.7 4.8 5.4 5.4 5.4 5.4 6.0 6.0 6.0 6.0 5.0
Operational Considerations 7.5 60.0 % Blending possible 7.5 33% 3.3 2 1.7 2 1.7 2 1.7 2 1.7 2 1.7 2 1.7 2 1.7 2 1.7 2 1.7 2 1.7Future well site 10 44% 4.4 3 3.3 2 2.2 3 3.3 4 4.4 1 1.1 1 1.1 1 1.1 2 2.2 1 1.1 2 2.2Communications between facilities 5 22% 2.2 2 1.1 2 1.1 2 1.1 2 1.1 2 1.1 2 1.1 2 1.1 2 1.1 3 1.7 2 1.1
Sub-total 22.5 100% 10.0 6.1 5.0 6.1 7.2 3.9 3.9 3.9 5.0 4.4 5.0Sub-total 12.5 100.0 % 16.7 10.9 10.4 11.5 12.6 9.3 9.9 9.9 11.0 10.5 10.0
Engineering 10 22.2% Constructability 10 33.3 % Site Work 7.5 19% 1.4 2 0.7 3 1.0 3 1.0 3 1.0 4 1.4 4 1.4 4 1.4 2 0.7 3 1.0 3 1.0Structural Improvements Req'd 5 13% 0.9 2 0.5 2 0.5 2 0.5 2 0.5 3 0.7 3 0.7 3 0.7 2 0.5 2 0.5 2 0.5Material Staging 7.5 19% 1.4 2 0.7 3 1.0 3 1.0 3 1.0 3 1.0 2 0.7 3 1.0 2 0.7 2 0.7 1 0.3Construction Vehicle Access 5 13% 0.9 4 0.9 4 0.9 4 0.9 4 0.9 4 0.9 4 0.9 4 0.9 4 0.9 4 0.9 3 0.7Traffic Control 5 13% 0.9 1 0.2 1 0.2 4 0.9 4 0.9 2 0.5 2 0.5 2 0.5 2 0.5 4 0.9 4 0.9Start of Construction 5 13% 0.9 2 0.5 2 0.5 2 0.5 2 0.5 2 0.5 2 0.5 4 0.9 3 0.7 3 0.7 3 0.7Additional Facilities Needed 5 13% 0.9 4 0.9 4 0.9 4 0.9 4 0.9 4 0.9 4 0.9 1 0.2 2 0.5 4 0.9 4 0.9
Sub-total 40 100% 7.4 4.4 5.1 5.8 5.8 5.9 5.6 5.7 4.4 5.7 5.1
Power Supply 7.5 25.0 % Distance to Power Supply 10 100% 5.6 3 4.2 3 4.2 3 4.2 3 4.2 4 5.6 4 5.6 4 5.6 3 4.2 3 4.2 2 2.8Sub-total 10 100% 5.6 4.2 4.2 4.2 4.2 5.6 5.6 5.6 4.2 4.2 2.8
Connection to Existing System 7.5 25.0 % Length of Waste Line 7.5 38% 2.1 3 1.6 3 1.6 2 1.0 2 1.0 3 1.6 4 2.1 3 1.6 4 2.1 4 2.1 4 2.1Lift Station Required 5 25% 1.4 4 1.4 4 1.4 4 1.4 4 1.4 4 1.4 4 1.4 4 1.4 4 1.4 1 0.3 1 0.3Length of Connection to Existing Water Main 7.5 38% 2.1 1 0.5 3 1.6 2 1.0 2 1.0 3 1.6 1 0.5 2 1.0 1 0.5 1 0.5 1 0.5
Sub-total 20 100% 5.6 3.5 4.5 3.5 3.5 4.5 4.0 4.0 4.0 3.0 3.0
Additional Work Needed 5 16.7 % Distance to FEMA Defined Floodplain 10 57% 2.1 3 1.6 4 2.1 4 2.1 4 2.1 4 2.1 3 1.6 3 1.6 2 1.1 4 2.1 4 2.1Additional Survey Needed 7.5 43% 1.6 1 0.4 2 0.8 2 0.8 2 0.8 3 1.2 3 1.2 3 1.2 2 0.8 3 1.2 2 0.8
Sub-total 17.5 100% 3.7 2.0 2.9 2.9 2.9 3.3 2.8 2.8 1.9 3.3 2.9Sub-total 30 100.0 % 22.2 14.0 16.7 16.3 16.3 19.3 17.9 18.0 14.4 16.1 13.7
Public/Regional Impacts 5 11.1% Potential for Opposition 10 44.4 % # of Receptors for Traffic, Noise, and Air Quality Impacts 5 20% 1.0 3 0.7 2 0.5 2 0.5 2 0.5 2 0.5 2 0.5 2 0.5 2 0.5 2 0.5 4 1.0Proximity to Residences 10 40% 2.0 3 1.5 1 0.5 1 0.5 1 0.5 1 0.5 1 0.5 2 1.0 2 1.0 2 1.0 3 1.5Potential Impacts to Commercial Interests 10 40% 2.0 4 2.0 4 2.0 4 2.0 4 2.0 4 2.0 4 2.0 4 2.0 4 2.0 4 2.0 4 2.0
Sub-total 25 100% 4.9 4.2 3.0 3.0 3.0 3.0 3.0 3.5 3.5 3.5 4.4
Aesthetic Impacts 7.5 33.3 % Short term construction impacts (grading, staging areas) 5 40% 1.5 2 0.7 2 0.7 3 1.1 3 1.1 3 1.1 2 0.7 3 1.1 2 0.7 3 1.1 2 0.7Long term impacts (change in topography, removal of 7.5 60% 2.2 2 1.1 3 1.7 3 1.7 3 1.7 4 2.2 4 2.2 4 2.2 2 1.1 3 1.7 3 1.7vegetation, visibility of appurtenances)
Sub-total 12.5 100% 3.7 1.9 2.4 2.8 2.8 3.3 3.0 3.3 1.9 2.8 2.4
Public Perception 5 22.2 % Water Treatment Facility near Sewer Treatment Facility 10 100% 2.5 4 2.5 4 2.5 4 2.5 4 2.5 4 2.5 4 2.5 4 2.5 4 2.5 1 0.6 3 1.9Sub-total 10 100% 2.5 2.5 2.5 2.5 2.5 2.5 2.5 2.5 2.5 0.6 1.9
Sub-total 22.5 100.0 % 11.1 8.5 7.8 8.2 8.2 8.8 8.4 9.3 7.8 6.9 8.7Environmental 7.5 16.7% Sensitivity 10 100.0 % Aesthetics 10 6% 1.0 2 0.5 3 0.7 3 0.7 3 0.7 4 1.0 4 1.0 4 1.0 3 0.7 2 0.5 2 0.5
Agriculture and Forestry Resources 10 6% 1.0 2 0.5 4 1.0 4 1.0 4 1.0 4 1.0 4 1.0 4 1.0 4 1.0 4 1.0 2 0.5Air Quality 10 6% 1.0 4 1.0 4 1.0 4 1.0 4 1.0 4 1.0 4 1.0 4 1.0 4 1.0 4 1.0 4 1.0Biological Resources 10 6% 1.0 2 0.5 4 1.0 4 1.0 4 1.0 4 1.0 4 1.0 4 1.0 4 1.0 4 1.0 3 0.7Cultural Resources 10 6% 1.0 4 1.0 4 1.0 4 1.0 4 1.0 4 1.0 4 1.0 4 1.0 3 0.7 4 1.0 4 1.0Geology/Soils 10 6% 1.0 4 1.0 4 1.0 4 1.0 4 1.0 4 1.0 4 1.0 4 1.0 4 1.0 4 1.0 4 1.0Greenhouse Gas Emissions 10 6% 1.0 4 1.0 4 1.0 4 1.0 4 1.0 4 1.0 4 1.0 4 1.0 4 1.0 4 1.0 4 1.0Hazards & Hazardous Materials 10 6% 1.0 4 1.0 4 1.0 4 1.0 4 1.0 4 1.0 4 1.0 4 1.0 4 1.0 4 1.0 4 1.0Hydrology/Water Quality 10 6% 1.0 4 1.0 4 1.0 4 1.0 4 1.0 4 1.0 4 1.0 4 1.0 4 1.0 4 1.0 4 1.0Land Use/Planning 10 6% 1.0 4 1.0 4 1.0 4 1.0 4 1.0 4 1.0 4 1.0 4 1.0 4 1.0 4 1.0 4 1.0Mineral Resources 10 6% 1.0 4 1.0 4 1.0 4 1.0 4 1.0 4 1.0 4 1.0 4 1.0 4 1.0 4 1.0 4 1.0Noise 10 6% 1.0 4 1.0 4 1.0 4 1.0 4 1.0 4 1.0 4 1.0 4 1.0 4 1.0 4 1.0 4 1.0Population/Housing 10 6% 1.0 4 1.0 3 0.7 3 0.7 3 0.7 3 0.7 4 1.0 3 0.7 4 1.0 3 0.7 4 1.0Public Services 10 6% 1.0 4 1.0 4 1.0 4 1.0 4 1.0 4 1.0 4 1.0 4 1.0 4 1.0 4 1.0 4 1.0Recreation 10 6% 1.0 4 1.0 4 1.0 4 1.0 4 1.0 4 1.0 4 1.0 4 1.0 4 1.0 4 1.0 4 1.0Transportation/Traffic 10 6% 1.0 4 1.0 4 1.0 4 1.0 4 1.0 4 1.0 4 1.0 4 1.0 4 1.0 4 1.0 4 1.0Utilities/Service Systems 10 6% 1.0 4 1.0 4 1.0 4 1.0 4 1.0 4 1.0 4 1.0 4 1.0 4 1.0 4 1.0 4 1.0
Sub-total 170 100% 16.7 15.2 16.2 16.2 16.2 16.4 16.7 16.4 16.2 15.9 15.4Sub-total 10 100.0 % 16.7 15.2 16.2 16.2 16.2 16.4 16.7 16.4 16.2 15.9 15.4
Property Acquisition 7.5 16.7% Ownership 10 57.1 % Owned by District or Private Party 10 100% 9.5 2 4.8 2 4.8 2 4.8 2 4.8 2 4.8 2 4.8 4 9.5 4 9.5 4 9.5 4 9.5Sub-total 10 100% 9.5 4.8 4.8 4.8 4.8 4.8 4.8 9.5 9.5 9.5 9.5
Probability of Securing Property 7.5 42.9 % Willing Seller 7.5 60% 4.3 4 4.3 3 3.2 3 3.2 3 3.2 4 4.3 4 4.3 4 4.3 4 4.3 4 4.3 4 4.3Current Offer in Hand 5 40% 2.9 4 2.9 3 2.1 2 1.4 2 1.4 2 1.4 3 2.1 4 2.9 4 2.9 4 2.9 4 2.9
Sub-total 12.5 100% 7.1 7.1 5.4 4.6 4.6 5.7 6.4 7.1 7.1 7.1 7.1Sub-total 17.5 100.0 % 16.7 11.9 10.1 9.4 9.4 10.5 11.2 16.7 16.7 16.7 16.7
Permitting Requirements 7.5 16.7% Easements 10 57.1 % Temporary construction easements needed 7.5 43% 4.1 3 3.1 3 3.1 4 4.1 4 4.1 3 3.1 4 4.1 4 4.1 4 4.1 4 4.1 4 4.1Probability of securing easements 10 57% 5.4 3 4.1 3 4.1 4 5.4 4 5.4 3 4.1 4 5.4 4 5.4 4 5.4 4 5.4 4 5.4
Sub-total 17.5 100% 9.5 7.1 7.1 9.5 9.5 7.1 9.5 9.5 9.5 9.5 9.5
Type 7.5 42.9 % CC&R Changes 7.5 100% 7.1 4 7.1 1 1.8 1 1.8 1 1.8 4 7.1 4 7.1 4 7.1 4 7.1 4 7.1 4 7.1Sub-total 7.5 100% 7.1 7.1 1.8 1.8 1.8 7.1 7.1 7.1 7.1 7.1 7.1
Sub-total 17.5 100.0 % 16.7 14.3 8.9 11.3 11.3 14.3 16.7 16.7 16.7 16.7 16.7Total 45 100% Total 74.8 70.2 73.0 74.1 78.5 80.7 86.9 82.7 82.7 81.2
Weight = value assigned to given criterion (or subcriterion) with respect to other criteria (or subcriteria). 1 PoorPriority = the value of weights after normalization. 2 Satisfactory
Matrix Weight = the metric priority multiplied by the criterion priority. 3 Good
4 Best
4 5 6 7 8
TABLE 7 - NON ECONOMIC EVALUATION - WTP SITE SELECTION SITE ALTERNATIVES
Criteria Subcriteria Subcriteria Metric
Priority (%)
1 2 3 11 12

Technical Memorandum No. 1 Arsenic Mitigation Feasibility Study
Farr West Engineering FINAL Plumas Eureka Community Services District
25 Arsenic Mitigation – Preferred Alternative Evaluation
6.5 ECONOMIC EVALUATION RESULTS
The construction cost opinions for each project alternative are summarized in Table 8. Project
costs were developed using Farr West’s cost estimating database, vendor quotations, and bid
results for projects with similar components in Northern California and Nevada. The costs in the
second column include a 10 percent construction contingency and the values in the third column
include estimates for property acquisition, environmental permitting, engineering, administrative,
construction inspection and materials testing costs. Detailed cost estimates for each alternative
can be found in Appendix B.
Table 8 – Alternative Project Comparative Construction Costs
Alternative Construction Cost
($)
Total Cost
($)
Site 1 2,391,890 3,410,267
Site 2 1,896,400 2,745,680
Site 3 2,017,400 2,735,880
Site 4 2,106,500 2,847,800
Site 5 1,634,361 2,411,234
Site 6 1,956,369 2,916,642
Site 7 2,049,300 2,694,160
Site 8 2,264,900 2,992,880
Site 11 2,137,300 2,844,760
Site 12 2,143,900 2,862,680
20-year life cycle cost estimates were also developed for each project alternative using average
cost information from EPA’s Costs of Arsenic Removal Technologies for Small Water Systems
(EPA/600-R-11/090, 2011), vendor quotations, and opinions of industry standard rates (e.g. labor
and power unit costs). Life cycle costs have been calculated using a three percent interest rate and
a 20-year period. Annual operation and maintenance (O&M) costs include chemical usage,
electricity, labor, and solids disposal. Replacement costs include media and miscellaneous
equipment replacement for the 20-year period. Detailed life cycle cost worksheets for each
alternative can be found in Appendix B.

Technical Memorandum No. 1 Arsenic Mitigation Feasibility Study
Farr West Engineering FINAL Plumas Eureka Community Services District
26 Arsenic Mitigation – Preferred Alternative Evaluation
Table 9 – Alternative Project Comparative Life Cycle Costs
Alternative
O&M Cost
($)
Replacement
Cost
($)
20 Year Life
Cycle Cost
($)
Differential
Cost
($)
Site 1 718,574 697,056 4,830,000 720,000
Site 2 718,574 697,056 4,170,000 60,000
Site 3 718,574 697,056 4,160,000 50,000
Site 4 718,574 697,056 4,270,000 160,000
Site 5 718,574 697,056 3,830,000 (280,000)
Site 6 718,574 697,056 4,340,000 230,000
Site 7 718,574 697,056 4,110,000 -
Site 8 718,574 697,056 4,410,000 300,000
Site 11 718,574 697,056 4,260,000 150,000
Site 12 718,574 697,056 4,280,000 170,000
7.0 ALTERNATIVE EVALUATION SUMMARY
A dual-stage treatment facility at Site 5 was determined to be the least costly alternative yet
received the sixth highest score in the non-economic evaluation. The criteria in which this
alternative performed poorly were O&M, Property Acquisition, and Permit Requirements.
Reasons for the lower scoring were the site does not provide a future well site, is the second furthest
from other District facilities, and it is not owned by the District. The highest scoring alternative
in the non-economic evaluation was Site 7 or the existing garage at the District office. This site
provides a WTP location which will have the least impact to the public, will require a minimal
amount of structural improvements, and could enable immediate commencement of design and
construction activities. The only significant drawbacks to this alternative is an unfavorable
condition for a future well site and the need for an additional garage structure to be built to replace
the lost storage. Site 7 project costs were the second lowest of the alternatives and were within
approximately $280,000 or seven percent of the least cost alternative. The Site 7 alternative is
Farr West’s recommended alternative for design and construction of the WTP. Table 10 provides
a summary of the final alternative project rankings.

Technical Memorandum No. 1 Arsenic Mitigation Feasibility Study
Farr West Engineering FINAL Plumas Eureka Community Services District
27 Arsenic Mitigation – Preferred Alternative Evaluation
Table 10 – Alternative Project Rankings
Alternative Rank Score Comparative Cost
($)
Differential
($)
Site 7 1 86.9 2,694,160 -
Site 8 2 82.7 2,992,880 298,720
Site 11 3 82.7 2,844,760 150,600
Site 12 4 81.2 2,862,680 168,520
Site 6 5 80.7 2,916,642 222,482
Site 5 6 78.5 2,411,234 (282,926)
Site 1 7 74.8 3,410,267 716,107
Site 4 8 74.1 2,847,800 153,640
Site 3 9 73.0 2,735,880 41,720
Site 2 10 70.2 2,745,680 51,520
Farr West recommends that the District pursue approval of this analysis from DDW and move
forward with the design and construction of a dual-stage, oxidation/filtration with adsorptive
polishing arsenic treatment plant at the current District office location. It is also recommended
that the District workshop this feasibility study with the public to build consensus amongst the
customer base for the recommended project. The engineering design should take approximately
4 to 6 months to complete with construction activities running another 6 months. If work
commences on July 1, 2017 the expected commissioning of the WTP should occur by April of
2018.
Table 11 provides a complete cost summary for the recommended project. Project components
would include:
• Final environmental documentation determinations.
• Land survey of the parcel and Lundy Lane for the transmission main piping in and out of
the treatment plant.
• Design of chlorine injection system, (3) 6 ft. diameter filter vessels containing greensand,
(2) 6 ft. diameter vessels containing adsorptive media, backwash collection and recycle
facilities, piping, and valving to provide for full or partial stream treatment.
• Electrical, mechanical and controls systems design.
• Encroachment easements with Plumas County in Lundy Lane, Cottonwood Drive, and
Poplar Valley Road for the transmission main and waste line.
• Survey and design of Site 8 for construction of new maintenance storage facility.

Technical Memorandum No. 1 Arsenic Mitigation Feasibility Study
Farr West Engineering FINAL Plumas Eureka Community Services District
28 Arsenic Mitigation – Preferred Alternative Evaluation
Table 11 – Preferred Project Cost Estimate
Item Cost
Mobilization $ 94,000
Water Treatment Equipment $ 450,000
Electrical System $ 275,000
Mechanical System $ 65,000
Site Work $ 80,000
Waste Line $ 20,000
Water Transmission Main $ 324,000
Telemetry and Controls $ 150,000
Building Improvements $ 30,000
Backup Power $ 80,000
Well Pump Improvements $ 50,000
Traffic Control $ 65,000
New Storage Garage $ 180,000
Construction Cost Subtotal = $ 1,863,000
Construction Contingency (10%) = $ 186,300
Construction Total = $ 2,049,300
Other Costs Subtotal = $ 644,860
Project Total = $ 2,694,160

Technical Memorandum No. 1 Arsenic Mitigation Feasibility Study
Farr West Engineering FINAL Plumas Eureka Community Services District
Arsenic Mitigation – Preferred Alternative Evaluation
Appendix A

LINKAN Engineering
2720 Ruby Vista Drive, Suite 101, Elko, Nevada 89801 Office: 775.777.8003
MEMORANDUM
DATE: 4/18/2017
TO: Lucas Tipton
FROM: Sam Billin, P.E., Scott Barton
SUBJECT: Plumas-Eureka Bench-Scale Testing
REFERENCE NO.: 42.01
INTRODUCTION
This memorandum presents the information gathered from bench-scale column testing of Plumas-Eureka Well #2 water using MnO2 media for Mn and As reduction. This work was initiated because onsite pilot test results indicated that addition of ferric chloride, followed by filtration through MnO2 media did not reduce As to compliant levels. This memo also presents test results of different oxidants on Fe reduction. Investigation into Fe characterization confirmed that colloidal iron is present in Well #2. This study was divided into two tasks; Task 100 involved Fe characterization and removal, and Task 200 focused on Mn and As reduction.
During this phase of testing, lab tests were performed that showed that Well #2 has a significant amount of phosphate in it, 100x the amount of As. Phosphorous (PO4) and As are in the same chemical family, and compete with each other for adsorption onto ferric hydroxide, which was formed by the supplemental addition of ferric chloride. Due to the high level of phosphate, it is surmised that the adsorption sites on the ferric hydroxide were predominantly loaded with PO4, and were able to adsorb only a fraction of the available As. The ferric floc was then filtered on the MnO2 media, blocking it from adsorbing the free As, which passed into the effluent in noncompliant concentrations. A test was conducted during the pilot in which no supplemental iron was added, and this test indicated that As could be reduced to compliant levels with adsorption directly onto the MnO2 media. This test served as the basis for the column bench-tests.
The determination that colloidal iron exists in the Well #2 water served as the basis for the performance of the oxidant tests. Colloidal iron is associated with organic iron, which is colloidal iron that is bound to humic acids such as tannins. In order to coagulate this iron into masses large enough to filter, it needs to be released from its organic constituent by destroying the organic material with oxidation.

2
TESTING OVERVIEW
Task 100
This task compared the effects of air, NaOCl, KMnO4 and H2O2 for liberating colloidal iron from the humic acids present in Well #2. Testing was designed to determine the most effective oxidant for this purpose, and was conducted with the use of a polymer flocculent to remove the liberated colloidal iron from the feed water. Solenis DF-2499 was determined via testing to have good flocculation properties in this well water, and was used at a dose of 0.50 ml / L of a 0.25% solution for all oxidants. The chemical oxidant doses were determined by stoichiometric relationships to Fe, Mn and As concentrations. Due to the presence of other contaminants that would react with the oxidation, the values used for testing were 5x and 45x over the stoichiometric values. These doses represented two extremes, a low value close to the stoichiometric ratio, and a high level that greatly exceeds it, for assessing the response of the oxidant. Refer to Table 1 for dose determinations.
Task 200
A one inch test column was constructed with user controlled reaction times, along with chemical injection for pH control and addition of NaOCl for continuous oxidation.
The column was loaded with MnO2 media (Noble House MangOx 20x40 mesh) and flow controlled to match the conditions used during pilot testing at Well #2 conducted in Nov. 2016. One of the November tests indicated that it is possible to reduce As, Mn and Fe using this media without ferric chloride addition, and this was the basis for Task 200.
TEST PROCEDURES
Task 100
Each chemical oxidant was added per Table 1 and mixed for 5 minutes at 150 rpm, prior to addition of polymer.
The polymer was added at 150 rpm, mixed for 1 minute, then slow mixed at 40 rpm for 3 minutes, prior to a settling period of 5 minutes, after which the samples were decanted and filtered through a 5 um filter for solids removal.

3
Table 1: Chemical Dosages for Task 100 Testing
NaOCl
Demand (mg/L) Dose (ml/L)
Feed Concentration Demand Requirement Stoichiometric 5X 45X
Fe 0.25 mg/L 0.64 mg/L 0.1600 mg/L 0.001763 ml/L for Fe 0.008815 0.079339
Mn 0.12 mg/L 1.29 mg/L 0.1548 mg/L 0.001706 ml/L for Mn 0.008529 0.07676
As 0.02 mg/L 0.95 mg/L 0.0190 mg/L 0.000209 ml/L for As 0.001047 0.009421
Total (ml/L) 0.003678 0.018391 0.165521
Total (mg/L) 0.3338 0.33 1.7 15
H2O2
Demand (mg/L) Dose (ml/L)
Feed Concentration Demand Requirement Stoichiometric 5X 45X
Fe 0.25 mg/L 0.3 mg/L 0.075 mg/L 8.3056E-05 ml/L for Fe 0.000415 0.003738
Mn 0.12 mg/L 0.6 mg/L 0.072 mg/L 7.9734E-05 ml/L for Mn 0.000399 0.003588
As 0.02 mg/L 0.35 mg/L 0.007 mg/L 7.7519E-06 ml/L for As 3.88E-05 0.000349
Total (ml/L) 0.00017054 0.000853 0.007674
Total (mg/L) 0.154 0.15 0.8 7
KMnO4
Demand (mg/L) Dose (ml/L)
Feed Concentration Demand Requirement Stoichiometric 5X 45X
Fe 0.25 mg/L 0.94 mg/L 0.2350 mg/L 0.00767974 ml/L for Fe 0.038399 0.345588
Mn 0.12 mg/L 1.92 mg/L 0.2304 mg/L 0.00752941 ml/L for Mn 0.037647 0.338824
As 0.02 mg/L 1.06 mg/L 0.0212 mg/L 0.00069281 ml/L for As 0.003464 0.031176
Total (ml/L) 0.01590196 0.07951 0.715588
Total (mg/L) 0.4866 0.49 2.4 22
The air oxidized sample was processed via a mechanical agitator spinning at 250 rpm for a period of 20 minutes, after which it was treated in the same manner as the chemically treated samples.
Task 200
Well #2 water was passed through the column with the loading rate of 4.30 gpm / ft2, identical to the loading rate used in the original onsite pilot tests. NaOCl was introduced into the system to

4
yield a residual between 0.5 ppm – 2 ppm, and the pH was adjusted down from the natural level of approximately 8, to approximately 7.
TEST RESULTS
Task 100
Table 2 presents the results for the oxidation tests:
Table 2: Oxidation Results
Sample Fe (Total) %
mg/L Reduction
Well #2 Raw (Baseline) 0.25 n/a
1.7 mg/L NaOCl/0.5 ml/L DF-2499 (0.25%) 0.18 28%
15 mg/L NaOCl/0.5 ml/L DF-2499 (0.25%) 0.16 36%
2.4 mg/L KMnO4 (3%)/0.5 ml/L DF-2499 (0.25%) 0.16 36%
22 mg/L KMnO4 (3%)/0.5 ml/L DF-2499 (0.25%) 0.16 36%
0.8 mg/L H2O2 (70%)/0.5 ml/L DF-2499 (0.25%) ND 100%
7 mg/L H2O2 (70%)/0.5 ml/L DF-2499 (0.25%) 0.086 66%
Air (250rpm-15 min)/0.5 ml/L DF-2499 (0.25%) 0.067 73% Note that the highest level of reduction was due to H2O2, with both of the doses showing significant effect on the residual iron concentrations. Air that was introduced via aggressive agitation also exhibited significant iron reductions, while the NaOCl and KMnO4 exhibited maximum reductions of 36%.

5
Task 200
Table 3 presents the results for the MnO2 column tests:
Table 3: Column Test Results
Sample # Run Time (hrs.) Gallons Reaction Time Mn As
% Reduction
Mn As
Baseline 0 0.077 0.014 n/a n/a
1 6 8.44 20 min. 0.0005 n/a 96%
Media Cleaning
2 6 8.44 20 min. 0.027 0.0024 65% 83%
Media Cleaning
3 7 9.84 5 min. 0.012 0.0025 84% 82%
4 11.25 15.82 5 min. 0.027 0.0025 65% 82%
5 14.25 20.04 5 min. 0.024 0.0075 69% 46%
6 17.25 24.26 5 min. 0.051 0.012 34% 14%
7 19.75 27.78 20 min. 0.049 0.012 36% 14%
10 26.50 37.27 20 min. 0.056 0.012 27% 14%
11 28.00 39.38 5 min. 0.042 0.011 45% 21%
Total 40.00 56.26
The results of the column tests indicate that the media can reduce As and Mn to levels of regulatory compliance; however, they also indicate that the overall condition of the media has an effect on its performance, as noted by the increasing levels of those contaminants when media maintenance was not performed. Literature suggests that MnO2 media should be backwashed on a regular basis, and the test data supports the higher levels of performance when the media is cleaner.
CONCLUSIONS
Task 100
The data suggests that effective removal of iron can be achieved with chemical or air oxidation, followed by addition of a compatible polymer. Treatment of colloidal iron by this means is costly and difficult to operate. Consideration of a waiver from the iron Secondary Drinking Water Standards may be a more feasible option given the relatively low levels of iron present in the water.

6
Task 200
Reduction of As and Mn into concentrations that meet regulatory compliance is achievable with MnO2 media. Media maintenance (backwashing) on a regular basis is a crucial component of operating this type of system, and literature suggests that 600 gallons per cubic foot of media can be used as a target value. At that suggested target, the bench-scale system would be subject to backwashing every 7 hours of run time. It was noted that the performance diminished with continuing run time, although compliant results were obtained even when the cleaning periodicity was extended to twice the recommended duration (as noted by sample #5, beyond which the results drifted out of compliance). Media cleaning was conducted at 6 hour intervals for the initial segment of the tests, slightly ahead of the recommended periodicity for the system size in order to verify effectiveness for contaminant reduction, and then was halted in order to generate the degradation rate and obtain cleaning threshold values. The backwashing of this product not only releases adsorbed contaminants, but also causes the irregularly shaped particles to scour each other and fracture – exposing fresh surfaces for adsorption – which helps it remain efficient. The expected rate of media attrition is 3% - 4% per year.
Using this value of 600 gallons per cubic foot of media between backwashes, it was estimated that with an instantaneous flow of 600 gpm and treatment time of 12 hours per day, it would require 5 vessels that were 5 ft. diameter and held 4 ft. of media in order to backwash twice per day. Backwashing only once per day would require 10 such vessels. However, the testing degradation rate demonstrates that it may be possible to double the filter cycle prior to backwashing, which relates to only 5 vessels being necessary for a single daily backwash. It should be noted that MnO2 backwashes are very efficient and only require 5 – 10 minutes to perform due to the release properties of the media, although they require significant flows of approximately 25 gpm / ft2 due to the density of the solid material media.
Additionally, the data would suggest that a reaction time of approximately 5 minutes is more than sufficient to oxidize the contaminants and to keep the media in a regenerated condition, when used in conjunction with 0.5 – 2.0 ppm chlorine residual.
END

PECSD WATER TREATMENT
ARSENIC REMOVAL PILOT STUDY Plumas Pines Public Golf Course Wells 1B and 2
Prepared for:
Prepared by:
2720 Ruby Vista Drive, Suite 101 Elko, NV 89801
775.777.8003 © 2017
January 2017

LINKAN ENGINEERING II REVISED JANUARY 13, 2017
TABLE OF CONTENTS
EXECUTIVE SUMMARY ......................................................................................................... 1-1 1.0 INTRODUCTION ........................................................................................................... 1-1 2.0 DESIGN CRITERIA ....................................................................................................... 2-1
2.1 Water Quality ....................................................................................................... 2-1 2.2 Flow Rates ........................................................................................................... 2-1 2.3 Field Testing ........................................................................................................ 2-2
2.3.1 Equipment ................................................................................................ 2-2 2.3.2 Frequency ................................................................................................. 2-3
2.4 Certified Lab Correlation Testing ........................................................................ 2-3 2.4.1 Initial Correlation ..................................................................................... 2-3 2.4.2 Process Validation ................................................................................... 2-4
3.0 PROCEDURES / EXPERIMENTAL APPROACH ....................................................... 3-1 3.1 Test Configuration ............................................................................................... 3-1 3.2 Well 1b ................................................................................................................. 3-4
3.2.1 Treatment Strategy ................................................................................... 3-4 3.2.2 Filter Run #1 ............................................................................................ 3-5 3.2.3 Filter Run #2 ............................................................................................ 3-5
3.3 Well 2 ................................................................................................................... 3-6 3.3.1 Treatment Strategy ................................................................................... 3-6 3.3.2 Well 2 Testing .......................................................................................... 3-7
4.0 RESULTS ........................................................................................................................ 4-1 4.1 Arsenic, Iron, and Manganese testing results ...................................................... 4-1
4.1.1 Field Testing vs. Laboratory Testing ....................................................... 4-1 4.2 Well 1B ................................................................................................................ 4-4
4.2.1 Projected Chemical Usage ....................................................................... 4-4 4.2.2 Media Loading Rates ............................................................................... 4-5 4.2.3 Volumes of Water Treated ....................................................................... 4-5 4.2.4 As, Fe, and Mn Field Testing................................................................... 4-5 4.2.5 Backwash Cycles ................................................................................... 4-11
4.3 Well 2 ................................................................................................................. 4-12 4.3.1 Projected Chemical Usage ..................................................................... 4-12 4.3.2 Media Loading Rates ............................................................................. 4-13 4.3.3 Volumes of Water Treated ..................................................................... 4-13 4.3.4 Filter Runs .............................................................................................. 4-14 4.3.5 As, Fe, and Mn Field Testing................................................................. 4-15 4.3.7 Backwash Cycles ................................................................................... 4-22
5.0 CONCLUSIONS AND COMMENTS ............................................................................ 5-1

LINKAN ENGINEERING III REVISED JANUARY 13, 2017
LIST OF APPENDICES
Appendix A Pilot Test Log Sheets Appendix B FGL Analytical Results

LINKAN ENGINEERING IV REVISED JANUARY 13, 2017
LIST OF TABLES
Table 2-1: Raw Water Quality ................................................................................................. 2-1 Table 2-2: Well Flow Rates ...................................................................................................... 2-1 Table 2-3: Initial Correlation Results (Sample Taken From Well 2) ....................................... 2-4 Table 2-4: Regulatory Compliance Allowances for PECSD Contaminants ............................ 2-4 Table 3-1: Pre-Filter Run Test Matrix ...................................................................................... 3-2 Table 3-2: Well 1B Filter Run #1 Duration and Flow Volume ................................................ 3-5 Table 3-3: Well 1B Filter Run #1 DP to Termination .............................................................. 3-5 Table 3-4: Well 1B Filter Run #2 Duration and Flow Volume ................................................ 3-5 Table 3-5: Well 1B Filter Run #2 DP to Termination .............................................................. 3-6 Table 4-1: Well 1B and Well 2 Composite Analytical Results ................................................ 4-1 Table 4-2: Field Testing vs. Laboratory Testing Correlation ................................................... 4-3 Table 4-3: Projected Chemical Consumption for Operating a Full-Scale WTP to Treat
Well 1B ................................................................................................................... 4-4 Table 4-4: Well 1B Hydraulic Loading Rate ........................................................................... 4-5 Table 4-5: Filter Run #1 ........................................................................................................... 4-5 Table 4-6: Filter Run #2 ........................................................................................................... 4-5 Table 4-7: Well 1B Filter Run #1 Field Parameter Testing ..................................................... 4-6 Table 4-8: Well 1B Filter Run #1 Raw Water Contaminant Field Test Results ...................... 4-6 Table 4-9: Well 1B Filter Run #1 Chemical Treatment Contaminant Field Test Results ....... 4-6 Table 4-10: Well 1B Filter Run #1 Greensand Contaminant Field Test Results ....................... 4-7 Table 4-11: Well 1B Filter Run #1 MnO2 Contaminant Field Test Results .............................. 4-7 Table 4-12: Well 1B Filter Run #2 Field Parameter Testing ..................................................... 4-8 Table 4-13: Well 1B Filter Run #2 Raw Influent Contaminant Field Test Results ................... 4-9 Table 4-14: Well 1B Filter Run #2 Chemical Treatment Contaminant Field Test Results ....... 4-9 Table 4-15: Well 1B Filter Run #2 Normal Sand Effluent Contaminant Field Test Results ..... 4-9 Table 4-16: Well 1B Filter Run #2 Greensand Effluent Contaminant Field Test Results ....... 4-10 Table 4-17: Well 1B Filter Run #2 MnO2 Effluent Contaminant Field Test Results .............. 4-10 Table 4-18: Well 1B Backwash Imhoff Cone Settling Test Results ........................................ 4-11 Table 4-19: Projected Chemical Consumption for Operating a Full-Scale WTP to Treat
Well 2 .................................................................................................................... 4-12 Table 4-20: Well 2 Hydraulic Loading Rate ............................................................................ 4-13 Table 4-21: Well 2 Filter Run #1 Run Duration and Flow Volume ......................................... 4-13 Table 4-22: Well 2 Filter Run #2 Run Duration and Flow Volume ......................................... 4-13 Table 4-23: Well 2 Filter Run #3 Run Duration and Flow Volume ......................................... 4-14 Table 4-24: Well 2 Filter Run #3-1 Run Duration and Flow Volume ..................................... 4-14 Table 4-25: Well 2 Filter Run #1 Field Parameter Testing ...................................................... 4-15 Table 4-26: Well 2 Filter Run #1 Raw Influent Contaminant Field Test Results .................... 4-16

LINKAN ENGINEERING V REVISED JANUARY 13, 2017
Table 4-27: Well 2 Filter Run #1 Chemical Treatment Contaminant Field Test Results ........ 4-16 Table 4-28: Well 2 Filter Run #1 Greensand Effluent Contaminant Field Test Results .......... 4-16 Table 4-29: Well 2 Filter Run #1 MnO2 Effluent Contaminant Field Test Results ................. 4-17 Table 4-30: Well 2 Filter Run #2 Field Parameter Testing ...................................................... 4-17 Table 4-31: Well 2 Filter Run #2 Raw Influent Contaminant Field Test Results .................... 4-17 Table 4-32: Well 2 Filter Run #2 Chemical Treatment Contaminant Field Test Results ........ 4-18 Table 4-33: Well 2 Filter Run #2 Greensand Effluent Contaminant Field Test Results .......... 4-18 Table 4-34: Well 2 Filter Run #2 MnO2 Effluent Contaminant Field Test Results ................. 4-19 Table 4-35: Well 2 Filter Run #3 Raw Influent Contaminant Field Test Results .................... 4-19 Table 4-36: Well 2 Filter Run #3 Chemical Treatment Contaminant Field Test Results ........ 4-19 Table 4-37: Well 2 Filter Run #3 Greensand Effluent Contaminant Field Test Results .......... 4-20 Table 4-38: Well 2 Filter Run #3 MnO2 Effluent Contaminant Field Test Results ................. 4-20 Table 4-39: Well 2 Filter Run #3-1 Raw Influent Contaminant Field Test Results ................. 4-20 Table 4-40: Well 2 Filter Run #3-1 Chemical Treatment Contaminant Field Test Results ..... 4-21 Table 4-41: Well 2 Filter Run #3-1 Greensand Effluent Contaminant Field Test Results ...... 4-21 Table 4-42: Well 2 Filter Run #3-1 MnO2 Effluent Contaminant Field Test Results .............. 4-21 Table 4-43: Well 2 Backwash Imhoff Cone Settling Test Results ........................................... 4-22

LINKAN ENGINEERING VI REVISED JANUARY 13, 2017
LIST OF FIGURES
Figure 2-1: Image of Field Equipment Used in PECSD Pilot Tests .......................................... 2-3 Figure 3-1: PFD of Process Configuration ................................................................................ 3-1 Figure 3-2: Image of Pilot Test Configuration .......................................................................... 3-4 Figure 3-3: Image of Well 2 Process Tie-In .............................................................................. 3-7 Figure 3-4: MnO2 Media - Effluent Iron vs Flow Rate ............................................................. 3-8 Figure 3-5: MNO2 Media - Reaction Time vs As in Effluent ................................................... 3-8 Figure 3-6: Filter Run #1 – Fe Interpreted Breakthrough Curve ............................................... 3-9 Figure 3-7: Filter Run #2 Greensand DP Extrapolation to Terminal Head Loss ...................... 3-9 Figure 3-8: Filter Run #2 MnO2 DP Extrapolation to Terminal Head Loss ............................ 3-10 Figure 4-1: Well 2 As Concentration –vs- Supplemental Fe Addition...................................... 4-4 Figure 4-2: Well 1B Backwash Effluent in Imhoff Cones after 24 Hours of Settling Time ... 4-12 Figure 4-3: Well 2 Filter Run #2 Effluent Fe vs Time ............................................................ 4-14 Figure 4-4: Well 2 Filter Run #2 Effluent Mn vs Time ........................................................... 4-15 Figure 4-5: Well 2 Backwash Effluent in Imhoff Cones after 24 Hours of Settling Time ...... 4-22

LINKAN ENGINEERING VII REVISED JANUARY 13, 2017
LIST OF ACRONYMS AND ABBREVIATIONS
As Arsenic Avg Average Cond. Conductivity Cl2 Chlorine DP Differential Pressure Diss. Dissolved Fe Iron FeCl3 Ferric Chloride Fe(OH) Ferric Hydroxide FGL Fruit Growers Laboratory gpm Gallons per Minute H2SO4 Sulfuric Acid hrs Hours KMnO4 Potassium Permanganate mg/L Milligrams per Liter ml/L Milliliters per Liter ml/min Milliliters per Minute L/min Liters per Minute L/day Liters per Day mls Milliliters Mn Manganese MnO2 Manganese Dioxide mV millivolts n/a Not Applicable NaOCl Sodium Hypochlorite NPDWR National Primary Drinking Water Regulations NSDWR National Secondary Drinking Water Regulations NTU Nephelometric Turbidity Unit ORP Oxidation-Reduction Potential P Pressure PECSD Plumas Eureka Community Service District pH Decimal Cologarithm of Hydrogen ppb Parts per Billion ppm Parts per Million psi Pounds Per Square Inch RXN Reaction Stdev Standard Deviation
LINKAN ENGINEERING VIII REVISED JANUARY 13, 2017
S.U. Standard Units TDS Total Dissolved Solids Temp Temperature Turb. Turbidity uS/cm MicroSiemens per Centimeter U.S.D. United States Dollars WTP Water Treatment Plant

LINKAN ENGINEERING 1-1 REVISED JANUARY 13, 2017
EXECUTIVE SUMMARY
Two drinking water wells at Plumas Pines Public Golf Course, Well 1B and Well 2, had pilot tests performed on them in November 2016 in order to establish if treatment via normal sand, Greensand or MnO2 media could reduce the As levels to below the current regulatory compliance values. The mechanism for this reduction is dependent on oxidizing the As with chemical additives and therefore making it a charged species which has an affinity for insoluble iron hydroxides. The resulting coagulated mass can then be captured by filters. This mechanism has the potential to not only reduce As concentrations, but Fe also, if the filtration of the solid coagulated masses has high sufficient efficiency. The media types selected for testing also have a high affinity for Mn, enabling this type of treatment to potentially be effective for all constituents of concern for both of the wells.
Well 1B was pilot tested with a small supplemental iron dose that attempted to keep Fe in compliance while still facilitating the reduction of As. Well 2 was pilot tested with a larger supplemental Fe dose. This methodology made possible the comparison of the two different methods of contaminant control, since both wells may experience the range of contaminant concentrations and conditions noted during the pilot test.
The results, as presented by a California certified laboratory, Fruit Growers Lab (FGL), indicate that this treatment methodology is adequate for Mn reduction, but that As and Fe may still exceed compliance.

LINKAN ENGINEERING 1-1 REVISED JANUARY 13, 2017
1.0 INTRODUCTION
This report documents the Pilot Tests that were performed by Linkan for Farr West Engineering on Well 1B and Well 2 from 11/2/16 – 11/18/16.
The tests were performed per the requirements of Farr West Engineering’s Solicitation for Quotations for the Plumas Eureka Community Services District (PECSD) Arsenic Removal Pilot Study. The requirements specified that sand + anthracite, greensand + anthracite, and manganese dioxide + anthracite be directly compared at flow rates between 1 and 10 gpm and over the course of 2 filter runs conducted with no chemical feed or media loading rate adjustments.
The PECSD wells that were selected for pilot tests both have histories of non-compliance at various times of the year for As, Fe and Mn. The treatment strategy for the pilot tests that were performed was primarily directed at the effective removal of As, a NPDWR contaminant, with co-removal of Fe and Mn for aesthetic purposes. This treatment entailed the use of oxidation followed by coagulation/filtration for As and Fe, with Mn and residual Fe being adsorbed onto selective media. The pH of the water was controlled to be within the range of 6.8 – 7.3, levels known to work for As adsorption to ferric hydroxide. This range is also adequate for Mn removal via media adsorption.

LINKAN ENGINEERING 2-1 REVISED JANUARY 13, 2017
2.0 DESIGN CRITERIA
2.1 WATER QUALITY
Table 2-1 presents the concentrations of the constituents of concern found in the raw water. The ‘Total’ fractions of each constituent determine compliance. The concentrations listed were from samples obtained on 10/24/2016 and analyzed by Western Environmental Testing Laboratory (Order ID: 1610725).
Table 2-1: Raw Water Quality
Well 1B
Element Results Units
As (Total) 0.0056 mg/L
As (Dissolved) 0.0056 mg/L
Fe (Total) 0.83 mg/L
Fe (Dissolved) 0.22 mg/L
Mn (Total) 0.11 mg/L
Mn (Dissolved) 0.094 mg/L
Well 2
Elements Results Units
As (Total) 0.016 mg/L
As (Dissolved) 0.012 mg/L
Fe (Total) 0.74 mg/L
Fe (Dissolved) 0.49 mg/L
Mn (Total) 0.16 mg/L
Mn (Dissolved) 0.13 mg/L
2.2 FLOW RATES
It was presented to Linkan that the average service flow rates from each well would be as specified in Table 2-2.
Table 2-2: Well Flow Rates
Designation Flow (gpm)
Well 1 B 300
Well 2 450
LINKAN ENGINEERING 2-2 REVISED JANUARY 13, 2017
2.3 FIELD TESTING
2.3.1 Equipment
Field testing equipment consisted of the following:
1) Myron L 6P multi-parameter instrument for analyzing the following:
pH
ORP
Temp.
Conductivity
TDS
2) Modern Water PDV 6000 Ultra instrument for analyzing the following:
As
3) Hach DR 890 instrument for analyzing the following:
Fe
Mn
4) Hach Rapid Test Chlorine instrument for analyzing the following:
Cl2
5) Hach Turbidimeter instrument for analyzing the following:
Turbidity

LINKAN ENGINEERING 2-3 REVISED JANUARY 13, 2017
Figure 2-1: Image of Field Equipment Used in PECSD Pilot Tests
2.3.2 Frequency
Per the requirements of the Farr West protocols, testing was scheduled to be performed at a minimum frequency of every 2 hours during filter run periods. This schedule was adhered to whenever the systems were operating without issue, but there were times in which some tests were delayed or skipped due to mechanical issues. All tests that were conducted had their results recorded on log sheets (refer to Appendix A).
2.4 CERTIFIED LAB CORRELATION TESTING
2.4.1 Initial Correlation
Fruit Growers Laboratory (FGL) was selected as being the California certified laboratory for compliance validation. Prior to submittal of filter run samples, a raw water correlation sample taken from Well 2 water was submitted to assess field testing results versus those generated by the lab. Table 2-3 presents the initial correlation results. As can be seen in the table, correlation between field testing and lab testing for Fe and Mn is relatively strong. However, the As correlation was not as strong. Field tests were used for process control during the entire course of the pilot study due to the long turnaround time for laboratory results.

LINKAN ENGINEERING 2-4 REVISED JANUARY 13, 2017
Table 2-3: Initial Correlation Results (Sample Taken From Well 2)
mg/L
As (Total)
Fe (Total)
Mn (Total)
Certified Lab 0.011 1.28 0.260
Field Test 0.016 1.40 0.296
% Correlation 69% 91% 88%
2.4.2 Process Validation Multiple samples were submitted for lab analysis, with the samples first being field tested onsite and determined to be in compliance per National Primary Drinking Water Regulations (NPDWR) and National Secondary Drinking Water Regulations (NSDWR).
The analytical results are recorded in Section 4 of this report and are attached as Appendix B.
Table 2-4 presents the NPDWR and NSDWR Regulatory Compliance Allowances for PECSD Contaminants.
Table 2-4: Regulatory Compliance Allowances for PECSD Contaminants
mg/L
As (Total) Fe (Total) Mn (Total)
0.010 0.30 0.050
Linkan also provided Farr West Engineering with the following for additional testing and process validation:
20 gallons of Greensand Effluent generated from Well 2 Filter Run #2
20 gallons of MnO2 Effluent generated from Well 2 Filter Run #2
5 gallons of Greensand Backwash
5 gallons of MnO2 Backwash
Process Validation samples for independent laboratory submittal by PECSD

LINKAN ENGINEERING 3-1 REVISED JANUARY 13, 2017
3.0 PROCEDURES / EXPERIMENTAL APPROACH
3.1 TEST CONFIGURATION
Each well was tested independently, with their respective water flowing through media in vessels that were configured for parallel flow, with optional bypass configurations available allowing a maximum, median or minimum time for chemical reactions to take place. This option was exercised by reconfiguring the plumbing to add or decrease freeboard residence time prior to the water being introduced into the vessels containing filtration / adsorption media.
During the pilot testing, both reaction times and KMnO4 addition in continuous forward flow and as an intermittent backwash constituent for the Greensand vessel were assessed for effects on the ability of the various media types to adsorb iron and manganese. The results of these tests ultimately indicated that the longest possible reaction times performed best. This was due to having more post-chemical addition contact time due to longer freeboard lengths. It was also determined that there was sufficient oxidation of the media by chlorine addition alone, and that addition of KMnO4 was not required for testing purposes – although it may be a necessary component for ensuring the health of the selected media in a full-scale, steady-state operated plant. H2SO4 was added in order to target the effective pH range for treatment, and dosing was held steady throughout the pilot testing.
Figure 3-1: PFD of Process Configuration

LINKAN ENGINEERING 3-2 REVISED JANUARY 13, 2017
Prior to initiating the filter runs, each well was subjected to several tests in order to establish process control settings. Table 3-1 presents specific information for these pre-run tests.
Note 1: Not all samples that were collected were submitted for laboratory analysis.
Note 2: All samples collected were preserved and refrigerated awaiting disposition from Farr West Engineering.
Table 3-1: Pre-Filter Run Test Matrix
Well 1B Pre-Filter Run Testing
Tests Conditions Samples Collected for Lab
Submission Samples
Submitted? Purpose Configuration
1 3 gpm w/20 mg/L NaOCl & pH 7 but no
Iron Addition
n/a n/a assess no Iron Addition
Longest RXN Period
2 3 gpm w/20 mg/L NaOCl & pH 7 & 5 mg/L Iron Addition
11-4 (approx. 1230 hr) Normal Sand, Greensand,
MnO2
no assess Iron Addition
Longest RXN Period
3 3 gpm w/20 mg/L NaOCl & pH 7 & 1.5 mg/L Iron Addition
11-4 (approx. 1815 hr) Normal Sand, Greensand,
MnO2
no assess Iron Addition
Longest RXN Period
4 3 gpm w/15 mg/L NaOCl & pH 7 & 1.5 mg/L Iron Addition
11-5 Normal Sand-1, Greensand-1, MnO2 -1,
Raw-1
no assess NaOCl Addition
Longest RXN Period
5 3 gpm w/15 mg/L NaOCl & pH 7 & 0.6 mg/L Iron Addition
11-5 Normal Sand-2, Greensand-2, MnO2 -2,
Feed-2
no assess Iron Addition
Longest RXN Period
6 3 gpm w/15 mg/L NaOCl & pH 7 & 1.2 mg/L Iron Addition
11-6 Normal Sand-1, Greensand-1, MnO2 -1,
Raw-1
no assess Iron Addition
Longest RXN Period
7 3 gpm w/15 mg/L NaOCl & pH 7 & 0.1 mg/L Iron Addition
11-6 Normal Sand-2, Greensand-2, MnO2 -2,
Feed-2
no assess Iron Addition
Longest RXN Period
1 1 mg/L FeCl3 & 7.5 & 15 mg/L NaOCl & pH
7
n/a n/a Coagulation Assessment
Testing
Bench Test
2 3 mg/L FeCl3 & 7.5 & 15 mg/L NaOCl & pH
7
n/a n/a Coagulation Assessment
Testing
Bench Test
3 5 mg/L FeCl3 & 7.5 & 15 mg/L NaOCl & pH
7
n/a n/a Coagulation Assessment
Testing
Bench Test
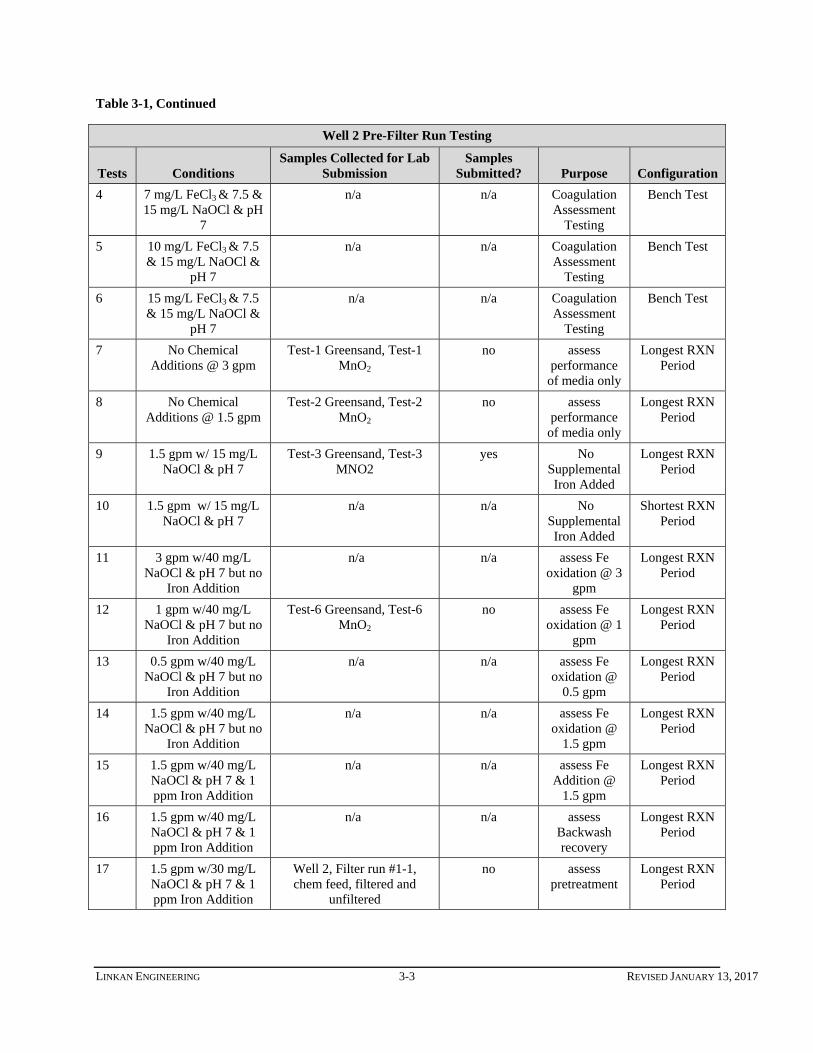
LINKAN ENGINEERING 3-3 REVISED JANUARY 13, 2017
Table 3-1, Continued
Well 2 Pre-Filter Run Testing
Tests Conditions Samples Collected for Lab
Submission Samples
Submitted? Purpose Configuration
4 7 mg/L FeCl3 & 7.5 & 15 mg/L NaOCl & pH
7
n/a n/a Coagulation Assessment
Testing
Bench Test
5 10 mg/L FeCl3 & 7.5 & 15 mg/L NaOCl &
pH 7
n/a n/a Coagulation Assessment
Testing
Bench Test
6 15 mg/L FeCl3 & 7.5 & 15 mg/L NaOCl &
pH 7
n/a n/a Coagulation Assessment
Testing
Bench Test
7 No Chemical Additions @ 3 gpm
Test-1 Greensand, Test-1 MnO2
no assess performance
of media only
Longest RXN Period
8 No Chemical Additions @ 1.5 gpm
Test-2 Greensand, Test-2 MnO2
no assess performance
of media only
Longest RXN Period
9 1.5 gpm w/ 15 mg/L NaOCl & pH 7
Test-3 Greensand, Test-3 MNO2
yes No Supplemental Iron Added
Longest RXN Period
10 1.5 gpm w/ 15 mg/L NaOCl & pH 7
n/a n/a No Supplemental Iron Added
Shortest RXN Period
11 3 gpm w/40 mg/L NaOCl & pH 7 but no
Iron Addition
n/a n/a assess Fe oxidation @ 3
gpm
Longest RXN Period
12 1 gpm w/40 mg/L NaOCl & pH 7 but no
Iron Addition
Test-6 Greensand, Test-6 MnO2
no assess Fe oxidation @ 1
gpm
Longest RXN Period
13 0.5 gpm w/40 mg/L NaOCl & pH 7 but no
Iron Addition
n/a n/a assess Fe oxidation @
0.5 gpm
Longest RXN Period
14 1.5 gpm w/40 mg/L NaOCl & pH 7 but no
Iron Addition
n/a n/a assess Fe oxidation @
1.5 gpm
Longest RXN Period
15 1.5 gpm w/40 mg/L NaOCl & pH 7 & 1 ppm Iron Addition
n/a n/a assess Fe Addition @
1.5 gpm
Longest RXN Period
16 1.5 gpm w/40 mg/L NaOCl & pH 7 & 1 ppm Iron Addition
n/a n/a assess Backwash recovery
Longest RXN Period
17 1.5 gpm w/30 mg/L NaOCl & pH 7 & 1 ppm Iron Addition
Well 2, Filter run #1-1, chem feed, filtered and
unfiltered
no assess pretreatment
Longest RXN Period

LINKAN ENGINEERING 3-4 REVISED JANUARY 13, 2017
Once the plumbing was configured per the test or filter run requirements and the chemical delivery systems were calibrated for use, raw well water was then pumped in forward flow, chemically treated and introduced into the various media types. From there it was directed to a sampling sink. After treatment, it was collected for analysis or subsequently discharged after dechlorination by sodium metabisulfite. Field testing for As, Fe and Mn was performed per the Farr West specified requirements whenever possible, and certified laboratory samples were collected for confirmatory analysis.
Figure 3-2: Image of Pilot Test Configuration
3.2 WELL 1B
Well 1B was piloted from 11/2/16 – 11/8/16. Prior to the start of the filter runs, several tests were performed in order to determine the level of As contamination, as well as the supplemental iron and oxidant doses that would be used. It was determined by these field analyses that Well 1B was currently in regulatory compliance for As and Fe, but not for Mn.
3.2.1 Treatment Strategy
Due to Well 1B being in compliance for As - the primary objective for treatment - a unique challenge was presented for performing the pilot testing. Due to this condition, and due to the likewise compliance of Fe, a strategy of keeping Fe in compliance was adopted while targeting As reduction of 50% or greater. This strategy entailed the use of a supplemental iron dose for enhanced As reduction, but the Fe concentration used was such that Fe would not exceed the
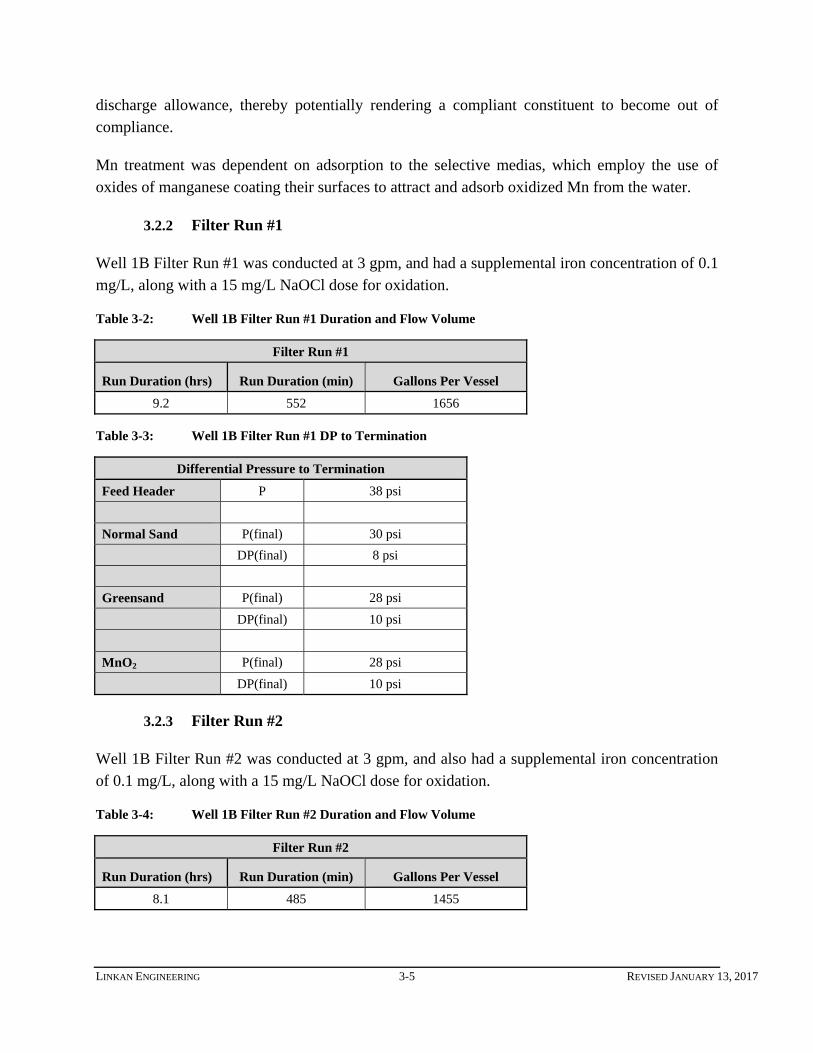
LINKAN ENGINEERING 3-5 REVISED JANUARY 13, 2017
discharge allowance, thereby potentially rendering a compliant constituent to become out of compliance.
Mn treatment was dependent on adsorption to the selective medias, which employ the use of oxides of manganese coating their surfaces to attract and adsorb oxidized Mn from the water.
3.2.2 Filter Run #1
Well 1B Filter Run #1 was conducted at 3 gpm, and had a supplemental iron concentration of 0.1 mg/L, along with a 15 mg/L NaOCl dose for oxidation.
Table 3-2: Well 1B Filter Run #1 Duration and Flow Volume
Filter Run #1
Run Duration (hrs) Run Duration (min) Gallons Per Vessel
9.2 552 1656
Table 3-3: Well 1B Filter Run #1 DP to Termination
Differential Pressure to Termination
Feed Header P 38 psi
Normal Sand P(final) 30 psi
DP(final) 8 psi
Greensand P(final) 28 psi
DP(final) 10 psi
MnO2 P(final) 28 psi
DP(final) 10 psi
3.2.3 Filter Run #2
Well 1B Filter Run #2 was conducted at 3 gpm, and also had a supplemental iron concentration of 0.1 mg/L, along with a 15 mg/L NaOCl dose for oxidation.
Table 3-4: Well 1B Filter Run #2 Duration and Flow Volume
Filter Run #2
Run Duration (hrs) Run Duration (min) Gallons Per Vessel
8.1 485 1455

LINKAN ENGINEERING 3-6 REVISED JANUARY 13, 2017
Table 3-5: Well 1B Filter Run #2 DP to Termination
Differential Pressure to Termination
Feed Header P 40 psi
Normal Sand P(final) n/a
DP(final) n/a
Greensand P(final) 30 psi
DP(final) 10 psi
MnO2 P(final) 31 psi
DP(final) 9 psi
3.3 WELL 2
Well 2 was piloted from 11/10/16 – 11/18/16. Prior to the start of the filter runs, several tests were performed in order to determine the level of As contamination, as well as the supplemental iron and oxidant doses that would be used. The field analyses determined that Well 2 was out of regulatory compliance for Fe, As and Mn.
3.3.1 Treatment Strategy
Due to the non-compliant levels of Fe and higher concentrations of As than was noted for Well 1B, an As treatment strategy employing use of higher levels of supplemental iron than was administered for Well 1B was enacted. In this manner, the As would have additional iron mass present to affect adsorption. It was a treatment goal to reduce the amount of iron in the treated effluent, or to not appreciably increase the effluent levels, if reduction of concentration was not attainable.
Similar to Well 1B, Mn reduction was dependent on adsorption to the selective medias.
Figure 3-3 documents the well tie-in connection for the process feed, with the red hose being used to supply the testing process.

LINKAN ENGINEERING 3-7 REVISED JANUARY 13, 2017
Figure 3-3: Image of Well 2 Process Tie-In
Note: The well pump system was manually actuated and operated continuously for 30 seconds prior to the hose bib being turned on to send water to the process feed tank. This was done to ensure that no chlorine from the well house was introduced into the process feed, since the chlorine injection quill is less than two feet downstream of the hose bib.
3.3.2 Well 2 Testing
During testing, it was determined that in order to get adequate As reduction, oxidation performed best at a level of 500 – 600 mV over the natural ORP of the water. This level of oxidation appeared to sufficiently transform the arsenic from As(III), an uncharged species, to As(V), a charged species with a high affinity for Fe(OH)3. It was also found that the highest degree of retention time that the system could be configured to have was beneficial, and that a filter rate of 1.5 gpm (4.3 gpm/sf) was the fastest rate that could be achieved without increased passage of the contaminants of interest.

LINKAN ENGINEERING 3-8 REVISED JANUARY 13, 2017
Figure 3-4: MnO2 Media - Effluent Iron vs Flow Rate
Figure 3-4 demonstrates that at identical ORP targets and reaction times and similar native Fe concentrations of 0.5 mg/L, a flow rate of 0.5 gpm could yield Fe below the compliance standard. However, this value has a low loading rate for the media. It was determined that there was little difference between the values generated for 1 gpm and 1.5 gpm, but a large jump between those and 3 gpm, so a flow value of 1.5 gpm was selected for use.
Figure 3-5: MNO2 Media - Reaction Time vs As in Effluent
Figure 3-5 presents data that suggests that at a similar As feed concentration and with no supplemental iron addition, As reduction is influenced by detention time in the system, where it is subject to oxidation and scavenging by available iron.
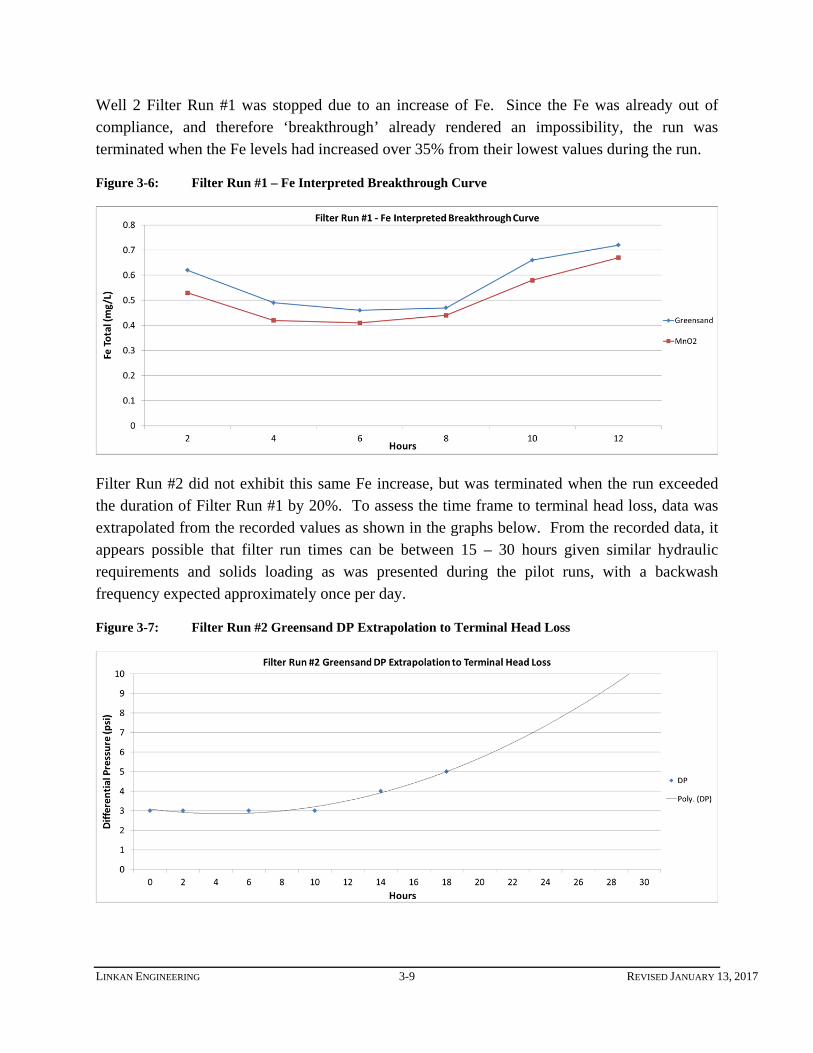
LINKAN ENGINEERING 3-9 REVISED JANUARY 13, 2017
Well 2 Filter Run #1 was stopped due to an increase of Fe. Since the Fe was already out of compliance, and therefore ‘breakthrough’ already rendered an impossibility, the run was terminated when the Fe levels had increased over 35% from their lowest values during the run.
Figure 3-6: Filter Run #1 – Fe Interpreted Breakthrough Curve
Filter Run #2 did not exhibit this same Fe increase, but was terminated when the run exceeded the duration of Filter Run #1 by 20%. To assess the time frame to terminal head loss, data was extrapolated from the recorded values as shown in the graphs below. From the recorded data, it appears possible that filter run times can be between 15 – 30 hours given similar hydraulic requirements and solids loading as was presented during the pilot runs, with a backwash frequency expected approximately once per day.
Figure 3-7: Filter Run #2 Greensand DP Extrapolation to Terminal Head Loss

LINKAN ENGINEERING 3-10 REVISED JANUARY 13, 2017
Figure 3-8: Filter Run #2 MnO2 DP Extrapolation to Terminal Head Loss
Two additional long duration filter runs were performed. These were scheduled in order to assess if As compliance could be achieved in a reduced NaOCl dose scenario, and if so, could the supplemental Fe level also be reduced. These runs were designated Filter Run #3 and Filter Run #3-1, respectively. The controlling factor for these runs was chlorine residual, with a target Cl2 residual of 1 ppm for Filter Run #3 and 0.5 ppm for Filter Run #3-1. This was substantially lower than the residuals recorded in Filter Runs #1 and #2, which were the product of needing significant oxidation in order to achieve adequate floc formation and therefore solids retention within the media. With the media approaching more of a steady-state solids loading prior to these runs, it was possible to assess these chemistry concentrations reductions due to the fact that there would be less passage of solids due to the inefficiencies associated with a relatively clean filter.
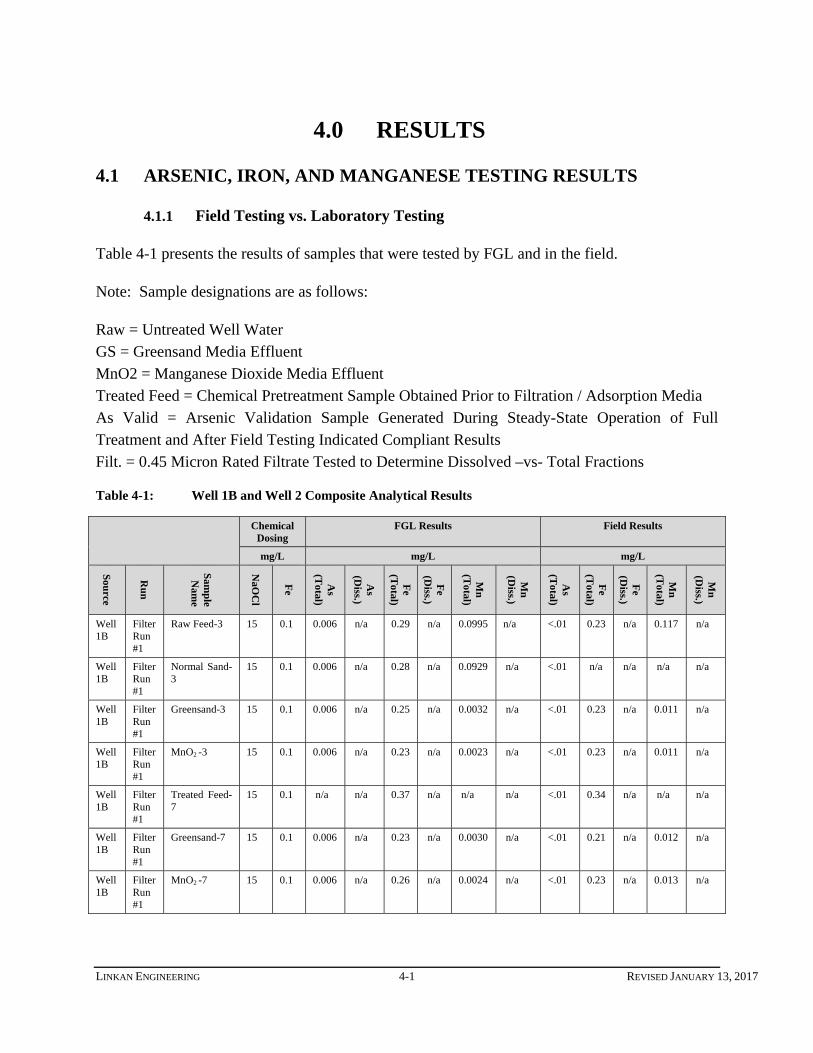
LINKAN ENGINEERING 4-1 REVISED JANUARY 13, 2017
4.0 RESULTS
4.1 ARSENIC, IRON, AND MANGANESE TESTING RESULTS
4.1.1 Field Testing vs. Laboratory Testing
Table 4-1 presents the results of samples that were tested by FGL and in the field.
Note: Sample designations are as follows:
Raw = Untreated Well Water GS = Greensand Media Effluent MnO2 = Manganese Dioxide Media Effluent Treated Feed = Chemical Pretreatment Sample Obtained Prior to Filtration / Adsorption Media As Valid = Arsenic Validation Sample Generated During Steady-State Operation of Full Treatment and After Field Testing Indicated Compliant Results Filt. = 0.45 Micron Rated Filtrate Tested to Determine Dissolved –vs- Total Fractions
Table 4-1: Well 1B and Well 2 Composite Analytical Results
Chemical Dosing
FGL Results Field Results
mg/L mg/L mg/L
Sou
rce
Ru
n
Sam
ple
Nam
e
NaO
Cl
Fe
As
(Total)
As
(Diss.)
Fe
(Total)
Fe
(Diss.)
Mn
(T
otal)
Mn
(D
iss.)
As
(Total)
Fe
(Total)
Fe
(Diss.)
Mn
(T
otal)
Mn
(D
iss.)
Well 1B
Filter Run #1
Raw Feed-3 15 0.1 0.006 n/a 0.29 n/a 0.0995 n/a <.01 0.23 n/a 0.117 n/a
Well 1B
Filter Run #1
Normal Sand-3
15 0.1 0.006 n/a 0.28 n/a 0.0929 n/a <.01 n/a n/a n/a n/a
Well 1B
Filter Run #1
Greensand-3 15 0.1 0.006 n/a 0.25 n/a 0.0032 n/a <.01 0.23 n/a 0.011 n/a
Well 1B
Filter Run #1
MnO2 -3 15 0.1 0.006 n/a 0.23 n/a 0.0023 n/a <.01 0.23 n/a 0.011 n/a
Well 1B
Filter Run #1
Treated Feed-7
15 0.1 n/a n/a 0.37 n/a n/a n/a <.01 0.34 n/a n/a n/a
Well 1B
Filter Run #1
Greensand-7 15 0.1 0.006 n/a 0.23 n/a 0.0030 n/a <.01 0.21 n/a 0.012 n/a
Well 1B
Filter Run #1
MnO2 -7 15 0.1 0.006 n/a 0.26 n/a 0.0024 n/a <.01 0.23 n/a 0.013 n/a

LINKAN ENGINEERING 4-2 REVISED JANUARY 13, 2017
Table 4-1, continued
Sou
rce
Ru
n
Sam
ple
Nam
e
NaO
Cl
Fe
As (T
otal)
As (D
iss.)
Fe (T
otal)
Fe (D
iss.)
Mn
(T
otal)
Mn
(D
iss.)
As (T
otal)
Fe (T
otal)
Fe (D
iss.)
Mn
(T
otal)
Mn
(D
iss.)
Well 1B
Filter Run #2
Raw Feed-1 15 0.1 0.006 n/a 0.29 n/a 0.0979 n/a <.01 n/a n/a n/a n/a
Well 1B
Filter Run #2
Treated Feed-1
15 0.1 n/a n/a 0.33 n/a n/a n/a <.01 0.27 n/a n/a n/a
Well 1B
Filter Run #2
Normal Sand-1
15 0.1 0.007 n/a 0.27 n/a 0.1000 n/a <.01 0.28 n/a 0.118 n/a
Well 1B
Filter Run #2
Greensand-1 15 0.1 0.006 n/a 0.22 n/a 0.0067 n/a <.01 0.23 n/a 0.020 n/a
Well 1B
Filter Run #2
MnO2 -1 15 0.1 0.006 n/a 0.21 n/a 0.0069 n/a <.01 0.23 n/a 0.019 n/a
Well 2
Filter Run #1
W2/Filt Run #1/Raw
15 1 0.018 n/a 0.23 n/a 0.105 n/a 0.012 0.33 n/a n/a n/a
Well 2
Filter Run #1
W2/Filt Run #1/Raw/Filt
15 1 n/a 0.017 n/a 0.35 n/a 0.098 n/a 0.39 0.46 0.088
Well 2
Filter Run #1
W2/Filt Run #1/Chem Feed/Filt
15 1 n/a n/a n/a 0.50 n/a n/a n/a 0.98 0.66 0.088 0.083
Well 2
Filter Run #1
W2/Filt Run #1/GS/As Valid
15 1 0.014 n/a 0.49 n/a 0.0255 n/a 0.008 0.47 n/a 0.026 n/a
Well 2
Filter Run #1
W2/Filt Run #1/ MnO2 /As Valid
15 1 0.011 n/a 0.45 n/a 0.0213 n/a 0.010 0.44 n/a 0.020 n/a
Well 2
Filter Run #2
W2/Filt Run #2/Raw
15 1 0.018 n/a 0.28 n/a 0.100 n/a 0.023 0.51 n/a 0.144 n/a
Well 2
Filter Run #2
W2/Filt Run #2/Chem Feed
15 1 n/a n/a 1.14 n/a n/a n/a n/a 1.45 n/a n/a n/a
Well 2
Filter Run #2
W2/Filt Run #2/GS/Filt
15 1 n/a 0.014 n/a 0.32 n/a 0.0107 n/a n/a n/a n/a n/a
Well 2
Filter Run #2
W2/Filt Run #2/GS/As Valid
15 1 0.015 n/a 0.42 n/a 0.0185 n/a 0.008 0.48 n/a n/a n/a
Well 2
Filter Run #2
W2/Filt Run #2/ MnO2
/Filt
15 1 n/a 0.012 n/a 0.27 n/a 0.0109 n/a n/a n/a n/a n/a
Well 2
Filter Run #2
W2/Filt Run #2/ MnO2 /As Valid
15 1 0.013 n/a 0.37 n/a 0.0159 n/a 0.010 0.45 n/a n/a n/a
Well 2
Filter Run #3
W2/Filt Run #3/Raw
10 1 0.019 n/a 0.39 n/a 0.136 n/a 0.012 n/a n/a n/a n/a

LINKAN ENGINEERING 4-3 REVISED JANUARY 13, 2017
Table 4-1, continued
Sou
rce
Ru
n
Sam
ple
Nam
e
NaO
Cl
Fe
As (T
otal)
As (D
iss.)
Fe (T
otal)
Fe (D
iss.)
Mn
(T
otal)
Mn
(D
iss.)
As (T
otal)
Fe (T
otal)
Fe (D
iss.)
Mn
(T
otal)
Mn
(D
iss.)
Well 2
Filter Run #3
W2/Filt Run #3/GS/As Valid
10 1 0.014 n/a 0.68 n/a 0.0198 n/a 0.008 0.64 n/a 0.028 n/a
Well 2
Filter Run #3
W2/Filt Run #3/ MnO2 /As Valid
7.5 1 0.012 n/a 0.55 n/a 0.0161 n/a 0.006 0.57 n/a 0.025 n/a
Well 2
Filter Run #3-1
W2/Filt Run #3-1/GS/As Valid
7.5 0.5 0.016 n/a 0.42 n/a 0.0161 n/a 0.006 0.49 n/a 0.035 n/a
Well 2
Filter Run #3-1
W2/Filt Run #3-1/ MnO2
/As Valid
7.5 0.5 0.014 n/a 0.36 n/a 0.0142 n/a 0.006 0.42 n/a 0.026 n/a
Well 2
Test-3
W2/Test-3/Greensand
15 0 0.009 n/a 0.52 n/a 0.0217 n/a <.01 0.20 n/a 0.033 n/a
Well 2
Test-3
W2/Test-3/ MnO2
15 0 0.006 n/a 0.46 n/a 0.0158 n/a <.01 0.23 n/a 0.026 n/a
Table 4-2: Field Testing vs. Laboratory Testing Correlation
Correlation (Field/FGL)
As (Total)
Fe (Total)
Fe (Diss.)
Mn (Total)
66% 102% 132% 231%
As noted in Tables 4-1 and 4-2, FGL reported As values in excess of the compliance standard while the field testing indicated compliance. FGL results also showed in many instances a much more dramatic reduction in effluent Mn concentrations than what the field testing indicated. Iron was in reasonable agreement for most samples.
‘Test-3’ samples from Well 2 suggest that it may be possible to achieve As compliance with a NaOCl dose of 15 mg/L and with no supplemental iron addition. This treatment strategy yielded the most effective results as reported by a certified laboratory. The results of the ‘Test-3’ samples yielded compliant As concentrations for both Greensand and MnO2 media types (Refer to Appendix B). However, due to the fact that ‘Test-3’ certified laboratory results were not received until after the pilot test was complete, full filter runs were not performed under the ‘Test-3’ parameters. Refer to the following Figure 4-1 which presents Well 2 As and supplemental iron addition concentration data.

LINKAN ENGINEERING 4-4 REVISED JANUARY 13, 2017
Figure 4-1: Well 2 As Concentration with Supplemental Fe Addition
The data also suggests that the MnO2 media outperformed the Greensand media for Fe reduction and therefore corresponding As reduction, with generally greater than 15% more removal efficiency for As.
4.2 WELL 1B
4.2.1 Projected Chemical Usage
Table 4-3 presents the projected chemical consumption for operating a full-scale WTP to treat Well 1B, with the treatment process operating 25% of the time.
Table 4-3: Projected Chemical Consumption for Operating a Full-Scale WTP to Treat Well 1B
Conc. ppm Dose ml/L L/day
Gallons per day
NaOCl 12.50% 15 0.10 40.88 11
FeCl3 39% 0.3 0.00054 0.22 0.1
H2SO4 96% 10 0.01 4.09 1.1
Ferric chloride doses may be lower than shown, if there is enough iron in the feed water naturally that can be readily oxidized by the NaOCl.
0
0.2
0.4
0.6
0.8
1
1.2
0
0.002
0.004
0.006
0.008
0.01
0.012
0.014
0.016
Test 3 Filt Run #1 Filt Run #2 Filt Run #3
Supplemental Fe (mg/L)
As (m
g/L)
Effluent Source
As (mg/L) with Supplemental Fe (mg/L)
Greensand As (mg/L) MnO2 As (mg/L) As Compliance (mg/L) Supplemental Fe

LINKAN ENGINEERING 4-5 REVISED JANUARY 13, 2017
The sulfuric acid dose may also vary slightly in concentration depending on the fluctuations exhibited in the natural pH of the feed water.
There is also the possibility that KMnO4 may be a required constituent of the treatment in order to keep the selected media regenerated. This chemical was not assessed enough during the pilot testing to determine the quantities required for continuous use.
4.2.2 Media Loading Rates
The hydraulic loading rate of the media for Well 1B is presented in Table 4-4.
Table 4-4: Well 1B Hydraulic Loading Rate
Source gpm Vessel Diameter
(in) Vessel Radius
(in) Vessel Area
(in2) Vessel Area
(ft2) Vessel Loading Rate (gpm/ft2)
Well 1B 3 8 4 50.27 0.35 8.59
4.2.3 Volumes of Water Treated
The volumes of water contacting the media prior to filter run termination for Well 1B are as follows:
Table 4-5: Filter Run #1
Filter Run #1
Run Duration (hrs) Run Duration (min) Gallons Per Vessel
9.2 552 1656
Table 4-6: Filter Run #2
Filter Run #2
Run Duration (hrs) Run Duration (min) Gallons Per Vessel
8.1 485 1455
4.2.4 As, Fe, and Mn Field Testing
4.2.4.1 Well 1B- Filter Run #1
Well 1B was piloted in a manner that used a feed tank that was repeatedly batch filled and then processed. The cycle times, number of batches and batch volumes were recorded in order to totalize flow volumes and document process uptime.

LINKAN ENGINEERING 4-6 REVISED JANUARY 13, 2017
The recorded analytical data is presented in the following tables:
Note: ‘Chemically Treated’ refers to influent well water that has been subjected to chemical additions, but has not been passed through the vessels containing the filtration / adsorption media.
Table 4-7: Well 1B Filter Run #1 Field Parameter Testing
Influent Effluent
Parameter Units Raw Chemically Treated
Normal Sand Greensand MnO2
pH s.u. 7.90 7.24 7.01 7.27 7.19
ORP mV 287 506 483 507 473
Temp deg. C 12.3 12.3 13.9 14.9 14.3
Cond. uS/cm 168.7 211.8 214.7 217.3 214.9
TDS mg/L 112.1 142.1 143.7 145.3 143.8
Turb. NTU 4.3 0.92 0.8 0.82
Table 4-8: Well 1B Filter Run #1 Raw Water Contaminant Field Test Results
Raw Influent
As (mg/L) Fe (mg/L) Mn (mg/L) Turb Test
Total Total Total NTU Event
<.01 0.23 0.117 4.3 1
<.01 0.18 0.117 1.44 2
<.01 0.21 0.115 n/a 3
<.01 0.20 0.114 n/a 4
<.01 0.19 0.116 1.97 5
<.01 0.21 0.114 n/a 6
<.01 0.20 0.113 n/a 7
Table 4-9: Well 1B Filter Run #1 Chemical Treatment Contaminant Field Test Results
Chemically Treated
Fe (mg/L) Mn (mg/L) Test
Total Total Event
0.35 n/a 1

LINKAN ENGINEERING 4-7 REVISED JANUARY 13, 2017
Table 4-9, continued
Chemically Treated
Fe (mg/L) Mn (mg/L) Test
Total Total Event
0.34 0.12 2
0.36 n/a 3
0.48 n/a 4
0.34 n/a 5
0.34 n/a 6
Table 4-10: Well 1B Filter Run #1 Greensand Contaminant Field Test Results
Greensand Effluent
As (mg/L) Fe (mg/L) Mn (mg/L) Turb Cl2 (mg/L) Test
Obtain As Validation Samples
Total Total Total NTU Residual Event
<.01 0.23 0.011 n/a n/a 1 X
<.01 0.19 0.014 n/a n/a 2
<.01 0.19 0.015 0.50 0.18 3
<.01 0.20 0.015 0.50 0.58 4
<.01 0.24 0.013 1.25 0.10 5
<.01 0.23 0.011 n/a n/a 6
<.01 0.21 0.012 1.48 0.21 7
avg. <.01 0.213 0.0130 0.933 0.268
stdev. 0 0.021 0.0017 0.508 0.213
min. <.01 0.19 0.011 0.50 0.10
max. <.01 0.24 0.015 1.48 0.58
Table 4-11: Well 1B Filter Run #1 MnO2 Contaminant Field Test Results
MnO2 Effluent
As (mg/L) Fe (mg/L) Mn (mg/L) Turb Cl2 (mg/L) Test
Obtain As Validation Samples
Total Total Total NTU Residual Event
<.01 0.23 0.011 n/a n/a 1 X
<.01 0.18 0.010 n/a n/a 2
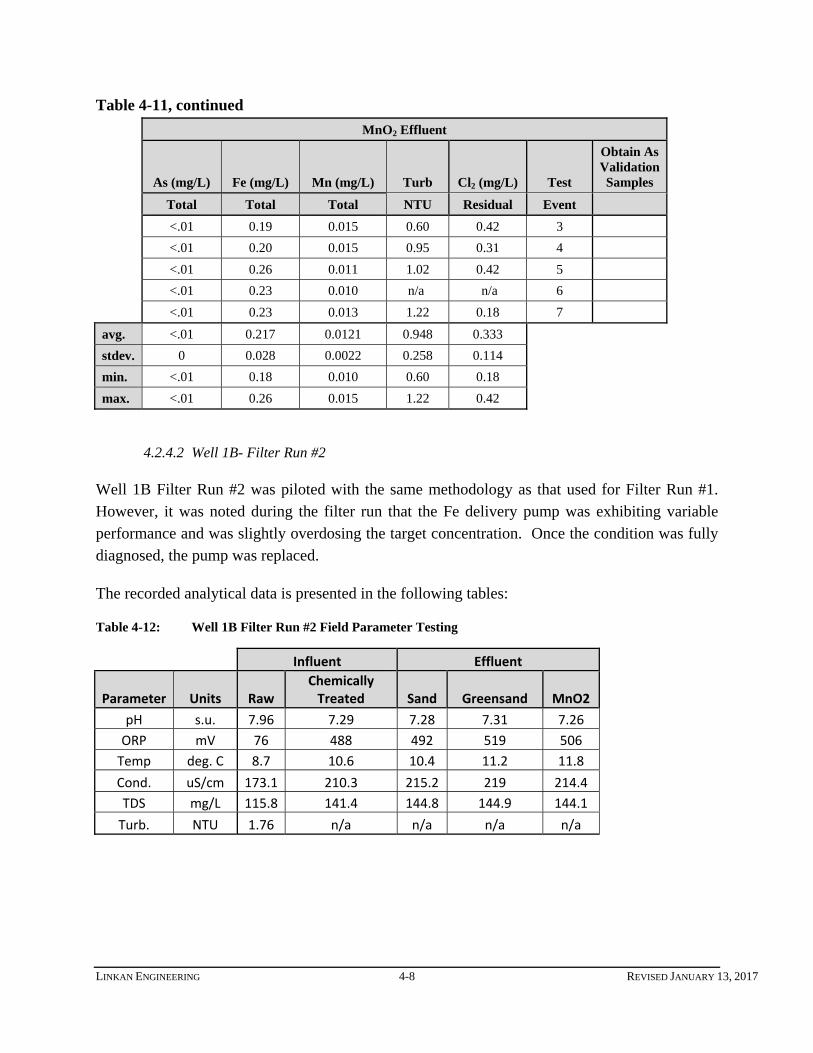
LINKAN ENGINEERING 4-8 REVISED JANUARY 13, 2017
Table 4-11, continued
MnO2 Effluent
As (mg/L) Fe (mg/L) Mn (mg/L) Turb Cl2 (mg/L) Test
Obtain As Validation Samples
Total Total Total NTU Residual Event
<.01 0.19 0.015 0.60 0.42 3
<.01 0.20 0.015 0.95 0.31 4
<.01 0.26 0.011 1.02 0.42 5
<.01 0.23 0.010 n/a n/a 6
<.01 0.23 0.013 1.22 0.18 7
avg. <.01 0.217 0.0121 0.948 0.333
stdev. 0 0.028 0.0022 0.258 0.114
min. <.01 0.18 0.010 0.60 0.18
max. <.01 0.26 0.015 1.22 0.42
4.2.4.2 Well 1B- Filter Run #2
Well 1B Filter Run #2 was piloted with the same methodology as that used for Filter Run #1. However, it was noted during the filter run that the Fe delivery pump was exhibiting variable performance and was slightly overdosing the target concentration. Once the condition was fully diagnosed, the pump was replaced.
The recorded analytical data is presented in the following tables:
Table 4-12: Well 1B Filter Run #2 Field Parameter Testing
Influent Effluent
Parameter Units Raw Chemically Treated Sand Greensand MnO2
pH s.u. 7.96 7.29 7.28 7.31 7.26
ORP mV 76 488 492 519 506
Temp deg. C 8.7 10.6 10.4 11.2 11.8
Cond. uS/cm 173.1 210.3 215.2 219 214.4
TDS mg/L 115.8 141.4 144.8 144.9 144.1
Turb. NTU 1.76 n/a n/a n/a n/a

LINKAN ENGINEERING 4-9 REVISED JANUARY 13, 2017
Table 4-13: Well 1B Filter Run #2 Raw Influent Contaminant Field Test Results
Raw Influent
As (mg/L) Fe (mg/L) Mn (mg/L) Turb
Total Total Total
<.01 0.19 0.123 1.76
<.01 0.21 0.119 n/a
<.01 0.21 n/a n/a
<.01 0.22 n/a n/a
<.01 0.22 0.118 3.11
<.01 0.21 0.117 2.01
<.01 n/a n/a n/a
Table 4-14: Well 1B Filter Run #2 Chemical Treatment Contaminant Field Test Results
Chemically Treated
Fe (mg/L) Mn (mg/L)
Total Total
0.27 n/a
0.46* n/a
0.49* n/a
0.43* n/a
0.39 n/a
0.35 n/a
0.31 n/a Notes: * = Fe dosing pump exhibited variable performance during this time
Table 4-15: Well 1B Filter Run #2 Normal Sand Effluent Contaminant Field Test Results
Normal Sand Effluent
As (mg/L) Fe (mg/L) Mn (mg/L) Turb Cl2 (mg/L)
Obtain As Validation Samples
Test Event
Total Total Total Residual
<.01 0.28 0.118 1.63 0.22 X 1
<.01 n/a n/a n/a n/a 2
<.01 n/a n/a n/a n/a 3

LINKAN ENGINEERING 4-10 REVISED JANUARY 13, 2017
Table 4-16: Well 1B Filter Run #2 Greensand Effluent Contaminant Field Test Results
Greensand Effluent
As (mg/L) Fe (mg/L) Mn (mg/L) Turb Cl2 (mg/L) Test
Obtain As Validation Samples
Total Total Total NTU Residual Event
<.01 0.23 0.020 1.67 0.17 1 X
<.01 0.30 0.016 1.25 0.29 2
<.01 0.36 n/a n/a n/a 3
<.01 0.23 n/a n/a n/a 4
<.01 0.22 0.018 1.16 n/a 5
<.01 0.15 0.018 0.95 0.24 6
<.01 0.18 0.015 n/a n/a 7
avg. <.01 0.239 0.0174 1.258 0.233
stdev. 0 0.071 0.0019 0.302 0.060
min. <.01 0.15 0.015 0.95 0.17
max. <.01 0.36 0.02 1.67 0.29
Table 4-17: Well 1B Filter Run #2 MnO2 Effluent Contaminant Field Test Results
MnO2 Effluent
As (mg/L) Fe (mg/L) Mn (mg/L) Turb Cl2 (mg/L) Test
Obtain As Validation Samples
Total Total Total NTU Residual Event
<.01 0.26 0.018 0.91 0.20 1 X
<.01 0.33 n/a n/a n/a 2
<.01 0.21 n/a n/a n/a 3
<.01 0.18 0.013 1.6 n/a 4
<.01 0.19 0.021 0.7 0.24 5
<.01 0.20 0.018 n/a n/a 6
<.01 0.22 0.016 n/a n/a 7
avg. <.01 0.227 0.0172 1.070 0.220
stdev. 0 0.052 0.0029 0.471 0.028
min. <.01 0.18 0.013 0.70 0.2
max. <.01 0.33 0.021 1.6 0.24

LINKAN ENGINEERING 4-11 REVISED JANUARY 13, 2017
4.2.4.3 Regulatory Compliance Issues
The certified lab results indicated no compliance issues for the treatment of Well 1B when the media used was Greensand or MnO2. Refer to Appendix B for the samples labeled:
Greensand-3, Sampled 11/6/16 at 15:00 MnO2-3, Sampled 11/6/16 at 15:00 Greensand-7, Sampled 11/7/16 at 17:10 MnO2-7, Sampled 11/7/16 at 17:10 Greensand-1, Sampled 11/8/16 at 08:40 MnO2-1, Sampled 11/8/16 at 08:40
4.2.5 Backwash Cycles
4.2.5.1 Reasons for Backwash Cycle
Backwash cycles were performed on the Well 1B filter runs when the DP reached the target of 10 psig for terminal head loss.
4.2.5.2 Imhoff Cone Tests
Imhoff cones were used to collect backwash effluent and perform settling rate tests in order to determine if settling could be efficient enough to enable recycling of the supernatant to the process instead of disposal. The settling test results are presented in Table 4-18.
Table 4-18: Well 1B Backwash Imhoff Cone Settling Test Results
Minutes
15 30 60 120 1440
Normal Sand 2 6 10 11 10 mls of settled solids
Greensand 30 30 30 37 22 mls of settled solids
MnO2 2 3 5.5 9 10 mls of settled solids
Figure 4-2 documents the solids settling and supernatant clarity after 24 hours of settling time:

LINKAN ENGINEERING 4-12 REVISED JANUARY 13, 2017
Figure 4-2: Well 1B Backwash Effluent in Imhoff Cones after 24 Hours of Settling Time
4.3 WELL 2
Well 2 pilot testing initially entailed a supplemental Fe addition of 1.0 mg/L as Fe for Filter Runs #1 and #2, in addition to oxidation by NaOCL to raise the ORP approximately 500 mV over the baseline value. Subsequent to those runs, additional runs (Filter Run #3 and #3-1) were performed with reduced oxidation for the purpose of limiting the oxidation value to approximately 300 – 400 mV over the baseline value, in order to reduce the residual chlorination concentration to approximately 1 ppm. Filter Run #3-1 also was performed using a reduced supplemental Fe addition of 0.5 mg/L as Fe. Test-3, which was conducted prior to the initiation of the filter runs, was also submitted for laboratory analysis in order to compare the effects of iron addition to the feed water, with Test-3 having no supplemental Fe addition.
4.3.1 Projected Chemical Usage
Table 4-19: Projected Chemical Consumption for Operating a Full-Scale WTP to Treat Well 2
Conc. ppm Dose ml/L L/day
Gallons per day
NaOCl 12.50% 15 0.10
61.32 16
FeCl3 39% 3 0.00054
3.31 0.9
H2SO4 96% 10 0.01
6.13 1.6
Table 4-27 presents the projected chemical consumption for operating a full-scale WTP to treat Well 2, with the treatment process operating 25% of the time.
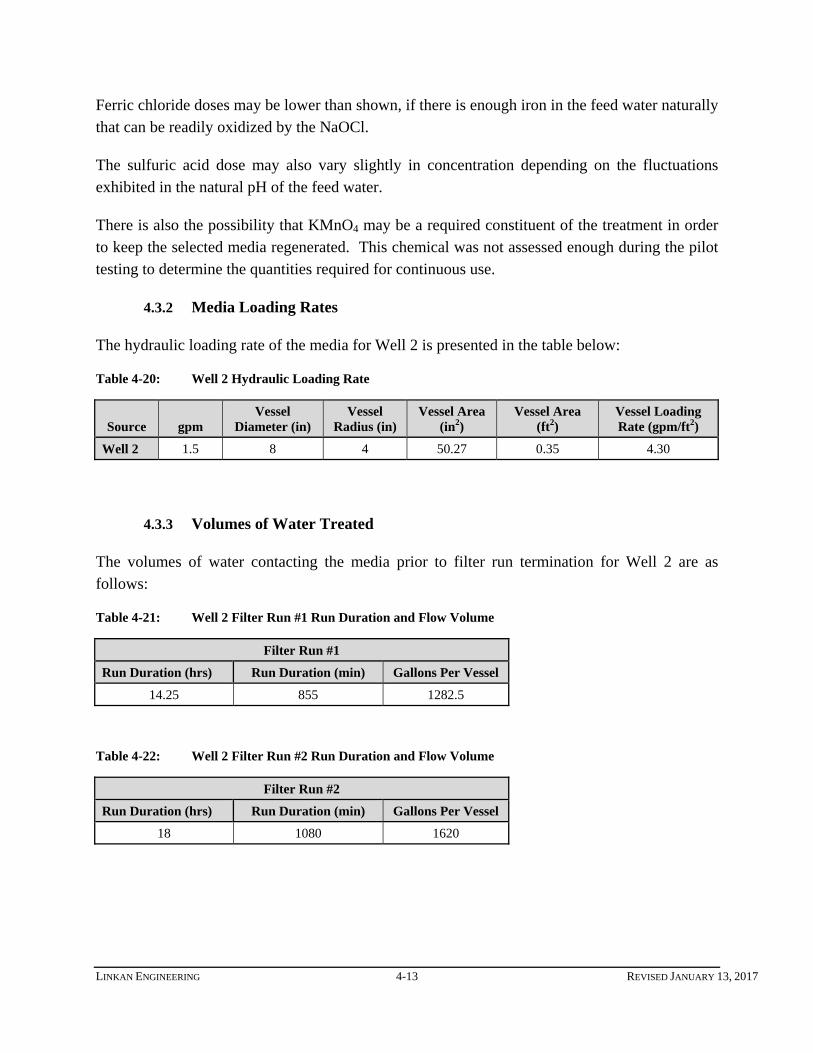
LINKAN ENGINEERING 4-13 REVISED JANUARY 13, 2017
Ferric chloride doses may be lower than shown, if there is enough iron in the feed water naturally that can be readily oxidized by the NaOCl.
The sulfuric acid dose may also vary slightly in concentration depending on the fluctuations exhibited in the natural pH of the feed water.
There is also the possibility that KMnO4 may be a required constituent of the treatment in order to keep the selected media regenerated. This chemical was not assessed enough during the pilot testing to determine the quantities required for continuous use.
4.3.2 Media Loading Rates
The hydraulic loading rate of the media for Well 2 is presented in the table below:
Table 4-20: Well 2 Hydraulic Loading Rate
Source gpm Vessel
Diameter (in) Vessel
Radius (in) Vessel Area
(in2) Vessel Area
(ft2) Vessel Loading Rate (gpm/ft2)
Well 2 1.5 8 4 50.27 0.35 4.30
4.3.3 Volumes of Water Treated
The volumes of water contacting the media prior to filter run termination for Well 2 are as follows:
Table 4-21: Well 2 Filter Run #1 Run Duration and Flow Volume
Filter Run #1
Run Duration (hrs) Run Duration (min) Gallons Per Vessel
14.25 855 1282.5
Table 4-22: Well 2 Filter Run #2 Run Duration and Flow Volume
Filter Run #2
Run Duration (hrs) Run Duration (min) Gallons Per Vessel
18 1080 1620

LINKAN ENGINEERING 4-14 REVISED JANUARY 13, 2017
Table 4-23: Well 2 Filter Run #3 Run Duration and Flow Volume
Filter Run #3
Run Duration (hrs) Run Duration (min) Gallons Per Vessel
7 420 630
Table 4-24: Well 2 Filter Run #3-1 Run Duration and Flow Volume
Filter Run #3-1
Run Duration (hrs) Run Duration (min) Gallons Per Vessel
6.5 390 585
4.3.4 Filter Runs
Well 2 Filter Runs #1 and #2 were performed using a 15 mg/L NaOCl dose, a 1 mg/L as Fe supplemental iron dose, and while keeping the pH between 6.8 – 7.3.
Well 2 was piloted in a manner that used a feed tank that was kept in continuous service during filter runs and so used total cycle duration and flow rate to calculate volumes of water processed.
Figure 4-3, which uses data recorded from Filter Run #2, documents that there is a period of inefficiency of the filter media after backwashing. This inefficiency is reduced as solids load onto the media over time, and then the filter enters into a reasonably steady-state manner of operation. A difficulty for testing arose when the chemistry additions were settled upon when evaluating a clean filter media, and not media that had steady-state levels of solids loading. This inefficient solids capture led to a perceived overdosing of chemistry and prompted further testing with reduced levels of additives. The gap at hour 10 in Figure 4-3 is due to samples not being analyzed due to unforeseen field conditions.
Figure 4-3: Well 2 Filter Run #2 Effluent Fe vs Time
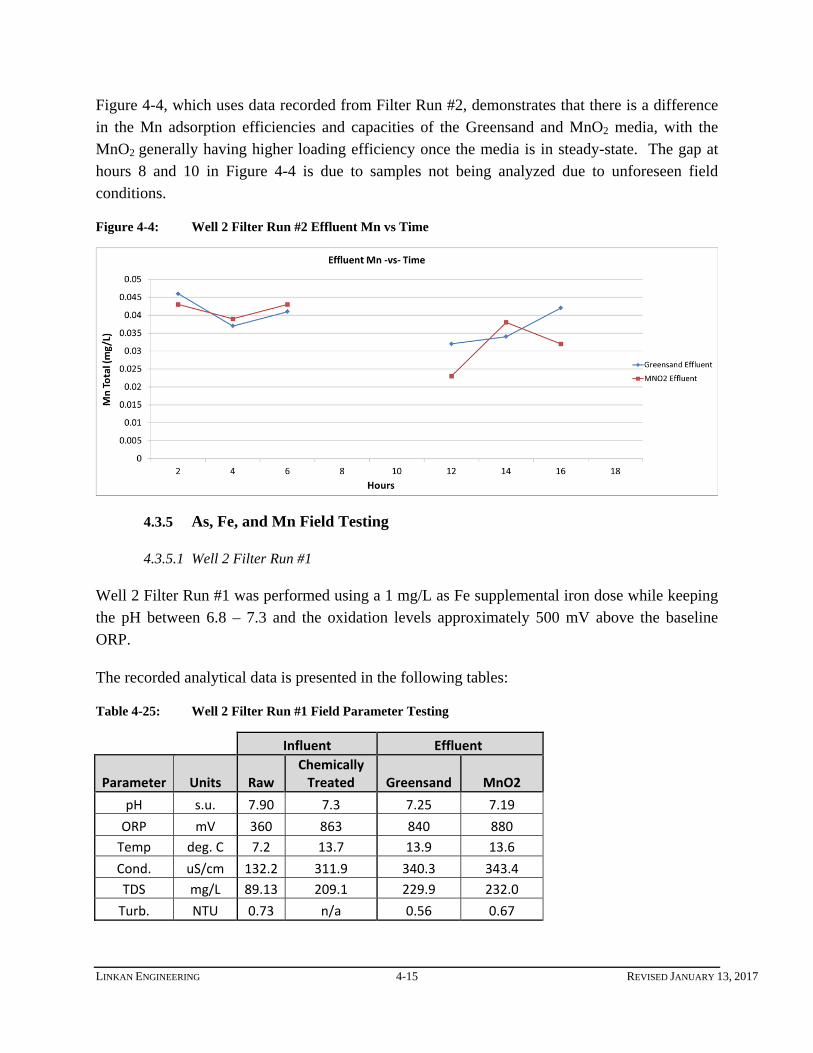
LINKAN ENGINEERING 4-15 REVISED JANUARY 13, 2017
Figure 4-4, which uses data recorded from Filter Run #2, demonstrates that there is a difference in the Mn adsorption efficiencies and capacities of the Greensand and MnO2 media, with the MnO2 generally having higher loading efficiency once the media is in steady-state. The gap at hours 8 and 10 in Figure 4-4 is due to samples not being analyzed due to unforeseen field conditions.
Figure 4-4: Well 2 Filter Run #2 Effluent Mn vs Time
4.3.5 As, Fe, and Mn Field Testing
4.3.5.1 Well 2 Filter Run #1
Well 2 Filter Run #1 was performed using a 1 mg/L as Fe supplemental iron dose while keeping the pH between 6.8 – 7.3 and the oxidation levels approximately 500 mV above the baseline ORP.
The recorded analytical data is presented in the following tables:
Table 4-25: Well 2 Filter Run #1 Field Parameter Testing
Influent Effluent
Parameter Units Raw Chemically Treated Greensand MnO2
pH s.u. 7.90 7.3 7.25 7.19
ORP mV 360 863 840 880
Temp deg. C 7.2 13.7 13.9 13.6
Cond. uS/cm 132.2 311.9 340.3 343.4
TDS mg/L 89.13 209.1 229.9 232.0
Turb. NTU 0.73 n/a 0.56 0.67

LINKAN ENGINEERING 4-16 REVISED JANUARY 13, 2017
Table 4-26: Well 2 Filter Run #1 Raw Influent Contaminant Field Test Results
Raw Influent
As (mg/L) Fe (mg/L) Mn (mg/L) Turb Time
Total Total Total NTU Hours
0.0075 0.33 n/a n/a 0
0.005 0.35 0.142 0.73 6
Table 4-27: Well 2 Filter Run #1 Chemical Treatment Contaminant Field Test Results
Chemically Treated
Fe (mg/L) Time
Total Hours
1.79 2
1.5 6
Table 4-28: Well 2 Filter Run #1 Greensand Effluent Contaminant Field Test Results
Greensand Effluent
As (mg/L) Fe
(mg/L) Mn
(mg/L) Turb Cl2
(mg/L) Time
Obtain As Validation Samples
Total Total Total NTU Residual Hours
<.01 0.62 0.032 0.56 10 0
n/a 0.49 0.034 0.66 10.2 2
n/a 0.46 0.030 n/a n/a 4
n/a n/a n/a n/a n/a 6
<.01 0.47 0.026 n/a 2.70 8 X
n/a n/a n/a n/a n/a 10
n/a 0.66 0.015 n/a n/a 12
n/a 0.72 n/a n/a n/a 14
avg. <.01 0.570 0.0274 0.610 7.633
stdev. 0 0.111 0.008 0.071 4.274
min. <.01 0.46 0.015 0.56 2.70
max. <.01 0.72 0.034 0.66 10.2
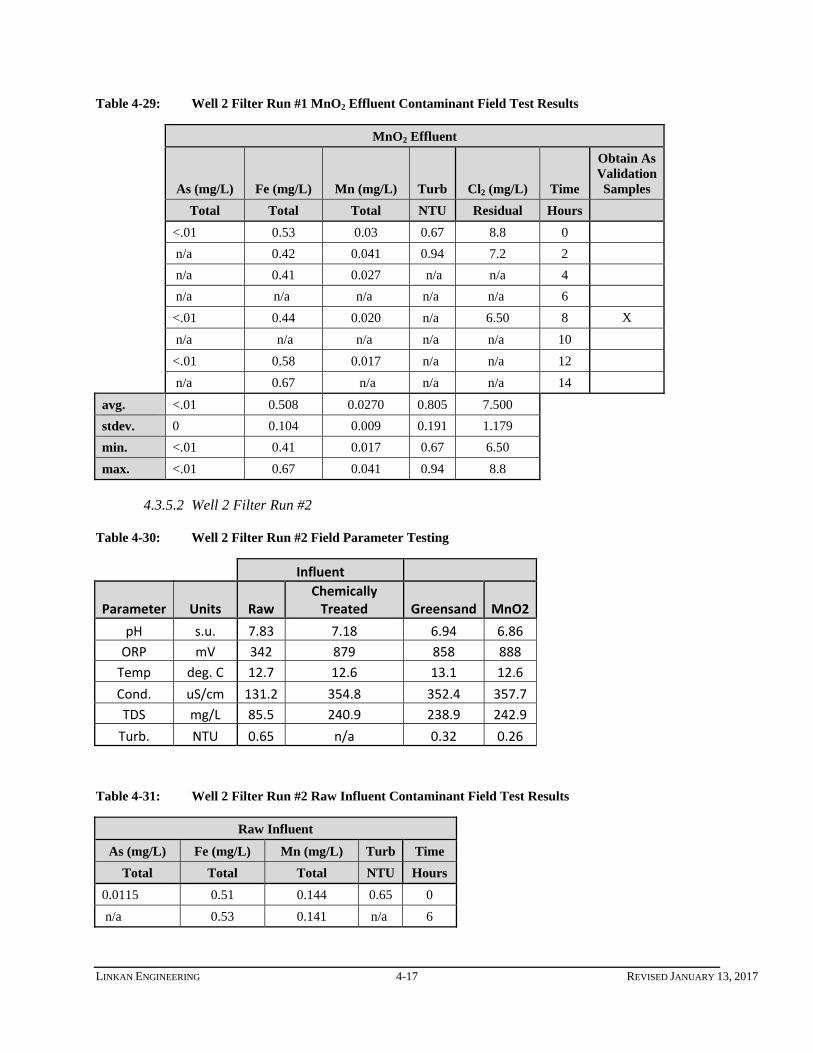
LINKAN ENGINEERING 4-17 REVISED JANUARY 13, 2017
Table 4-29: Well 2 Filter Run #1 MnO2 Effluent Contaminant Field Test Results
MnO2 Effluent
As (mg/L) Fe (mg/L) Mn (mg/L) Turb Cl2 (mg/L) Time
Obtain As Validation Samples
Total Total Total NTU Residual Hours
<.01 0.53 0.03 0.67 8.8 0
n/a 0.42 0.041 0.94 7.2 2
n/a 0.41 0.027 n/a n/a 4
n/a n/a n/a n/a n/a 6
<.01 0.44 0.020 n/a 6.50 8 X
n/a n/a n/a n/a n/a 10
<.01 0.58 0.017 n/a n/a 12
n/a 0.67 n/a n/a n/a 14
avg. <.01 0.508 0.0270 0.805 7.500
stdev. 0 0.104 0.009 0.191 1.179
min. <.01 0.41 0.017 0.67 6.50
max. <.01 0.67 0.041 0.94 8.8
4.3.5.2 Well 2 Filter Run #2
Table 4-30: Well 2 Filter Run #2 Field Parameter Testing
Influent
Parameter Units Raw Chemically Treated Greensand MnO2
pH s.u. 7.83 7.18 6.94 6.86
ORP mV 342 879 858 888
Temp deg. C 12.7 12.6 13.1 12.6
Cond. uS/cm 131.2 354.8 352.4 357.7
TDS mg/L 85.5 240.9 238.9 242.9
Turb. NTU 0.65 n/a 0.32 0.26
Table 4-31: Well 2 Filter Run #2 Raw Influent Contaminant Field Test Results
Raw Influent
As (mg/L) Fe (mg/L) Mn (mg/L) Turb Time
Total Total Total NTU Hours
0.0115 0.51 0.144 0.65 0
n/a 0.53 0.141 n/a 6

LINKAN ENGINEERING 4-18 REVISED JANUARY 13, 2017
Table 4-32: Well 2 Filter Run #2 Chemical Treatment Contaminant Field Test Results
Chemically Treated
Fe (mg/L) Time
Total Hours
1.56 2
1.45 8
1.51 12
Table 4-33: Well 2 Filter Run #2 Greensand Effluent Contaminant Field Test Results
Greensand Effluent
As (mg/L) Fe (mg/L) Mn (mg/L) Turb Cl2 (mg/L) Time
Obtain As Validation Samples
Total Total Total NTU Residual Hours
<.01 1.11 0.046 n/a n/a 2
n/a 0.84 0.037 n/a n/a 4
n/a 0.50 0.041 n/a n/a 6
n/a 0.48 n/a n/a n/a 8
<.01 n/a n/a n/a 10.50 10 X
n/a 0.53 0.032 0.24 n/a 12
n/a 0.51 0.034 n/a n/a 14
n/a 0.52 0.042 n/a n/a 16
<.01 0.53 n/a n/a 9.30 18
avg. <.01 0.628 0.0387 0.240 9.900 stdev. 0 0.227 0.0053 0.000 0.849 min. <.01 0.48 0.032 0.24 9.30 max. <.01 1.11 0.046 0.24 10.5

LINKAN ENGINEERING 4-19 REVISED JANUARY 13, 2017
Table 4-34: Well 2 Filter Run #2 MnO2 Effluent Contaminant Field Test Results
MnO2 Effluent
As (mg/L) Fe (mg/L) Mn (mg/L) Turb Cl2 (mg/L) Time
Obtain As Validation Samples
Total Total Total NTU Residual Hours
<.01 0.9 0.043 n/a n/a 2
n/a 0.9 0.039 n/a n/a 4
n/a 0.47 0.043 n/a n/a 6
n/a 0.45 n/a n/a n/a 8
<.01 n/a n/a 0.16 9.50 10 X
n/a 0.52 0.023 n/a n/a 12
n/a 0.50 0.038 n/a n/a 14
n/a 0.52 0.032 n/a n/a 16
<.01 0.52 n/a n/a 7.80 18
avg. <.01 0.598 0.0363 0.160 8.650
stdev. 0 0.188 0.0077 0.000 1.202
min. <.01 0.45 0.023 0.16 7.80
max. <.01 0.9 0.043 0.16 9.5
4.3.5.3 Well 2 Filter Run #3
Table 4-35: Well 2 Filter Run #3 Raw Influent Contaminant Field Test Results
Raw Influent
As (mg/L) Fe (mg/L) Mn (mg/L) Time
Total Total Total Hours
0.016 0.39 n/a 2
n/a 0.42 0.139 4
Table 4-36: Well 2 Filter Run #3 Chemical Treatment Contaminant Field Test Results
Chemically Treated
Fe (mg/L) Time
Total Hours
1.39 2
1.44 4

LINKAN ENGINEERING 4-20 REVISED JANUARY 13, 2017
Table 4-37: Well 2 Filter Run #3 Greensand Effluent Contaminant Field Test Results
Greensand Effluent
As (mg/L) Fe (mg/L) Mn (mg/L) Turb Cl2 (mg/L) Time
Total Total Total NTU Residual Hours
<.01 0.72 0.026 n/a 1.12 2
<.01 0.55 0.031 n/a 1.33 4
avg. <.01 0.635 0.0285 n/a 1.225
stdev. 0 0.120 0.0035 n/a 0.148
min. <.01 0.55 0.026 n/a 1.12
max. <.01 0.72 0.031 n/a 1.33
Table 4-38: Well 2 Filter Run #3 MnO2 Effluent Contaminant Field Test Results
4.3.6 Well 2 Filter Run #3-1
Table 4-39: Well 2 Filter Run #3-1 Raw Influent Contaminant Field Test Results
Raw Influent
As (mg/L) Fe (mg/L) Mn (mg/L) Time
Total Total Total Hours
0.016 0.41 0.137 2
n/a n/a n/a 4
MNO2 Effluent
As (mg/L) Fe (mg/L) Mn (mg/L) Turb Cl2 (mg/L) Time
Total Total Total NTU Residual Hours
<.01 0.61 0.023 n/a 1.03 2
<.01 0.53 0.027 n/a 1.29 4
avg. <.01 0.570 0.0250 n/a 0.0000
stdev. 0 0.057 0.0028 n/a 0.0028
min. <.01 0.53 0.023 n/a 0.023
max. <.01 0.61 0.027 n/a 0.027

LINKAN ENGINEERING 4-21 REVISED JANUARY 13, 2017
Table 4-40: Well 2 Filter Run #3-1 Chemical Treatment Contaminant Field Test Results
Table 4-41: Well 2 Filter Run #3-1 Greensand Effluent Contaminant Field Test Results
Greensand Effluent
As (mg/L) Fe (mg/L) Mn (mg/L) Cl2 (mg/L) Time
Total Total Total Residual Hours
<.01 0.47 0.032 0.38 2
<.01 0.52 0.038 0.52 4
avg. <.01 0.495 0.035 0.450
stdev. 0 0.035 0.004 0.099
min. <.01 0.47 0.032 0.38
max. <.01 0.52 0.038 0.52
Table 4-42: Well 2 Filter Run #3-1 MnO2 Effluent Contaminant Field Test Results
MNO2 Effluent
As (mg/L) Fe
(mg/L) Mn
(mg/L) Cl2
(mg/L) Time
Total Total Total Residual Hours
<.01 0.40 0.025 0.32 2
<.01 0.44 0.027 0.5 4
avg. <.01 0.420 0.026 0.410
stdev. 0 0.028 0.001 0.127
min. <.01 0.4 0.025 0.32
max. <.01 0.44 0.027 0.5
4.3.6.1 Regulatory Compliance Issues
Per the results of the certified laboratory analyses, Well 2 remained out of compliance for As after Filter Run treatment, although the As concentrations were reduced considerably – especially by the MnO2 media (refer to Appendix B samples obtained between 11/1016 and
Chem Treated
Fe (mg/L) Time
Total Hours
0.92 2
n/a 4

LINKAN ENGINEERING 4-22 REVISED JANUARY 13, 2017
11/18/16). The treatment also consistently drove the Fe levels out of compliance, with the raw water only having a single noncompliant value in the lab tested samples. Mn was treated to compliance by both the Greensand as well as the MnO2 media.
It is possible that by not adding supplemental iron that both As and Fe compliance can be achieved, although there is a great deal of seasonal variability with the native iron concentration which will affect its removal as well as that of As. The addition of supplemental iron was an attempt to produce a robust treatment that would work at any time of year. However, the need to add supplemental iron is subject to debate based upon the laboratory testing results.
4.3.7 Backwash Cycles
Well 2 Filter Run #1 was backwashed due to a relatively sharp and rapid increase of Fe in the effluent. Since Fe was already out of compliance, and therefore breakthrough assessment was not possible, it was decided to end the run and backwash the vessels when the iron increased in value approximately 35%.
Table 4-43 documents the solids recovered from backwash.
Table 4-43: Well 2 Backwash Imhoff Cone Settling Test Results
Minutes
15 30 60 120 1440
Greensand 0 0 0.2 2 3 mls of settled solids
MnO2 30 30 30 30 20 mls of settled solids
Figure 4-5 documents the solids settling and supernatant clarity after 24 hours of settling time.
Figure 4-5: Well 2 Backwash Effluent in Imhoff Cones after 24 Hours of Settling Time

LINKAN ENGINEERING 5-1 REVISED JANUARY 13, 2017
5.0 CONCLUSIONS AND COMMENTS
The data suggests that As may not become compliant with the proposed treatment using the piloted media types and chemical additions, although there were significant reductions demonstrated in As concentrations. The mechanism to drive these concentrations lower and into regulatory compliance is not clear from the analytical results, but it is possible that reducing or removing altogether the supplemental iron dose may beneficially affect the results.
The data further suggests that Greensand or MnO2 media are both adequate for Mn removal; however, Normal Sand had very poor rejection characteristics for Mn and is therefore not recommended for use. The data also suggests that iron may or may not end up in compliance, depending on the initial concentration, the supplemental dose administered, the effects of the chemically administered oxidation, and the filtering efficiencies of the media – which can change due to the state of cleanliness and regeneration of the media.

Technical Memorandum No. 1 Arsenic Mitigation Feasibility Study
Farr West Engineering FINAL Plumas Eureka Community Services District
Arsenic Mitigation – Preferred Alternative Evaluation
Appendix B

ITEM DESCRIPTION TOTAL UNIT UNIT COST TOTAL
1 Mob and Demob 1 LS 109,445$ 109,445$ 2 Water Treatment Equipment (max flow = 360 gpm) 1 LS 450,000$ 450,000$ 3 Electrical 1 LS 275,000$ 275,000$ 4 Mechanical 1 LS 65,000$ 65,000$ 5 Site Work 1 LS 80,000$ 80,000$ 6 Waste Line w/ Manholes 200 LF 100$ 20,000$ 7 Water Transmission Connection 3200 LF 180$ 576,000$ 8 Telemetry and Control 1 LS 150,000$ 150,000$ 9 New Building 1220 SF 200$ 244,000$ 10 Backup Generator + ATS 1 LS 80,000$ 80,000$ 11 Well Pump Improvements 1 LS 50,000$ 50,000$ 12 Traffic Control 1 LS 75,000$ 75,000$
2,174,445$ 217,445$
2,391,890$ 290,000$ 119,594$ 250,000$ 239,189$ 119,594$
1,018,378$ 3,410,267$
ITEM DESCRIPTION TOTAL UNIT UNIT COST TOTAL
1 Mob and Demob 1 LS 87,000$ 87,000$ 2 Water Treatment Equipment (max flow = 360 gpm) 1 LS 450,000$ 450,000$ 3 Electrical 1 LS 275,000$ 275,000$ 4 Mechanical 1 LS 65,000$ 65,000$ 5 Site Work 1 LS 65,000$ 65,000$ 6 Waste Line 300 LF 100$ 30,000$ 7 Water Transmission Connection 850 LF 180$ 153,000$ 8 Telemetry and Control 1 LS 150,000$ 150,000$ 9 New Building 1220 SF 200$ 244,000$ 10 Backup Generator + ATS 1 LS 80,000$ 80,000$ 11 Well Pump Improvements 1 LS 50,000$ 50,000$ 12 Traffic Control 1 LS 75,000$ 75,000$
1,724,000$ 172,400$
1,896,400$ 270,000$
94,820$ 200,000$ 189,640$
94,820$ 849,280$
2,745,680$
PROJECT TOTAL:
ADMINISTRATIVE & LEGAL (5%)PROPERTY ACQUISITION
INSPECTION & CONSTRUCTION MANAGEMENT (10%)MATERIALS TESTING (5%)OTHER COSTS SUBTOTAL:
Site 1
CONSTRUCTION COST SUBTOTAL:10% CONSTRUCTION CONTINGENCY:
CONSTRUCTION TOTAL:ENGINEERING & DESIGN (10%):
Site 2
CONSTRUCTION COST SUBTOTAL:10% CONSTRUCTION CONTINGENCY:
CONSTRUCTION TOTAL:ENGINEERING & DESIGN:
ADMINISTRATIVE & LEGAL (5%)PROPERTY ACQUISITION
INSPECTION & CONSTRUCTION MANAGEMENT (10%)MATERIALS TESTING (5%)OTHER COSTS SUBTOTAL:
PROJECT TOTAL:
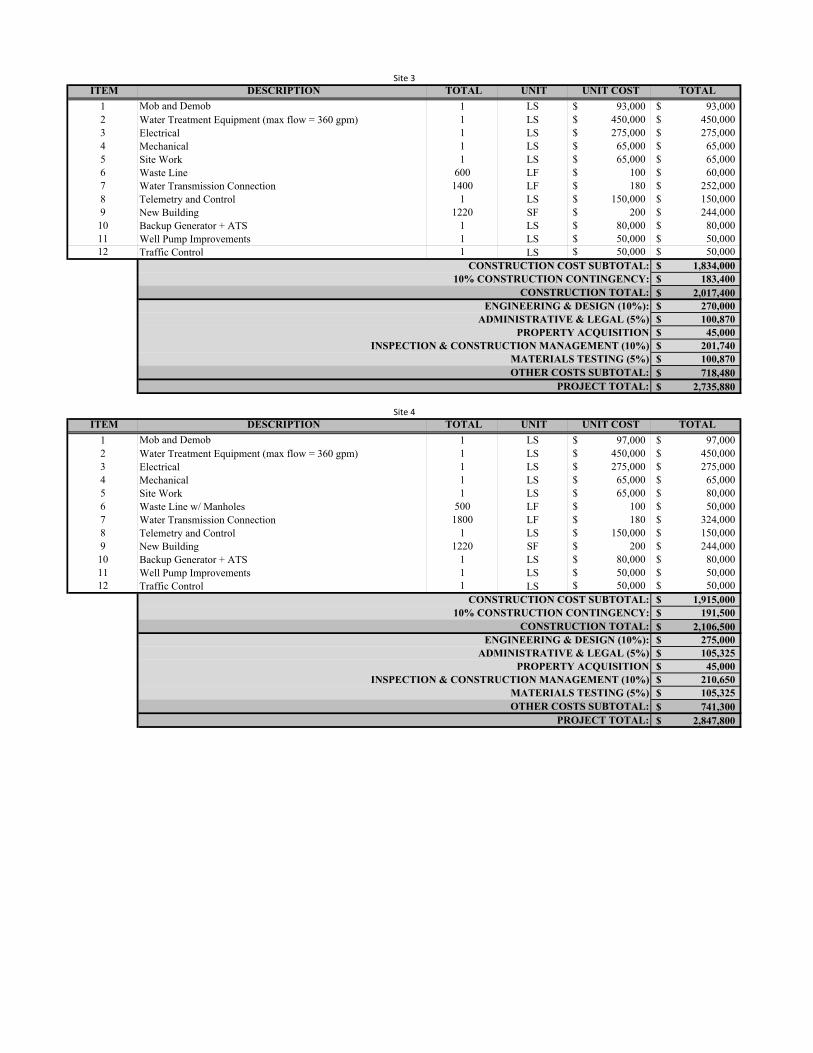
ITEM DESCRIPTION TOTAL UNIT UNIT COST TOTAL
1 Mob and Demob 1 LS 93,000$ 93,000$ 2 Water Treatment Equipment (max flow = 360 gpm) 1 LS 450,000$ 450,000$ 3 Electrical 1 LS 275,000$ 275,000$ 4 Mechanical 1 LS 65,000$ 65,000$ 5 Site Work 1 LS 65,000$ 65,000$ 6 Waste Line 600 LF 100$ 60,000$ 7 Water Transmission Connection 1400 LF 180$ 252,000$ 8 Telemetry and Control 1 LS 150,000$ 150,000$ 9 New Building 1220 SF 200$ 244,000$ 10 Backup Generator + ATS 1 LS 80,000$ 80,000$ 11 Well Pump Improvements 1 LS 50,000$ 50,000$ 12 Traffic Control 1 LS 50,000$ 50,000$
1,834,000$ 183,400$
2,017,400$ 270,000$ 100,870$
45,000$ 201,740$ 100,870$ 718,480$
2,735,880$
ITEM DESCRIPTION TOTAL UNIT UNIT COST TOTAL
1 Mob and Demob 1 LS 97,000$ 97,000$ 2 Water Treatment Equipment (max flow = 360 gpm) 1 LS 450,000$ 450,000$ 3 Electrical 1 LS 275,000$ 275,000$ 4 Mechanical 1 LS 65,000$ 65,000$ 5 Site Work 1 LS 65,000$ 80,000$ 6 Waste Line w/ Manholes 500 LF 100$ 50,000$ 7 Water Transmission Connection 1800 LF 180$ 324,000$ 8 Telemetry and Control 1 LS 150,000$ 150,000$ 9 New Building 1220 SF 200$ 244,000$ 10 Backup Generator + ATS 1 LS 80,000$ 80,000$ 11 Well Pump Improvements 1 LS 50,000$ 50,000$ 12 Traffic Control 1 LS 50,000$ 50,000$
1,915,000$ 191,500$
2,106,500$ 275,000$ 105,325$
45,000$ 210,650$ 105,325$ 741,300$
2,847,800$ PROJECT TOTAL:
ADMINISTRATIVE & LEGAL (5%)PROPERTY ACQUISITION
INSPECTION & CONSTRUCTION MANAGEMENT (10%)MATERIALS TESTING (5%)OTHER COSTS SUBTOTAL:
Site 4
CONSTRUCTION COST SUBTOTAL:10% CONSTRUCTION CONTINGENCY:
CONSTRUCTION TOTAL:ENGINEERING & DESIGN (10%):
Site 3
ENGINEERING & DESIGN (10%):ADMINISTRATIVE & LEGAL (5%)
PROPERTY ACQUISITIONINSPECTION & CONSTRUCTION MANAGEMENT (10%)
MATERIALS TESTING (5%)OTHER COSTS SUBTOTAL:
PROJECT TOTAL:
CONSTRUCTION COST SUBTOTAL:10% CONSTRUCTION CONTINGENCY:
CONSTRUCTION TOTAL:

ITEM DESCRIPTION TOTAL UNIT UNIT COST TOTAL
1 Mob and Demob 1 LS 74,783$ 74,783$ 2 Water Treatment Equipment (max flow = 360 gpm) 1 LS 450,000$ 450,000$ 3 Electrical 1 LS 275,000$ 275,000$ 4 Mechanical 1 LS 65,000$ 65,000$ 5 Site Work 1 LS 50,000$ 80,000$ 6 Waste Line w/ Manholes 200 LF 100$ 20,000$ 7 Water Transmission Connection 700 LF 180$ 126,000$ 8 Telemetry and Control 1 LS 150,000$ 150,000$ 9 Building Improvements 1 LS 50,000$ 50,000$ 10 Backup Generator + ATS 1 LS 80,000$ 80,000$ 11 Well Pump Improvements 1 LS 50,000$ 50,000$ 12 Traffic Control 1 LS 65,000$ 65,000$
1,485,783$ 148,578$
1,634,361$ 220,000$
81,718$ 230,000$ 163,436$
81,718$ 776,872$
2,411,234$
ITEM DESCRIPTION TOTAL UNIT UNIT COST TOTAL
1 Mob and Demob 1 LS 89,517$ 89,517$ 2 Water Treatment Equipment (max flow = 360 gpm) 1 LS 450,000$ 450,000$ 3 Electrical 1 LS 275,000$ 275,000$ 4 Mechanical 1 LS 65,000$ 65,000$ 5 Site Work 1 LS 50,000$ 80,000$ 6 Waste Line w/ Manholes 100 LF 100$ 10,000$ 7 Water Transmission Connection 2300 LF 180$ 414,000$ 8 Telemetry and Control 1 LS 150,000$ 150,000$ 9 Building Improvements 1 LS 50,000$ 50,000$ 10 Backup Generator + ATS 1 LS 80,000$ 80,000$ 11 Well Pump Improvements 1 LS 50,000$ 50,000$ 12 Traffic Control 1 LS 65,000$ 65,000$
1,778,517$ 177,852$
1,956,369$ 220,000$
97,818$ 349,000$ 195,637$
97,818$ 960,274$
2,916,642$
MATERIALS TESTING (5%)OTHER COSTS SUBTOTAL:
PROJECT TOTAL:
CONSTRUCTION TOTAL:ENGINEERING & DESIGN (10%):
ADMINISTRATIVE & LEGAL (5%)PROPERTY ACQUISITION
INSPECTION & CONSTRUCTION MANAGEMENT (10%)
OTHER COSTS SUBTOTAL:PROJECT TOTAL:
Site 6
CONSTRUCTION COST SUBTOTAL:10% CONSTRUCTION CONTINGENCY:
ENGINEERING & DESIGN (10%):ADMINISTRATIVE & LEGAL (5%)
PROPERTY ACQUISITIONINSPECTION & CONSTRUCTION MANAGEMENT (10%)
MATERIALS TESTING (5%)
Site 5
CONSTRUCTION COST SUBTOTAL:10% CONSTRUCTION CONTINGENCY:
CONSTRUCTION TOTAL:

ITEM DESCRIPTION TOTAL UNIT UNIT COST TOTAL
1 Mob and Demob 1 LS 94,000$ 94,000$ 2 Water Treatment Equipment (max flow = 360 gpm) 1 LS 450,000$ 450,000$ 3 Electrical 1 LS 275,000$ 275,000$ 4 Mechanical 1 LS 65,000$ 65,000$ 5 Site Work 1 LS 50,000$ 80,000$ 6 Waste Line w/ Manholes 200 LF 100$ 20,000$ 7 Water Transmission Connection 1800 LF 180$ 324,000$ 8 Telemetry and Control 1 LS 150,000$ 150,000$ 9 Building Improvements 1 LS 30,000$ 30,000$ 10 Backup Generator + ATS 1 LS 80,000$ 80,000$ 11 Well Pump Improvements 1 LS 50,000$ 50,000$ 12 Traffic Control 1 LS 65,000$ 65,000$ 13 New Garage 900 SF 200$ 180,000$
1,863,000$ 186,300$
2,049,300$ 235,000$ 102,465$
-$ 204,930$ 102,465$ 644,860$
2,694,160$
ITEM DESCRIPTION TOTAL UNIT UNIT COST TOTAL
1 Mob and Demob 1 LS 104,000$ 104,000$ 2 Water Treatment Equipment (max flow = 360 gpm) 1 LS 450,000$ 450,000$ 3 Electrical 1 LS 275,000$ 275,000$ 4 Mechanical 1 LS 65,000$ 65,000$ 5 Site Work 1 LS 65,000$ 80,000$ 6 Waste Line w/ Manholes 100 LF 100$ 10,000$ 7 Water Transmission Connection 2700 LF 180$ 486,000$ 8 Telemetry and Control 1 LS 150,000$ 150,000$ 9 New Building 1220 SF 200$ 244,000$ 10 Backup Generator + ATS 1 LS 80,000$ 80,000$ 11 Well Pump Improvements 1 LS 50,000$ 50,000$ 12 Traffic Control 1 LS 65,000$ 65,000$
2,059,000$ 205,900$
2,264,900$ 275,000$ 113,245$
-$ 226,490$ 113,245$ 727,980$
2,992,880$
PROPERTY ACQUISITIONINSPECTION & CONSTRUCTION MANAGEMENT (10%)
MATERIALS TESTING (5%)OTHER COSTS SUBTOTAL:
PROJECT TOTAL:
CONSTRUCTION COST SUBTOTAL:10% CONSTRUCTION CONTINGENCY:
CONSTRUCTION TOTAL:ENGINEERING & DESIGN (10%):
ADMINISTRATIVE & LEGAL (5%)
INSPECTION & CONSTRUCTION MANAGEMENT (10%)MATERIALS TESTING (5%)OTHER COSTS SUBTOTAL:
PROJECT TOTAL:
Site 8
10% CONSTRUCTION CONTINGENCY:CONSTRUCTION TOTAL:
ENGINEERING & DESIGN (10%):ADMINISTRATIVE & LEGAL (5%)
PROPERTY ACQUISITION
Site 7
CONSTRUCTION COST SUBTOTAL:

ITEM DESCRIPTION TOTAL UNIT UNIT COST TOTAL
1 Mob and Demob 1 LS 98,000$ 98,000$ 2 Water Treatment Equipment (max flow = 360 gpm) 1 LS 450,000$ 450,000$ 3 Electrical 1 LS 275,000$ 275,000$ 4 Mechanical 1 LS 65,000$ 65,000$ 5 Site Work 1 LS 65,000$ 80,000$ 6 Waste Line w/ Manholes 50 LF 100$ 5,000$ 7 Water Transmission Connection 2200 LF 180$ 396,000$ 8 Telemetry and Control 1 LS 150,000$ 150,000$ 9 New Building 1220 SF 200$ 244,000$ 10 Backup Generator + ATS 1 LS 80,000$ 80,000$ 11 Well Pump Improvements 1 LS 50,000$ 50,000$ 12 Traffic Control 1 LS 50,000$ 50,000$
1,943,000$ 194,300$
2,137,300$ 280,000$ 106,865$
-$ 213,730$ 106,865$ 707,460$
2,844,760$
ITEM DESCRIPTION TOTAL UNIT UNIT COST TOTAL
1 Mob and Demob 1 LS 99,000$ 99,000$ 2 Water Treatment Equipment (max flow = 360 gpm) 1 LS 450,000$ 450,000$ 3 Electrical 1 LS 275,000$ 275,000$ 4 Mechanical 1 LS 65,000$ 65,000$ 5 Site Work 1 LS 65,000$ 80,000$ 6 Waste Line w/ Manholes 100 LF 100$ 10,000$ 7 Water Transmission Connection 2200 LF 180$ 396,000$ 8 Telemetry and Control 1 LS 150,000$ 150,000$ 9 New Building 1220 SF 200$ 244,000$ 10 Backup Generator + ATS 1 LS 80,000$ 80,000$ 11 Well Pump Improvements 1 LS 50,000$ 50,000$ 12 Traffic Control 1 LS 50,000$ 50,000$
1,949,000$ 194,900$
2,143,900$ 290,000$ 107,195$
-$ 214,390$ 107,195$ 718,780$
2,862,680$ OTHER COSTS SUBTOTAL:
PROJECT TOTAL:
ENGINEERING & DESIGN (10%):ADMINISTRATIVE & LEGAL (5%)
PROPERTY ACQUISITIONINSPECTION & CONSTRUCTION MANAGEMENT (10%)
MATERIALS TESTING (5%)
PROJECT TOTAL:
Site 12
CONSTRUCTION COST SUBTOTAL:10% CONSTRUCTION CONTINGENCY:
CONSTRUCTION TOTAL:
ADMINISTRATIVE & LEGAL (5%)PROPERTY ACQUISITION
INSPECTION & CONSTRUCTION MANAGEMENT (10%)MATERIALS TESTING (5%)OTHER COSTS SUBTOTAL:
Site 11
CONSTRUCTION COST SUBTOTAL:10% CONSTRUCTION CONTINGENCY:
CONSTRUCTION TOTAL:ENGINEERING & DESIGN (10%):

20 years Net Discount Rate: 3.0% A. 3,410,267$
B.1 2,933$ 2 31,200$ 3 9,166$ 4 -$ 5 -$ 6 5,000$ 789
1048,299$ 14.8775
718,574$
C. Year Amount PW Factor P/F Present Worth
2 90,000$ 0.9426 84,834$ 4 90,000$ 0.8885 79,964$ 6 90,000$ 0.8375 75,374$ 8 90,000$ 0.7894 71,047$ 10 90,000$ 0.7441 66,968$ 12 90,000$ 0.7014 63,124$ 14 90,000$ 0.6611 59,501$ 16 90,000$ 0.6232 56,085$ 18 90,000$ 0.5874 52,866$ 20 90,000$ 0.5537 49,831$ 10 7,500$ 0.7441 5,581$ 20 7,500$ 0.5537 4,153$ 10 7,500$ 0.7441 5,581$ 20 40,000$ 0.5537 22,147$
Present Worth of Replacement Costs 697,056$ D. 1,415,630$ E. 1,420,000$ F. Total Present Worth Cost (A + E) 4,830,267$ G. 4,830,000$
Media Replacement - Oxidation/Filtration
Media ReplacementMedia ReplacementMedia ReplacementMedia ReplacementMedia Replacement - Oxidation/Filtration
Media ReplacementMedia ReplacementMedia ReplacementMedia ReplacementMedia Replacement
TOTAL PRESENT WORTH COST (A + E) - ROUNDED
Present Worth FactorPresent Worth of Annual Costs
Replacement Costs
Power (assume $0.08/1,000 gal treated)
Total Annual Costs and Replacement Costs (B + C)
Total Annual Costs
Chemicals (pH adjustment) ($0.26/1,000 gal treated)Solids Disposal
Iron Addition (FeCl) ($0.02/1,000 gal treated)Chemicals ($0.25/1,000 gal treated)
Media Replacement
Total Annual Costs and Replacement Costs (B + C) - ROUNDED
Life Cycle Period:Initial Cost
Annual Costs
Labor (assume 12hr/wk - $50/hr)
Chemical Pump ReplacementInstrumentation & Controls
PECSD Arsenic Mitigation
Life Cycle Cost Worksheet - (350gpm)
Water Treatment Plant at Site 1

20 years Net Discount Rate: 3.0% A. 2,745,680$
B.1 2,933$ 2 31,200$ 3 9,166$ 4 -$ 5 -$ 6 5,000$ 789
1048,299$ 14.8775
718,574$
C. Year Amount PW Factor P/F Present Worth
2 90,000$ 0.9426 84,834$ 4 90,000$ 0.8885 79,964$ 6 90,000$ 0.8375 75,374$ 8 90,000$ 0.7894 71,047$ 10 90,000$ 0.7441 66,968$ 12 90,000$ 0.7014 63,124$ 14 90,000$ 0.6611 59,501$ 16 90,000$ 0.6232 56,085$ 18 90,000$ 0.5874 52,866$ 20 90,000$ 0.5537 49,831$ 10 7,500$ 0.7441 5,581$ 20 7,500$ 0.5537 4,153$ 10 7,500$ 0.7441 5,581$ 20 40,000$ 0.5537 22,147$
Present Worth of Replacement Costs 697,056$ D. 1,415,630$ E. 1,420,000$ F. Total Present Worth Cost (A + E) 4,165,680$ G. 4,170,000$ TOTAL PRESENT WORTH COST (A + E) - ROUNDED
Total Annual Costs and Replacement Costs (B + C)Total Annual Costs and Replacement Costs (B + C) - ROUNDED
Media ReplacementMedia ReplacementMedia Replacement - Oxidation/FiltrationMedia Replacement - Oxidation/FiltrationChemical Pump ReplacementInstrumentation & Controls
Media ReplacementMedia ReplacementMedia ReplacementMedia ReplacementMedia ReplacementMedia Replacement
Total Annual CostsPresent Worth Factor
Present Worth of Annual Costs
Replacement Costs
Media ReplacementMedia Replacement
Chemicals (pH adjustment) ($0.26/1,000 gal treated)Solids Disposal
Annual CostsPower (assume $0.08/1,000 gal treated)Labor (assume 12hr/wk - $50/hr)Chemicals ($0.25/1,000 gal treated)Iron Addition (FeCl) ($0.02/1,000 gal treated)
Life Cycle Period:Initial Cost
PECSD Arsenic Mitigation
Water Treatment Plant at Site 2
Life Cycle Cost Worksheet - (350gpm)

20 years Net Discount Rate: 3.0% A. 2,735,880$
B.1 2,933$ 2 31,200$ 3 9,166$ 4 -$ 5 -$ 6 5,000$ 789
1048,299$ 14.8775
718,574$
C. Year Amount PW Factor P/F Present Worth
2 90,000$ 0.9426 84,834$ 4 90,000$ 0.8885 79,964$ 6 90,000$ 0.8375 75,374$ 8 90,000$ 0.7894 71,047$ 10 90,000$ 0.7441 66,968$ 12 90,000$ 0.7014 63,124$ 14 90,000$ 0.6611 59,501$ 16 90,000$ 0.6232 56,085$ 18 90,000$ 0.5874 52,866$ 20 90,000$ 0.5537 49,831$ 10 7,500$ 0.7441 5,581$ 20 7,500$ 0.5537 4,153$ 10 7,500$ 0.7441 5,581$ 20 40,000$ 0.5537 22,147$
Present Worth of Replacement Costs 697,056$ D. 1,415,630$ E. 1,420,000$ F. Total Present Worth Cost (A + E) 4,155,880$ G. 4,160,000$ TOTAL PRESENT WORTH COST (A + E) - ROUNDED
Total Annual Costs and Replacement Costs (B + C)Total Annual Costs and Replacement Costs (B + C) - ROUNDED
Media ReplacementMedia ReplacementMedia Replacement - Oxidation/FiltrationMedia Replacement - Oxidation/FiltrationChemical Pump ReplacementInstrumentation & Controls
Media ReplacementMedia ReplacementMedia ReplacementMedia ReplacementMedia ReplacementMedia Replacement
Total Annual CostsPresent Worth Factor
Present Worth of Annual Costs
Replacement Costs
Media ReplacementMedia Replacement
Chemicals (pH adjustment) ($0.26/1,000 gal treated)Solids Disposal
Annual CostsPower (assume $0.08/1,000 gal treated)Labor (assume 12hr/wk - $50/hr)Chemicals ($0.25/1,000 gal treated)Iron Addition (FeCl) ($0.02/1,000 gal treated)
Life Cycle Period:Initial Cost
PECSD Arsenic Mitigation
Water Treatment Plant at Site 3
Life Cycle Cost Worksheet - (350gpm)

20 years Net Discount Rate: 3.0% A. 2,847,800$
B.1 2,933$ 2 31,200$ 3 9,166$ 4 -$ 5 -$ 6 5,000$ 789
1048,299$ 14.8775
718,574$
C. Year Amount PW Factor P/F Present Worth
2 90,000$ 0.9426 84,834$ 4 90,000$ 0.8885 79,964$ 6 90,000$ 0.8375 75,374$ 8 90,000$ 0.7894 71,047$ 10 90,000$ 0.7441 66,968$ 12 90,000$ 0.7014 63,124$ 14 90,000$ 0.6611 59,501$ 16 90,000$ 0.6232 56,085$ 18 90,000$ 0.5874 52,866$ 20 90,000$ 0.5537 49,831$ 10 7,500$ 0.7441 5,581$ 20 7,500$ 0.5537 4,153$ 10 7,500$ 0.7441 5,581$ 20 40,000$ 0.5537 22,147$
Present Worth of Replacement Costs 697,056$ D. 1,415,630$ E. 1,420,000$ F. Total Present Worth Cost (A + E) 4,267,800$ G. 4,270,000$ TOTAL PRESENT WORTH COST (A + E) - ROUNDED
Total Annual Costs and Replacement Costs (B + C)Total Annual Costs and Replacement Costs (B + C) - ROUNDED
Media ReplacementMedia ReplacementMedia Replacement - Oxidation/FiltrationMedia Replacement - Oxidation/FiltrationChemical Pump ReplacementInstrumentation & Controls
Media ReplacementMedia ReplacementMedia ReplacementMedia ReplacementMedia ReplacementMedia Replacement
Total Annual CostsPresent Worth Factor
Present Worth of Annual Costs
Replacement Costs
Media ReplacementMedia Replacement
Chemicals (pH adjustment) ($0.26/1,000 gal treated)Solids Disposal
Annual CostsPower (assume $0.08/1,000 gal treated)Labor (assume 12hr/wk - $50/hr)Chemicals ($0.25/1,000 gal treated)Iron Addition (FeCl) ($0.02/1,000 gal treated)
Life Cycle Period:Initial Cost
PECSD Arsenic Mitigation
Water Treatment Plant at Site 4
Life Cycle Cost Worksheet - (350gpm)

20 years Net Discount Rate: 3.0% A. 2,411,234$
B.1 2,933$ 2 31,200$ 3 9,166$ 4 -$ 5 -$ 6 5,000$ 789
1048,299$ 14.8775
718,574$
C. Year Amount PW Factor P/F Present Worth
2 90,000$ 0.9426 84,834$ 4 90,000$ 0.8885 79,964$ 6 90,000$ 0.8375 75,374$ 8 90,000$ 0.7894 71,047$ 10 90,000$ 0.7441 66,968$ 12 90,000$ 0.7014 63,124$ 14 90,000$ 0.6611 59,501$ 16 90,000$ 0.6232 56,085$ 18 90,000$ 0.5874 52,866$ 20 90,000$ 0.5537 49,831$ 10 7,500$ 0.7441 5,581$ 20 7,500$ 0.5537 4,153$ 10 7,500$ 0.7441 5,581$ 20 40,000$ 0.5537 22,147$
Present Worth of Replacement Costs 697,056$ D. 1,415,630$ E. 1,420,000$ F. Total Present Worth Cost (A + E) 3,831,234$ G. 3,830,000$ TOTAL PRESENT WORTH COST (A + E) - ROUNDED
Total Annual Costs and Replacement Costs (B + C)Total Annual Costs and Replacement Costs (B + C) - ROUNDED
Media ReplacementMedia ReplacementMedia Replacement - Oxidation/FiltrationMedia Replacement - Oxidation/FiltrationChemical Pump ReplacementInstrumentation & Controls
Media ReplacementMedia ReplacementMedia ReplacementMedia ReplacementMedia ReplacementMedia Replacement
Total Annual CostsPresent Worth Factor
Present Worth of Annual Costs
Replacement Costs
Media ReplacementMedia Replacement
Chemicals (pH adjustment) ($0.26/1,000 gal treated)Solids Disposal
Annual CostsPower (assume $0.08/1,000 gal treated)Labor (assume 12hr/wk - $50/hr)Chemicals ($0.25/1,000 gal treated)Iron Addition (FeCl) ($0.02/1,000 gal treated)
Life Cycle Period:Initial Cost
PECSD Arsenic Mitigation
Water Treatment Plant at Site 5
Life Cycle Cost Worksheet - (350gpm)

20 years Net Discount Rate: 3.0% A. 2,916,642$
B.1 2,933$ 2 31,200$ 3 9,166$ 4 -$ 5 -$ 6 5,000$ 789
1048,299$ 14.8775
718,574$
C. Year Amount PW Factor P/F Present Worth
2 90,000$ 0.9426 84,834$ 4 90,000$ 0.8885 79,964$ 6 90,000$ 0.8375 75,374$ 8 90,000$ 0.7894 71,047$ 10 90,000$ 0.7441 66,968$ 12 90,000$ 0.7014 63,124$ 14 90,000$ 0.6611 59,501$ 16 90,000$ 0.6232 56,085$ 18 90,000$ 0.5874 52,866$ 20 90,000$ 0.5537 49,831$ 10 7,500$ 0.7441 5,581$ 20 7,500$ 0.5537 4,153$ 10 7,500$ 0.7441 5,581$ 20 40,000$ 0.5537 22,147$
Present Worth of Replacement Costs 697,056$ D. 1,415,630$ E. 1,420,000$ F. Total Present Worth Cost (A + E) 4,336,642$ G. 4,340,000$ TOTAL PRESENT WORTH COST (A + E) - ROUNDED
Total Annual Costs and Replacement Costs (B + C)Total Annual Costs and Replacement Costs (B + C) - ROUNDED
Media ReplacementMedia ReplacementMedia Replacement - Oxidation/FiltrationMedia Replacement - Oxidation/FiltrationChemical Pump ReplacementInstrumentation & Controls
Media ReplacementMedia ReplacementMedia ReplacementMedia ReplacementMedia ReplacementMedia Replacement
Total Annual CostsPresent Worth Factor
Present Worth of Annual Costs
Replacement Costs
Media ReplacementMedia Replacement
Chemicals (pH adjustment) ($0.26/1,000 gal treated)Solids Disposal
Annual CostsPower (assume $0.08/1,000 gal treated)Labor (assume 12hr/wk - $50/hr)Chemicals ($0.25/1,000 gal treated)Iron Addition (FeCl) ($0.02/1,000 gal treated)
Life Cycle Period:Initial Cost
PECSD Arsenic Mitigation
Water Treatment Plant at Site 6
Life Cycle Cost Worksheet - (350gpm)

20 years Net Discount Rate: 3.0% A. 2,694,160$
B.1 2,933$ 2 31,200$ 3 9,166$ 4 -$ 5 -$ 6 5,000$ 789
1048,299$ 14.8775
718,574$
C. Year Amount PW Factor P/F Present Worth
2 90,000$ 0.9426 84,834$ 4 90,000$ 0.8885 79,964$ 6 90,000$ 0.8375 75,374$ 8 90,000$ 0.7894 71,047$ 10 90,000$ 0.7441 66,968$ 12 90,000$ 0.7014 63,124$ 14 90,000$ 0.6611 59,501$ 16 90,000$ 0.6232 56,085$ 18 90,000$ 0.5874 52,866$ 20 90,000$ 0.5537 49,831$ 10 7,500$ 0.7441 5,581$ 20 7,500$ 0.5537 4,153$ 10 7,500$ 0.7441 5,581$ 20 40,000$ 0.5537 22,147$
Present Worth of Replacement Costs 697,056$ D. 1,415,630$ E. 1,420,000$ F. Total Present Worth Cost (A + E) 4,114,160$ G. 4,110,000$ TOTAL PRESENT WORTH COST (A + E) - ROUNDED
Total Annual Costs and Replacement Costs (B + C)Total Annual Costs and Replacement Costs (B + C) - ROUNDED
Media ReplacementMedia ReplacementMedia Replacement - Oxidation/FiltrationMedia Replacement - Oxidation/FiltrationChemical Pump ReplacementInstrumentation & Controls
Media ReplacementMedia ReplacementMedia ReplacementMedia ReplacementMedia ReplacementMedia Replacement
Total Annual CostsPresent Worth Factor
Present Worth of Annual Costs
Replacement Costs
Media ReplacementMedia Replacement
Chemicals (pH adjustment) ($0.26/1,000 gal treated)Solids Disposal
Annual CostsPower (assume $0.08/1,000 gal treated)Labor (assume 12hr/wk - $50/hr)Chemicals ($0.25/1,000 gal treated)Iron Addition (FeCl) ($0.02/1,000 gal treated)
Life Cycle Period:Initial Cost
PECSD Arsenic Mitigation
Water Treatment Plant at Site 7
Life Cycle Cost Worksheet - (350gpm)

20 years Net Discount Rate: 3.0% A. 2,992,880$
B.1 2,933$ 2 31,200$ 3 9,166$ 4 -$ 5 -$ 6 5,000$ 789
1048,299$ 14.8775
718,574$
C. Year Amount PW Factor P/F Present Worth
2 90,000$ 0.9426 84,834$ 4 90,000$ 0.8885 79,964$ 6 90,000$ 0.8375 75,374$ 8 90,000$ 0.7894 71,047$ 10 90,000$ 0.7441 66,968$ 12 90,000$ 0.7014 63,124$ 14 90,000$ 0.6611 59,501$ 16 90,000$ 0.6232 56,085$ 18 90,000$ 0.5874 52,866$ 20 90,000$ 0.5537 49,831$ 10 7,500$ 0.7441 5,581$ 20 7,500$ 0.5537 4,153$ 10 7,500$ 0.7441 5,581$ 20 40,000$ 0.5537 22,147$
Present Worth of Replacement Costs 697,056$ D. 1,415,630$ E. 1,420,000$ F. Total Present Worth Cost (A + E) 4,412,880$ G. 4,410,000$ TOTAL PRESENT WORTH COST (A + E) - ROUNDED
Total Annual Costs and Replacement Costs (B + C)Total Annual Costs and Replacement Costs (B + C) - ROUNDED
Media ReplacementMedia ReplacementMedia Replacement - Oxidation/FiltrationMedia Replacement - Oxidation/FiltrationChemical Pump ReplacementInstrumentation & Controls
Media ReplacementMedia ReplacementMedia ReplacementMedia ReplacementMedia ReplacementMedia Replacement
Total Annual CostsPresent Worth Factor
Present Worth of Annual Costs
Replacement Costs
Media ReplacementMedia Replacement
Chemicals (pH adjustment) ($0.26/1,000 gal treated)Solids Disposal
Annual CostsPower (assume $0.08/1,000 gal treated)Labor (assume 12hr/wk - $50/hr)Chemicals ($0.25/1,000 gal treated)Iron Addition (FeCl) ($0.02/1,000 gal treated)
Life Cycle Period:Initial Cost
PECSD Arsenic Mitigation
Water Treatment Plant at Site 8
Life Cycle Cost Worksheet - (350gpm)

20 years Net Discount Rate: 3.0% A. 2,844,760$
B.1 2,933$ 2 31,200$ 3 9,166$ 4 -$ 5 -$ 6 5,000$ 789
1048,299$ 14.8775
718,574$
C. Year Amount PW Factor P/F Present Worth
2 90,000$ 0.9426 84,834$ 4 90,000$ 0.8885 79,964$ 6 90,000$ 0.8375 75,374$ 8 90,000$ 0.7894 71,047$ 10 90,000$ 0.7441 66,968$ 12 90,000$ 0.7014 63,124$ 14 90,000$ 0.6611 59,501$ 16 90,000$ 0.6232 56,085$ 18 90,000$ 0.5874 52,866$ 20 90,000$ 0.5537 49,831$ 10 7,500$ 0.7441 5,581$ 20 7,500$ 0.5537 4,153$ 10 7,500$ 0.7441 5,581$ 20 40,000$ 0.5537 22,147$
Present Worth of Replacement Costs 697,056$ D. 1,415,630$ E. 1,420,000$ F. Total Present Worth Cost (A + E) 4,264,760$ G. 4,260,000$ TOTAL PRESENT WORTH COST (A + E) - ROUNDED
Total Annual Costs and Replacement Costs (B + C)Total Annual Costs and Replacement Costs (B + C) - ROUNDED
Media ReplacementMedia ReplacementMedia Replacement - Oxidation/FiltrationMedia Replacement - Oxidation/FiltrationChemical Pump ReplacementInstrumentation & Controls
Media ReplacementMedia ReplacementMedia ReplacementMedia ReplacementMedia ReplacementMedia Replacement
Total Annual CostsPresent Worth Factor
Present Worth of Annual Costs
Replacement Costs
Media ReplacementMedia Replacement
Chemicals (pH adjustment) ($0.26/1,000 gal treated)Solids Disposal
Annual CostsPower (assume $0.08/1,000 gal treated)Labor (assume 12hr/wk - $50/hr)Chemicals ($0.25/1,000 gal treated)Iron Addition (FeCl) ($0.02/1,000 gal treated)
Life Cycle Period:Initial Cost
PECSD Arsenic Mitigation
Water Treatment Plant at Site 11
Life Cycle Cost Worksheet - (350gpm)

20 years Net Discount Rate: 3.0% A. 2,862,680$
B.1 2,933$ 2 31,200$ 3 9,166$ 4 -$ 5 -$ 6 5,000$ 789
1048,299$ 14.8775
718,574$
C. Year Amount PW Factor P/F Present Worth
2 90,000$ 0.9426 84,834$ 4 90,000$ 0.8885 79,964$ 6 90,000$ 0.8375 75,374$ 8 90,000$ 0.7894 71,047$ 10 90,000$ 0.7441 66,968$ 12 90,000$ 0.7014 63,124$ 14 90,000$ 0.6611 59,501$ 16 90,000$ 0.6232 56,085$ 18 90,000$ 0.5874 52,866$ 20 90,000$ 0.5537 49,831$ 10 7,500$ 0.7441 5,581$ 20 7,500$ 0.5537 4,153$ 10 7,500$ 0.7441 5,581$ 20 40,000$ 0.5537 22,147$
Present Worth of Replacement Costs 697,056$ D. 1,415,630$ E. 1,420,000$ F. Total Present Worth Cost (A + E) 4,282,680$ G. 4,280,000$ TOTAL PRESENT WORTH COST (A + E) - ROUNDED
Total Annual Costs and Replacement Costs (B + C)Total Annual Costs and Replacement Costs (B + C) - ROUNDED
Media ReplacementMedia ReplacementMedia Replacement - Oxidation/FiltrationMedia Replacement - Oxidation/FiltrationChemical Pump ReplacementInstrumentation & Controls
Media ReplacementMedia ReplacementMedia ReplacementMedia ReplacementMedia ReplacementMedia Replacement
Total Annual CostsPresent Worth Factor
Present Worth of Annual Costs
Replacement Costs
Media ReplacementMedia Replacement
Chemicals (pH adjustment) ($0.26/1,000 gal treated)Solids Disposal
Annual CostsPower (assume $0.08/1,000 gal treated)Labor (assume 12hr/wk - $50/hr)Chemicals ($0.25/1,000 gal treated)Iron Addition (FeCl) ($0.02/1,000 gal treated)
Life Cycle Period:Initial Cost
PECSD Arsenic Mitigation
Water Treatment Plant at Site 12
Life Cycle Cost Worksheet - (350gpm)


![3.Pakistan Arsenic Mitigation Plan[1]](https://img.dokumen.tips/doc/110x75/55261c035503468e6e8b4b4b/3pakistan-arsenic-mitigation-plan1.jpg)

