Embed Size (px)
Citation preview

Merced River Corridor Restoration Plan Phase IV: Dredger Tailings Reach
Technical Memorandum #5 Mercury Assessment of the Merced River Ranch
Prepared for CALFED ERP
Sacramento, California Recipient Agreement No. ERP-02-P12-D
Prepared by
Stillwater Sciences 2855 Telegraph Avenue, Suite 400
Berkeley, California 94705
October 2004

List of Preparers:
Maia Fleming‐Singer Stillwater Sciences Noah Hume Stillwater Sciences Darell Slotton University of California at Davis Shaun Ayres University of California at Davis Nicolas Bloom Frontier Geosciences, Inc.
Statement of Erratum: The June 2004 version of this technical memorandum incorrectly designated the sampling location “Robinson RM 41”. The river mile designation is correct, but the sampling point is actually located downstream of Robinson property. The location has been re‐named “Below Hwy59 RM 41” to reflect its function as a control point downstream of the dredger tailings reach.
For more information or copies of this Technical Memorandum, please contact:
Stillwater Sciences 2855 Telegraph Avenue, Suite 400
Berkeley, CA 94705 stillwatersci.com (510) 848‐8098
Suggested citation: Stillwater Sciences. 2004. Mercury Assessment of the Merced River Ranch. Stillwater Sciences, Berkeley, California

Table of Contents
Table of Contents
1 INTRODUCTION .................................................................................1
1.1 Background ...............................................................................1 1.1.1 Historical Gold Dredging Operations on the Merced River
.......................................................................................3 1.1.2 Conceptual Model for Mercury Mobilization from Dredger
Tailings ..........................................................................5 1.2 Study Area.................................................................................6 1.3 Study Goals and Approach ......................................................7
1.3.1 Hypotheses .....................................................................7 1.3.2 Study Design ..................................................................8
2 METHODS...........................................................................................11
2.1 Dredger Tailings and River Sediment ...................................11 2.1.1 Field Sampling..............................................................13 2.1.2 Laboratory Processing...................................................16 2.1.3 Laboratory Analysis ......................................................19
2.2 Water........................................................................................19 2.2.1 Field Sampling..............................................................19 2.2.2 Laboratory Analysis ......................................................19
2.3 Bioindicator Organisms ..........................................................20 2.3.1 Field Sampling..............................................................21 2.3.2 Laboratory Analysis ......................................................22
3 RESULTS AND DISCUSSION..........................................................23
3.1 Dredger Tailings and River Sediments ..................................23 3.1.1 Total Mercury in Fine Sediment from Dredger Tailings 23 3.1.2 Effect of Processing on Mercury Leached from Intact Dredger
Tailings Material ..........................................................24 3.1.3 Total Mercury in Fine Sediment from River Sites .........25
3.2 Water........................................................................................27 3.2.1 Flow Conditions............................................................27 3.2.2 General Water Quality..................................................27 3.2.3 Mercury and Methylmercury ........................................28
3.3 Bioindicator Organisms ..........................................................30 3.3.1 Presence of Bioindicator Organisms ..............................30
i Mercury Assessment of the Merced River Ranch

Table of Contents
3.3.2 Mercury in Aquatic Insect Bioindicators ...................... 30 3.3.3 Mercury in Small Fish Bioindicators ............................ 32
3.4 Potential for Adding Mercury to the Merced River through Gravel Augmentation............................................................. 34 3.4.1 Likely Near‐term Mercury Release ............................... 34 3.4.2 Maximum Theoretical Mercury Release........................ 35 3.4.3 Summary of Calculations ............................................. 36
4 CONCLUSIONS ................................................................................. 37
5 RECOMMENDATIONS .................................................................... 39
6 ACKNOWLEDGEMENTS ................................................................. 41
7 REFERENCES ..................................................................................... 43
8 FIGURES ............................................................................................. 49
APPENDIX A LABORATORY QA/QC SUMMARY FOR U.C. DAVIS MERCURY ANALYSES............................................................. A‐1
APPENDIX B BIOTA SAMPLE LABORATORY RESULTS............................B‐1
LIST OF TABLES Table 1‐1. Merced River Sediment, Water Quality and Bioindicator Sampling Sites
and Conditions. ............................................................................................9 Table 2‐1. Merced River Ranch Sediment and Pond Sampling Sites and Conditions.
.....................................................................................................................13Table 2‐2. Composition of Synthetic River Water for MRR Dredger Tailings
Washing Experiment..................................................................................17 Table 2‐3. Analytical Methods. ...................................................................................20 Table 3‐1. Total Mercury in Dredger Tailings Fine Material (<2 mm). ....................23 Table 3‐2. Results of the Modified 2‐step SSE for Dredger Tailings. .......................24 Table 3‐3. Mercury in Fine Sediments, Raw Water, and Biota Samples along the
Merced River. .............................................................................................26 Table 3‐4. Water Quality at Merced River Sites. .......................................................28
ii Mercury Assessment of the Merced River Ranch

Table of Contents
LIST OF FIGURES Figure 1. Merced River watershed and project location. Figure 2. Conceptual model of mercury sources and cycling in the San Francisco
Bay‐Delta ecosystem. Figure 3. Photographs of early‐ to mid‐1900s dredger operations in Northern
California. Figure 4. Current conditions of tailings piles at the Merced River Ranch. Figure 5. Sample sites along the Merced River. Figure 6. Sample sites at the Merced River Ranch. Figure 7. Dredger tailings excavation at the Merced River Ranch. Figure 8. Lumex sampling for mercury vapor (Hg0). Figure 9. Settleable solids collection at the Merced River Ranch. Figure 10. Schematic of dredger tailings processing experiment. Figure 11. Backpack electroshocking at Merced River Ranch site. Figure 12. Total mercury in dredger tailings fine material. Figure 13. Mercury leached from dredger tailings as a function of size fraction. Figure 14. Mercury leached from washed vs. dry sorted dredger tailings. Figure 15. Mercury in fine sediments at sites along the Merced River. Figure 16. Total organic carbon (TOC) and dissolved organic carbon (DOC) in the
water at Merced River sites. Figure 17. Aqueous total mercury at sites along the Merced River. Figure 18. Aqueous methylmercury at sites along the Merced River. Figure 19. Power regression of aqueous total mercury and methylmercury by total
suspended solids (TSS) in Merced River water. Figure 20. Mercury content of Hydropsychid caddisfly from Merced River sites. Figure 21. Comparative Hydropsychid caddisfly mercury content from other local
rivers. Figure 22. Linear regression of aqueous mercury fractions vs. methylmercury in
Hydropsychid caddisfly larvae at Merced River sites. Figure 23. Size vs. mercury relationship for prickly sculpin (Cottus asper) at Merced
River sites. Figure 24. Mercury content of prickly sculpin (Cottus asper) from Merced River
sites. Figure 25. Linear regression of aqueous mercury fractions vs. methylmercury in
prickly sculpin (Cottus asper) at Merced River sites. Figure 26. Effects of processing on mercury released from Merced River Ranch
dredger tailings.
iii Mercury Assessment of the Merced River Ranch

Introduction
1 INTRODUCTION The Merced River Ranch Mercury Assessment was undertaken as a component of the larger Merced River Corridor Restoration Plan ‐ Phase IV Project (CALFED ERP‐02‐P12‐D), which is intended to evaluate strategies for channel and floodplain restoration within the context of the contemporary flow regime. As part of the restoration design development for the Merced River Ranch (MRR), the study assessed the occurrence of mercury in gold dredger tailings above, within, and below the site along the Merced River. In accordance with the study plan (Stillwater Sciences 2004a), tailings, sediment, water and biota were sampled to better characterize the potential risks of mercury mobilization resulting from re‐use and removal of the tailings for floodplain and in‐channel restoration projects. 1.1 Background
The Merced River is a tributary to the San Joaquin River in the southern portion of California’s Central Valley (Figure 1a). The river, which drains an approximately 3,305 square kilometers (1,276 square miles) watershed, originates in Yosemite National Park and flows southwest through the Sierra Nevada range before joining the San Joaquin River 140 kilometers (87 miles) south of the City of Sacramento. Elevations in the watershed range from 3,960 meters (13,000 ft) at its crest to 15 meters (49 ft) at the confluence with the San Joaquin River. In the Merced River, as in many other rivers in the western United States, dams used for water supply development and flood control operations have altered the natural hydrograph. In addition to hydrologic effects on downstream riparian communities (Scott et al. 1999), flow regulation by dams leads to a sequence of ecological impacts arising from a loss of upstream sediment supply and lower erosion rates from the stabilized and reduced contemporary flow regime (Ligon et al. 1995). Flow in the lower Merced River is controlled by several mainstem dams including New Exchequer Dam and McSwain Dam (Figure 1b). These dams, developed for hydro‐power and water supply projects, along with three smaller storage dams constructed on tributaries upstream of New Exchequer Dam, have reduced peak flow magnitude, altered seasonal flow patterns, reduced temporal variability, and reduced summer baseflows in the lower Merced River.
1 Mercury Assessment of the Merced River Ranch

Introduction
This report focuses on the Dredger Tailings Reach (DTR) of the Merced River, which extends from the Crocker‐Huffman Dam, a small storage dam located at river mile (RM) 52, downstream to RM 45.2 (Figure 1c). The reduction in sediment supply and subsequent bed scour caused by the upstream dams, combined with direct removal of sediment from gold mining, has depleted the river bed in the DTR of coarse sediment and produced a channel that is typified by long, deep pools with a coarse cobble armor layer. In the DTR, gold dredging during the early to mid 1900s displaced an estimated 7–14 million tons of bedload from the Merced River channel, or 350–1,350 times the natural annual bedload supply from the upper watershed (Vick 1995). The displaced material was left on the floodplain as piles of dredger tailings that confine the river channel and floodplain to a narrow corridor, resulting in high shear stresses on the river bed during even moderate flow events. As a result, the area of aquatic habitat has been reduced and conditions for salmonid spawning, egg incubation and alevin survival have been degraded. Due to their proximity and availability, dredger tailings in the DTR are the preferred sediment source for gravel infusion and for long‐term maintenance of the river channel below Crocker‐Huffman Dam. Gravel augmentation to increase coarse sediment supply and provide areas suitable for Chinook salmon spawning has been practiced by multiple agencies in California, including the Department of Water Resources (CDWR), US Bureau of Reclamation (USBR), US Fish and Wildlife Service (USFWS), and Department of Fish and Game (CDFG). Sites on the Sacramento, Trinity, lower Tuolumne, and Merced Rivers (USBR 2000, USFWS 1994) have all received significant quantities of dredger tailings and floodplain deposits remaining from dam construction to augment gravel for salmon spawning habitat. On the lower Merced River, at the Ratzlaff Reach of the Merced River Salmon Habitat Enhancement Project (MRSHEP) (RM 40–40.5), material from tailings piles at Cox Ferry (Stanislaus River) were used for gravel augmentation (http:// www.delta.dfg.ca.gov/afrp). There have been two spawning gravel augmentation projects within the DTR, both of which are within 0.1 km (0.062 miles) of Crocker‐Huffman Dam: one maintained jointly by CDWR and CDFG since 1991 at the Merced River Hatchery and the other by CDFG in 2003 at Maury’s Riffle (Stillwater Sciences 2004b). In addition, several water diversion wing dams have been constructed within the DTR using gravel of an appropriate size, which can be seasonally redistributed by the river for use as salmonid spawning gravel (Stillwater Sciences 2004b).
2 Mercury Assessment of the Merced River Ranch

Introduction
Despite their proximity and availability for restoration projects, use of the tailings poses a potential risk of mercury contamination to the river. During gold dredging, mercury was used to separate gold from the excavated alluvial deposits throughout the western United States (Alpers and Hunerlach 2000). As shown in Figure 2, this use of mercury resulted in potential mercury contamination in tailings piles along rivers (Alpers and Hunerlach 2000, Hunerlach et al. 1999). Elevated levels of mercury have been recognized as a water quality problem throughout the Sacramento River basin (Domagalski 1998) and in the San Francisco Bay (Bouse et al. 1996), where the potential for mercury methylation and biotic uptake is high. Less is known about the occurrence and chemistry of mercury in tributaries to the San Joaquin River basin, such as the Merced River, which also feed into the Bay‐Delta system. There is currently no regulatory standard for testing mercury in bulk sediments, although there are screening guidelines which have been developed for marine and estuarine sediments (Long and MacDonald 1992, PTI 1988). Mercury total maximum daily loads (TMDL’s) have been developed for the San Francisco Bay Estuary (Abu‐Saba and Tang 2000) and the Cache Creek, Bear Creek, and Harley Gulch tributaries of the Sacramento River (Cooke et al. 2004), which address mercury sources to the Bay‐Delta ecosystem. However, not all potential sources located in tributaries to the Sacramento and San Joaquin Rivers have been characterized within the TMDL process. Since dredger tailings have been identified as a potential source of mercury to the aquatic environment, it is possible that they will be regulated as such and their use for gravel augmentation limited to scenarios where the risk of mercury contamination is identified as minimal. Regulatory decisions regarding the use of tailings for gravel augmentation will need to consider the need for a comprehensive characterization of potential mercury contamination as well as region‐wide management of a valuable resource. Prior to this study, a comprehensive study of the occurrence and distribution of mercury within dredger tailings on the Merced River or other San Joaquin tributaries had not been assessed, except for occasional bulk samples by gravel mining companies or individual landowners. 1.1.1 Historical Gold Dredging Operations on the Merced River
Placer mining and hydraulic mining of the floodplain deposits along the DTR were practiced during the California gold rush in the 1850s (Clark 1998). From 1907 through 1952, multiple sites along the river channel and floodplain near Snelling, CA were dredged for gold. Five companies operated seven gold dredges in this vicinity: Yosemite Mining & Dredging
3 Mercury Assessment of the Merced River Ranch

Introduction
Company (1907–1919), Yuba Construction Goldfields (1930–1941), Snelling Gold Dredging Company (1932–1942 and 1946–1952), Merced Dredging Company (1934–1942 and 1945–1949), and San Joaquin Mining Company (1936–1942) (Clark 1998). Dredging involved the use of barge‐mounted processing equipment to remove and sort gold‐bearing sand from alluvial deposits. A conveyor system of buckets on the front end of the dredge was used to scoop material, with some dredges removing 1.4–3.4x10⁶ cubic yards/year. Based on the Vick (1995) estimate of 7–14 x106 tons of bedload removed from the Merced River channel by dredging activities, 0.2–0.4 x10⁶ tons per year or 4.2–8.4x10⁶ cubic yards per year (based on 2,203 kg/m3 from URS [2004]) would have been the capacity of the local dredges over the 30 years of documented dredging. The river channel and floodplain deposits were often excavated to bedrock, usually a depth of 6–11 m (20–36 ft) (Clark 1998). Within the dredge, the bucket line discharged into hoppers that fed into a slowly rotating trammel for screening. The cobbles and oversized gravel (>0.5 in) slid down the trammel and dropped onto conveyors that carried them to the aft end of the dredge for discharge on the back banks of the dredging pond (Figure 3). The discharged material, or dredge stacker tailings, formed long rows on the floodplain as the dredge slowly progressed through the floodplain (Young 1970). Finer, gold‐bearing materials were washed out of the trammels through roughly 0.5 in diameter holes and transported to gold saving tables located on the bottom of the dredge (Winston 1910). If elemental mercury or “quicksilver” was being used to aid in the gold recovery, it was added to the gold saving tables or to sluice boxes on the bottom sides of the dredges in order to form gold amalgam. The amalgam was then trapped in pools of mercury located along the length of the sluice boxes (Davis and Carlson 1952). These mercury pools were held in place with steel or rubber‐coated riffle bars having a fiber matting to entangle finer particles of gold amalgam (Young 1970). During periodic cleanouts of the traps (every 7–10 days), the riffle bars were scraped out with a spatula and the fiber matting rinsed in tubs of water. The several gallons of collected gold amalgam, lead, and platinum‐containing “black sand” were then subjected to a rough separation using a “long tom” or rocker box. The long tom was a narrow wooden‐sided, metal‐bottom trough with a sieve and a riffle box at its end, which was oriented on a slight slope and rocked to facilitate water flow. The condensed and separated gold amalgam, lead, and black sand were removed from the long tom and transported from the dredge for final processing by
4 Mercury Assessment of the Merced River Ranch

Introduction
heating, vaporization and reclamation of re‐condensed mercury, a process known as retorting. At least one of the five companies operating gold dredges within the DTR, the Snelling Gold Dredging Company, used mercury during its operations (Davis and Carlson 1952). It is not known whether all of the companies operating in this vicinity practiced gold amalgamation. The Snelling Gold Dredging Company operated two dredges at or near the MRR. Following separation of gold amalgam and fine materials on the dredge, the amalgam was removed from the dredge and taken to the retort house in Snelling for mercury reclamation (Davis and Carlson 1952). Retorting recaptured mercury from gold amalgam in an enclosed distillation process, allowing all of the mercury to be reclaimed. The Yuba Construction Goldfields, Snelling Gold Dredging Company and San Joaquin Mining Company were owned by the same family (Arthur Hardin, pers. comm.), however it is not known whether retorting was used to reclaim mercury from all of these operations or from other earlier dredging efforts in the DTR. 1.1.2 Conceptual Model for Mercury Mobilization from Dredger
Tailings
Although attempts were made at reclaiming mercury from gold amalgam by retorting, the amalgam may have been simply heated in open air allowing mercury to escape and redeposit in the surrounding area. In addition, extensive contact between the retained solids and mercury meant that unknown quantities of mercury were lost during flushing and cleaning of the sluice boxes and rockers. The fine‐grained (<0.5 in) waste materials, or dredge sluice tailings, were often released into the dredge ponds and likely settled to the bottom of the water column. As the dredge moved forward in the ponds, the larger dredger tailings having little or no direct contact with mercury were deposited above the finer dredge sluice tailings, essentially turning deposited floodplain sediments upside down (Young 1970). As the ponds could be very deep (20–30 ft), the fine‐grained, potentially mercury‐contaminated material may have been deposited far below the top of the existing water table. In the DTR, it is possible that mercury in dredger tailings and the underlying floodplain may be exposed during tailing excavation and/or gravel augmentation activities. Exposed mercury and amalgam may be introduced directly into the Merced River aquatic food web or they may be transported in mineral form to downstream areas, such as the San Joaquin River and San Francisco Bay, where the biogeochemical conditions necessary for mercury methylation and biotic uptake exist. However, if mercury is primarily associated with fine material in the MRR dredger
5 Mercury Assessment of the Merced River Ranch

Introduction
tailings and floodplain deposits, then size‐selective separations (i.e., sieving and washing) may be used to reduce transport and exposure risks of restoration activities. Previous studies of mercury occurrence in the environment have included correlations between mercury and geochemically related anions (e.g., chloride and sulfate) and cations (e.g., iron) (Ashley et al. 2002, Kelly et al. 1995), or focused on detailed characterizations of mercury distribution within water and suspended sediment (Domagalski 1998), as well as colloidal fractions (Roth et al. 2001). A study by Ashley et al. (2002) demonstrated that for placer gold dredge tailings, mercury was primarily associated with fine material, and several studies have shown that the majority of mercury transport in rivers is dependent on an association with suspended sediments (Roth et al. 2001, Domalgalski 1998, Domalgalski 2001). Rather than repeating many of these exploratory investigations, Stillwater Sciences has adopted an approach designed to answer specific management questions regarding the use of the dredger tailings for in‐river restoration activities. The study plan relied upon a combination of historical information regarding mercury use in the DTR and advanced analytical techniques to determine the potential for: 1) introducing additional mercury into the watershed by injecting processed or unprocessed tailings into the river channel for gravel augmentation; and 2) mercury exposure and transport resulting from excavation of the floodplain. 1.2 Study Area
The general study area includes the DTR of the Merced River and focuses specifically on the MRR, a 318‐acre site located at the upper end of the DTR from RM 51 to RM 50. In 1998, the MRR was purchased by the California Department of Fish and Game (CDFG) as a source of sand, gravel, and cobble for future restoration projects and as a floodplain restoration site. Dredger tailings at the MRR are currently being considered for use as spawning material for salmonids rather than for general aggregate use. At the MRR, and generally within the DTR, mining and dredging activities have produced a river channel confined by piles of dredger tailings (Figure 4a). The tailings piles have replaced the natural floodplain soils and floodplain forest and have increased floodplain elevation along the river. Minimal stratigraphy has been found within the tailings piles of the DTR (URS 2004). A shallow (0.2 m) surface layer of coarse materials (larger
6 Mercury Assessment of the Merced River Ranch

Introduction
cobbles and boulders) overlies a well‐mixed, heterogeneous distribution of clast‐supported cobbles and boulders in a matrix of gravel, sand, and silt. Occasional sand lenses have been encountered at varying depths within the dredger fields. Depth to groundwater varies from 3.0–5.5 m below the ground surface (URS 2004). Native riparian vegetation at the MRR is typically restricted to narrow bands adjacent to the river, measuring 100 feet or less in width on each bank of the river, and linear patches confined to swales within the dredger tailings (Figure 4b). These swales are typically connected to a perennial or seasonal groundwater supply and support a variety of wetland vegetation types (primarily freshwater emergent marsh, seasonal wetland, open water/ponds, mixed willow, and cottonwood forest). The deepest, wettest tailing swales support cattail (Typha latifolia) marsh habitat and/or perennial ponds. These ponds support floating plants, such as various duckweeds (Lemna spp. and Wolfiella spp.) and water fern (Azolla filiculoides). Many of the ponds also contain beds of submergent macrophytes, primarily Egeria. Marsh pennywort (Hydrocotyle spp.) forms dense beds in some shallower ponds. 1.3 Study Goals and Approach
The goals of the study were to: determine the occurrence and distribution of mercury at the MRR; to determine the risk of mercury mobilization and uptake into the aquatic food web; and to assess the potential feasibility of processing the dredger tailings at the MRR by selectively removing mercury‐laden size fractions through dry sorting and washing. 1.3.1 Hypotheses
The following hypotheses address the four major questions related to the assessment of mercury occurrence at the MRR, outlined under Task 5 of the CALFED contract ERP‐02‐P12‐D and detailed in the Merced River Ranch Mercury Assessment Study Plan (Stillwater Sciences 2004a). Enumerated hypotheses are shown below in italics, along with a general description of the methods used to test the hypothesis.
1. There is a vertical and/or horizontal spatial distribution pattern for mercury in the Merced River Ranch dredger tailings and the underlying floodplain.
Sediment samples were collected to characterize the spatial distribution of mercury in the tailings and in the excavated floodplain.
7 Mercury Assessment of the Merced River Ranch

Introduction
2. The dredger tailings contain significant residual mercury as compared with
background levels in undredged reference sites.
Sediment samples were used to compare mercury in the tailings with background levels at undredged floodplain reference sites.
3. Mercury is primarily associated with fine grain‐size fractions (< 2mm)
within the dredger tailing material.
Sediment samples were used to develop grain‐size associations in which mercury is encountered.
a. Dredger tailing material was sorted into size fractions suitable for commercial and aggregate applications, under both dry and wet (washed) processing conditions.
b. Each size fraction was analyzed for mercury occurrence under both processing conditions.
4. The dredger tailings contain significant residual mercury that may impact
exposure and bioaccumulation levels in the lower Merced River’s aquatic food web, particularly if the dredger tailings are removed from the underlying floodplain and used for gravel augmentation.
Aquatic sediments, water and biota samples were used to assess the potential for mercury bioaccumulation in the aquatic food web.
a. Aquatic invertebrates and small fish that were relatively consistent across the test region were identified and sampled.
b. The biotic samples were used as site‐specific indicators of relative mercury exposure levels along the Merced River, in relation to adjacent dredger tailings and introduced restoration gravels.
1.3.2 Study Design
Potential mercury contamination in sediment, water and biota in the vicinity of the MRR was assessed by selecting a series of sampling sites above, within, and below the DTR of the Merced River (Table 1‐1, Figure 5). The sediment‐related portion of the mercury assessment included the following: 1) determination of mercury content in fine sediments at river sites; 2) determination of the spatial distribution of mercury at the MRR; 3) identification of a rough grain‐size association (e.g., fines vs. coarser materials) for mercury in the MRR dredger tailings; and, 4) determination of
8 Mercury Assessment of the Merced River Ranch

Introduction
leachable mercury from whole, intact dredger tailings via a processing experiment. Sediment sampling sites were primarily located within the boundaries of the MRR where sediment material was available for sampling.
Table 1-1. Merced River Sediment, Water Quality and Bioindicator Sampling Sites and Conditions.
Date Sampled 2003 Site Name Elevation
(ft) GPS Lat/Long
Water Sediment Biota General Site Description
Description of Mining Impact
Above Lake McClure (RM
100)(Control)
1,250 N: 37° 39.34’ W: 119° 55.00’
2,3-Nov N/A 6-Nov Rocky bottom, clear water,
above reservoirs.
Above zone of historical dredging. Within zone of historic placer and lode mining (Clark 1998). Relative control site in the watershed.
Merced Falls Dam (RM 55) (Near Control)
315 N: 37° 31.22’ W: 120° 20.02’
2,3-Nov 2,3-Nov 3,4,5-Nov Cobble bottom, low gradient
riffle. Riparian edges.
Above the DTR. Presumed to have minimal impact from dredger tailings, while having similar gradient, habitat characteristics, and water source relative to remaining downstream sites.
MRR (RM 50) 275 N: 37° 31.04’ W: 120° 23.68’
2,3-Nov 2,3-Nov 28,29-Oct Cobble bottom, low gradient
riffle. Riparian edges. Some finer grained deposition in
pools.
Within the DTR, having tailings material in direct contact with the river throughout the reach. Similar conditions both upstream and downstream for several miles.
Below Hwy59 (RM 41) (Control)
170 N: 37° 28.16’ W: 120° 30.76’
2,3-Nov N/A 28-Oct Cobble bottom, low gradient
riffle. Riparian edges.
Just downstream of the DTR.
Ratzlaff Reach (RM 40)
165 N: 37° 28.18’ W: 120° 31.75’
2,3-Nov N/A 28,29-Oct Cobble bottom, low gradient riffle. Edge
habitat largely agricultural,
dominated by restoration
boulder additions.
Further downstream of the DTR. Of interest for potential effect of introduced dredger material and general restoration disturbance.
Water quality and bioindicator sampling was coordinated to integrate mercury signals from possibly heterogeneous mercury deposits in the surrounding watershed. Because mercury bioaccumulates, diffuse mercury contamination typically produces a measurable signal in indicator organisms that is proportional to relative exposure, resulting in differing
9 Mercury Assessment of the Merced River Ranch

Introduction
relative mercury bioaccumulation levels depending on location in the watershed. To this end, consistently available localized aquatic biota (i.e., non‐endangered, resident juvenile fish and invertebrates) were identified and collected along the Merced River during fall 2003, when juvenile fish had attained adequate size and spent enough time in the river to potentially bioaccumulate mercury. The sampled biota were used as site‐specific bioindicators of relative mercury exposure levels in the river along the DTR, as well as at sites upstream and downstream. The uppermost water quality and bioindicator control site (RM 100) was chosen well above the DTR, and upstream of Lake McClure which, due to biogeochemical cycling within reservoirs (Alpers and Hunerlach 2000, Slotton et al. 1995, Slotton et al. 1997), was potentially a site for alterations in aqueous concentrations and bioavailability of mercury. The second, “near control” site (RM 55) was selected just upstream of the DTR. This site provided habitat and water quality conditions similar to the remaining downstream sites, but with minimal relative exposure to dredger tailings. It was identified as a “near” control site rather than a true control site because biota samples were collected from just beneath the dam, which, similar to Lake McClure, was potentially a site for alterations in mercury speciation and bioavailablity. Due to constraints at the time of sampling, water quality and sediment samples were collected just above the dam. The MRR sampling site (RM 50) was located at the northern end of the MRR, at the Cuneo public access point. Downstream of the DTR, approximately one mile below Highway 59, was the Below Hwy59 site (RM 41). It was utilized both as a downstream comparison relative to the DTR and as a control for sampling located immediately downstream. The Ratzlaff Reach site (RM 40) was located approximately two miles below Highway 59, and is the downstream portion of the MRSHEP. The Ratzlaff Reach project included the addition of substantial amounts of cobble to isolate a mining pit that had been captured by the river. The rock used was excavated from tailings piles on the Stanislaus River (http:// www.delta.dfg.ca.gov/afrp). The Ratzlaff Reach site was investigated mainly for the potential effect of general restoration‐based disturbance on mercury mobilization.
10 Mercury Assessment of the Merced River Ranch

Methods
2 METHODS Linking mercury occurrence and distribution at the MRR to regulatory decisions regarding the suitability of the dredger tailings for re‐use during habitat restoration requires confidence in the results of the study outlined in this document. Quality assurance (QA) for this study centers upon the following guidelines, outlined by the USEPA (1998): • the projectʹs objectives, hypotheses and data quality objectives are
identified and agreed upon by study participants, project reviewers and stakeholders;
• the intended measurements and data acquisition methods are consistent with project objectives;
• the assessment procedures are sufficient for determining if data of the type and quality needed and expected are obtained; and
• any potential limitations on the use of the data can be identified and documented.
In general, standard methods, metrics and procedures have been selected to the greatest extent possible. Although some modifications to standard field sampling, sample preparation, and analysis techniques have been made by the contracted laboratory groups (Frontier Geosciences Inc., Seattle, WA; Slotton Laboratory, U.C. Davis, CA), this approach greatly facilitates quality assurance for the following reasons: First, the procedures can be thoroughly documented by reference, minimizing the potential for omission and error in describing methods. Second, standard methods have already been peer‐reviewed and tested for repeatability. Lastly, the use of standard methods improves the likelihood that the data can be used for comparison with other studies. Although a separate Quality Assurance Project Plan (QAPP) was not prepared for this study, QA procedures conformed to the QAPP developed for previous CALFED mercury studies (Puckett and van Buuren 2000). 2.1 Dredger Tailings and River Sediment
Total mercury (THg) was measured in the fine material (< 2mm) from tailing piles, MRR pond sediments, and from river sediments above, within, and
11 Mercury Assessment of the Merced River Ranch

Methods
below the MRR. Methylmercury (MeHg; CASRN 22967‐92‐6) was measured in river and pond sediments as well. Twelve tailings pile sites at the MRR (Figure 6) were chosen to correspond with the sites sampled for volume and texture analysis by URS Corporation (URS 2004). Bulk samples from tailings pile sites were semi‐quantitatively sampled for mercury vapor (Hg0) prior to size separation and THg analysis. Identification of a rough grain‐size association for mercury in the MRR dredger tailings was included in a processing experiment for leachable mercury. The processing techniques included dry sorting and washing following dry sorting, and were chosen in order to determine whether washing intact pieces of dredger material might affect the potential for mercury contamination should the dredger material be added to the river as spawning material. Three size fractions (< 2 mm, 2–13 mm, and 13–150 mm) were selected for sorting based on current knowledge of the substrate size fraction most appropriate for use in gravel augmentation, and practical issues regarding removal of fines in large‐scale aggregate operations. Dredger tailings at the MRR are currently being considered for use as spawning material for salmonids rather than for general aggregate use. For Chinook salmon, substrate size and intragravel flow conditions are known to be important factors affecting spawning distribution and incubation success (Harrison 1923, Hobbs 1937, McNeil 1964, Cooper 1965, Platts et al. 1979). The presence of excessive amounts of fine (< 2mm) sediment and sand in the bed reduces intragravel flow in the redd (McNeil 1964, Cooper 1965), and thus removal of the < 2 mm size fraction may improve its suitability for use in spawning gravel augmentation. However, the fines are also the size fraction containing the majority of mercury found in a previous study of placer gold dredger tailings (Ashley et al. 2002). Mercury analysis of the < 2mm size fraction at the MRR was carried out to allow for study comparability and for determination of mercury distribution in the dredger tailings. An intermediate size fraction (2–13 mm [0.08–0.5 in]) was included in the study design to yield information useful to potential aggregate operations regarding mercury distribution in material less than 13 mm (0.5 in). The aggregate industry often experiences increased difficulty in removing fines from bulk samples using screens smaller than 13 mm (0.5 in), particularly if there is a high percentage of clay present. The 2–13 mm (0.08–0.5 in) fraction was included so that potential aggregate operations might more efficiently remove the less than 13 mm fraction, should it contain mercury levels of concern. The largest size fraction, 13–150 mm (0.5–6 in) was chosen based on the knowledge that median particle sizes of spawning substrates used by Chinook salmon have been found to range
12 Mercury Assessment of the Merced River Ranch

Methods
from 13–75 mm (0.5–3 in) (Kondolf and Wolman 1993), with 150 mm (6 in) as an upper size limit. 2.1.1 Field Sampling
Tailings piles Bulk samples were collected at two elevations for each pile site (Table 2‐1, Figure 7a), corresponding to approximately mid‐pile and 1–3 ft above the existing groundwater table. These sample elevations were chosen to yield vertical distribution information for THg within the dredger piles and within sediments that are likely to be exposed on the restored floodplain. Although the restored floodplain elevation will not be determined until well after the mercury study completion, the lowest chosen mercury sample elevation spanned the range of likely post‐restoration floodplain elevation (1–3 ft above groundwater). The groundwater table elevation was determined independently for each sampling site by digging until obvious water pooling was observed (Figure 7b).
Table 2-1. Merced River Ranch Sediment and Pond Sampling Sites and Conditions.
MRR Site Name1
Estimated Sample
Elevation (ft) GPS Lat/Long Date
Sampled General Site Description
T3-L 282±3 N: 37° 51.28’
W: 120° 38.63’ 24-Feb-04 Tailings pile
T3-C 288±6 N: 37° 51.28’
W: 120° 38.63’ 24-Feb-04 Tailings pile
T4-C 285±7 N: 37° 51.15’
W: 120° 38.60’ 24-Feb-04 Tailings pile
T5-L 280±3 N: 37° 51.03’
W: 120° 38.69’ 24-Feb-04 Tailings pile
T5-C 293±13 N: 37° 51.03’
W: 120° 38.69’ 24-Feb-04 Tailings pile
T6-U 302±3 N: 37° 51.11’
W: 120° 38.94’ 25-Feb-04 Tailings pile
T6-M 294±3 N: 37° 51.11’
W: 120° 38.94’ 25-Feb-04 Tailings pile
T6-L 287±3 N: 37° 51.11’
W: 120° 38.94’ 25-Feb-04 Tailings pile
T6-C 294±8 N: 37° 51.11’
W: 120° 38.94’ 25-Feb-04 Tailings pile
T7-U 289±3 N: 37° 51.11’
W: 120° 39.60’ 25-Feb-04 Tailings pile
T7-L 274±3 N: 37° 51.11’
W: 120° 39.60’ 25-Feb-04 Tailings pile
T7-C 286±13 N: 37° 51.11’
W: 120° 39.60’ 25-Feb-04 Tailings pile
T8-U 290±3 N: 37° 51.42’
W: 120° 39.32’ 25-Feb-04 Tailings pile T8-M 279±3 N: 37° 51.42’ 25-Feb-04 Tailings pile
13 Mercury Assessment of the Merced River Ranch

Methods
MRR Site Name1
Estimated Sample
Elevation (ft) GPS Lat/Long Date
Sampled General Site Description
W: 120° 39.32’
T8-C 286±8 N: 37° 51.42’
W: 120° 39.32’ 25-Feb-04 Tailings pile
T9-U 290±3 N: 37° 51.45’
W: 120° 39.12’ 25-Feb-04 Tailings pile
T9-C 286±6 N: 37° 51.45’
W: 120° 39.12’ 25-Feb-04 Tailings pile
T10-C 286±8 N: 37° 51.55’
W: 120° 39.60’ 26-Feb-04 Tailings pile
T10-L 283±3 N: 37° 51.55’
W: 120° 39.60’ 26-Feb-04 Tailings pile
T10-M 278±3 N: 37° 51.55’
W: 120° 39.60’ 26-Feb-04 Tailings pile
T11-M 292±3 N: 37° 51.63’
W: 120° 39.37’ 26-Feb-04 Tailings pile
T11-L 280±3 N: 37° 51.63’
W: 120° 39.37’ 26-Feb-04 Tailings pile
T11-C 290±9 N: 37° 51.63’
W: 120° 39.37’ 26-Feb-04 Tailings pile
T12-M 291±3 N: 37° 51.21’
W: 120° 39.01’ 26-Feb-04 Tailings pile
T12-L 283±3 N: 37° 51.21’
W: 120° 39.01’ 26-Feb-04 Tailings pile
T12-C 292±9 N: 37° 51.21’
W: 120° 39.01’ 26-Feb-04 Tailings pile
T13-M 295±3 N: 37° 50.89’
W: 120° 39.54’ 26-Feb-04 Tailings pile
T13-L 288±3 N: 37° 50.89’
W: 120° 39.54’ 26-Feb-04 Tailings pile
T13-C 297±9 N: 37° 50.89’
W: 120° 39.54’ 26-Feb-04 Tailings pile
T22-C 286±7 N: 37° 51.75’
W: 120° 39.31’ 26-Feb-04 Tailings pile P1 N/A N: 37° 51.16’
W: 120° 38.98’ 1-Nov-03 Largest pond at the MRR. Aquatic vegetation
present included Typha, Azolla, water pennywort. No fish observed, but some waterfowl were seen in the reed stands.
P2 N/A N: 37° 51.33’ W: 120° 39.07’
1-Nov-03 Large pond. Aquatic vegetation included Typha, Azolla, water pennywort. No fish observed, but some waterfowl were seen in the reed stands.
P3 N/A N: 37° 51.43’ W: 120° 39.22’
1-Nov-03 Small, shallow, water-filled depression or swale. Dominant vegetation included Typha, Azolla, and algae covered in an orange, iron-oxide secretion.
1 C = composite depth; L = lower elevation in tailings pile; M = mid-elevation in tailings pile; U = upper elevation in tailings pile
Bulk samples were scooped from each site using a backhoe and transferred by shovel into 5‐gallon, polyethylene receiving buckets. At the time of sampling, the gravel and associated fine sediments were thoroughly wet as
14 Mercury Assessment of the Merced River Ranch
Methods
a result of ambient storm conditions. There was no discernable pile stratification at the majority of sites; throughout the pile sites, wet fines adhered to larger rock surfaces mainly as clay globules or coatings. The wet conditions meant that there was no ultra‐fine material lost as dust when the samples were removed from the pits or piles. Additionally, since the wet tailings samples were taken above rather than directly within or below the existing water table, fines were not observed to be lost by water slurry spilling out of the backhoe scoop. Dredger material greater than 150 mm (6 in) was hand‐removed from samples in the field. A 1–2 in headspace in each sample bucket was screened for mercury vapor (Hg0) using a portable, atomic absorption spectrometer Lumex RA‐915+ (Lumex Products, St. Petersburg, Russia) (Figure 8a). At two sites (T6 and T7), the surrounding dredger pile surface layer, and the newly exposed tailings material were randomly sampled for a Hg0 signal (Figure 8b). Gas‐phase elemental mercury (Hg0), as a 10‐second integrated signal, ranged from 0–12 ng/m3 in the headspace of all dredger tailings sample buckets. Additional in situ airspace measured at, and in a swath between, sites T6 and T7 ranged from 10–28 ng/m3. These values indicated a low potential for significant Hg0 contamination in the dredger tailings samples, therefore further processing procedures were not adjusted for the presence of Hg0 (i.e., air drying rather than heating sediment samples during drying periods, or Hg0 removal from samples prior to pulverization and homogenization). Pond sites Composite wet sediment and mud samples were collected from the edges of several swale ponds using prudent attention to cleanliness, including the use of rigorously cleaned equipment and bottles, and the wearing of clean‐room gloves during sample handling. Wet sediment samples were scooped directly into acid‐cleaned polycarbonate jars, frozen with dry ice immediately after collection, and kept frozen until analysis. The composite pond sediment samples were analyzed for THg and MeHg as well as total organic carbon (TOC). River sites Although the river channel directly adjacent to the MRR was originally slated for sediment sampling, no exposed bars were present during the field events nor was there accessible fine material within at least the top six inches of the river bed. Some emergent vegetation, mainly tufts of grass, were apparent in a small mid‐section of the Merced River at this location, however there was no sediment associated with the roots of these plants. The fine sediment samples at this site were captured by agitating the river
15 Mercury Assessment of the Merced River Ranch

Methods
bed gravel and interstitial waters, producing a cloud of suspended fine material. The suspended material was immediately collected in a 2‐L ultra‐clean Teflon jug and decanted. The remaining settlable solids were collected in ultra‐clean polycarbonate jars, frozen with dry ice immediately after collection, and kept frozen until analysis (Figure 9). Sediments were also sampled just above the near control site at the Merced Falls Dam, although there was more clay and sand material in the river bed at this location so no agitation was necessary. All river sediments were analyzed for THg and MeHg. 2.1.2 Laboratory Processing
Sediment total mercury samples The composite THg samples, excluding the field‐removed material greater than 150 mm, were processed at Signet Laboratories (Hayward, CA) to separate the material finer than 2 mm. Bulk samples were dried overnight at 110±5°C (230±9°F) prior to size separation with an automatic shaker table and a series of ASTM, stainless steel mesh screens. As mentioned in Section 2.1.1, since the headspace Lumex measurements on the sediment samples indicated no Hg0 signal, it was assumed that there would be no significant mercury volatilization loss during heating of the sediment samples. The <2 mm subsamples were weighed and placed into tap‐water rinsed 500 mL high‐density polyethelyne bottles, and shipped to Frontier Geosciences Inc. for THg analysis. Prior to mercury analysis, the <2 mm subsamples were pulverized and homogenized. Processed dredger tailings samples Three bulk dredger tailing samples in 5 gallon buckets, designated for grain‐size association and the washing experiment, were processed at Frontier Geosciences. The overall processing schematic is shown in Figure 10. The contents of the three sample buckets were air dried in individual, acid‐rinsed plastic receiving trays for 24–48 hrs. Following drying, two composite subsamples designated group A and group B, at 5.00 kg each, were removed from each receiving tray for further processing and size separation. The processing step involved dry scrubbing the largest rocks using small, acid‐cleaned potato brushes to remove fines adhering to exterior surfaces, followed by pounding and crushing (4–5 min/kg sample) the clumped, dried fines which existed as either individual pieces or as coatings adhering to the exterior surfaces of smaller gravel and rock pieces. Processed subsamples were separated into three size fractions using ASTM standard copper sieves (Gilson Company Inc., Lewis Center) rinsed with deionized water (DI) prior to use. Sieves containing samples were capped and manually shaken for 45 seconds each. The size fractions were as follows: 1) material finer than 2 mm (<0.08 in), 2) material between 2–13 mm (0.08–0.5 in) and, 3) material
16 Mercury Assessment of the Merced River Ranch

Methods
between 13–150 mm (0.5–6 in). Each size fraction was weighed and placed into 10‐L polycarbonate containers cleaned with 0.01N BrCl + 0.3N HCl, and capped with clean HDPE lids. Washing of sorted materials. The group A, size‐separated subsamples were “washed” with 5L of low‐mercury, pH and ionic strength adjusted deionized water in their individual 10‐L polycarbonate containers. The synthetic wash water was created in the laboratory as a close approximation of ambient chemical conditions in the Merced River, with the exception of mercury or additional compounds which might have confounded the mercury analysis (Table 2‐2). The wash water itself was sampled for background levels of THg and TSS. Group A subsamples were briefly agitated in the wash water, allowed to soak for 1.5–2 hours, and then agitated again to re‐suspend fine material for sampling purposes. Filtered (0.45 um) wash water samples were placed in 250 mL ultra‐clean Teflon bottles and frozen to await further analysis. The remaining wash water and suspended sediments were discarded from the group A subsamples, and any additional fine material remaining at the bottom of the container was rinsed away with DI water.
Table 2-2. Composition of Synthetic River Water for MRR Dredger Tailings Washing Experiment.
Concentration Ranges Based on 1993–1994 N/AQWA Data for the Lower Merced River.
A. Recipe
H2O 30 litres
Na2SiO3.9H2O 880 mg
CaCO3 825 mg
KCl 85 mg
MgCl2.6H2O 1017 mg
CH3COOH 203 mg
NaHCO3 500 mg
H2SO4 240 mg
B. Concentrations
pH 7.47
Na+ 11.0 mg/L
SiO2 6.0 mg/L
K+ 1.5 mg/L
Mg++ 4.0 mg/L
17 Mercury Assessment of the Merced River Ranch

Methods
Concentration Ranges Based on 1993–1994 N/AQWA Data for the Lower Merced River.
Ca++ 11.0 mg/L
Cl- 13.8 mg/L
SO4= 7.9 mg/L
DOC 2.7 mg/L
Hg (batch #1) 1 ng/L
Hg (batch #2) 1 ng/L Note: Table made on 3/23/04 by Frontier Geosciences Inc.(Seattle, WA).
Leaching of dry‐sorted and washed materials. The leaching procedure for the sorted dredger tailings materials was created as a specific modification of the selective sequential extraction (SSE) method. SSE was originally developed for determining the biogeochemically relevant fractionation of inorganic mercury in sediments and soils (Bloom et al. 2002). It provides differentiation of mercury compounds into five behavioral classes, yielding speciation information at sufficiently low limits of detection for background environmental studies. The original SSE method was developed to analyze small samples of pulverized material, which in the case of the dredger tailings material would not give a reasonable representation of how intact gravel pieces might behave in the river channel. Thus, the modified SSE chemical extractions were designed to act on the exposed mineral surfaces of whole, intact dredger pieces to indicate mercury speciation on the outer faces of potential spawning material. In addition to the above modification, the leaching procedure was a further adaptation of SSE in that it included only two leach steps. The first sequential leach step was a dilute acid (0.01M HCl + 0.1M CH3COOH) at pH 2.5, designed to quantify bioavailable mercury in the form in which it most likely existed. For low organic material (low TOC), this included mercury compounds in the +2 oxidation state and desorbed mercury from mineral matrices such as silica. For samples containing high organic matter (high TOC), this included mercury associated with organic matter, such as mercury bound to humic acids. The second sequential leach step was bromine monochloride (0.004M BrCl in 0.25M HCl), meant to represent the maximum mercury that could, over long periods of weathering, leach from dredger tailings material deposited in the river channel. Both of the reagents chosen for the 2‐step SSE were relatively inexpensive and available for use in the large volumes required for whole rock leaches. Each sequential extraction lasted 18 hours and was performed in the 10‐L polycarbonate containers.
18 Mercury Assessment of the Merced River Ranch

Methods
2.1.3
2.2.1
2.2.2
Laboratory Analysis
Sediment THg was quantified using sediment acid digestion, stannous chloride (SnCl2) reduction of Hg(II) to Hg0, purge and trap gold amalgamation, and cold vapor atomic fluorescence spectrophotometry (CVAFS) detection of Hg0 (USEPA 1996). MeHg in sediments was analyzed by acid bromide/methyl chloride extraction followed by aqueous phase ethylation, purge and trap on Carbotrap™, isothermal gas chromatographic (GC) separation, and CVAFS detection (Horvat et al. 1993a). Following the sequential extractions, each size fraction in the leach experiment was analyzed for THg using the same analytical procedure as sediment THg, without the acid digestion step. 2.2 Water
Water quality samples were collected within 1–2 weeks of the bioindicator samples, during fall 2003. Water quality was sampled in three dredger tailings ponds at the MRR, despite the fact that no bioindicator species were available for collection there.
Field Sampling
Water samples for THg and MeHg were collected in both filtered (0.45 um) and unfiltered (or raw) water, using prudent attention to cleanliness, including the use of rigorously cleaned equipment and bottles and the wearing of clean‐room gloves during sample handling. Water samples were filtered in situ using a portable pump (Masterflex, Vernon Hills) having virgin silicone rubber tubing (size 15) cleaned in hot dilute acetic and hydrochloric acid (CH3COOH + HCl). Sampling line tubing was Teflon FEP, cleaned in hot 4N hydrochloric acid (HCl). At each pond site, additional water samples were collected for dissolved organic carbon (DOC), TOC, sulfate, nitrate, ammonium, and total suspended sediments (TSS). Temperature, pH, and dissolved oxygen (DO) were measured in situ using a YSI 600XL Sonde multi‐probe. At the pond sites, the banks were steep and provided little solid footing for the pump apparatus. Thus, direct pumping of the water column sample was not practical and grab samples were taken using a 2‐L ultra‐clean Teflon jug.
Laboratory Analysis
All mercury analyses were carried out by Frontier Geosciences Inc. For MeHg in water samples, the MeHg was liberated from solution using an all‐Teflon distillation system. Distilled samples were then analyzed using
19 Mercury Assessment of the Merced River Ranch

Methods
aqueous phase ethylation followed by the same remaining steps as sediment‐associated MeHg (Bloom 1989). Nutrients (SO42‐, TP, NO3‐, NO2‐, NH4+), TOC, DOC, and TSS were analyzed using EPA methods shown in Table 2‐3.
Table 2-3. Analytical Methods.
Parameter EPA Method No. Units* Method Detection Limit Sediment Total Mercury (THg) 1631 ng/g 0.03 ng/g**
Methylmercury (MeHg) 1630 ng/g 0.01 ng/g**
Water Total Mercury (THg) 1631 ng/L 0.02 ng/L**
Methylmercury (MeHg) 1630 ng/L 0.03 ng/L**
Total Suspended Solids (TSS) ASTM D3977-97 (2002) mg/L 0.5 mg/L
Total Organic Carbon (TOC) 415.1 mg/L 0.15 mg/L
Dissolved Organic Carbon (DOC) 415.1 mg/L 0.3 mg/L
Sulfate (SO42-) 300.0 mg/L 0.06 mg/L
Nitrate (NO3-)/Nitrite (NO2-) 353.2 mg/L 0.001 mg/L
Ammonia (NH4+) 350.1 mg/L 0.003 mg/L
Biota Total Mercury (THg) 1631 ug/g 0.005 ug/g
Methylmercury (MeHg) 1630 ug/g 0.005 ug/g
Atmosphere
Elemental Mercury (Hg0) N/A ng/m3 2 ng/m3
* Unit conversions for sediment samples ng/g = ppb or ug/kg; water samples ng/L = ppb, mg/L = ppm; biota samples ug/g = ppm.
** Estimated based on quadruplicate blank measurements
2.3 Bioindicator Organisms
Bioaccumulation of mercury refers to the net incorportation of mercury in an organism from its environment, which typically results in biota concentrations that are orders of magnitude greater than ambient water concentrations (Weiner et al. 2003). Mercury trophic transfer begins at the bottom of the food web with primary producers adsorbing dissolved mercury, then branches out to include zooplankton and herbivores feeding on phytoplankton, small fish feeding on zooplankton, and beyond to large fish feeding on a combination of food from the lower trophic levels. Sampling of characteristic aquatic organisms can indicate relative levels of biotic exposure to mercury which may not be discernable from measuring ambient concentrations of THg or MeHg. Small fish and invertebrate mobility in the watershed is much less than that of larger fish, thus
20 Mercury Assessment of the Merced River Ranch

Methods
sampling these organisms can give an indication of relative integrated mercury exposure at individual sites. Bioindicator organisms such as small fish and invertebrates have been used throughout Northern California to determine relative methylmercury exposure and target potential remediation sites, including recent work in the Cache Creek watershed (Slotton et al. 2004). 2.3.1 Field Sampling
River sites Field sampling, sample preparation, and analysis followed techniques refined by the Slotton laboratory at UC Davis since 1985 and in conformance with the QAPP developed for previous CALFED project work (Puckett and van Buuren 2000). Small fish were collected using a backpack electroshocker (Figure 11). Small fish samples from each site consisted of approximately 15 individuals to be analyzed individually, similar to each other in size and intended to be functional replicates. Fish were field‐frozen in sealed, multiple ziplock bags with water surrounding, using dry ice in field packs. With this preservation technique, virtually fresh condition has been demonstrated in samples thawed for analysis up to 12 months following collection. All Merced River samples were maintained in excellent condition for analysis. Each sampled fish was weighed and measured in the laboratory. Riffle insects were collected with research kick screens. Aquatic insect samples were prepared as consistent multi‐individual composites of whole individuals (n ≥20 each), ideally collected in four unique replicates at each site. Aquatic insect samples were carefully cleaned of surficial sediment directly at the collection site, using a technique of multiple transfers, with shaking, into successively cleaner water baths. Stainless steel sieves and glass (or enamel) pans pre‐rinsed with deionized water and native water were used for these separations. Size range (length) was determined and individual insects were counted into pre‐weighed, clean vials, one for each composite sample. Continuing at streamside, excess water was consistently removed by inverting the vials over laboratory tissues. Average fresh/wet weight of the insects was then determined in the laboratory by weighing. Pond sites Several ponds within the MRR dredger tailings were investigated and found to be absent of the characteristic biota of the adjacent Merced River. This could be attributed to near complete lack of oxygen in the pools, a function of dense algal cover and subsequent high bacterial metabolic activity in the water column below. Thus, the biotic investigations were focused on river
21 Mercury Assessment of the Merced River Ranch

Methods
sampling conducted above, within, and below the tailings region as described above. 2.3.2 Laboratory Analysis
The small fish were analyzed as whole body, individual samples. In order to provide sufficient analytical mass, aquatic insects were analyzed as replicate, multi‐individual composites. Both the invertebrate multi‐individual composites and the whole, small fish samples were dried to constant weight at 55 °C and homogenized by grinding to a fine powder with either a modified coffee grinder (small fish) or a laboratory mortar and pestle (invertebrates). Dry powder samples have proven ideal for reproducibility, sample archiving, and availability for ancillary analyses such as carbon and nitrogen stable isotopes. Moisture percentage was carefully determined, through multiple weighings, to allow conversion to fresh/wet weight concentrations. All biota samples were analyzed at UC Davis. The dry powder samples were digested under pressure at 90 °C in a mixture of concentrated nitric and sulfuric acids with potassium permanganate. Following this step, samples were analyzed for THg via standard cold vapor atomic absorption (CVAA) spectrophotometry, using a Perkin Elmer Flow Injection Mercury System (FIMS) equipped with AS‐90 autosampler. All individual whole small fish and all aquatic insect composite samples were analyzed for MeHg in addition to THg. MeHg was analyzed at UC Davis by complexation with bromide in a copper sulfate/sodium bromide solution, followed by organic extraction into methylene chloride/hexane, and then acid digestion and FIMS CVAA analysis. Numerous blanks, aqueous standards, standard reference materials, field duplicates, method duplicates, continuing control standards, and matrix spikes were digested and analyzed with each set of samples. Sufficient tissue mass from each sample was archived to allow for reanalysis in the event that QA/QC for a given analytical run was compromised in any way. However, no problems were encountered. Summaries of QA/QC results are presented in Appendix A.
22 Mercury Assessment of the Merced River Ranch

Results and Discussion
3 RESULTS AND DISCUSSION 3.1 Dredger Tailings and River Sediments
3.1.1 Total Mercury in Fine Sediment from Dredger Tailings
Average THg in <2 mm dredger tailings material was 22±16 ng/g across n=31 sampling locations as shown in Table 3‐1. As shown in Figure 12, with the exception of one sample at location T9, all samples were below or within the range of natural background levels (50–80 ng/g) for California’s Central Valley (Bouse et al. 1996). There was no clear relationship between THg and sample elevation (r2 <0.01).
Table 3-1. Total Mercury in Dredger Tailings Fine Material (<2 mm).
MRR Site ID1Groundwater
Reached? Estimated Sample
Depth (ft) Total Hg (ng/g)
T3-C Y 282±3 20.1
T3-M Y 288±6 4.96
T4-C N 285±7 65.2
T5-C N 280±3 16.2
T5-L N 293±13 3.7
T6-C Y 302±3 25.1
T6-L Y 294±3 22.0
T6-M Y 287±3 25.4
T6-U Y 294±8 11.2
T7-C N 289±3 17.8
T7-L N 274±3 16.4
T7-U N 286±13 13.3
T8-C N 290±3 20.5
T8-M N 279±3 12.4
T8-U N 286±8 11.9
T9-C Y 290±3 88.5
T9-U Y 286±6 20.4
T10-C Y 286±8 30.5
T10-L Y 283±3 16.1
23 Mercury Assessment of the Merced River Ranch

Results and Discussion
MRR Site ID1Groundwater
Reached? Estimated Sample
Depth (ft) Total Hg (ng/g)
T10-M Y 278±3 23.9
T11-C N 292±3 15.0
T11-L N 280±3 20.6
T11-M N 290±9 30.5
T12-C N 291±3 22.1
T12-L N 283±3 17.1
T12-M N 292±9 20.6
T13-C N 295±3 19.8
T13-L N 288±3 16.4
T13-M N 297±9 25.6
T22-C Y 286±7 15.1 1 C = composite depth; L = lower elevation in tailings pile; M = mid-elevation in tailings pile; U = upper elevation in tailings pile
3.1.2 Effect of Processing on Mercury Leached from Intact Dredger
Tailings Material
Across all size fractions, small amounts of mercury were leached from whole, intact dredger tailings material during the 2‐step SSE, as shown in Table 3‐2. Levels of mercury leached during the pH 2.5 extraction, or the first step of the SSE, were at or near the estimated minimum detection limit (0.03 ng/g). Mercury extracted in this fraction is a surrogate for what might be extracted by the human stomach upon ingestion, or of mercury leachability under acid mine drainage conditions. There was large variability in the data, as indicated by the relatively large standard deviations for the pH 2.5 mean values, and in two cases the results were small negative values. This response was likely due to a combination of measuring at or near the method detection limit (MDL) and re‐adsorption of wash water Hg(II) by small amounts of humic matter which coagulate on sediment surfaces at this pH (Bloom et al. 2002).
Table 3-2. Results of the Modified 2-step SSE for Dredger Tailings.
pH2 Leach Step BrCl Leach Step Total (pH2 + BrCl) Size Fraction
(mm)
Wash Water (WW) Washed prior
to leach Dry sorted
prior to leach Washed prior
to leach Dry sorted
prior to leach Washed prior
to leach Dry sorted
prior to leach <2 0.039±0.014 N/A 0.002±0.024 N/A 11.5±5.0 N/A 11.5±5.0
2–13 0.005±0.003 -0.007±0.018 0.001±0.004 1.0±0.6 3.4±1.2 1.0±0.6 3.4±1.2
13–150 0.002±0.002 0.000±0.003 -0.001±0.001 0.2±0.1 0.3±0.1 0.2±0.1 0.3±0.1 Note: Values for both washed and dry-sorted processing techniques given as ng/g dry wt ±1SD.
24 Mercury Assessment of the Merced River Ranch

Results and Discussion
Mercury leached during the second step (BrCl) of the 2‐step SSE was 2–4 orders of magnitude greater than that of the pH 2.5 step across all size fractions. As BrCl is a strong oxidizer, this step represented the maximum theoretical mercury that could be leached from the intact material over a longer, geologic time period. There was a clear relationship between leachable mercury and grain size (Figure 13), with the largest amount of mercury leached from the fine (< 2 mm) material, and the least amount leached from the cobbles and gravel (13–150 mm). Using a variance stabilizing transformation, a single‐factor ANOVA was performed on the log‐transformed dry‐sorted data, across all size fractions. The data transformation was carried out to reduce the effect of sample mean on sample variance and to more closely approximate a normal population distribution, which is a requirement of the ANOVA test (Zar 1996). Based on this approach, there was a strong association of mercury with fine sediments (p<0.0001, n=3), similar to dredger tailings material studied at Clear Creek (Ashley et al. 2002). Figure 14 illustrates the effect of washing versus dry sorting on summed leachable mercury (pH 2.5 + BrCl) from the 2‐step SSE. Separate t‐tests were performed on the 2–13 mm fraction and on the 13–150 mm fraction using log transformed data. This analysis was used rather than a two‐factor ANOVA because, for the purposes of this experiment, the interaction between the effects of size fraction and washing on potential mercury release was not of primary interest. Rather, the effect of washing on the largest size fraction, which could be used to meet the gravel augmentation objective, was considered to be an informative finding. A second t‐test was performed for the 2–13 mm fraction to highlight the fact that mercury was mainly associated with fine material in the dredger tailings. Since there was more fine material present by mass in the 2–13 mm size fraction, as compared with the 13–150 mm size fraction, there was a larger effect of washing the 2–13 mm fraction to remove leachable mercury. The washing effect was statistically significant (p<0.05) for the 2–13 mm fraction, but was not particularly effective (p=0.8) at decreasing mercury leached from the 13–150 mm size fraction. Again, this is presumably because there was so little mercury present in the tiny amount of fine material associated with the larger cobbles and gravel. 3.1.3 Total Mercury in Fine Sediment from River Sites
The fine sediments collected at the two river sites and three MRR pond sites had the highest sediment mercury levels found during the study, ranging 48–138 ng/g by dry weight (Figure 15, Table 3‐3). Despite relatively high
25 Mercury Assessment of the Merced River Ranch

Results and Discussion
mercury levels compared with dredger tailings fines and whole rocks, these samples were still within the typical 50–200 ng/g range for uncontaminated soils and sediments (Davis et al. 1997). Of the five locations where fine sediments were sampled, the lowest THg levels were found at the near control site, sampled above Merced Falls Dam. The THg value measured at this site (50 ng/g) was the same as pre‐mining, natural background levels estimated for San Francisco Bay (Hornberger et al. 1999) and near average crustal abundance levels (67 ng/g) (Emsley 1998). Although this suggests a low probability of mercury contamination in the upper Merced watershed, more comprehensive sampling would be required to increase the confidence in these results.
Table 3-3. Mercury in Fine Sediments, Raw Water, and Biota Samples along the Merced River.
Fine Sediments (ng/g dry weight)
Raw Water (ng/l)
Hydropsyche Caddisfly
(ng/g wet weight)
Prickly Sculpin (ng/g wet weight) Site Name
THg MeHg %MeHg THg MeHg THg MeHg THg MeHg Above Lake McClure (RM 100) (Control)
NS NS NS 0.5 <0.03 13 8 28 24
Merced Falls Dam (RM 55) (Near
Control) 47.81 0.11 0.31 1.21 0.041 282 242 1112 1002
MMR (RM 50) 138.4 3.5 2.5 1.1 0.04 17 12 64 53
Pond 1 (P1) 108.2 0.3 0.2 28.4 1.10 NS NS NS NS
Pond 2 (P2) 75.4 1.5 2.1 169.2 3.01 NS NS NS NS
Pond 3 (P3) 108.5 0.9 0.9 3.2 0.15 NS NS NS NS Below Hwy59 (RM
41) NS NS NS 6.5 0.44 17 13 70 63
Ratzlaff Reach (RM 40)
NS NS NS 1.0 <0.03 14 11 65 58
Note: NS = sample was not available at the time of collection. Fine sediment and raw water data were collected as individual samples while biota values represent mean values of composite samples (see Appendix B). 1 Sample collected just above Merced Falls Dam. 2 Sample collected just beneath Merced Falls Dam.
In contrast to fine sediments with greater mineral content, the settleable solids, collected in the absence of available fine sediments adjacent to the ranch and in three ponds at the Ranch, exhibited relatively greater THg levels, ranging 75–140 ng/g (Figure 15a). These values approached but were on the low end of the range of THg found in sediments of other Northern California rivers situated downstream of historical mining regions and the central Bay‐Delta (100–1,000 ng/g) (Heim et al. 2003, Hornberger et al. 1999). Settleable solids were composed of detritus and the plants and animals adhering to this detritus, or aufwuchs (Horne and Goldman 1994), which
26 Mercury Assessment of the Merced River Ranch

Results and Discussion
had a highly porous, organic matrix and a large surface area for mercury adsorption. MeHg ranged from 0.1 to 3.5 ng/g as dry weight (Figure 15b), with the lowest and highest concentrations and percent MeHg occurring at adjacent sites; 0.1 ng/g at the near control site, sampled above Merced Falls Dam, and 3.5 ng/g at the MRR site. Percent MeHg at these sites was 0.2% and 2.5%, respectively. Since levels of MeHg in sediments > 1 ng/g generally indicate favorable mercury methylating conditions (Gilmour et al. 1998, Heim et al. 2003), the setteleable solids collected at the MRR Cuneo access site and within ponds 2 and 3 represented favorable environments for bioavailable mercury. 3.2 Water
3.2.1
3.2.2
Flow Conditions
Flows were obtained from U.S. Geological Survey river gauging data. At the time of these collections (November 4 and 6, 2003), flow at the unregulated control site above Lake McClure was approximately 1.4 m3/s (50 cubic feet per second [cfs]; gage location at 37.599 N, 119.978 W, elev= 350 m, operated by Merced Irrigation District). Below the reservoirs, regulated flows were all approximately 8.5 m3/s (300 cfs; first gage location below Merced Falls Dam 37.522 N, 120.331 W, elev=95 m, operated by Merced County; second gage location near Snelling: 37.502 N, 120.451 W, elev=79 m, operated by California Department of Water Resources). For most of the prior season, however, flows at sites below the reservoirs were regulated differently. Until approximately one week prior to sampling, flow at the near control site below Merced Falls Dam was maintained at approximately 22.7 m3/s (800 cfs) for use by irrigation, and was diverted away from the river by canal prior to the remaining downstream sites. Biotic sampling was not possible at this flow level. Throughout most of the summer and fall, flows at the downstream MRR, Below Hwy59, and Ratzlaff Reach sites were maintained at approximately 3.3 m3/s (115 cfs). Flows at these three sites were altered prior to and during the sampling by the Merced Irrigation District as annual spring out‐migration flows, a part of the Vernalis Adaptive Management Program.
General Water Quality
The river sites exhibited low mineral content, low turbidity, and low organic carbon. DO was in the range of 7–9 mg/L and pH values ranged from 6.7 to 7.9 (Table 3‐4). Nitrate, ammonium and sulfate values were low throughout the sampled river reach, and within ranges given for typical temperate
27 Mercury Assessment of the Merced River Ranch

Results and Discussion
rivers (Horne and Goldman 1994). TSS levels in the river were low (0.2–3.5 mg/L). In contrast to the river sites, DO levels within the MRR ponds were low at 0.5–1 mg/L, while TSS was relatively high, 70–710 mg/L. TOC and DOC levels of 4–8 mg/L in the MRR ponds were typical for wetland environments (Horne and Goldman 1994) and were greater than those of the river sites (Figure 16).
Table 3-4. Water Quality at Merced River Sites.
Site Temp (°C)
TSS (mg/L)
pH DO (mg/L)
NH4+
(mg/L as N) NO2-/NO3-
(mg/L as N) SO42-
(mg/L) TOC
(mg/L) DOC
(mg/L) Above Lake McClure (RM 100) (Control) 10.7 <0.5 6.7 8.5 0.003 0.406 3.48 2.20 2.10
Above Merced Falls Dam (RM 55) (Near
Control) 13.9 2.0 7.2 8.4 < 0.003 0.085 1.17 2.60 2.32
MMR (RM 50) 13.3 2.0 7.9 7.9 < 0.003 0.103 1.20 2.31 1.97
Pond 1 (P1) 14.5 710 7.5 1 0.071 0.004 0.60 6.37 4.75
Pond 2 (P2) 14.5 360 7.6 <0.5 < 0.003 < 0.001 0.49 6.42 4.23
Pond 3 (P3) 14.5 72 7.5 <0.5 0.010 0.002 0.28 7.60 5.66 Below Hwy59 (RM
41) 17.4 55 7.4 7.8 < 0.003 0.002 0.91 4.46 4.10
Ratzlaff Reach (RM 40)
13.2 3.5 7.6 7.6 < 0.003 0.078 1.27 ND 4.34
Note: Temperature, pH and DO were measured in situ. DO was corrected for altitude.
3.2.3 Mercury and Methylmercury
Aqueous THg and MeHg data are summarized in Table 3‐3. Aqueous filtered THg (Figure 17a) showed no particular pattern with sampling site, and aqueous raw THg (Figure 17b) was well below the USEPA National Ambient Water Quality reference standard for aquatic toxicity at 770 ng/L (4‐day avg). Except in Pond 2, aqueous raw THg was also below the California Toxics Rule for a drinking water source of 50 ng/L. In‐river‐channel aqueous raw THg was at or below levels measured at relative control sites for the Cache Creek watershed (Slotton et al. 2004), a highly mining‐impacted watershed in Northern California which has been identified for regulatory and remedial action with regard to mercury. Measured aqueous filtered MeHg levels were in most cases at or below the estimated MDL (Figure 18a). The highest filtered MeHg values were associated with MRR Ponds 2 and 3 and the Below Hwy59 control site. Aqueous raw MeHg concentrations followed the same general pattern as raw THg, with relatively greater concentrations within the MRR ponds and at the Below Hwy59 lower control site (Figure 18b). In general, aqueous
28 Mercury Assessment of the Merced River Ranch

Results and Discussion
MeHg was an order of magnitude less than THg and, as for aqueous raw THg, the in‐river‐channel sites were at or below levels measured at relative control sites for the Cache Creek watershed (Slotton et al. 2004). Recently, an annual, median aqueous MeHg concentration goal was set for Cache Creek at 0.07 ng/l, based on a TMDL target concentration for large, trophic level four fish (0.28 mg/kg wet weight) (Cooke et al. 2004). The one‐time sampling events for pond sites at the MRR and the Below Hwy59 site exhibited aqueous raw MeHg levels significantly above 0.07 ng/l, while the remaining in‐river sites were below this value (Table 3‐3 and Figure 18b). There is no TMDL currently in effect for the Merced River, however comparison to the Cache Creek TMDL suggests that mercury present in the Merced River, albeit at low levels compared with other mining impacted areas in Northern California, appears to be readily bioavailable in pond/wetland environments. Further study is needed to determine annual median MeHg concentrations for the Merced River. The relationship between TSS and THg or MeHg is shown in Figure 19. Measurement of TSS as a surrogate for aqueous THg has been explored as a less expensive approach to characterizing mercury presence and transport in watersheds. With regard to storm event flows in individual streams, this relationship has been shown to exist (Domalgalski 1998 and 2001). For the Merced River sites, which were sampled prior to the rainy season, there was a strong power relationship between TSS and both THg (r2=0.81) and MeHg (r2=0.90). However, the sites having the highest TSS and the greatest aqueous THg or MeHg concentrations were the MRR ponds and the Below Hwy59 site, locations where algal production rather than sediment material dominated TSS. It is likely that high levels of algal‐derived TSS were driving the power relationship between TSS and mercury since both parameters were 2–3 orders of magnitude lower in the main river channel than in the ponds or the backwater at the Below Hwy59 site. When these sites were excluded from the power regression, as shown in Figure 3.8, TSS and THg (r2=0.90) and TSS and MeHg (r2=0.66) for the in‐channel river sites still exhibit a relationship, albeit with only three data points. While more extensive sampling is required to confirm this hypothesis, it provides additional support for the notion that Merced River sites which behave as typical pond/wetland environments in regard to the measured water quality parameters TOC, DOC, and TSS, also exhibited the greatest potential for THg and MeHg contamination. This also suggests that the Below Hwy59 control site, while connected directly to the main channel, did not act as a true downstream control for in‐river‐channel measured water quality parameters.
29 Mercury Assessment of the Merced River Ranch

Results and Discussion
3.3 Bioindicator Organisms
3.3.1
3.3.2
Presence of Bioindicator Organisms
The study was designed to use both an invertebrate and a small fish as primary indicator organisms for mercury bioaccumulation in the lower Merced River aquatic food web. As is typical of many rivers, species assemblages changed to some extent across the study region. However, one taxon of benthic invertebrate and one species of small fish were identified which could be effectively sampled across the range of river sites. Hydropsychid caddisfly larvae were found to be the only macroinvertebrates consistently present in sufficient densities for sampling. These drift‐collecting, omnivorous aquatic insects have been used extensively as bioindicators of relative mercury exposure (Slotton et al. 2004). It was possible to assemble quadruplicate, multi‐individual composites from four of the five river sites. A single multi‐individual composite sample was obtained from the uppermost control location above Lake McClure. Prickly sculpin (Cottus asper) were found to be the most consistently available small fish for use as a mercury bioindicator across the study region. The prickly sculpin is a small, predatory, trophic level 3 (TL3), relatively short‐lived fish species that tend to remain in the same localized area (Moyle 2002). Fifteen individuals were obtained within a similar size range at each of the four lower sites. Extensive sampling yielded ten sculpin from the uppermost, control site above Lake McClure. Data from the biological samples are presented by site in Appendix B and graphically, in Figures 20 through 25.
Mercury in Aquatic Insect Bioindicators
Data from the Hydropsychid caddisfly samples are presented in Appendix B and Figure 20. Each composite sample was comprised of between 37 and 63 whole individuals. Reproducibility in mercury content was high between replicate composites at the sites where replication was possible, indicating that each multi‐individual composite closely represented localized mean concentrations. Across the range of sampling sites, caddisfly MeHg ranged from 8 to 25 ng/g (ppb) on a fresh or wet weight basis. Corresponding THg ranged from 13 to 29 ng/g. The mean MeHg:THg ratio ranged between a low of 57% at the uppermost control site above Lake McClure to a high of 86% at the near control site, sampled below Merced Falls Dam, immediately downstream of the reservoirs. Moving downstream from Merced Falls, the MeHg:THg ratio declined with distance, with means of 78%, 75%, and 72%.
30 Mercury Assessment of the Merced River Ranch
Results and Discussion
Caddisfly mercury concentrations (both MeHg and THg) exhibited a spatial trend similar to that described above for the MeHg:THg ratio. The lowest mean concentration, 8 ng/g MeHg, was seen at the upstream control site above Lake McClure. At the Merced Falls site below the reservoirs, caddisfly MeHg was elevated three fold, averaging 24 ng/g. This represented a “near control” for the downstream sites within and below the zone of dredger tailings. Mercury bioaccumulation was not found to increase downstream of Merced Falls as the river moved through the dredger tailings material. Instead, caddisfly MeHg dropped by approximately 50%, to concentrations of 11–13 ng/g. This relative decline was strongly significant statistically. Concentrations were similar among the sites located in the middle of the tailings zone and immediately downstream of it (12–13 ng/g). A small but statistically significant additional decline was seen moving downstream between the Below Hwy59 site, located below the tailings zone, and the Ratzlaff Reach site, located at the base of the river restoration project (13±0.3 ng/g vs. 11±1 ng/g). To place these caddisfly mercury concentrations into regional context, Figure 21 plots concentrations from MRR (the mid‐dredger tailings zone location) together with comparable caddisfly data collected from other regional rivers. These sites include the downstream reaches of Cache Creek and the Feather, Yuba, Bear, American, and Truckee Rivers. Data for this comparison were chosen from similar downstream valley locations. Caddisfly mercury concentrations were notably lower from the central portion of the Merced River dredger tailings zone than from all of these comparable river sites. It should be noted that the comparison data from the other sites represent among the lowest mercury levels from each of those watersheds, and that dramatically higher concentrations than those shown in the figure occurred at sites more closely associated with historic mining. The Merced River caddisfly data indicate the Merced dredger tailings to be relatively benign as a current or future source of mercury exposure. Several other aquatic insect taxa commonly used as mercury bioindicators were available for collection at the most upstream control location above Lake McClure. These included herbivorous Pteronarcyid stoneflies and predatory Perlid stoneflies and Corydalid hellgrammites. Data are presented in Table B‐1. The predatory species contained higher mercury concentrations and MeHg:THg ratios than the corresponding caddisflies, as is typical. All upstream samples were consistent in defining a low mercury environment in the Merced River above the reservoirs, relative to other regional rivers. The caddisfly data from below the reservoirs at the Merced Falls Dam site indicate that processes within the reservoirs may elevate MeHg exposure levels. However, this influence in the downstream river
31 Mercury Assessment of the Merced River Ranch

Results and Discussion
appeared to be localized. Concentrations declined substantially below the Merced Falls Dam site, with the zone of dredger tailings apparently not contributing any substantial additional mercury inputs. In Figure 22, the caddisfly MeHg spatial data are compared to aqueous raw and filtered THg and MeHg in corresponding grab samples. Note that the Below Hwy59 site behaved as an outlier in three of the four cases shown in the figure. This may be due to the collection of water at this site from a backwater region, while biota from all river sites were sampled from turbulent mid‐channel locations. Despite the single date nature of the water sampling, some correlations were apparent, particularly between caddisfly MeHg and aqueous THg (raw fraction r2=0.59, filtered fraction r2=0.91). The correlation was weaker with aqueous raw MeHg (r2=0.52) and not significant for aqueous filtered MeHg (r2=0.31). This compares to extensive aqueous vs bioindicator Hg research in the Cache Creek watershed (Slotton et al. 2004) which showed biotic Hg to be linked most directly to aqueous raw MeHg, with other aqueous Hg fractions demonstrating general co‐correlations on a watershed‐wide basis. That work utilized numerous seasonal water samples. Aqueous samples can be quite variable, as compared to bioindicator samples which integrate exposure over time and across numerous replicate individuals. The caddisfly data provide an integrative measure indicating that the lower Merced River dredger tailings zone is a relatively low‐mercury environment. 3.3.3 Mercury in Small Fish Bioindicators
Data from the prickly sculpin (Cottus asper) samples are presented in Appendix B and, graphically, in Figures 23 through 25. Fifteen individual sculpin were analyzed individually from each of the lower four sampling sites, with ten individuals analyzed from the most upstream control site above Lake McClure. These small fish ranged in size from 58–107 mm (2.3–4.2 in). Whole body, wet weight MeHg ranged between 13 and 195 ng/g across all project sites (0.013–0.195 ppm). Corresponding THg ranged from 16–211 ng/g (0.016–0.211 ppm). The MeHg:THg ratio was similarly high at all sites, averaging 83–90%. Within‐site mercury content was quite variable among individuals from most locations. To test the possibility that this intra‐site variability might be related to fish size, individual sculpin mercury from each site is plotted relative to fish size in Figure 23 (a–e). Mercury typically varies with size in larger predaceous fish species such as bass, but size was not expected to be a major factor within the range of small sizes used for these collections. An increasing trend with sculpin size was in fact noted for the upper control site above Lake McClure and the Below Hwy59 site. However, no clear
32 Mercury Assessment of the Merced River Ranch

Results and Discussion
trend with size was apparent for the remaining sites across the same range of sizes. Consequently, we could not justify removing selected data in pooled data inter‐site comparisons. Despite the fairly high degree of within‐site variability in sculpin mercury content, the overall spatial trend, as shown in Figure 24, closely matched that seen in the caddisfly indicator samples. Trends were again identical for both THg and MeHg. As did the caddisflies, the sculpin demonstrated lowest concentrations at the upstream control site above the reservoirs (24±8 ng/g MeHg) and greatest concentrations at the “near control” site immediately below the reservoirs at Merced Falls (100±22 ng/g). This four‐fold elevation was strongly significant statistically. Also as seen in the caddisfly spatial trend, sculpin MeHg downstream of the Merced Falls site declined substantially. Mean concentrations from MRR, Below Hwy59, and Ratzlaff Reach sites (mid dredger tailings, below dredger tailings, and below the restoration project) were approximately 40% lower than the level at Merced Falls. Though the intra‐site error bars were relatively large for the sculpin, the downstream decline in MeHg below the Merced Falls site was statistically significant at the 95% confidence level for two of the three downstream sites (MRR site, mid‐dredger tailings, and Ratzlaff Reach site at the restoration project). MRR, Below Hwy59, and Ratzlaff Reach sites were all significantly elevated relative to the upstream control site above the reservoirs, but were all reduced relative to the near control site for the reservoir release water at Merced Falls. The sculpin data were consistent with the caddisfly data, again indicating that the Merced River dredger tailings contribute relatively low levels of bioavailable mercury to the Merced River aquatic ecosystem. With the exception of the Lake McClure upper control site, sculpin MeHg data above, within, and below the DTR was greater than the range for trophic level 3 (TL3) red shiner (22–42 ng/g whole body wet weight) collected at George Hatfield State Park, at the Merced River confluence with the San Joaquin River (SFEI 2001, Slotten et al. 2002, TSM2 2002). Additional studies are needed to determine whether these results are directly comparable and if there are additional factors responsible for a further decrease in mercury content of TL3 fish in the lower Merced River below the DTR. In contrast, bass and catfish, TL4 fish collected at George Hatfield State Park, ranged across relatively high levels (100–500 ng/g, median 300 ng/g), suggesting a low overall assimilative capacity for additional MeHg loading to the Merced River. Sculpin MeHg spatial data are compared to aqueous raw and filtered THg and MeHg in corresponding grab samples in Figure 25. Trends were similar
33 Mercury Assessment of the Merced River Ranch

Results and Discussion
to those found with the caddisflies. Again, the Below Hwy59 site behaved as an outlier in three of four comparisons and, despite the low sample size and one‐time water sampling event, a significant correlation was apparent between sculpin MeHg and aqueous THg, as either the raw (r2=0.78) or filtered (r2=0.99) fractions. The correlation was less significant for aqueous raw MeHg (r2=0.58) and aqueous filtered MeHg (r2=0.57). 3.4 Potential for Adding Mercury to the Merced River through Gravel
Augmentation
The washing experiment showed that leachable mercury in the sampled dredger tailings material was low per mass of sample, even within the finest size fraction (<2mm). Based on the experimental results, a series of simple calculations can be carried out to estimate the range of potential mercury additions to the river, should MRR dredger tailings be used for gravel augmentation. 3.4.1 Likely Near‐term Mercury Release
The wash water signal is used as an indication of mercury released immediately following placement of dredger tailings material in the river channel, since the experimental wash water was synthetically created to mimic chemical conditions in the Merced River. An example calculation is shown below for dry‐sorted, 13–150 mm gravel:
graveltonmgHg
graveltongravellb
gravellbgravelg
ngHg
mgHggravelg
ngHg_
0014.0_
_2000_
_454610_
0015.0 =××× (1)
Figure 26a shows the results of these calculations across all three leached size fractions (13–150 mm, 2–13 mm, and <2 mm), as well as including an estimation of THg release from bulk, unprocessed tailings. The unprocessed signal was calculated using weighted THg results from the leach experiment along with the known mass distribution of each size fraction (URS 2004) for individual samples. Based on this approach, the likely near‐term THg release from dry sorted 13–150 mm material is 50% less than that of unprocessed tailings (Figure 26a). Ultimately, the volume of sediment needed for long‐term maintenance of spawning habitat would be determined based on monitoring of transport rates and sediment storage in the DTR. However, in the near‐term it is not likely that the entire volume of MRR dredger tailings would be added to the river. Simplified assumptions can be made regarding initial and
34 Mercury Assessment of the Merced River Ranch

Results and Discussion
maintenance gravel volumes necessary to meet augmentation goals under the current flow regime. Assuming a project length of 10,970 m (36,000 ft), an average infusion depth of 0.6–1.2 m (2–4 ft), an average channel top width of 35 m (115 ft), and a bank slope of 1:3, the initial gravel volume would be approximately 230,000–410,000 tons (270,000–480,000 cubic yards) and maintenance volumes would be 2,200 tons (2,600 cubic yards) annually (Stillwater Sciences 2002). Using these assumptions, 1.2 g Hg initially and 0.0065 g Hg annually would potentially be added to the Merced River for long‐term maintenance of salmonid spawning habitat using unprocessed dredger material. The hypothetical 50% reduction from using the dry sorted, 13–150 mm fraction would result in 0.6 g Hg initially and 0.0033 g Hg annually. 3.4.2 Maximum Theoretical Mercury Release
For this estimation, the BrCl leach results are used to compare the processing techniques (dry sorted vs. washed and dry sorted) for maximum theoretical THg release into the river. An example calculation is shown for the dry‐sorted, 13–150 mm gravel:
graveltonmgHg
graveltongravellb
gravellbgravelg
ngHg
mgHggravelg
ngHg_3.0
__2000
__454
610_3.0 =××× (2)
Figure 26b compares the results from dry sorted vs. washed and dry sorted across all three leached size fractions (13–150 mm, 2–13 mm, and <2 mm), and it also includes an estimation of THg release from bulk, unprocessed tailings. Maximum theoretical THg release from 13–150 mm gravel (within the uncertainty of the results, either washed [0.23 mg/ton] or dry sorted [0.26 mg/ton]) is 72% lower than release from unprocessed bulk (0.8 mg/ton), suggesting that dry sorting will have a significant effect on long‐term, mercury leaching potential from the dredger tailings added to the river channel (Figure 26b). Based on the above calculations, if the entire volume of unprocessed dredger tailings at the MRR (3,760,000 tons [3,215,000 yd3]) (URS 2004) were used for gravel augmentation purposes, the maximum theoretical mercury made available in the river would be approximately 2.7 kg over geologic time. At a 72% reduction, the 13–150 mm dry sorted fraction would theoretically release 0.75 kg, again as a maximum value over a long period of geologic time.
35 Mercury Assessment of the Merced River Ranch

Results and Discussion
3.4.3 Summary of Calculations
Based on the above assumptions, potential mercury released from MRR dredger tailings used for gravel augmentation ranges from 0.6 g plus 0.003 g/yr from maintenance injections to 0.75 to 2.7 kg over geologic time, depending on whether bulk or dry sorted material is used. It is important to note that neither of these estimates is a mercury mass loading rate for the lower Merced River. THg mass loadings have been estimated for the mainstem Sacramento River and tributaries to the Sacramento River and the Bay‐Delta at 20–220 kg/yr (DTMC and SRWP 2002), based on knowledge of flow conditions and mercury sources in the Sacramento River watershed. Foe (2002) gives a mass loading estimation for the San Joaquin River during the period March 2000–September 2001 as approximately 36 kg, or 24 kg/yr for the study period. Total raw mercury entering the Bay‐Delta was estimated at approximately 190 kg/yr for the same period (Foe 2002), with an estimated 610 kg Hg/yr (0.7 ton Hg/yr) entering San Francisco Bay as a whole (CRWQCB 2000). Although these estimates vary and differ in their coverage of the San Francisco Bay‐Delta system, it appears that the use of MRR dredger tailings for gravel augmentation would introduce relatively minimal mercury, in either the near‐term or long‐term, to the lower Merced River and eventually to the San Francisco Bay‐Delta.
36 Mercury Assessment of the Merced River Ranch

Conclusions
4 CONCLUSIONS This study assessed the occurrence and distribution of mercury in the DTR of the lower Merced River, as a potential analog to other San Joaquin River tributaries in which placer mining and gold dredging were conducted. Through sampling sediment, water and bio‐indicator organisms, the study was designed to determine the risk of mercury mobilization and uptake into the aquatic food chain, and to assess the feasibility of processing dredger tailings for mercury removal before placement in the river channel. Study hypotheses are re‐iterated below along with the associated conclusions to summarize the results:
1. There is a vertical and/or horizontal spatial distribution pattern for mercury in the Merced River Ranch dredger tailings and the underlying floodplain.
Despite the fact that this information might have been used to prioritize use, processing requirements, or sequestration of particular deposits at the MRR, there were no discernable vertical patterns, areal or longitudinal differences in mercury distribution above the groundwater table in the sampled dredger tailings.
2. The dredger tailings contain significant residual mercury as compared with
background levels in undredged reference sites.
Mercury levels in fine sediments from sampled dredger tailings at the MRR were below or within the range of natural background levels for California’s Central Valley.
3. Mercury is primarily associated with fine grain‐size fractions (< 2mm) within the dredger tailings material.
There was a strong relationship between mercury and fine sediments in the sampled dredger tailings. This finding confirms the benefits of size selective separations as a means of reducing future mercury loading to the San Francisco Bay‐Delta. However, the combination of low mercury levels in sampled dredger tailing
37 Mercury Assessment of the Merced River Ranch

Conclusions
fines and the small mass of fines associated with 13–150 mm sized cobble and gravel, meant that additional washing had no measurable effect on mercury leached from the exterior surfaces of gravel sizes commonly selected for spawning gravel augmentation.
4. The dredger tailings contain significant residual mercury that may impact exposure and bioaccumulation levels in the lower Merced River’s aquatic food web, particularly if the dredger tailings are removed from the underlying floodplain and used for gravel augmentation.
The relatively high aqueous MeHg concentrations found in the ponds at the MRR and the Below Hwy59 site suggested that a large fraction of the total mercury present was bioavailable.
The bioindicator data showed that MeHg levels in caddisfly larvae and prickly sculpin were greatest upstream of the MRR at the Merced Falls Dam site, and then decreased and remained stable throughout the DTR. Although these results indicate mercury contamination within the system, this suggests that the dredger tailings contribute relatively low levels of mercury to the lower Merced River.
38 Mercury Assessment of the Merced River Ranch

Recommendations
5 RECOMMENDATIONS The conceptual restoration strategy for the DTR includes removing tailings from the floodplain to provide a functional riparian and floodplain corridor and adding gravel to the channel. Establishment of a restored floodplain requires removing the tailings located above current groundwater elevation, while the dredge sluice tailings, or those sediments possessing the greatest potential for mercury contamination at the MRR, will likely remain buried. It is not expected that channel migration would expose buried sluice sand tailings. By comparing the aerial photographs between 1915 and 1993, Vick (1995) concluded that lateral migration of the channel had been arrested after the river was realigned following the gold dredging activities. The construction of New Exchequer Dam in 1971 significantly reduced the magnitude of peak flow (Stillwater Sciences 2002, Vick 1995), and thus, further reduced the potential for channel migration. Because the restoration strategy does not call for re‐establishment of the unimpaired hydrograph, it is unlikely that the river will migrate following restoration. Although channel migration does not present itself as a likely mechanism for mercury mobilization in the lower Merced River, additional sampling in sediments and dredger material located below the ground water table is recommended to identify potential areas of mercury contamination not covered by this study. Since the experimental results indicate no significant difference (p=0.8) between washed and dry sorted gravel and cobble (13–150 mm) from the dredger tailings, washing this fraction may not remove significant quantities of residual mercury from the dredger tailings. However, although the fraction of fine material present in the MRR dredger tailings is not necessarily excessive with regard to salmonid spawning requirements, its placement in the river will necessitate a permit under Section 401(a)(1) of the Clean Water Act (CWA) and may violate water quality standards for turbidity, and/or additional ambient water quality criteria for the protection of freshwater aquatic life. If the MRR dredger tailings are processed prior to gravel augmentation, batch testing of the processed rocks and the retained solids is recommended
39 Mercury Assessment of the Merced River Ranch

Recommendations
since absolute confirmation of the lack of mercury contamination at the site is only possible by testing the entire volume of material. Mercury presence is likely to be extremely heterogeneous in the dredger material, and the number of samples collected during this study was not extensive enough to exclude the possibility of localized deposits (i.e., hot spots). To address the strong possibility of localized mercury hotspots in the tailings and the notion that large fish in the lower Merced River may already be exceeding recommended limits for the protection of aquatic life, aqueous MeHg concentrations in the vicinity of the MRR should be measured before, during and after restoration activities to determine whether these activities increase MeHg levels in the river and within pond/wetland sites at the Ranch. Following restoration activities, MeHg concentrations in bioindicator species (e.g., caddisfly larvae and sculpin) should be monitored in the river and within pond/wetland sites at the ranch to determine potential project effects. If the results indicate that MeHg concentrations in the Merced River increase as a result of restoration activities, follow up studies should be undertaken to determine why and what best management practices might be undertaken to reverse the trend.
40 Mercury Assessment of the Merced River Ranch

Acknowledgements
6 ACKNOWLEDGEMENTS Stillwater Sciences would like to thank Dr. Christopher Foe (California Regional Water Quality Control Board Central Valley Region), Dr. James Rytuba (United States Geological Survey), and Kris Vyverberg (California Department of Fish and Game) for comments on the draft version of the final report. We also thank Professor Johnnie Moore (University of Montana), Michelle Wood (Central Valley Regional Water Quality Control Board), Donna Podger (California Bay‐Delta Authority), Kevin Faulkenberry (California Department of Water Resources), and Alexander Begaliev (California Department of Water Resources) for comments on the draft study plan. Participation in the review process is in no way an affirmation of the report findings. Stillwater Sciences takes full responsibility for the contents herein.
41 Mercury Assessment of the Merced River Ranch

References
7 REFERENCES Abu‐Saba, K.E.and L. W. Tang. 2000. Watershed Management of Mercury in the San Francisco Bay Estuary: Total Maximum Daily Load. Report to U.S. EPA California Regional Water Quality Control Board, San Francisco Bay Region. June 30, 2000, 170 p. (http://www.swrcb.ca.gov/rwqcb2/download/aug00HgTMDL.pdf) Alpers, C.N. and M.P. Hunerlach. 2000. Mercury contamination from historic gold mining in California. USGS Fact Sheet FS‐061‐00. Ashley, R.P., J.J. Rytuba, R. Rogers, B.B. Kotlyar, and D. Lawler. 2002. Preliminary Report on Mercury Geochemistry of Placer Gold Dredge Tailings, Sediments, Bedrock, and Waters in the Clear Creek Restoration Area, Shasta County, California. US Geological Survey, Open‐File Report 02‐401, Menlo Park, California. Bloom, N.S. 1989. Determination of picogram levels of methylmercury by aqueous phase ethylation, followed by cryogenic gas chromotography with cold vapor atomic fluorescence detection: Canadian Journal of Fisheries and Aquatic Science, v. 46, p. 1131–1140. Bloom, N.S., E. Preus, J. Katon, and M. Hiltner. 2002. Selective extractions to assess the biogeochemically relevant fractionation of inorganic mercury in sediments and soils. Analytica Chimica Acta 224249: 1–16. Bouse R.M., M.D. Hornberger, S.N. Luoma. 1996. Sr and Nd compositions and trace element concentrations in San Francisco Bay cores to distinguish sediment deposited from hydraulic gold mining and mercury mining (abstract). EOS, Tran Am Geophys Union 77: 201. California Regional Water Quality Control Board (CRWQCB) San Francisco Bay Region. 2000. Watershed management of mercury in the San Francisco Bay Estuary: Draft total maximum daily load. Report to U.S. EPA, May 9. Clark, W.B. 1998. Gold districts of California. Bulletin No. 193. California Division of Mines and Geology, Sacramento, California.199 pp.
43 Mercury Assessment of the Merced River Ranch

References
Cooke, J., C. Foe, S. Stanish, and P. Morris. 2004. Cache Creek, Bear Creek, and Harley Gulch TMDL for Mercury. Staff Report. California Environmental Protection Agency, Regional Water Quality Control Board Central Valley Region. Feburary 2004, 123 p. (http://www.swrcb.ca.gov/rwqcb5/programs/tmdl/cache_creek/CacheTMDLFeb04.pdf) Cooper, A. C. 1965. The effect of transported stream sediments on the survival of sockeye and pink salmon eggs and alevin. Bulletin 18. International Pacific Salmon Fisheries Commission, New Westminster, British Columbia, Canada. Davis, A., N.S. Bloom, and S.S. Que Hee. 1997. The environmental geochemistry and bioaccessibility of mercury in soils and sediments: a review. Risk Analysis 17(5): 557–569. Davis, F.F. and D.W. Carlson. 1952. Merced County, Gold. California Journal of Mines and Geology 48: 220–227. Domagalski, J. 1998. Occurrence and transport of total mercury and Methylmercury in the Sacramento River Basin, California. Journal of Geochemical Exploration 64: 277–291. Domagalski, J. 2001. Mercury and methylmercury in water and sediment of the Sacramento River Basin, California. Applied Geochemistry 16: 1677–1691. Delta Tributaries Mercury Council and Sacramento River Watershed Program (DTMC and SWRP). 2002. Mercury Conceptual Model Report: Mercury Quantities, Fate, Transport, and Uptake in the Sacramento River Watershed. Appendix 1 for the Strategic Plan for the Reduction of Mercury‐Related Risk in the Sacramento River Watershed. December 2002. Emsley, J. 1998. The Elements. 3rd Ed. Oxford University Press, Oxford, 251 pp. Foe, C. 2002. Mercury mass balance for the freshwater Sacramento‐San Joaquin Bay‐Delta Estuary. Final Report to the California Bay Delta Authority. 35 pp. (http://loer.tamug.tamu.edu/calfed/DraftReports.htm)
44 Mercury Assessment of the Merced River Ranch

References
Gilmour C.C., G.S. Riedel, M.C. Ederington, J.T. Bell, J.M. Benoit, G.A. Gill, and M.C. Stordal. 1998. Methylmercury concentrations and production rates across a trophic gradient in the northern Everglades. Biogeochemistry 40:327–345. Harrison, C. W. 1923. Planting eyed salmon and trout eggs. Transactions of the American Fisheries Society 52: 191–200. Heim, W.A., K. Coale, and M. Stephenson. 2003. Methyl and total mercury spatial and temporal trends in surficial sediment of the San Francisco Bay‐Delta. Final Report to the California Bay Delta Authority. 57 pp. (http://loer.tamug.tamu.edu/calfed/FinalReports.htm) Hobbs, D.F. 1937. Natural reproduction of quinnat salmon, brown trout and rainbow trout in certain New Zealand waters. Fisheries Bulletin 6. New Zealand Marine Department. Hornberger, M.I., S.N. Luoma, A. van Geen, C. Fuller, and R.Anima. 1999. Historical trends of metals in the sediments of San Francisco Bay, California. Marine Chemistry 64: 39–55. Horne, A. J. and C. R. Goldman. 1994. Limnology. New York, McGraw‐Hill, Inc. Horvat, M., L. Liang, and N.S. Bloom. 1993a. Comparison of distillation with other current isolation methods for the determination of Methylmercury compounds in low level environmental samples. Part I Sediments. Anal. Chim Acta 281:153 Hunerlach, M.P., J.J. Rytuba, and C.N. Alpers. 1999. Mercury contamination from hydraulic placer‐gold mining in the Dutch Flat mining district, California: U.S. Geological Survey Water‐Resources Investigations Report 99‐4018B, p.179–189. Kelly, C.A., J.W.M. Rudd, V.L. St. Louis, and A. Heyes. 1995. Is total mercury concentration a good predictor of Methylmercury concentration in aquatic systems? Water, Air, and Soil Pollution, 80: 715–724. Kondolf, G. M., and M. G. Wolman. 1993. The sizes of salmonid spawning gravels. Water Resources Research 29: 2275–2285.
45 Mercury Assessment of the Merced River Ranch

References
Ligon, F.K., W.E. Dietrich, and W.J. Trush. 1995. Downstream ecological effects of dams: a geomorphic perspective, Bioscience, Vol. 45, No. 3, p. 183–192. Long, E. R. and D. D. MacDonald. 1992. National Status and Trends Program Approach. In: Sediment Classification Methods Compendium. EPA 823‐R‐92‐006. EPA Office of Water (WH‐556). Washington, DC.: U.S. Environmental Protection Agency. McNeil, W. J. 1964. Effect of the spawning bed environment on reproduction of pink and chum salmon. U. S. Fish and Wildlife Service Fishery Bulletin Fishery Bulletin 65: 495–523. Moyle, P.B. 2002. Inland fishes of California (revised and expanded). University of California Press, Berkeley, Los Angeles, London. 502 pp. Platts, W. S., M. A. Shirazi, and D. H. Lewis. 1979. Sediment particle sizes used by salmon for spawning with methods for evaluation. Ecological Research Series EPA‐600/3‐79‐043. U. S. Environmental Protection Agency, Corvallis Environmental Research Laboratory, Corvallis, Oregon. PTI Environmental Services (PTI). 1988. Briefing report to the EPA Science Advisory Board: The Apparent Effects Threshold approach. Seattle: Environmental Protection Agency, Region 10, Office of Puget Sound. 57 pp. Puckett, H.M. and B.H. van Buuren. 2000. Quality Assurance Project Plan for the CALFED Project: An assessment of ecological and human health impacts of mercury in the Bay‐Delta watershed, available on the Internet at: http://loer.tamug.tamu.edu/calfed/QA.htm. Roth, D.A., H.E. Taylor, J. Domagalski, P. Dileanis, D.B. Peart, R.C. Antweiler, and C.N. Alpers. 2001. Distribution of inorganic mercury in Sacramento River water and suspended colloidal sediment material. Archives of Environmental Contamination and Toxicology 40: 161–172. San Francisco Estuary Institute (SFEI) 2001. Unpublished electronic data e‐mailed by SFEI (Ben Greenfield) to Central Valley Regional Water Quality Control Board (Michelle Wood, Environmental Specialist, Sacramento) on August 31, 2001. Scott, M.L., P.B. Shafroth, and G.T. Auble. 1999. Responses of riparian cottonwoods to alluvial water table declines. Environmental Management 23: 347–358.
46 Mercury Assessment of the Merced River Ranch

References
Slotton, D.G., S.M. Ayers, J.E. Reuter, and C.R. Goldman. 1995. Gold mining impacts on food chain mercury in northwestern Sierra Nevada streams. Technical Completion Report for the University of California Water Resources Center, Project W‐816, August 1995, 46 pp. Slotton, D.G., S.M. Ayers, J.E. Reuter, and C.R. Goldman. 1997. Sacramento River watershed mercury control planning project‐‐UC Davis biotic component. Final Report for the Sacramento Regional County Sanitation District, March 1997, 74 pp. Slotton, D.G., S.M. Ayers, T.H. Suchanek, R.D. Weyand, A.M. Liston, C. MacDonald, D.C. Nelson, and B. Johnson. 2002. The Effects of Wetland Restoration on the Production and Bioaccumulation of Methylmercury in the Sacramento‐San Joaquin Delta, California. CALFED Mercury Program Draft Final Project Reports, September 2002. (http://loer.tamug.tamu.edu/calfed/DraftReports.htm.) Slotton D.G., S.M. Ayers, T.H. Suchanek, R.D. Weyand, and A.M. Liston. 2004. Mercury bioaccumulation and trophic transfer in the Cache Creek watershed of California, in relation to diverse aqueous mercury exposure conditions. Final Report to CALFED Bay Delta Program Project, component 5B of Assessment of Ecological and Human Health Impacts of Mercury in the SF Bay‐Delta Watershed. Toxic Substances Monitoring Program 2 (TSM2) 2002. Preliminary electronic data for 1997–2000 copied from CCAMP files in April 2002, by Michelle Wood, Mercury TMDL Unit, California Regional Water Quality Control Board, Central Valley Region. E email contact: [email protected]. Stillwater Sciences. 2002. Merced River Corridor Restoration Plan. Stillwater Sciences, Berkeley, California. 245 p. Stillwater Sciences. 2004a. Merced River Ranch Mercury Assessment Study Plan. Stillwater Sciences, Berkeley, California. 24 p. Stillwater Sciences. 2004b. Sediment Transport Model of the Merced River DTR. Stillwater Sciences, Berkeley, California. 33 p. URS. 2004. Volume and Texture of the Merced River Dredger Tailings. Prepared for Stillwater Sciences, Berkeley, California. 27 p.
47 Mercury Assessment of the Merced River Ranch

References
USEPA (U.S. Environmental Protection Agency). 1996. CD‐ROM Compilation of Analytical Methods. USEPA. 1998. EPA Guidance for Quality Assurance Project Plans EPA QA/G‐5. Office of Research and Development, Washington, D.C. EPA/600/R‐98/018. February. USBR (U.S. Bureau of Reclamation). 2000. Draft Mainstem Trinity River Habitat and Floodplain Modifications Information Report. USDOI, Bureau of Reclamation. Northern California Area Office. Shasta Lake, CA. 28 pp. USFWS (U.S. Fish and Wildlife Service). 1994. Restoration of the Mainstem Trinity River Background Report. Trinity River Restoration Program. USFWS Trinity River Fishery Resource Office. Weaverville, CA. 15 pp. Vick, J. 1995. Habitat Rehabilitation in the Lower Merced River: A geomorphological perspective, Volume 1: text, figures, and tables. M.S. Thesis, UC Berkeley, June. Wiener, J.G., C.C. Gilmour, and D.P. Krabbenhoft. 2003. Mercury Strategy for the Bay‐Delta Ecosystem: A Unifying Framework for Science, Adaptive Management, and Ecological Restoration. Final Report to the California Bay Delta Authority, December 31, 2003, 67 p. (http://science.calwater.ca.gov/pdf/MercuryStrategyFinalReport.pdf) Winston, W.B. 1910. Merced County, dredging. California Mining Bureau, Bulletin 57, pp 211–213. Young, O.E. Jr. 1970. Western Mining. University of Oklahoma Press. Pp. 132–135. Zar, J.H. 1996. Biostatistical Analysis. Prentice‐Hall Inc., Upper Saddle River, NJ. 662 pp. + Appendices.
48 Mercury Assessment of the Merced River Ranch

Figures
8 FIGURES
49 Mercury Assessment of the Merced River Ranch
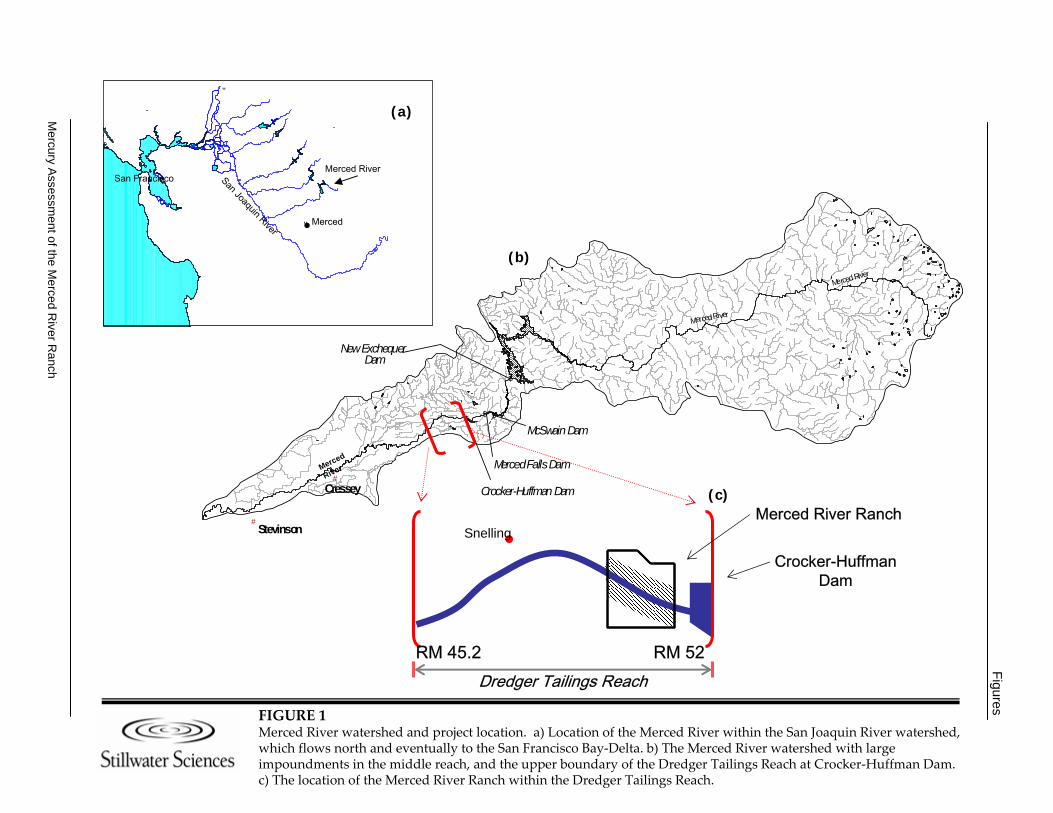
FIGURE 1Merced River watershed and project location. a) Location of the Merced River within the San Joaquin River watershed, which flows north and eventually to the San Francisco Bay‐Delta. b) The Merced River watershed with large impoundments in the middle reach, and the upper boundary of the Dredger Tailings Reach at Crocker‐Huffman Dam. c) The location of the Merced River Ranch within the Dredger Tailings Reach.
#
#
$
$$$
Cressey
Stevinson
MercedRiver
MercedRiver
NewExchequerDam
Crocker-Huffman Dam
McSwainDam
MercedFallsDam
Merced River Ranch
Crocker-HuffmanDam
"
"
Merced River
San Joaquin River
Merced
San Francisco
(b)
(a)
RM 52RM 45.2Dredger Tailings Reach
Merced
River
(c)
Snelling
Mercury A
ssessment of the M
erced River R
anch
Figures

Mercury Assessment of the Merced River Ranch
Figures
FIGURE 2Conceptual model of mercury sources and cycling in the San Francisco Bay‐Delta ecosystem, which is here defined as the combined watershed, Delta, and Bay (Weiner et al. 2003).

FIGURE 3Photographs of early‐ to mid‐1900s dredger operations in Northern California. Arrows indicate the large tailings piles created as matierial was discharged from the back of the dredgers. a) Carrville Gold Company Dredge, Trinity River District. Photo taken on the upper Trinity River in Trinity County in 1940. b) Natomas Company Dredge No. 8, Folsom District. Photo taken in 1953 in Sacramento County. Source: Clark (1998).
a)
b)
Mercury A
ssessment of the M
erced River R
anch
Figures

FIGURE 4 Current conditions of tailings piles at the Merced River Ranch. a) Picture showing river channel and sparse, weedy vegetation among the cobbles and boulders. Note people for scale. b) Schematic depicting narrow bands of non‐native vegetation on the river banks and linear patches of vegetation confined to swales within the dredger tailings.
100 ft or less
a)
b)
River channel
Swales/ponds containing vegetation
FLOW
Mercury A
ssessment of the M
erced River R
anch
Figures

FIGURE 5Sample sites along the Merced River. Red circles show the general location of water, sediment, and biota sampling sites.
RM 100 Above Lake McClure (Control)
$
$
RM 55 Merced Falls Dam (Near Control)
RM 50 MRRRM 41
Below Hwy59
RM 40 RatzlaffReach
Mercury A
ssessment of the M
erced River R
anch
Figures

FIGURE 6Sample sites at the Merced River Ranch. Sediment was sampled at dredger tailings sites. Sediment and and water quality were sampled at pond sites (no characteristic biota found). Sediment, water, and biota were sampled at river sites.
Mercury Assessment of the Merced River Ranch
Figures

FIGURE 7Dredger tailings excavation at the Merced River Ranch, February 23‐27, 2004 (URS 2004). a) Side view of dredger tailings excavation pit. b) Excavation pit and groundwater at site T1.
a) b)
Mercury A
ssessment of the M
erced River R
anch
Figures

FIGURE 8 Lumex sampling for mercury vapor (Hg0). a) Lumex sampling the bucket headspace of composite samples, February 28, 2004. b)Lumex sucker head at site T7, November 1, 2003.
b)
a)
Mercury Assessment of the Merced River Ranch
Figures

FIGURE 9Settleable solids collection at the Merced River Ranch. Nicolas Bloom, Frontier Geosciences Inc., holding settleable solids sample with the Merced River in the background (RM 55), November 1, 2003.
Mercury Assessment of the Merced River Ranch
Figures

FIGURE 10 Schematic of dredger tailings processing experiment. Dredger tailings material was shipped to Frontier Geosciences (Seattle, WA) where the processing and leach experiment was carried out.
10 kg Sample, air dried and
split
2-Step Sequential Stage Extraction (18 hr Leach)Step 1. 0.01N HCl + 0.1NCH3COOH
Step 2. BrCl
Dry Sort and Wash(5 kg)
Washed in 5 L syntheticriver water
16‐150 mm 2‐16 mm <2 mm16‐150 mm 2‐16 mm <2 mm
Dry Sort Only(5 kg)
Mercury Assessment of the Merced River Ranch
Figures

FIGURE 11Backpack electroshocking at the Merced River Ranch site (RM 50), October 28‐29, 2003.
Mercury Assessment of the Merced River Ranch
Figures

FIGURE 12Total mercury in dredger tailings fine material. All points shown on the graph (n=31) were collected above groundwater elevation at the Merced River Ranch. Sampling elevations are based on GPS data. Mean groundwater elevation was 280±5 ft.
270
275
280
285
290
295
300
305
310
3150 20 40 60 80 100
THg in Sediments Less than 2 mm (ng/g) S
ampl
ing
Ele
vatio
n (ft
, NG
VD
)
Natural background levels for uncontaminated soils in the Central
Valley, California (Bouse et al.1996)MRR Site Average:22 ng/g ± 16 (SD)
Mercury A
ssessment of the M
erced River R
anch
Figures

FIGURE 13Mercury leached from dredge stacker tailings as a function of size fraction. Mean ±1SD of summed (BrCl+pH2) leachable mercury for dry‐sorted dredger material indicates a strong pattern (p<0.0001) of mercury associated with fine sediments (n=3, Est. MDL=0.03 ng/g). Significance levels are for log‐transformed data.
0
2
4
6
8
10
12
14
16
18
< 2mm 2-13 mm 13-150 mm
THg
Leac
hed
(ng/
g)
Mercury A
ssessment of the M
erced River R
anch
Figures

FIGURE 14Mercury leached from washed vs. dry sorted dredger tailings. Mean ±1SD for summed (BrCl+pH2) leachable mercury from the two largest size fractions indicated that washing did have a significant effect (p<0.05) on removing leachablemercury from the 2‐13 mm size fraction. The effect was not significant (p=0.8) for the 13‐150 mm size fraction (n=3, Est. MDL=0.03 ng/g). Significance levels are for log‐transformed concentration data.
0.0
0.5
1.0
1.5
2.0
2.5
3.0
3.5
4.0
4.5
5.0
2-13 mm 13-150 mm
Dry sorted prior to leachWashed prior to leach
THg
Leac
hed
(ng/
g)
Mercury A
ssessment of the M
erced River R
anch
Figures

0
20
40
60
80
100
120
140
160
RM 100aboveLake
McClure(Control)
RM 55AboveMerced
Falls Dam(Near
Control)
RM 50MRR
Pond 1 Pond 2 Pond 3 RM 41BelowHwy59
RM 40RatzlaffReach
THg
(ng/
g)
FIGURE 15Mercury in fine sediments at sites along the Merced River. a) Total mercury (THg) and b) methylmercury (MeHg). Note the different scales on each graph.
0.0
0.5
1.0
1.5
2.0
2.5
3.0
3.5
4.0
RM 100aboveLake
McClure(Control)
RM 55AboveMerced
Falls Dam(Near
Control)
RM 50MRR
Pond 1 Pond 2 Pond 3 RM 41BelowHwy59
RM 40RatzlaffReach
MeH
g (n
g/g)
THg Estimated MDL=0.03 ng/L
n=1 for each
a)
No sample
Fine sediment
No samples collected
Settleable solids collected
b) MeHg Estimated MDL=0.01 ng/L
n=1 for each
Wetland sites at MRRUpstream river sitesDownstream
river sites
Mercury Assessment of the Merced River Ranch
Figures

FIGURE 16 Total organic carbon (TOC) and dissolved organic carbon (DOC) in the water at Merced River sites. MDL=0.2 mg/l, n=1 for each.
012345678
RM 100AboveLake
McClure(Control)
RM 55AboveMerced
Falls Dam(Near
Control)
RM 50MRR
Pond 1 Pond 2 Pond 3 RM 41Robinson
RM 40Ratzlaff
mg
C/L
TOCDOC
Mercury A
ssessment of the M
erced River R
anch
Figures

0
20
40
60
80
100
120
140
160
180
RM 100AboveLake
McClure(Control)
RM 55AboveMerced
Falls Dam(Near
Control)
RM 50MRR
Pond 1 Pond 2 Pond 3 RM 41BelowHwy59
RM 40RatzlaffReach
THg
(ng/
l)
FIGURE 17Aqueous total mercury at sites along the Merced River. Note the different scales on each graph. Estimated MDL = 0.02 ng/L, n=1 for each.
0.0
0.2
0.4
0.6
0.8
1.0
1.2
1.4
RM 100AboveLake
McClure(Control)
RM 55AboveMerced
Falls Dam(Near
Control)
RM 50MRR
Pond 1 Pond 2 Pond 3 RM 41BelowHwy59
RM 40RatzlaffReach
THg
(ng/
l)
b) Aqueous Raw THg
a) Aqueous Filtered THg
Upstream river sites Wetland sites at MRRDownstream
river sites
Mercury Assessment of the Merced River Ranch
Figures

0.0
0.5
1.0
1.5
2.0
2.5
3.0
3.5
RM 100AboveLake
McClure(Control)
RM 55AboveMerced
Falls Dam(Near
Control)
RM 50MRR
Pond 1 Pond 2 Pond 3 RM 41BelowHwy59
RM 40RatzlaffReach
MeH
g (n
g/l)
FIGURE 18Aqueous methylmercury at sites along the Merced River. Note the different scales on each graph. Estimated MDL = 0.03 ng/L, n=1 for each
0.00
0.02
0.04
0.06
0.08
0.10
0.12
0.14
RM 100AboveLake
McClure(Control)
RM 55AboveMerced
Falls Dam(Near
Control)
RM 50MRR
Pond 1 Pond 2 Pond 3 RM 41BelowHwy59
RM 40RatzlaffReach
MeH
g (n
g/l)
Estimated MDL
Upstream river sites Wetland sites at MRRDownstream
river sites
a) Aqueous Filtered MeHg
Mercury Assessment of the Merced River Ranch
Figures
b) Aqueous Raw MeHg

FIGURE 19Power regression of aqueous total mercury and methylmercury by total suspended solids (TSS) in Merced River water. Filled symbols are Merced River channel sites and hollow symbols are from a backwater area at the Below Hwy59 site (noted with an B) and the Merced River Ranch ponds.
y = 0.8141x0.3338
R2 = 0.8974
y = 0.0189x0.5132
R2 = 0.657
0.001
0.010
0.100
1.000
10.000
100.000
1000.000
0 1 10 100 1000TSS (mg/l)
Aqu
eous
Hg
(ng/
l)
Raw Tot HgRaw MeHg
B
B
Mercury A
ssessment of the M
erced River R
anch
Figures

FIGURE 20Mercury content of Hydropsychid caddisfly from Merced River sites. Mean MeHg and THg in replicate, multi‐individual composites is shown with 95% confidence intervals (RM = river mile).
Mercury A
ssessment of the M
erced River R
anch
Figures
Below Hwy59(RM 41)
RatzlaffReach
(RM 40)

FIGURE 21Comparative Hydropsychid caddisfly mercury content from other regional rivers. Mean THg and, as available, MeHg were collected as multi‐individual composite samples.
Mercury A
ssessment of the M
erced River R
anch
Figures

FIGURE 22Linear regression of aqueous mercury fractions vs. methylmercury in Hydropsychid caddisfly larvae at Merced River sites. The red triangle represents the Below Hwy59 site (RM 41), and since it is an outlier in 3 of the 4 cases shown it is not included in any of the regressions.
y = 325.3x + 5.1R2 = 0.52
0
5
10
15
20
25
30
0 0.1 0.2 0.3 0.4 0.5Aqueous Raw MeHg (ng/l)
Hyd
rops
yche
MeH
g (n
g/g
dw)_
y = 33.0x - 7.9R2 = 0.91
0
5
10
15
20
25
30
0.0 0.2 0.4 0.6 0.8 1.0Aqueous Filt. THg (ng/l)
Hyd
rops
yche
MeH
g (n
g/g
dw)_
y = 15.8x - 1.2R2= 0.59
0
5
10
15
20
25
30
0.0 2.0 4.0 6.0 8.0Aqueous Raw THg (ng/L)
Hyd
rops
yche
MeH
g (n
g/g
dw)_
y = 270.1x + 9.4R2 = 0.31
0
5
10
15
20
25
30
-0.05 0.00 0.05 0.10 0.15Aqueous Filt. MeHg (ng/l)
Hyd
rops
yche
MeH
g (n
g/g
dw)_
Mercury A
ssessment of the M
erced River R
anch
Figures

FIGURE 23a‐eSize vs. mercury relationship for prickly sculpin (Cottus asper) at Merced River sites. Individual sculpin from each site are plotted as total length vs. whole body MeHg.
Mercury Assessment of the Merced River Ranch
Figures

FIGURE 24Mercury content of prickly sculpin (Cottus asper) from Merced River sites. Mean MeHg and THg in replicate, individually analyzed fish is shown with 95% confidence intervals. (RM = river mile)
Mercury A
ssessment of the M
erced River R
anch
Figures
Below Hwy59(RM 41)
RatzlaffReach
(RM 40)

FIGURE 25Linear regression of aqueous mercury fractions vs. methylmercury in prickly sculpin (Cottus asper) at Merced River sites. The red triangle represents the Below Hwy59 site (RM 41), and since it is an outlier in 3 of the 4 cases shown it is not included in any of the regressions.
y = 1610x + 33.3R2 = 0.57
0
20
40
60
80
100
120
-0.05 0 0.05 0.1 0.15Aqueous Filt. MeHg (ng/l)
Scu
lpin
MeH
g (n
g/g
dw)
y = 1510x + 18.9R2 = 0.58
0
20
40
60
80
100
120
0 0.1 0.2 0.3 0.4 0.5Aqueous Raw MeHg (ng/l)
Scul
pin
MeH
g (n
g/g
dw)
y = 82.1x - 19.0R2 = 0.78
0
20
40
60
80
100
120
0.0 2.0 4.0 6.0 8.0Aqueous Raw THg (ng/g)
Scu
lpin
MeH
g (n
g/g
dw)
y = 157.5x - 46.6R2 = 0.99
0
20
40
60
80
100
120
0.0 0.2 0.4 0.6 0.8 1.0Aqueous Filt. THg (ng/l)
Scu
lpin
MeH
g (n
g/g
dw)
Mercury A
ssessment of the M
erced River R
anch
Figures

FIGURE 26Effects of processing on mercury released from Merced River Ranch dredger tailings. Results are expressed as mg per ton of dredger tailings. (a) THg liberated from dredger tailings washed with synthetic river water, without any processing (Estimated Bulk) or processed by dry sorting (remaining size fractions). (b) A comparison of washed vs. unwashed for the maximum theoretical mercury that could be leached from the dredger tailings over a long period of time. Mercury in bulk dredger tailings was estimated by weighting mercury measured in individual size fractions of known mass distribution (URS 2004).
Unprocessed tailings
0
2
4
6
8
10
12
14
16
Estimated Bulk 13-150 mm 2-13 mm <2 mm
Dry sortedWashed and dry sorted
Max
imum
The
orec
tical
Rel
ease
of
THg
into
Riv
er W
ater
(mg/
ton) b)
0.0000.0050.0100.0150.0200.0250.0300.0350.0400.0450.050
EstimatedBulk
13-150 mm 2-13 mm <2 mm
Dry sortedLi
kely
Nea
r-te
rm R
elea
se o
f TH
g in
to R
iver
Wat
er (m
g/to
n) a)
Mercury Assessment of the Merced River Ranch
Figures

Appendix A
A p p e n d i x A LABORATORY QA/QC SUMMARY FOR U.C. DAVIS MERCURY ANALYSES
A‐1 Mercury Assessment of the Merced River Ranch

Appendix A
Table A-1. Laboratory QA/QC Summary for U.C. Davis Total Mercury Analyses Used in This Report.
a) Laboratory Method QA/QC Results
Std Curve R2
Blanks re µg/g
Lab Split RPD
Spike Recoveries
Lab Control Std. Recoveries
Cont. Calib. Validation
Ideal Recovery 1.000 0.0000 (0%) (100%) (100%) (100%)
Control Range ≥0.975 -0.0200–0.0200 ≤25% 75–125% 75–125% 75–125%
Tracking Method Control Chart Control Chart Control Chart Control Chart Control Chart Control Chart
Recoveries 0.9988–0.9997 (8 aq Hg stds/run) -0.0033–0.0033 0.2–5.7% 90.6–98.9% 97.6–102.4% 92.1–101.4%
(n) n=6 n=21 n=7 n=14 n=14 n=20
Mean Recoveries 0.9993 0.0004 3.2% 95.4% 100.1% 98.6%
Note: Method Detection Limit (MDL) = 0.005 µg THg/g (ppm)
b) Standard Reference Material QA/QC Results
Standard Reference Materials
NIST 2976
Mussel TORT-2 Lobster
DOLT-3 Dogfish liver
DORM-2 Dogfish muscle
Certified Level (ppm THg) 0.061±0.004 0.27±0.02 3.37±0.14 4.64±0.26 Ideal Recovery (100%) (100%) (100%) (100%)
Control Range (%) 75–125% 75–125% 75–125% 75–125% Tracking Method Control Chart Control Chart Control Chart Control Chart
Control Range (ppm) 0.046–0.076 0.20–0.34 1.61–2.68 3.48–5.80
Recoveries (%) 99.8–115.2% 102.9–107.5% 97.6–98.7% 91.9–95.3% Recoveries (ppm) 0.061–0.070 0.278–0.290 3.29–3.33 4.27–4.42
(n) n=7 n=13 n=2 n=10
Mean Recoveries (%) 105.1% 105.4% 98.2% 93.5% Mean Recoveries (ppm) 0.064 0.285 3.309 4.341
A‐3 Mercury Assessment of the Merced River Ranch

Appendix A
Table A-2. Laboratory QA/QC Summary for U.C. Davis Methyl Mercury Analyses Used in This Report.
a) Laboratory Method QA/QC Results
Std Curve R2
Blanks re µg/g
Lab Split RPD
Spike Recoveries
Lab Control Std. Recoveries
Cont. Calib. Validation
Ideal Recovery 1.000 0% (0%) (100%) (100%) (100%)
Control Range ≥0.975 -0.02–0.02 ≤25% 75–125% 75–125% 75–125%
Tracking Method Control Chart Control Chart Control Chart Control Chart Control Chart Control Chart
Recoveries 0.9988–0.9997 (8 aq Hg stds/run) -0.0071–0.0038 0.4–5.1% 99.1–110.4% 97.6–102.4% 98.8–103.5%
(n) n=6 n=21 n=7 n=14 n=14 n=20
Mean Recoveries 0.9993 -0.0014 2.8 105.3% 100.1% 100.5%
Note: Method Detection Limit (MDL) = 0.005 µg THg/g (ppm)
b) Standard Reference Material QA/QC Results
Standard Reference Materials
NIST 2976
Mussel TORT-2 Lobster
DOLT-3 Dogfish liver
DORM-2 Dogfish muscle
Certified Level (ppm THg) 0.0278±0.0011 0.152±0.013 1.590 4.47±0.32 Ideal Recovery (100%) (100%) (100% (100%)
Control Range (%) 75–125% 75–125% 75–125% 75–125% Tracking Method Control Chart Control Chart Control Chart Control Chart
Control Range (ppm) 0.0208–0.0348 0.114–0.190 1.193–1.988 3.35–5.59
Recoveries (%) 71.4–107.8% 95.3–107.4% 92.1–92.5% 82.5–93.1% Recoveries (ppm) 0.020–0.030 0.145–0.163 1.47–1.47 3.69–4.16
(n) n=7 n=13 n=2 n=10
Mean Recoveries (%) 88.8% 99.5% 92.3% 87.2% Mean Recoveries (ppm) 0.025 0.151 1.47 3.90
A‐5 Mercury Assessment of the Merced River Ranch

Appendix B
A p p e n d i x B BIOTA SAMPLE LABORATORY RESULTS
B‐1 Mercury Assessment of the Merced River Ranch

Appendix B
Table B-1. Biota Data from Above Lake McClure Site (RM 100) (Control).
a) Total and Methylmercury in Multi-individual Composites of Macroinvertebrates
Type N Weight Per
Ind. in Comp. (mg)
Comp. TL Median (mm)
% Solids
METHYL Hg in WET Sample
(ng/g)
TOTAL in WET Sample Hg (ng/g)
% Methyl Hg of
Total Hg
Hydropsyche Comp. 63 13 10 19% 8 13 57%
Pteronarcyidae Comp. 7 1098 38 22% 6 8 80%
Corydalidae Comp. 3 471 40 22% 22 28 79%
Perlidae Comp. A 23 137 22 25% 19 20 93%
Perlidae Comp. B 23 134 22 26% 23 24 98%
Perlidae Comp. C 23 139 22 25% 19 20 95%
Perlidae Comp. D 23 131 22 24% 22 24 95%
Means: 21 22 95%
95% Conf. Intervals: ± 3 ± 3 ± 3%
b) Total and Methylmercury in Whole Fish
Type N Ind. Fish Weight
(g)
Total Length (mm)
% Solids
METHYL Hg in WET Sample
(ng/g)
TOTAL in WET Sample Hg (ng/g)
% Methyl Hg of
Total Hg
Sculpin (fish # 1) 1 2.2 58 23% 20 27 76%
Sculpin (fish # 2) 1 2.9 62 21% 13 18 73%
Sculpin (fish # 3) 1 5.8 77 23% 17 20 83%
Sculpin (fish # 4) 1 5.9 75 24% 16 20 78%
Sculpin (fish # 5) 1 7.3 78 24% 15 18 82%
Sculpin (fish # 6) 1 7.1 79 22% 13 16 83%
Sculpin (fish # 7) 1 8.2 80 20% 13 16 83%
Sculpin (fish # 8) 1 8.6 82 25% 27 32 86%
Sculpin (fish # 9) 1 11.4 92 24% 29 35 82%
Sculpin (fish # 10) 1 12.6 92 25% 32 37 87%
Sculpin (fish # 11) 1 13.6 98 24% 35 38 92%
Sculpin (fish # 12) 1 16.5 107 24% 56 61 91%
Means: 24 28 83%
95% Conf. Intervals: ± 8 ± 9 ± 3%
B‐3 Mercury Assessment of the Merced River Ranch

Appendix B
Table B-2. Biota Data from Below Merced Falls Dam Site (RM 55) (Near Control).
a) Total and Methylmercury in Multi-individual Composites of Macroinvertebrates
Type N Weight Per
Ind. in Comp. (mg)
Comp. TL Median (mm)
% Solids
METHYL Hg in WET Sample
(ng/g)
TOTAL in WET Sample Hg (ng/g)
% Methyl Hg of
Total Hg
Hydropsyche Comp. A 40 36 12 30% 25 29 86%
Hydropsyche Comp. B 40 34 12 28% 22 26 87%
Hydropsyche Comp. C 40 32 12 28% 25 28 88%
Hydropsyche Comp. D 40 34 12 29% 23 28 84%
Means: 24 28 86%
95% Conf. Intervals: ± 2 ± 2 ± 3%
b) Total and Methylmercury in Whole Fish
Type N Ind. Fish Weight
(g)
Total Length (mm)
% Solids
METHYL Hg in WET Sample
(ng/g)
TOTAL in WET Sample Hg (ng/g)
% Methyl Hg of
Total Hg
Sculpin (fish # 1) 1 5.6 79 22% 89 98 91%
Sculpin (fish # 2) 1 6.7 79 24% 135 156 87%
Sculpin (fish # 3) 1 6.9 79 25% 66 74 88%
Sculpin (fish # 4) 1 7.4 85 23% 108 122 88%
Sculpin (fish # 5) 1 7.6 83 25% 140 157 89%
Sculpin (fish # 6) 1 7.7 84 24% 80 86 93%
Sculpin (fish # 7) 1 7.9 85 19% 195 211 92%
Sculpin (fish # 8) 1 8.7 80 23% 48 56 86%
Sculpin (fish # 9) 1 8.3 80 24% 51 56 90%
Sculpin (fish # 10) 1 9.4 85 23% 74 78 94%
Sculpin (fish # 11) 1 9.7 89 22% 155 177 87%
Sculpin (fish # 12) 1 9.9 86 24% 87 100 87%
Sculpin (fish # 13) 1 10.7 88 25% 91 101 91%
Sculpin (fish # 14) 1 10.7 87 23% 97 106 92%
Sculpin (fish # 15) 1 12.1 98 22% 83 94 89%
Means: 100 111 90%
95% Conf. Intervals: ± 22 ± 25 ± 1%
B‐4 Mercury Assessment of the Merced River Ranch

Appendix B
Table B-3. Biota Data from MRR Site (RM 50).
a) Total and Methylmercury in Multi-individual Composites of Macroinvertebrates
Type N Weight Per
Ind. In Comp. (mg)
Comp. TL Median (mm)
% Solids
METHYL Hg in WET Sample
(ng/g)
TOTAL in WET Sample Hg (ng/g)
% Methyl Hg of
Total Hg
Hydropsyche Comp. A 40 26 13 23% 12 17 72%
Hydropsyche Comp. B 40 28 13 23% 13 17 74%
Hydropsyche Comp. C 40 28 13 23% 12 17 68%
Hydropsyche Comp. D 40 25 13 23% 11 16 72%
Means: 12 17 71%
95% Conf. Intervals: ± 1 ± 1 ± 4%
b) Total and Methylmercury in Whole Fish
Type N Ind. Fish Weight
(g)
Total Length (mm)
% Solids
METHYL Hg in WET Sample
(ng/g)
TOTAL in WET Sample Hg (ng/g)
% Methyl Hg of
Total Hg
Sculpin (fish # 1) 1 5.7 75 24% 51 59 86%
Sculpin (fish # 2) 1 6.3 75 22% 27 37 72%
Sculpin (fish # 3) 1 8.1 80 21% 77 88 87%
Sculpin (fish # 4) 1 7.2 84 22% 108 129 84%
Sculpin (fish # 5) 1 8.9 85 23% 22 26 84%
Sculpin (fish # 6) 1 9.0 85 25% 91 110 83%
Sculpin (fish # 7) 1 8.3 84 25% 98 115 85%
Sculpin (fish # 8) 1 9.4 86 23% 21 26 82%
Sculpin (fish # 9) 1 9.2 84 25% 19 22 87%
Sculpin (fish # 10) 1 11.7 89 26% 24 29 81%
Sculpin (fish # 11) 1 10.3 88 24% 62 74 83%
Sculpin (fish # 12) 1 12.8 92 24% 36 43 83%
Sculpin (fish # 13) 1 14.4 91 28% 34 40 84%
Sculpin (fish # 14) 1 13.7 92 23% 18 24 76%
Sculpin (fish # 15) 1 15.6 98 24% 104 129 80%
Means: 53 64 83%
95% Conf. Intervals: ± 19 ± 22 ± 2%
B‐5 Mercury Assessment of the Merced River Ranch

Appendix B
Table B-4. Biota Data from Below Hwy59 Site (RM 41).
a)Total and Methylmercury in Multi-individual Composites of Macroinvertebrates
Type N Weight Per
Ind. In Comp. (mg)
Comp. TL Median (mm)
% Solids
METHYL Hg in WET Sample
(ng/g)
TOTAL in WET Sample Hg (ng/g)
% Methyl Hg of
Total Hg
Hydropsyche Comp. A 37 24 12 22% 13 17 75%
Hydropsyche Comp. B 37 22 12 22% 13 16 78%
Hydropsyche Comp. C 37 22 12 21% 13 16 77%
Hydropsyche Comp. D 37 24 12 23% 13 18 70%
Means: 13 17 75%
95% Conf. Intervals: ± 0 ± 1 ± 6%
b) Total and Methylmercury in Whole Fish
Type N Ind. Fish Weight
(g)
Total Length (mm)
% Solids
METHYL Hg in WET Sample
(ng/g)
TOTAL in WET Sample Hg (ng/g)
% Methyl Hg of
Total Hg
Sculpin (fish # 1) 1 3.8 64 24% 31 38 83%
Sculpin (fish # 2) 1 3.7 64 23% 31 36 87%
Sculpin (fish # 3) 1 4.1 65 23% 30 36 83%
Sculpin (fish # 4) 1 5.0 73 23% 39 43 90%
Sculpin (fish # 5) 1 4.9 70 22% 30 35 87%
Sculpin (fish # 6) 1 5.9 74 24% 41 45 91%
Sculpin (fish # 7) 1 5.3 70 25% 26 30 85%
Sculpin (fish # 8) 1 5.8 72 24% 30 35 86%
Sculpin (fish # 9) 1 5.0 71 22% 46 55 85%
Sculpin (fish # 10) 1 5.8 75 23% 66 75 88%
Sculpin (fish # 11) 1 10.2 88 23% 173 194 89%
Sculpin (fish # 12) 1 11.9 91 23% 76 88 86%
Sculpin (fish # 13) 1 11.5 92 22% 92 87 105%
Sculpin (fish # 14) 1 15.1 94 25% 75 84 89%
Sculpin (fish # 15) 1 16.1 102 23% 153 165 93%
Means: 63 70 88%
95% Conf. Intervals: ± 25 ± 27 ± 3%
B‐6 Mercury Assessment of the Merced River Ranch

Appendix B
Table B-5. Biota Data from Ratzlaff Reach Site (RM 40).
a) Total and Methylmercury in Multi-individual Composites of Macroinvertebrates
Type N Weight Per
Ind. in Comp. (mg)
Comp. TL Median (mm)
% Solids
METHYL Hg in WET Sample
(ng/g)
TOTAL in WET Sample Hg (ng/g)
% Methyl Hg of
Total Hg
Hydropsyche Comp. A 40 25 12 24% 10 14 71%
Hydropsyche Comp. B 40 24 12 23% 11 14 82%
Hydropsyche Comp. C 40 23 12 22% 11 14 76%
Hydropsyche Comp. D 40 25 12 23% 11 13 83%
Means: 11 14 78%
95% Conf. Intervals: ± 1 ± 1 ± 9%
b) Total and Methylmercury in Whole Fish
Type N Ind. Fish Weight
(g)
Total Length (mm)
% Solids
METHYL Hg in WET Sample
(ng/g)
TOTAL in WET Sample Hg (ng/g)
% Methyl Hg of
Total Hg
Sculpin (fish # 1) 1 4.2 68 21% 57 64 89%
Sculpin (fish # 2) 1 4.3 66 22% 62 66 93%
Sculpin (fish # 3) 1 6.9 73 22% 59 65 90%
Sculpin (fish # 4) 1 8.3 82 22% 48 53 91%
Sculpin (fish # 5) 1 8.5 82 23% 36 43 85%
Sculpin (fish # 6) 1 8.8 81 22% 26 30 85%
Sculpin (fish # 7) 1 8.3 85 22% 44 49 90%
Sculpin (fish # 8) 1 9.9 84 24% 71 77 92%
Sculpin (fish # 9) 1 10.3 83 23% 58 63 92%
Sculpin (fish # 10) 1 11.6 92 23% 140 150 93%
Sculpin (fish # 11) 1 9.6 86 24% 31 35 88%
Sculpin (fish # 12) 1 13.3 94 22% 92 102 90%
Sculpin (fish # 13) 1 18.4 96 25% 41 45 90%
Sculpin (fish # 14) 1 21.8 106 24% 55 67 82%
Means: 58 65 89%
95% Conf. Intervals: ± 16 ± 17 ± 2%
B‐7 Mercury Assessment of the Merced River Ranch