Embed Size (px)
Citation preview

C1
W S D O T | W A S H I N G T O N T R A N S P O R T A T I O N P L A N , P H A S E 2 – I M P L E M E N T A T I O N | 2 0 1 7 - 2 0 4 0
PUBLIC REVIEW DRAFT - SEPTEMBER 2017 - APPENDIX C
Appendix CTECHNICAL MEMORANDUM #3
CURRENT AND FUTURE CONDITIONS OF THE STATEWIDE TRANSPORTATION SYSTEM
Purpose ............................................................................................................................................................................................... C2Data Description .............................................................................................................................................................................. C2Describe The System: Modes ...................................................................................................................................................... C2Population Demands ....................................................................................................................................................................C61Employment And Economic Condition Demands ............................................................................................................C62Freight Demands ............................................................................................................................................................................C68

C2
W S D O T | W A S H I N G T O N T R A N S P O R T A T I O N P L A N , P H A S E 2 – I M P L E M E N T A T I O N | 2 0 1 7 - 2 0 4 0
PUBLIC REVIEW DRAFT - SEPTEMBER 2017 - APPENDIX C
PURPOSE This memo documents the data that the Project Team used to develop the WTP Phase 2- Implementation plan (Phase 2). This memo includes information on the current and future condition of the following:
• Modal systems: Active Transportation (Bicycle Facilities and Pedestrian Walkways), Aviation, Marine (Ferries and Container/Barge), Pipelines, Rail (Freight and Passenger), and Roadways and Bridges
• Demand
• Demographics
DATA DESCRIPTIONFor the purposes of this memo, the term “data” includes quantitative information such as actual and estimated passenger and vehicle counts, actual and projected revenue, and current and projected populations, etc. The data has different base years and horizon dates because there is no statewide common metric or database for transportation data. Each agency collects different data at various points in time, for assorted purposes, at different scales, using diverse measures. The Phase 2 Project Team (Project Team) uses data to broadly illustrate and compare the needs and conditions of each mode of the statewide transportation system. As per 23 CFR 450.214, Phase 2 must include a 20-year forecast period at its time of adoption. Since Washington does not have a statewide travel demand model and Phase 2 does not include a project list, the only available 20-year statewide data common to all modes is projected population and state revenue.
DESCRIBE THE SYSTEM: MODESActive Transportation What is the active transportation?Active transportation is any human-powered mode of transportation such as walking and bicycling. Although active transportation is not included in the definition of public transportation, WSDOT addresses these modes in the Washington State Public Transportation Plan. This is consistent with the U.S. Department of Transportation claim that improving public transportation can improve active transportation opportunities. This is because most people that use public transportation walk to or from stops/stations. Source: https://www.transportation.gov/mission/health/active-transportation.
Where are active transportation facilities and services located?• Urban Areas: Streets, sidewalks, and bike paths
• Rural Areas:
º On and adjacent to county roads
º On any Interstates, State Routes, and US Highways except in these locations:

C3
W S D O T | W A S H I N G T O N T R A N S P O R T A T I O N P L A N , P H A S E 2 – I M P L E M E N T A T I O N | 2 0 1 7 - 2 0 4 0
PUBLIC REVIEW DRAFT - SEPTEMBER 2017 - APPENDIX C
– I-205: Glen Jackson Bridge to Exit 36
– I-5: Columbia River Bridge to Exit 7 (Junction I-5 and I-205)
– I-5: Exit 101 (Tumwater Blvd.) to Exit 109
– I-5: Exit 124 to Exit 199
– I-5: Exit 252 to Exit 257
– I-90: From I-5 to I-405
– 1-90: Exit 276 to Exit 286
– I-705: Entire length
• Public Recreational Lands: trails, trailheads, boat launches
What is the current condition of active transportation facilities and services?Individual agencies have different levels of information using various measures and there is no comprehensive inventory of all of the active transportation facilities and services in the state.
What is the demand for active transportation?There is no common metric for measuring or forecasting demand. Each agency determined demand differently. The most common method to determine demand is to use population forecasts as a proxy.
What is the current use and forecasted statewide demand for active transportation? WSDOT sponsors annual counts of pedestrians and bicyclists for one day each fall during the morning peak (7-9 a.m.) and afternoon peak (4-6 p.m.).
Quick Stats 1 2008 2009 2010 2011 2012 2013 2014 2015
Cities Involved
20 25 30 30 38 38 49 50
Count Locations
102 194 229 359 409 386 418 478
Volunteers 130 250+ 300+ 350+ 375+ 275+ 320 320
Total Bicyclists & Pedestrians
19,000 36,925 49,275 51,200 62,191 66,787 72,143 74,490
Source: http://www.wsdot.wa.gov/bicycle/Count.htm
How does active transportation facilities connect to other modes?People bike and walk to buses, trains, and ferries. For many people, nonmotorized modes are the only way to access transit. Bus stops, park-and-ride lots, and intermodal stations consider bicycle and pedestrian accessibility, including bicycle parking.

C4
W S D O T | W A S H I N G T O N T R A N S P O R T A T I O N P L A N , P H A S E 2 – I M P L E M E N T A T I O N | 2 0 1 7 - 2 0 4 0
PUBLIC REVIEW DRAFT - SEPTEMBER 2017 - APPENDIX C
Due to their remote location, most people drive to access trails located on Public Recreational Lands.
How is active transportation funded?The Washington State Legislature has authorized some local governments to access the following sources:
• Local Option Taxes (3.75 cents/gallon of state gas tax)
• Property Tax Road Levy (County roads)
• Transit Taxes (Sales and/or Utility)
• Commercial Parking Tax
State Agencies administer funds to the below-listed programs as follows:
Transportation Improvement Board grants from state gas tax and other appropriated funds to administer:
• Sidewalk Program (urban and small city).
• Arterial Preservation Program that enhance arterial safety, support growth and development, improve mobility and physical condition.
• Small City Preservation Program is for cities and towns with less than 5,000 and offers grants to reconstruct or maintain the transportation infrastructure.
• Complete Streets Program is flexible money given to any city or county in Washington state who has an adopted complete streets ordinance and shows an ethic of planning and building streets that use context sensitive solutions to accommodate all users, including pedestrians, transit users, cyclists, and motorists.
• WSDOT grants from gas tax and other appropriate funds to administer:
º Safe Routes to Schools: Improves safety and mobility for children by enabling and encouraging them to walk and bicycle to school. Funding from this program is for projects within two-miles of primary, middle and high schools.
º Pedestrian and Bicycle Safety Program: Aids public agencies in funding cost-effective projects that improve bicycle and pedestrian improvements.
• Washington State Recreation and Conservation Office grants from non-gas tax funds to administer:
º Non-Highway and Off-Road Vehicle Program: Provides funding to develop and manage recreation opportunities for such activities as cross-country skiing, hiking, horseback riding, mountain bicycling, hunting, fishing, sightseeing, motorcycling, and riding all-terrain and four-wheel drive vehicles accessed via a non-highway road (public road that was not built or maintained with gasoline tax funding). The following are eligible to apply:
– Local agencies

C5
W S D O T | W A S H I N G T O N T R A N S P O R T A T I O N P L A N , P H A S E 2 – I M P L E M E N T A T I O N | 2 0 1 7 - 2 0 4 0
PUBLIC REVIEW DRAFT - SEPTEMBER 2017 - APPENDIX C
– Special purpose districts, such as park districts and port districts
– Native American tribes
– State agencies
– Federal agencies
• Washington Wildlife and Recreation Program: Recreation and Conservation Office-administered program that provides funding for a broad range of land protection and outdoor recreation, including park acquisition and development, habitat conservation, farmland and forestland preservation, and construction of outdoor recreation facilities (which includes active transportation facilities).
Washington Traffic Safety Commission invests state and federal funds to administer:
• Annual Grants: Annually awarded for projects that address one of more of the top Target Zero priorities – which may include Active Transportation projects. The following are eligible to apply:
º Washington state agencies
º Federally recognized tribal governments
º Cities, counties and their sub-agencies
º Non-profit organizations with existing IRS 501 C(3) status
º Public schools (and private schools with non-profit status)
º School Zone Grants: To purchase crossing guard equipment and training, and school zone enforcement equipment.
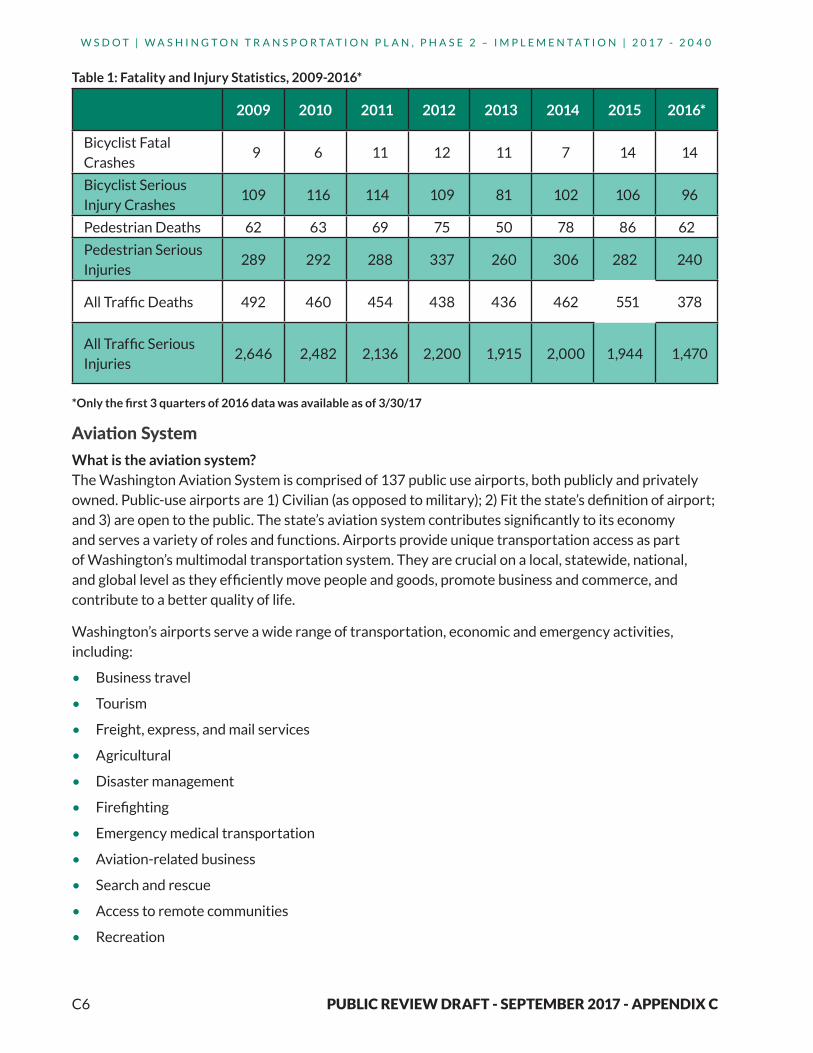
What are the safety statistics for active transportation?Table 1 is from the Washington Traffic Safety Commission. The fatalities and serious injuries are those that were as a result or a traffic crash. This is a count of fatally or seriously injured bicyclists, pedestrians, and occupants in vehicles (drivers and passengers).
C6
W S D O T | W A S H I N G T O N T R A N S P O R T A T I O N P L A N , P H A S E 2 – I M P L E M E N T A T I O N | 2 0 1 7 - 2 0 4 0
PUBLIC REVIEW DRAFT - SEPTEMBER 2017 - APPENDIX C
Table 1: Fatality and Injury Statistics, 2009-2016*
2009 2010 2011 2012 2013 2014 2015 2016*
Bicyclist Fatal Crashes
9 6 11 12 11 7 14 14
Bicyclist Serious Injury Crashes
109 116 114 109 81 102 106 96
Pedestrian Deaths 62 63 69 75 50 78 86 62
Pedestrian Serious Injuries
289 292 288 337 260 306 282 240
All Traffic Deaths 492 460 454 438 436 462 551 378
All Traffic Serious Injuries
2,646 2,482 2,136 2,200 1,915 2,000 1,944 1,470
*Only the first 3 quarters of 2016 data was available as of 3/30/17
Aviation System What is the aviation system?The Washington Aviation System is comprised of 137 public use airports, both publicly and privately owned. Public-use airports are 1) Civilian (as opposed to military); 2) Fit the state’s definition of airport; and 3) are open to the public. The state’s aviation system contributes significantly to its economy and serves a variety of roles and functions. Airports provide unique transportation access as part of Washington’s multimodal transportation system. They are crucial on a local, statewide, national, and global level as they efficiently move people and goods, promote business and commerce, and contribute to a better quality of life.
Washington’s airports serve a wide range of transportation, economic and emergency activities, including:
• Business travel
• Tourism
• Freight, express, and mail services
• Agricultural
• Disaster management
• Firefighting
• Emergency medical transportation
• Aviation-related business
• Search and rescue
• Access to remote communities
• Recreation

C7
W S D O T | W A S H I N G T O N T R A N S P O R T A T I O N P L A N , P H A S E 2 – I M P L E M E N T A T I O N | 2 0 1 7 - 2 0 4 0
PUBLIC REVIEW DRAFT - SEPTEMBER 2017 - APPENDIX C
Figu
re 1
: Was
hin
gto
n S
tate
Pu
blic
Use
Air
po
rts

C8
W S D O T | W A S H I N G T O N T R A N S P O R T A T I O N P L A N , P H A S E 2 – I M P L E M E N T A T I O N | 2 0 1 7 - 2 0 4 0
PUBLIC REVIEW DRAFT - SEPTEMBER 2017 - APPENDIX C
Where are airports in the system located? Washington’s Aviation System is a diverse mixture of airports ranging in size from small back-country airports to the state’s busiest commercial airport, Seattle-Tacoma International Airport (Sea-Tac). These airports meet a full range of transportation needs.
Which airports have scheduled commercial airline service?Twelve airports provide scheduled commercial airline service to in-state, domestic, and (in some cases) international destinations.
What is general aviation aircraft?Across the U.S., general aviation aircraft are flown for a wide variety of uses. These aircraft include home-built/experimental, glider, agricultural, military surplus, antique and classic WarBirds, ultra-light airplanes, helicopters, single and multi-engine aircraft, and corporate and private jets. WSDOT registered 6,512 aircraft as of September 30, 2015, surpassing its 2015 goal to register at least 95 percent, or 6,232, of the active aircraft from 2014. While WSDOT met its goal, this is 48 fewer aircraft than the same time last year. Washington state law requires that all non-exempt airworthy general aviation aircraft be registered annually with WSDOT in January. Aircraft registration fees directly support WSDOT’s airport preservation, maintenance and improvement programs.
Figure 2: WSDOT Managed Airports
C9
W S D O T | W A S H I N G T O N T R A N S P O R T A T I O N P L A N , P H A S E 2 – I M P L E M E N T A T I O N | 2 0 1 7 - 2 0 4 0
PUBLIC REVIEW DRAFT - SEPTEMBER 2017 - APPENDIX C
Sixteen of the 137 public-use airports are owned or managed by WSDOT. These airports serve as critical staging areas for statewide wildfire management efforts. In particular, Woodland State, Methow Valley, Lake Wenatchee, Skykomish, and Sullivan Lake State airports dedicate resources and facilities to fighting seasonal fires. WSDOT-managed airports are expected to play a significant role in emergency staging operations in the future due to continuing warming trends.
What is current condition of the aviation system?
InfrastructurePavements represent one of the largest capital investments in Washington’s aviation system, and the condition of these pavements is important both from cost-effectiveness and safety standpoints. Timely airport pavement maintenance and rehabilitation are crucial because repairs are much costlier once the condition deteriorates below a certain level. Of Washington’s 137 Airports, 100 have paved surfaces. Airport paved surfaces include aprons, helipads, runways, and taxiways. Approximately 71 percent of the 100 airports are at the condition level where they will benefit from preventive maintenance actions, such as crack sealing, joint sealing, patching, and surface treatments. Approximately 18 percent of the pavement infrastructure is in need of more extensive rehabilitation, while approximately 11 percent is in need of reconstruction to restore the pavement. Washington’s runways have a combined pavement condition index (PCI) of 80.1
Airfield capacity and aircraft storage capacityTo examine airport capacity, each airport’s Annual Service Volume (ASV) reflects an airport’s ability to process annual operational activity based on airport characteristics such as airfield configuration and fleet mix. While current operations utilize a small percentage of overall state operations capacity, roughly 13 percent operations and demand are not uniformly distributed among all airports.
1 2013 Washington State Airport Pavement Management System, Executive Summary
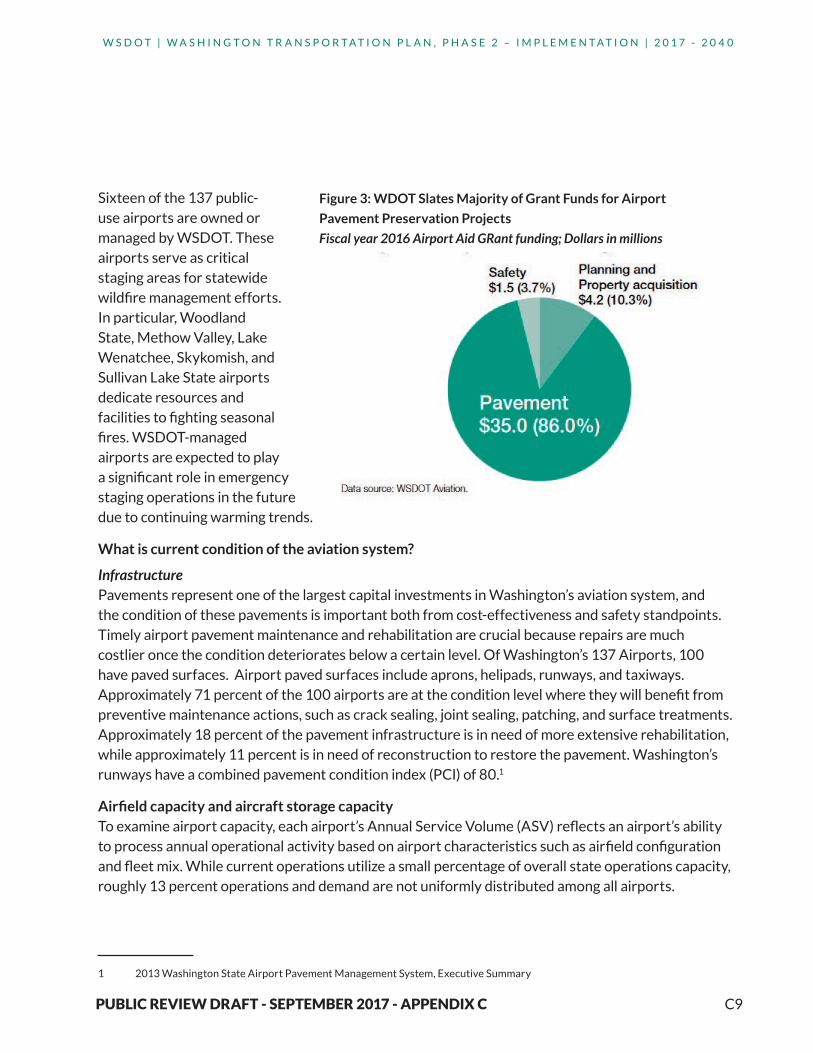
Figure 3: WDOT Slates Majority of Grant Funds for Airport
Pavement Preservation Projects
Fiscal year 2016 Airport Aid GRant funding; Dollars in millions

C10
W S D O T | W A S H I N G T O N T R A N S P O R T A T I O N P L A N , P H A S E 2 – I M P L E M E N T A T I O N | 2 0 1 7 - 2 0 4 0
PUBLIC REVIEW DRAFT - SEPTEMBER 2017 - APPENDIX C
Table 2: 2014 Annual Service Volumes and Operations by Airport Classification
State Airport Classification
Annual Service Volume
2014 Operations2014 Operations as
% of ASV
Major 3,189,200 940,926 29.5%
Regional 4,675,000 1,286,943 27.5%
Community 6,555,000 707,362 10.8%
Local 5,692,500 212,285 3.7%
General Use 3,910,000 120,766 3.1%
Total System 24,021,700 3,268,282 13.6%
Figure 3: Demand/Capacity Ratio of Washington Airports
C11
W S D O T | W A S H I N G T O N T R A N S P O R T A T I O N P L A N , P H A S E 2 – I M P L E M E N T A T I O N | 2 0 1 7 - 2 0 4 0
PUBLIC REVIEW DRAFT - SEPTEMBER 2017 - APPENDIX C
For example, airports located in and around the major population and economic centers of Washington experience the greater demand compared to airports in less developed areas. Some individual airports may face capacity constraints, while other airports have significant excess capacity, a typical dynamic in all states.
Overall aircraft operations demand in Washington is forecasted to increase from 13.6 percent of statewide capacity in 2014 to 17.1 percent of statewide capacity in 2034. The greatest operations demand will still be associated with the Major and Regional airports. By 2034, utilization of overall operations capacity at Major and Regional airports will reach 39 percent and 34 percent respectively.
Aircraft storage capacity at airports allows for general aviation (GA) aircraft to be stored in a location that is both safe and convenient when they are not in use. The existing aircraft storage capacity is comprised of both hangar buildings and aircraft tiedown positions at the public use airports across the state. In 2014, the state airport system as a whole had reached 66 percent of its existing aircraft storage capacity. Aircraft storage demand at 21 system airports are currently at capacity.
Overall storage demand in Washington is forecasted to increase by nearly 25 percent by 2034 Assuming no increase in the 2014 aircraft storage capacity numbers, the overall system is anticipated to reach a utilization of nearly 83 percent by 2034. The system as a whole is projected to sustain long-term aircraft storage capacity, however aircraft storage constraints are expected to be met at some Washington airports. Approximately 35 percent (47 of 137) of Washington airports are expected to have capacity shortfalls by 2034.
Airspace capacityThe majority of airspace overlaps occur in the Puget Sound Region where population and aviation activity is highest. Sea-Tac and Boeing Field/King County International Airport show the biggest airspace overlap in terms of potential operational conflict. As such, their proximity implies that flight path coordination between the two airports is required. Airspace within Washington State is
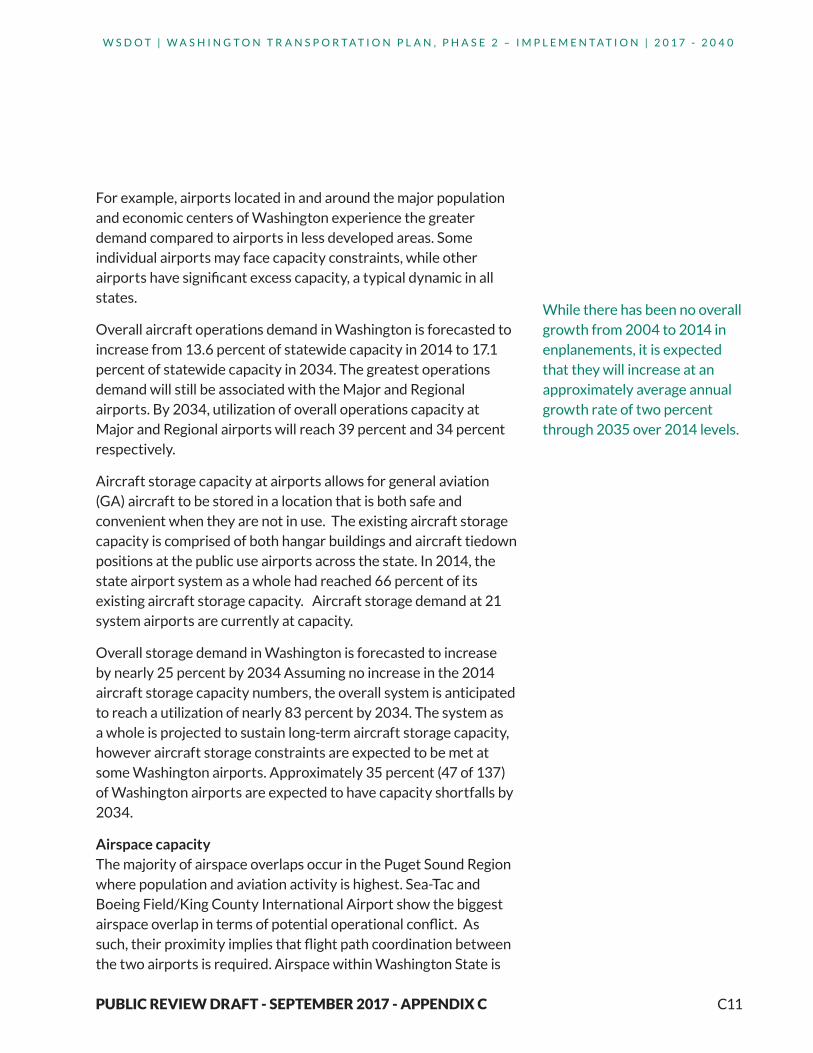
While there has been no overall growth from 2004 to 2014 in enplanements, it is expected that they will increase at an approximately average annual growth rate of two percent through 2035 over 2014 levels.
C12
W S D O T | W A S H I N G T O N T R A N S P O R T A T I O N P L A N , P H A S E 2 – I M P L E M E N T A T I O N | 2 0 1 7 - 2 0 4 0
PUBLIC REVIEW DRAFT - SEPTEMBER 2017 - APPENDIX C
subject to overlap from airports outside of the state. Specifically, airports in Southwest Washington are affected by Portland International Airport. In 2015, WSDOT partnered with the FAA to collect aviation spatial data necessary for the implementation of NextGEN technologies in Puget Sound Region. NextGEN is the modernization of the U.S. air traffic system. NextGen capabilities will help commercial airports accommodate the demand for additional capacity in a safe, efficient and environmentally responsible manner.
Commercial airline service and general aviation trendsThe demand for commercial service and general aviation has remained strong over time. During 2004 and 2005, demand returned to pre-September 11, 2001 (9/11) levels, with additional growth through most of 2007. With the 2008 economic crisis, aviation activity levels fell once more, but demand has since increased steadily at rates much slower than during previous recoveries.
Key takeaways include the following:
• Enplanements have experienced fluctuations in the last 15 years due to factors such as the events of 9/11 and the Great Recession 2007-2009.
• Enplanements were almost to pre-9/11 levels when the economic downturn occurred and were nearly back to those levels by 2014.
Airline consolidation has impacted historical trends, resulting in a decrease in the number of aircraft operations. This is primarily due to airlines “right sizing” markets through the use of larger aircraft (movement from 50-seat regional jets to 70- and 90-seat aircraft) with less frequency, as well as an increase in the overall load factor.
What is the demand for aviation?• 89 percent of the traffic is at Sea-Tac and Spokane International Airport (SIA).
• In 2015, Sea-Tac welcomed more than 42 million passengers; up 12.9 percent from 2014. In 2034, forecasts project Sea-Tac will reach:
º 66 million annual passengers (an increase of 24 million from 2015).
º 540,000 annual operations (up from 350,000 in 2014).2
• In 2015, Spokane International had 1,566,332 enplanements.3 The airport experienced a 4.89 percent in growth between 2014 and 2015.4
º Spokane International is forecasted to reach 3,119,876 enplanements by 2030.5
2 Port of Seattle, Sustainable Airport Master Plan (SAMP)3 An enplanement is a passenger boarding a commercial service flight.4 FAA, CY15 ACAIS Calendar Year 2015 Revenue Enplanements at Commercial Service Airports5 Spokane International Airport Master Plan (March 2014), Chapter 2

C13
W S D O T | W A S H I N G T O N T R A N S P O R T A T I O N P L A N , P H A S E 2 – I M P L E M E N T A T I O N | 2 0 1 7 - 2 0 4 0
PUBLIC REVIEW DRAFT - SEPTEMBER 2017 - APPENDIX C
While there has been no overall growth from 2004 to 2014 in enplanements, it is expected that enplanements will increase at an approximate average annual growth rate of two percent over 2014 levels through 2035. The largest growth in enplanements will be seen in the international markets over domestic activity.
The trends related to aircraft size and load factors are expected to continue through 2035, with load factors increasing from 83.4 percent in 2014 to 84.2 percent by 2027, then remaining fairly stable through 2035.
The FAA counts number of flights and the passengers per flight only at the NPIAS airports. Not all of the passengers on a flight originated at or departed from the airport listed. These numbers are important for determining airport capacity but not necessarily the demand on the connecting transportation system.
Table 3: Washington Aviation System Plan Forecast Summary
Forecast Element 2014 2019 2024 2034
Total Change 2014-2034
Average Annual Growth
Rate
Enplanements 21,266,635 25,507,926 29,662,115 38,975,299 83% 3.1%
Air Carrier & Air Taxi/Commuter Aircraft Operations
594,438 670,398 738,004 879,595 48% 2.0%
Non-commercial Aircraft Operations
2,770,273 2,896,993 3,029,460 3,335,224 20% 0.9%
Based Aircraft 7,209 7,608 8,081 9,010 25% 1.1%
Anticipated commercial trends The FAA projects that total domestic passenger enplanements on large U.S. carriers and regional/commuter carriers combined will increase from approximately 668.4 million in 2014 to approximately 951.0 million in 2035, representing an average annual growth rate of approximately 1.7 percent.
• The largest growth in enplanements will be seen in the international markets over domestic activity.
• The trends related to aircraft size and load factors are expected to continue through 2035, with load factors increasing from 83.4 percent in 2014 to 84.2 percent by 2027 and remaining fairly stable through 2035.
C14
W S D O T | W A S H I N G T O N T R A N S P O R T A T I O N P L A N , P H A S E 2 – I M P L E M E N T A T I O N | 2 0 1 7 - 2 0 4 0
PUBLIC REVIEW DRAFT - SEPTEMBER 2017 - APPENDIX C
Anticipated general aviation trends• Current and/or forecasted trends affecting general aviation are summarized as follows:
º The number of annual general aviation aircraft shipments has stabilized from the decline due to the economy.
º The overall number of general aviation licensed pilots will stabilize and relatively strong growth in the number of sport and “other” pilots is expected.
º Moderate growth is expected in the number active aircraft.
º Jet aircraft are expected to see even more growth from 2014 to 2035, continuing historical trends from 2004 to 2014.
References: • The passenger data is from the FAA and found at the USDOT Bureau of Transportation Statistics
http://www.transtats.bts.gov/Data_Elements.aspx?Data=1
• The FAA counts number of flights and the passengers per flight only at the NPIAS airports. Not all of the passengers on a flight originated or departed at the airport listed. These numbers are important to determining airport capacity but not necessarily to the demand on the connecting transportation system.
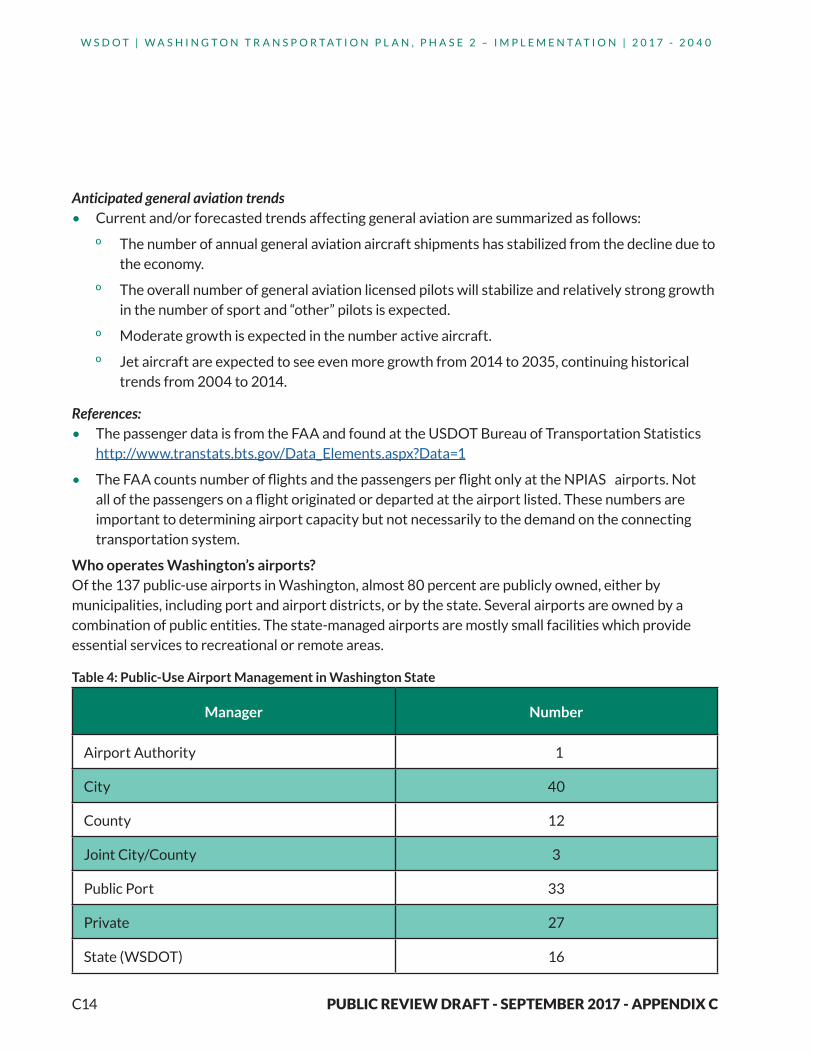
Who operates Washington’s airports?Of the 137 public-use airports in Washington, almost 80 percent are publicly owned, either by municipalities, including port and airport districts, or by the state. Several airports are owned by a combination of public entities. The state-managed airports are mostly small facilities which provide essential services to recreational or remote areas.
Table 4: Public-Use Airport Management in Washington State
Manager Number
Airport Authority 1
City 40
County 12
Joint City/County 3
Public Port 33
Private 27
State (WSDOT) 16
C15
W S D O T | W A S H I N G T O N T R A N S P O R T A T I O N P L A N , P H A S E 2 – I M P L E M E N T A T I O N | 2 0 1 7 - 2 0 4 0
PUBLIC REVIEW DRAFT - SEPTEMBER 2017 - APPENDIX C
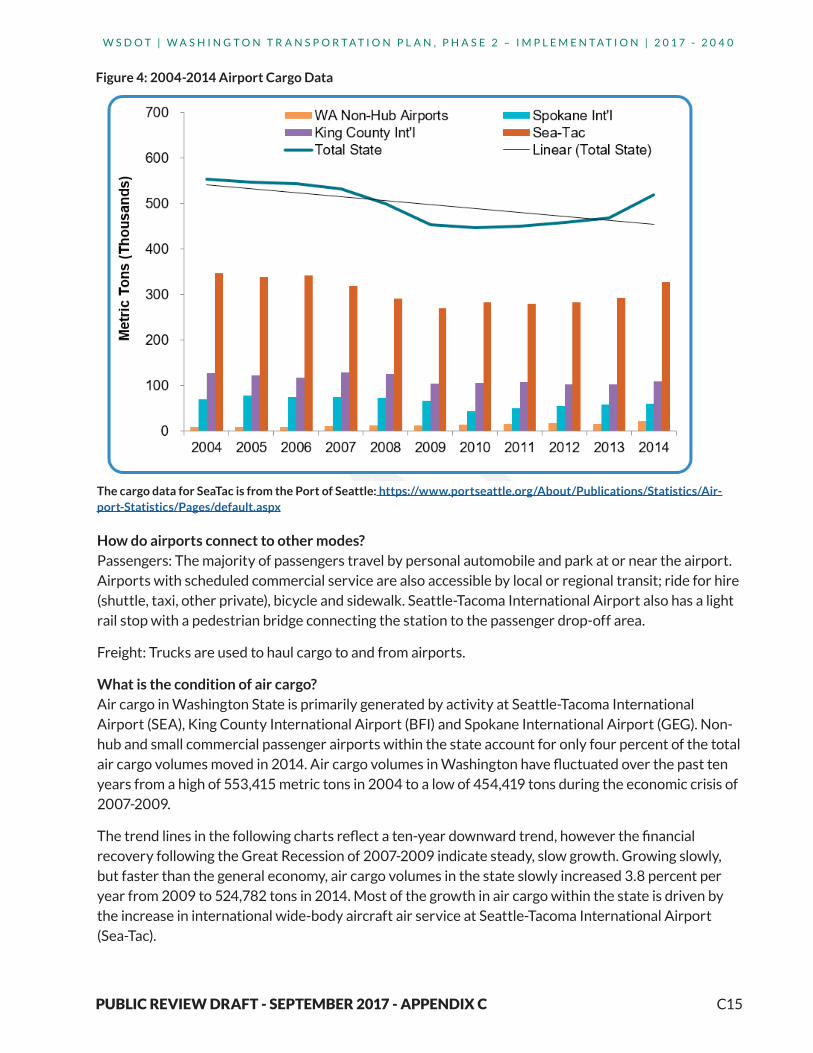
Figure 4: 2004-2014 Airport Cargo Data
The cargo data for SeaTac is from the Port of Seattle: https://www.portseattle.org/About/Publications/Statistics/Air-port-Statistics/Pages/default.aspx
How do airports connect to other modes? Passengers: The majority of passengers travel by personal automobile and park at or near the airport. Airports with scheduled commercial service are also accessible by local or regional transit; ride for hire (shuttle, taxi, other private), bicycle and sidewalk. Seattle-Tacoma International Airport also has a light rail stop with a pedestrian bridge connecting the station to the passenger drop-off area.
Freight: Trucks are used to haul cargo to and from airports.
What is the condition of air cargo? Air cargo in Washington State is primarily generated by activity at Seattle-Tacoma International Airport (SEA), King County International Airport (BFI) and Spokane International Airport (GEG). Non-hub and small commercial passenger airports within the state account for only four percent of the total air cargo volumes moved in 2014. Air cargo volumes in Washington have fluctuated over the past ten years from a high of 553,415 metric tons in 2004 to a low of 454,419 tons during the economic crisis of 2007-2009.
The trend lines in the following charts reflect a ten-year downward trend, however the financial recovery following the Great Recession of 2007-2009 indicate steady, slow growth. Growing slowly, but faster than the general economy, air cargo volumes in the state slowly increased 3.8 percent per year from 2009 to 524,782 tons in 2014. Most of the growth in air cargo within the state is driven by the increase in international wide-body aircraft air service at Seattle-Tacoma International Airport (Sea-Tac).

C16
W S D O T | W A S H I N G T O N T R A N S P O R T A T I O N P L A N , P H A S E 2 – I M P L E M E N T A T I O N | 2 0 1 7 - 2 0 4 0
PUBLIC REVIEW DRAFT - SEPTEMBER 2017 - APPENDIX C
Table 5: 2012-2016 Cargo and Passenger Data
YearMetric Tons of
CargoNumber of
Passenger FlightsPassengers Airport
2012 283,500 16,084,545 813,128,058 SeaTac
2013 292,709 16,641,706 824,967,603 SeaTac
2014 327,239 17,839,761 851,517,209 SeaTac
2015 332,636 18,429,859 896,357,664 SeaTac
2016 (Jan and Feb)
46,643 2,554,266 131,987,665 SeaTac
2012 17,593 1,452,702Spokane
International
2013 16,362 1,413,534Spokane
International
2014 16,277 1,442,178Spokane
International
2015 16,118 1,515,349Spokane
International
2016 (Jan and Feb
2,595 216,687Spokane
International
Figure 5: Secondary Washington Air Cargo Markets
Orcas Island Airport

C17
W S D O T | W A S H I N G T O N T R A N S P O R T A T I O N P L A N , P H A S E 2 – I M P L E M E N T A T I O N | 2 0 1 7 - 2 0 4 0
PUBLIC REVIEW DRAFT - SEPTEMBER 2017 - APPENDIX C
WSDOT AVIATION PROGR AMIn 2015, Gov. Jay Inslee signed the Transportation Appropriations Bill, including language to reallocate 100 percent of the existing annual state aircraft excise tax fees to fund airport projects. Previously, 90 percent of aircraft tax funds were deposited into the State General Fund, with the remaining 10 percent funding aviation. An additional $637,000 in aviation funding will be available during the 2015-2017 biennium due to the reallocation.
Fees from the aircraft excise tax will now exclusively fund WSDOT’s Airport Aid Grant Program. GNB Edition 59 – September 30, 2015
Air cargo activity at other airports in Washington State is generated almost exclusively by FedEx and UPS with very small quantities of enplaned and deplaned by Alaska/Horizon Airlines. Lower deck cargo (belly cargo) capacity at smaller airports in the state is limited due to the regional aircraft utilized to serve these markets.
Due to the lack of wide-body air service, smaller population centers, and the general operational economics of the air cargo business explained previously, Washington State businesses located outside the metropolitan Seattle market are served by air/truck Road Feeder Service from Sea-Tac and King County International or directly to/from other major Midwest and West Coast airports.
How is the aviation system funded?In our state, 64 of the 137 public-use airports are included on the National Plan of Integrated Airport Systems (NPIAS) and are eligible for federal and state grants. The rest are primarily small local and rural airports that rely on state, local, and private funding. Federal funds are used primarily for infrastructure improvements, while operating costs are funded through local airport fees. Additional funding is required to meet the basic maintenance needs of the system.
In fiscal year (FY) 2017 (July 2016 through June 2017) 30 projects at 32 airports were funded. WSDOT’s leveraged dollars are part of $1.76 million in total state funds for the Airport Aid Grant Program. The state and federal funds, combined with nearly $6.6 million in local matching contributions, amount to nearly $60.6 million in total dollars for FY2017.
In FY2017, 43 percent ($25.7 million) of the nearly $60.6 million in federal, state and local aid investment dollars is slated for projects that preserve and improve airport pavement. Planning, property acquisition, maintenance, and security projects account for 7 percent ($4.0 million) of the combined grant dollars, with safety improvements accounting for the remaining 50 percent ($29.9 million).
C18
W S D O T | W A S H I N G T O N T R A N S P O R T A T I O N P L A N , P H A S E 2 – I M P L E M E N T A T I O N | 2 0 1 7 - 2 0 4 0
PUBLIC REVIEW DRAFT - SEPTEMBER 2017 - APPENDIX C
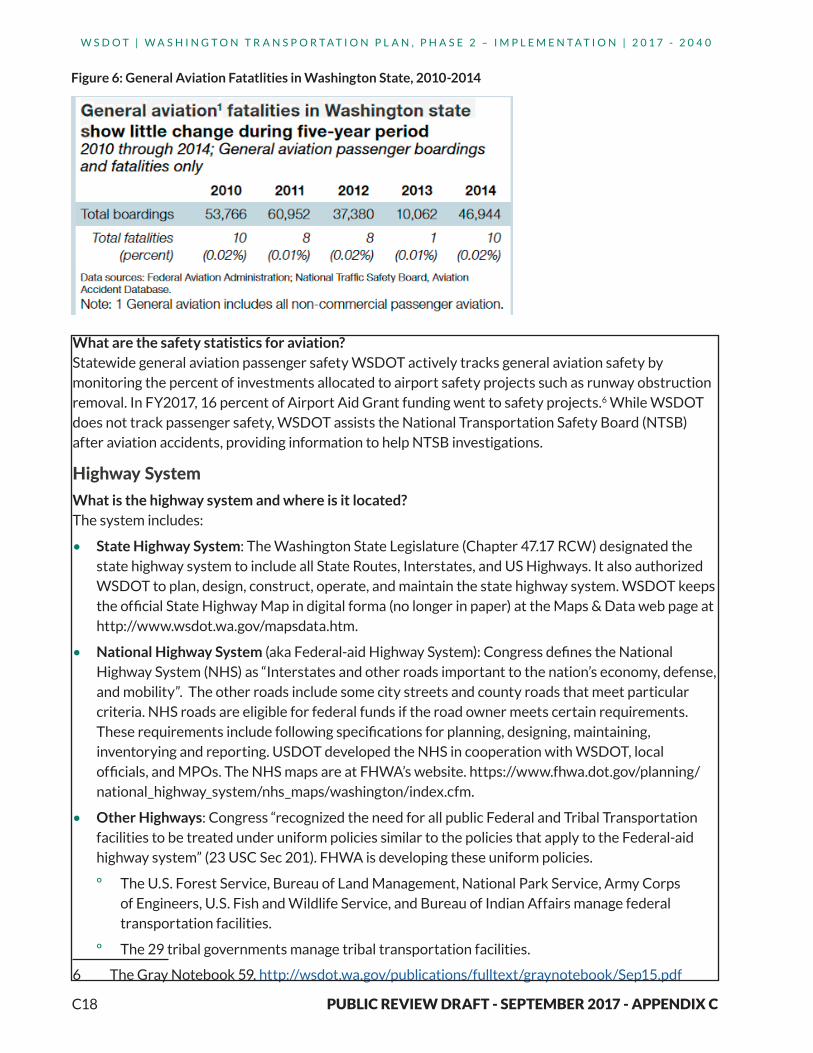
What are the safety statistics for aviation?Statewide general aviation passenger safety WSDOT actively tracks general aviation safety by monitoring the percent of investments allocated to airport safety projects such as runway obstruction removal. In FY2017, 16 percent of Airport Aid Grant funding went to safety projects.6 While WSDOT does not track passenger safety, WSDOT assists the National Transportation Safety Board (NTSB) after aviation accidents, providing information to help NTSB investigations.
Highway System What is the highway system and where is it located?The system includes:
• State Highway System: The Washington State Legislature (Chapter 47.17 RCW) designated the state highway system to include all State Routes, Interstates, and US Highways. It also authorized WSDOT to plan, design, construct, operate, and maintain the state highway system. WSDOT keeps the official State Highway Map in digital forma (no longer in paper) at the Maps & Data web page at http://www.wsdot.wa.gov/mapsdata.htm.
• National Highway System (aka Federal-aid Highway System): Congress defines the National Highway System (NHS) as “Interstates and other roads important to the nation’s economy, defense, and mobility”. The other roads include some city streets and county roads that meet particular criteria. NHS roads are eligible for federal funds if the road owner meets certain requirements. These requirements include following specifications for planning, designing, maintaining, inventorying and reporting. USDOT developed the NHS in cooperation with WSDOT, local officials, and MPOs. The NHS maps are at FHWA’s website. https://www.fhwa.dot.gov/planning/national_highway_system/nhs_maps/washington/index.cfm.
• Other Highways: Congress “recognized the need for all public Federal and Tribal Transportation facilities to be treated under uniform policies similar to the policies that apply to the Federal-aid highway system” (23 USC Sec 201). FHWA is developing these uniform policies.
º The U.S. Forest Service, Bureau of Land Management, National Park Service, Army Corps of Engineers, U.S. Fish and Wildlife Service, and Bureau of Indian Affairs manage federal transportation facilities.
º The 29 tribal governments manage tribal transportation facilities.
6 The Gray Notebook 59. http://wsdot.wa.gov/publications/fulltext/graynotebook/Sep15.pdf
Figure 6: General Aviation Fatatlities in Washington State, 2010-2014
C19
W S D O T | W A S H I N G T O N T R A N S P O R T A T I O N P L A N , P H A S E 2 – I M P L E M E N T A T I O N | 2 0 1 7 - 2 0 4 0
PUBLIC REVIEW DRAFT - SEPTEMBER 2017 - APPENDIX C
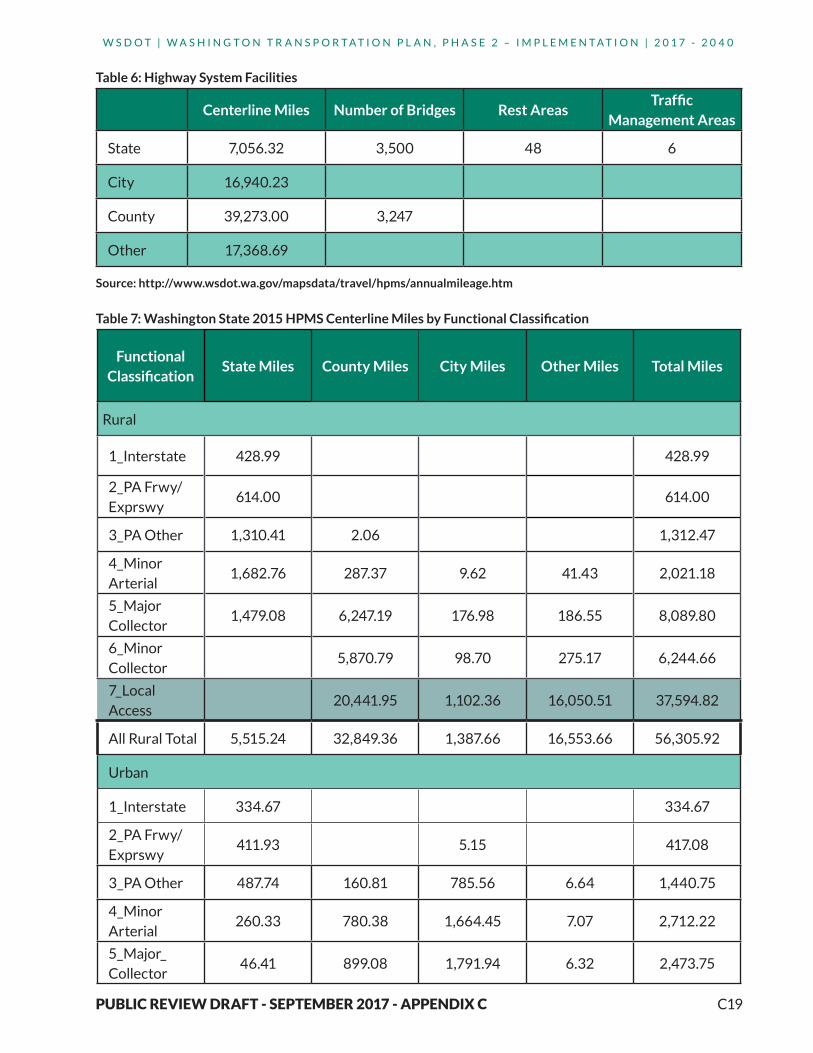
Table 6: Highway System Facilities
Centerline Miles Number of Bridges Rest AreasTraffic
Management Areas
State 7,056.32 3,500 48 6
City 16,940.23
County 39,273.00 3,247
Other 17,368.69
Source: http://www.wsdot.wa.gov/mapsdata/travel/hpms/annualmileage.htm
Table 7: Washington State 2015 HPMS Centerline Miles by Functional Classification
Functional Classification
State Miles County Miles City Miles Other Miles Total Miles
Rural
1_Interstate 428.99 428.99
2_PA Frwy/Exprswy
614.00 614.00
3_PA Other 1,310.41 2.06 1,312.47
4_Minor Arterial
1,682.76 287.37 9.62 41.43 2,021.18
5_Major Collector
1,479.08 6,247.19 176.98 186.55 8,089.80
6_Minor Collector
5,870.79 98.70 275.17 6,244.66
7_Local Access
20,441.95 1,102.36 16,050.51 37,594.82
All Rural Total 5,515.24 32,849.36 1,387.66 16,553.66 56,305.92
Urban
1_Interstate 334.67 334.67
2_PA Frwy/Exprswy
411.93 5.15 417.08
3_PA Other 487.74 160.81 785.56 6.64 1,440.75
4_Minor Arterial
260.33 780.38 1,664.45 7.07 2,712.22
5_Major_Collector
46.41 899.08 1,791.94 6.32 2,473.75

C20
W S D O T | W A S H I N G T O N T R A N S P O R T A T I O N P L A N , P H A S E 2 – I M P L E M E N T A T I O N | 2 0 1 7 - 2 0 4 0
PUBLIC REVIEW DRAFT - SEPTEMBER 2017 - APPENDIX C
Functional Classification
State Miles County Miles City Miles Other Miles Total Miles
6_Minor Collector
125.11 61.65 0.60 187.36
7_Local Access
4,458.28 11,243.83 494.40 16,196.50
All Urban Total
1,541.08 6,423.66 15,552.57 515.03 24,032.34
Federal Aid Total
7,056.32 8,502.01 4,495.35 248.61 20,302.28
Non-Federal Aid Total
30,771.02 12,444.88 16,820.08 60,035.98
Arterial and Collector Total
7,056.32 14,372.79 4,594.05 523.78 26,546.94
Local Access Total
24,900.23 12,346.18 16,544.91 53,791.32
All Public Roads Total
7,056.32 39,273.03 16,940.23 17,068.69 80,338
Note: WSDOT and other jurisdictions use lane miles (larger number than centerline miles) for asset management pur-poses, such as paving, striping, etc. FHWA requires WSDOT and other jurisdictions to report on centerline miles. For ex-ample, a four-lane highway that is 15 miles long has 60 lane miles and 15 centerline miles.
Table 7: Washington State 2015 HPMS Centerline Miles by Functional Classification (continued)

C21
W S D O T | W A S H I N G T O N T R A N S P O R T A T I O N P L A N , P H A S E 2 – I M P L E M E N T A T I O N | 2 0 1 7 - 2 0 4 0
PUBLIC REVIEW DRAFT - SEPTEMBER 2017 - APPENDIX C
Source: TIB ppt Presentation to WSTC 12/14/16
Figure 7: 2008 & 2016 Small City Pavement Status

C22
W S D O T | W A S H I N G T O N T R A N S P O R T A T I O N P L A N , P H A S E 2 – I M P L E M E N T A T I O N | 2 0 1 7 - 2 0 4 0
PUBLIC REVIEW DRAFT - SEPTEMBER 2017 - APPENDIX C

C23
W S D O T | W A S H I N G T O N T R A N S P O R T A T I O N P L A N , P H A S E 2 – I M P L E M E N T A T I O N | 2 0 1 7 - 2 0 4 0
PUBLIC REVIEW DRAFT - SEPTEMBER 2017 - APPENDIX C
Sou
rce:
htt
p:/
/ww
w.c
rab
.wa.
gov/
Met
rics
/in
dex
.cfm
Fig
ure
8: W
ashi
ngt
on
Sta
te C
oun
ty T
ran
spo
rtat
ion
Met
rics
Sta
tew
ide
Co
unty
Roa
d D
ata

C24
W S D O T | W A S H I N G T O N T R A N S P O R T A T I O N P L A N , P H A S E 2 – I M P L E M E N T A T I O N | 2 0 1 7 - 2 0 4 0
PUBLIC REVIEW DRAFT - SEPTEMBER 2017 - APPENDIX C
What is the condition of the highway system?
State Highway System• WSDOT manages $19 billion of pavement assets which includes approximately:
º 18,500 lane miles of pavement (excluding bridge decks)
º 2,000 lane miles of ramps and special use lanes
º 7,500 lane miles of shoulders
• Pavement conditions remain stable from 2014-2015 with 93.1 percent lane miles in fair or better condition
• Pavement preservation backlog increased by 14.8 percent from 2014-2015. The backlog is expected to decrease with upcoming funding
• The majority of concrete pavement is at twice as old as its original design life and WSDOT is extending the life cycle through rehabilitation and reconstruction rather than replacement.
YearsRehabilitation
(Lane miles)Reconstruction
(Lane miles)
2016-2025 336 515
2026-2035 567 474
2036-2045 417 504
(2016-2045) 1,350 1,493
Annual Average 45 50
Data source: WSDOT Pavement Office
• 93 percent of maintenance condition targets met in 2016
Cities and counties:• Cities and counties manage 116,338 lane miles of pavement.
• Connecting Washington funding is unlikely to change the conditions of local pavement at their current levels.

C25
W S D O T | W A S H I N G T O N T R A N S P O R T A T I O N P L A N , P H A S E 2 – I M P L E M E N T A T I O N | 2 0 1 7 - 2 0 4 0
PUBLIC REVIEW DRAFT - SEPTEMBER 2017 - APPENDIX C
• Some of the most critical near-term local pavement issues include the following:
º Funding for urban corridors with heavy bus traffic and freight corridors is below the estimated need to make the necessary improvements.
º Normal wear and tear due to increasing average daily travel. Funding to rehabilitate and reconstruct these roads is significantly below the level of need, and capacity has not expanded to meet demand. This places a heavier burden on existing roads, which makes them deteriorate at a faster rate.
º Local agencies are unsure how NHS pavement conditions in their cities will be evaluated in the future and how this may impact their ability to control roadways and allocate resources in a way that they feel appropriate.
º Locally owned roadways are disproportionately impacted by severe weather events. In some cases, these events have become extreme, posing a substantial concern for local agencies. An aging drainage infrastructure coupled with an already stressed roadway system is a major concern, particularly in the Puget Sound area.
• Counties face these unique funding challenges:
º Sources of funding are from property taxes on unincorporated, lower value rural land.
º Up to 50 percent of the trips on some high traffic county roads come from neighboring counties or cities (not from the tax payers).
Other roads • MAP-21 required federal land management agencies (FLMAs) to inventory and assess a subset of
their roads as per FHWA specifications. FLMAs are working on this inventory.
MAP-21 allows Tribes to inventory and assess a subset of their roads as per FHWA specifications in order to be eligible for particular federal funding. Tribes are working on this inventory.
What is the demand of the highway system?The following mileage and travel information is based on data WSDOT collects annually for Highway Performance Monitoring System (HPMS) sections.
C26
W S D O T | W A S H I N G T O N T R A N S P O R T A T I O N P L A N , P H A S E 2 – I M P L E M E N T A T I O N | 2 0 1 7 - 2 0 4 0
PUBLIC REVIEW DRAFT - SEPTEMBER 2017 - APPENDIX C
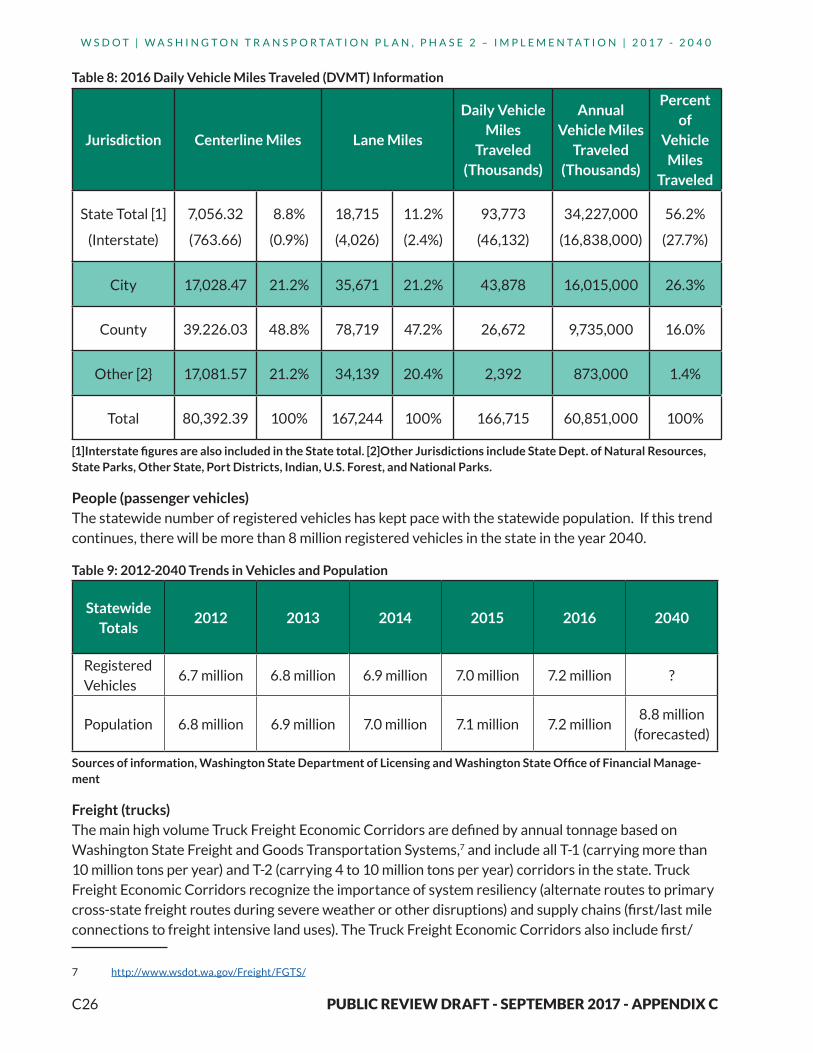
Table 8: 2016 Daily Vehicle Miles Traveled (DVMT) Information
Jurisdiction Centerline Miles Lane Miles
Daily Vehicle Miles
Traveled (Thousands)
Annual Vehicle Miles
Traveled (Thousands)
Percent of
Vehicle Miles
Traveled
State Total [1]
(Interstate)
7,056.32
(763.66)
8.8%
(0.9%)
18,715
(4,026)
11.2%
(2.4%)
93,773
(46,132)
34,227,000
(16,838,000)
56.2%
(27.7%)
City 17,028.47 21.2% 35,671 21.2% 43,878 16,015,000 26.3%
County 39.226.03 48.8% 78,719 47.2% 26,672 9,735,000 16.0%
Other [2} 17,081.57 21.2% 34,139 20.4% 2,392 873,000 1.4%
Total 80,392.39 100% 167,244 100% 166,715 60,851,000 100%
[1]Interstate figures are also included in the State total. [2]Other Jurisdictions include State Dept. of Natural Resources, State Parks, Other State, Port Districts, Indian, U.S. Forest, and National Parks.
People (passenger vehicles) The statewide number of registered vehicles has kept pace with the statewide population. If this trend continues, there will be more than 8 million registered vehicles in the state in the year 2040.
Table 9: 2012-2040 Trends in Vehicles and Population
Statewide Totals
2012 2013 2014 2015 2016 2040
Registered Vehicles
6.7 million 6.8 million 6.9 million 7.0 million 7.2 million ?
Population 6.8 million 6.9 million 7.0 million 7.1 million 7.2 million8.8 million
(forecasted)
Sources of information, Washington State Department of Licensing and Washington State Office of Financial Manage-ment
Freight (trucks)The main high volume Truck Freight Economic Corridors are defined by annual tonnage based on Washington State Freight and Goods Transportation Systems,7 and include all T-1 (carrying more than 10 million tons per year) and T-2 (carrying 4 to 10 million tons per year) corridors in the state. Truck Freight Economic Corridors recognize the importance of system resiliency (alternate routes to primary cross-state freight routes during severe weather or other disruptions) and supply chains (first/last mile connections to freight intensive land uses). The Truck Freight Economic Corridors also include first/
7 http://www.wsdot.wa.gov/Freight/FGTS/

C27
W S D O T | W A S H I N G T O N T R A N S P O R T A T I O N P L A N , P H A S E 2 – I M P L E M E N T A T I O N | 2 0 1 7 - 2 0 4 0
PUBLIC REVIEW DRAFT - SEPTEMBER 2017 - APPENDIX C
Figure 9:Freight Economic Corridors
last mile connector routes serving significant intermodal facilities, agricultural processing centers, warehouse districts, or other freight intensive land uses.
WSDOT uses the Truck Freight Economic Corridors to identify and map supply chains, identify system condition and capacity issues, and to develop performance measures to improve freight mobility. See the Freight Economic Corridors website for more information (http://www.wsdot.wa.gov/Freight/EconCorridors.htm)
C28
W S D O T | W A S H I N G T O N T R A N S P O R T A T I O N P L A N , P H A S E 2 – I M P L E M E N T A T I O N | 2 0 1 7 - 2 0 4 0
PUBLIC REVIEW DRAFT - SEPTEMBER 2017 - APPENDIX C
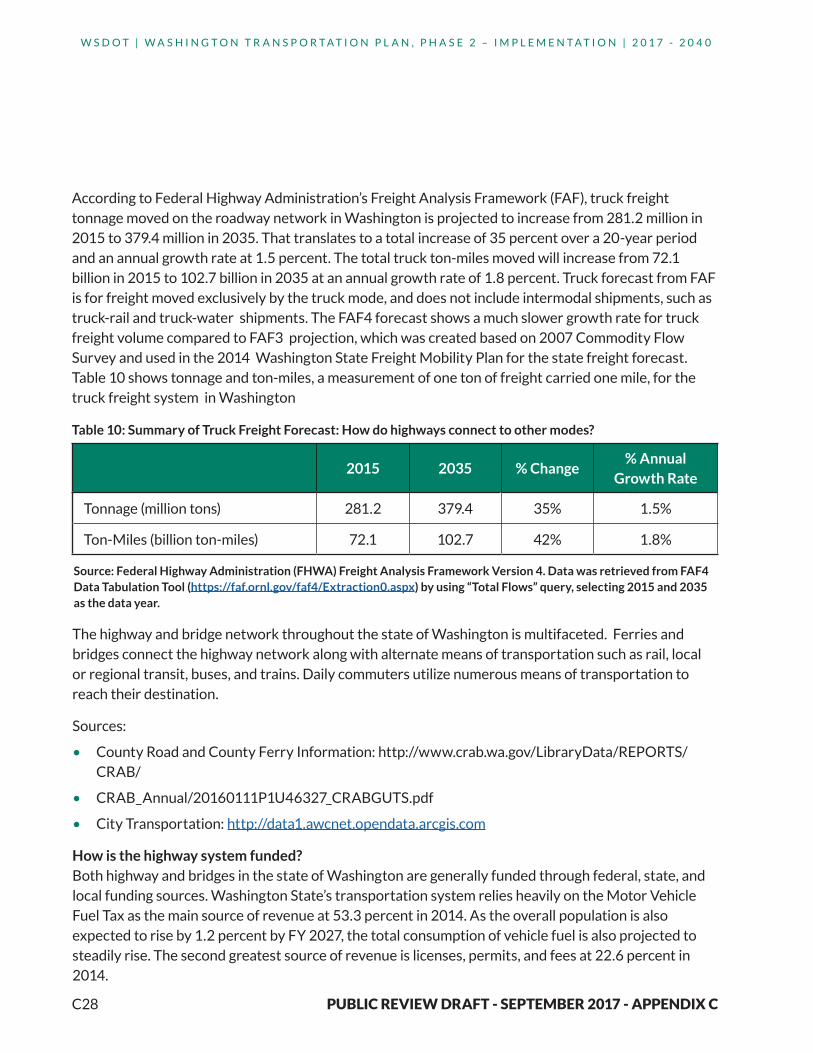
Source: Federal Highway Administration (FHWA) Freight Analysis Framework Version 4. Data was retrieved from FAF4 Data Tabulation Tool (https://faf.ornl.gov/faf4/Extraction0.aspx) by using “Total Flows” query, selecting 2015 and 2035 as the data year.
According to Federal Highway Administration’s Freight Analysis Framework (FAF), truck freight tonnage moved on the roadway network in Washington is projected to increase from 281.2 million in 2015 to 379.4 million in 2035. That translates to a total increase of 35 percent over a 20-year period and an annual growth rate at 1.5 percent. The total truck ton-miles moved will increase from 72.1 billion in 2015 to 102.7 billion in 2035 at an annual growth rate of 1.8 percent. Truck forecast from FAF is for freight moved exclusively by the truck mode, and does not include intermodal shipments, such as truck-rail and truck-water shipments. The FAF4 forecast shows a much slower growth rate for truck freight volume compared to FAF3 projection, which was created based on 2007 Commodity Flow Survey and used in the 2014 Washington State Freight Mobility Plan for the state freight forecast. Table 10 shows tonnage and ton-miles, a measurement of one ton of freight carried one mile, for the truck freight system in Washington
Table 10: Summary of Truck Freight Forecast: How do highways connect to other modes?
2015 2035 % Change% Annual
Growth Rate
Tonnage (million tons) 281.2 379.4 35% 1.5%
Ton-Miles (billion ton-miles) 72.1 102.7 42% 1.8%
The highway and bridge network throughout the state of Washington is multifaceted. Ferries and bridges connect the highway network along with alternate means of transportation such as rail, local or regional transit, buses, and trains. Daily commuters utilize numerous means of transportation to reach their destination.
Sources:
• County Road and County Ferry Information: http://www.crab.wa.gov/LibraryData/REPORTS/CRAB/
• CRAB_Annual/20160111P1U46327_CRABGUTS.pdf
• City Transportation: http://data1.awcnet.opendata.arcgis.com
How is the highway system funded?Both highway and bridges in the state of Washington are generally funded through federal, state, and local funding sources. Washington State’s transportation system relies heavily on the Motor Vehicle Fuel Tax as the main source of revenue at 53.3 percent in 2014. As the overall population is also expected to rise by 1.2 percent by FY 2027, the total consumption of vehicle fuel is also projected to steadily rise. The second greatest source of revenue is licenses, permits, and fees at 22.6 percent in 2014.
C29
W S D O T | W A S H I N G T O N T R A N S P O R T A T I O N P L A N , P H A S E 2 – I M P L E M E N T A T I O N | 2 0 1 7 - 2 0 4 0
PUBLIC REVIEW DRAFT - SEPTEMBER 2017 - APPENDIX C
Cities and counties have three large sources of revenue; property taxes, sales and use taxes and business and utility taxes. Counties use local sources, mainly the property tax, to fund their transportation infrastructure. Cities provide their own funding from local revenues for city-owned roads and bridges. Both the city and county local revenues are not directly related to transportation and therefore compete with other agenda items. The Revised Code of Washington (RCW), 47.24.010 states, “…in such city or town which are designated as forming a part of the route of any state highway; and all such streets, including curbs and gutters and street intersections and such bridges and wharves, shall thereafter be a part of the state highway system and as such shall be constructed and maintained by the department from any state funds available therefor.” Therefore, bridges that fall on a state route are maintained by the state highway system and not the city or county.
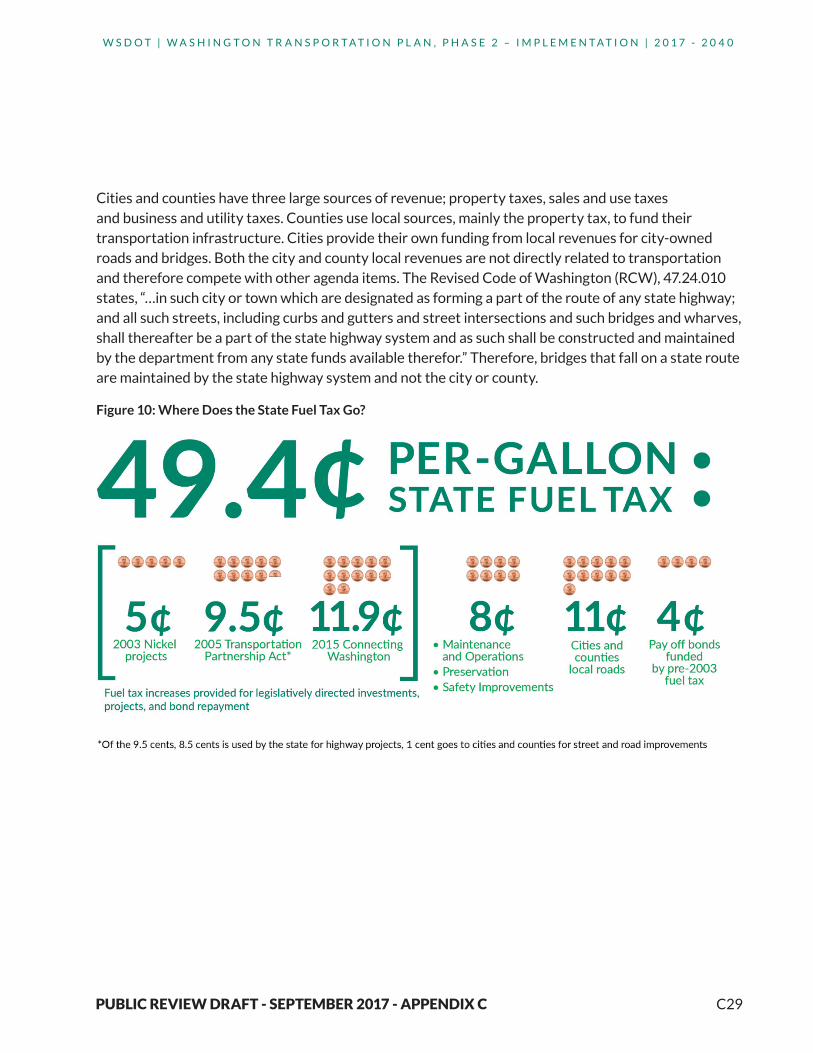
Figure 10: Where Does the State Fuel Tax Go?
C30
W S D O T | W A S H I N G T O N T R A N S P O R T A T I O N P L A N , P H A S E 2 – I M P L E M E N T A T I O N | 2 0 1 7 - 2 0 4 0
PUBLIC REVIEW DRAFT - SEPTEMBER 2017 - APPENDIX C
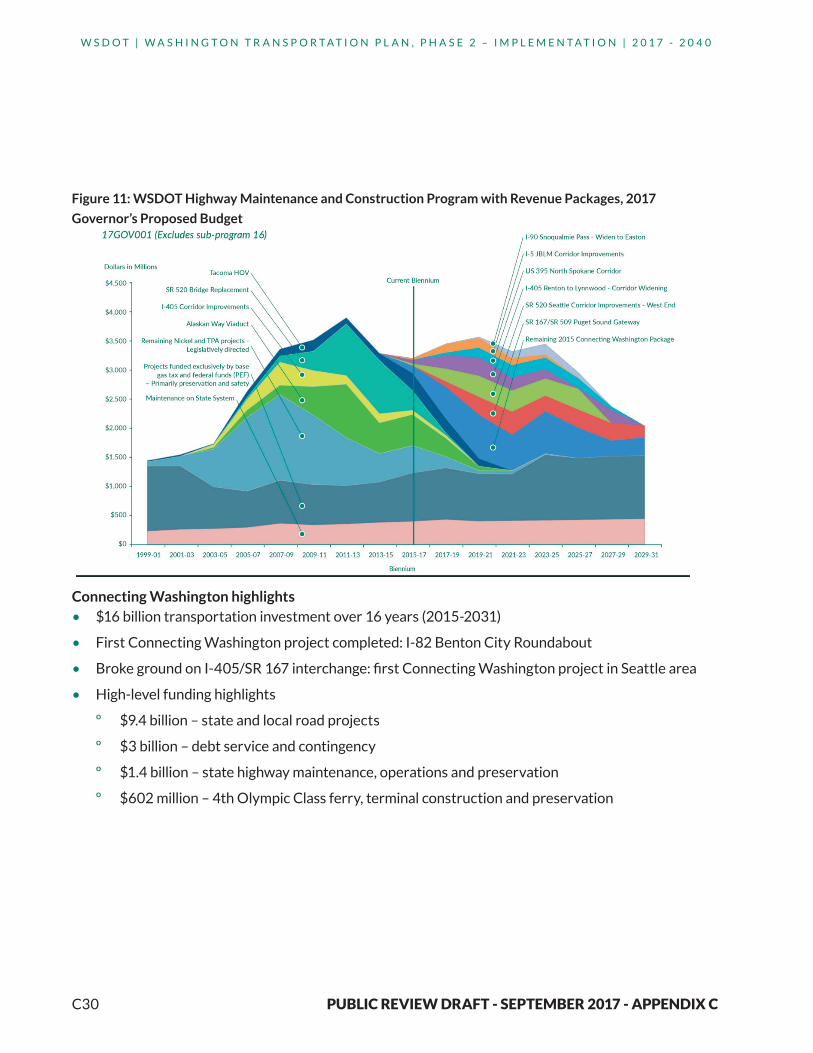
Figure 11: WSDOT Highway Maintenance and Construction Program with Revenue Packages, 2017
Governor’s Proposed Budget
Connecting Washington highlights• $16 billion transportation investment over 16 years (2015-2031)
• First Connecting Washington project completed: I-82 Benton City Roundabout
• Broke ground on I-405/SR 167 interchange: first Connecting Washington project in Seattle area
• High-level funding highlights
º $9.4 billion – state and local road projects
º $3 billion – debt service and contingency
º $1.4 billion – state highway maintenance, operations and preservation
º $602 million – 4th Olympic Class ferry, terminal construction and preservation
C31
W S D O T | W A S H I N G T O N T R A N S P O R T A T I O N P L A N , P H A S E 2 – I M P L E M E N T A T I O N | 2 0 1 7 - 2 0 4 0
PUBLIC REVIEW DRAFT - SEPTEMBER 2017 - APPENDIX C
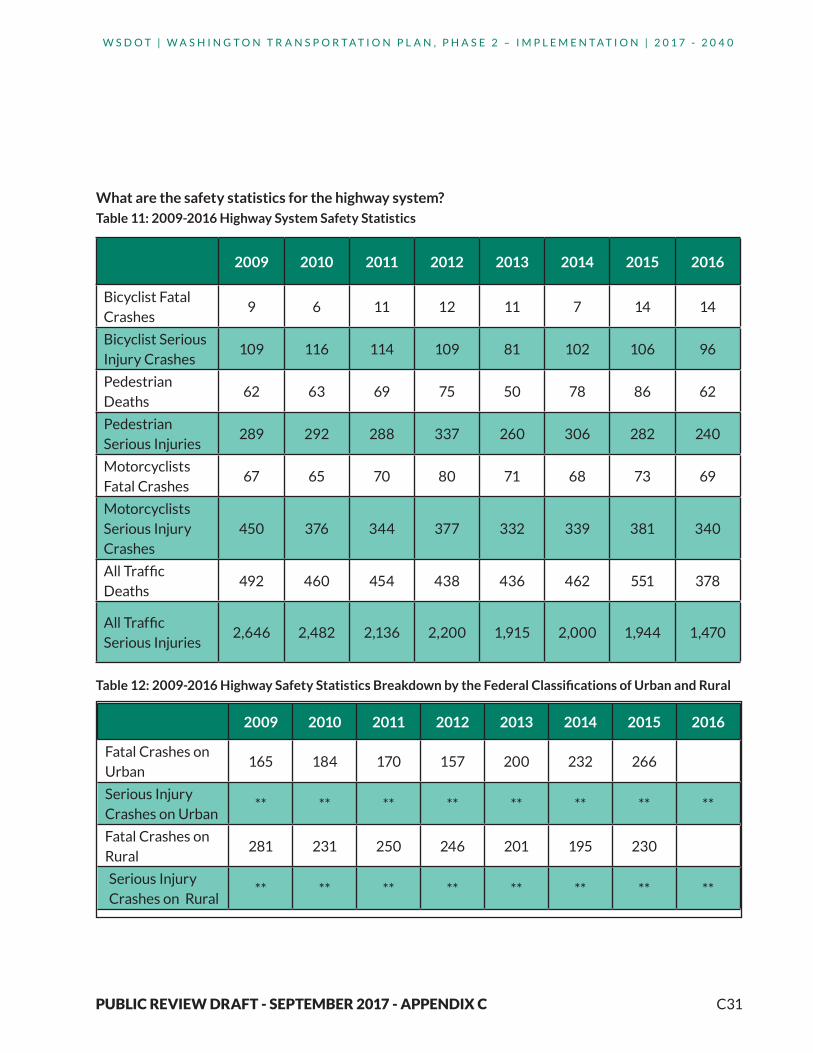
2009 2010 2011 2012 2013 2014 2015 2016
Bicyclist Fatal Crashes
9 6 11 12 11 7 14 14
Bicyclist Serious Injury Crashes
109 116 114 109 81 102 106 96
Pedestrian Deaths
62 63 69 75 50 78 86 62
Pedestrian Serious Injuries
289 292 288 337 260 306 282 240
Motorcyclists Fatal Crashes
67 65 70 80 71 68 73 69
Motorcyclists Serious Injury Crashes
450 376 344 377 332 339 381 340
All Traffic Deaths
492 460 454 438 436 462 551 378
All Traffic Serious Injuries
2,646 2,482 2,136 2,200 1,915 2,000 1,944 1,470
What are the safety statistics for the highway system?Table 11: 2009-2016 Highway System Safety Statistics
Table 12: 2009-2016 Highway Safety Statistics Breakdown by the Federal Classifications of Urban and Rural
2009 2010 2011 2012 2013 2014 2015 2016
Fatal Crashes on Urban
165 184 170 157 200 232 266
Serious Injury Crashes on Urban
** ** ** ** ** ** ** **
Fatal Crashes on Rural
281 231 250 246 201 195 230
Serious Injury Crashes on Rural
** ** ** ** ** ** ** **

C32
W S D O T | W A S H I N G T O N T R A N S P O R T A T I O N P L A N , P H A S E 2 – I M P L E M E N T A T I O N | 2 0 1 7 - 2 0 4 0
PUBLIC REVIEW DRAFT - SEPTEMBER 2017 - APPENDIX C
2009 2010 2011 2012 2013 2014 2015 2016
Fatal Crashes on State Highways (includes Interstates)
210 211 210 193 180 188 224 170
Serious Injury Crashes on State Highways (includes Interstates)
850 805 689 651 618 624 657 534
Fatal Crashes on County Road
149 119 129 119 120 118 143 108
Serious Injury Crashes on County Roads
583 524 459 439 364 394 395 326
Fatal Crashes City Streets
82 80 72 87 97 107 119 92
Serious Injury Crashes on City Streets
773 734 649 748 594 648 674 589
Fatal Crashes on Other types of road
12 12 10 4 4 16 13 8
Serious Injury Crashes on Other types of roads
34 36 29 33 25 22 26 21
Table 13: 2009-2016 Highway Safety Statistics Breakdown by Jurisdiction
*As of March 30, 2017, only the first 3 quarters of 2016 are available. ** Data not collected Source: Washington Traffic Safety Commission Fatal Data Source: Fatality Analysis Reporting System (FARS), WTSC and Serious Injury Data Source: Collision Location Analysis System (CLAS), WSDOT
PipelinesWhat is the pipeline system?In Washington state, the pipelines are underground and carry natural gas and hazardous liquids (petroleum products).The location, construction and operation of these systems are generally regulated by federal and state agencies. The Washington State Utilities and Transportation Commission (UTC) is responsible for developing and enforcing safety standards for natural gas and hazardous liquid pipelines located within the state. The UTC also inspects the portions of interstate

C33
W S D O T | W A S H I N G T O N T R A N S P O R T A T I O N P L A N , P H A S E 2 – I M P L E M E N T A T I O N | 2 0 1 7 - 2 0 4 0
PUBLIC REVIEW DRAFT - SEPTEMBER 2017 - APPENDIX C
natural gas and hazardous liquid pipelines located within Washington; the standards and enforcement actions are the responsibility of the federal Pipeline and Hazardous Materials Safety Administration (PHMSA).
Where are pipelines located?Three main petroleum pipelines are:
• Olympic (400 interstate pipeline with 299 miles in the state from Blaine to Vancouver)
• Chevron (Salt Lake to Pasco and Pasco to Spokane. It delivers military jet fuel to Fairchild Air Base in Spokane)
• Yellowstone (Billings to Spokane and Moses Lake)
The three main natural gas pipelines are:
• Northwest Pipeline Company’s pipeline runs from Sumas south along the I-5 corridor and east along the Columbia River. In addition to delivering Canadian natural gas, the system is bidirectional, with the capability to direct natural gas supplies from the Wyoming natural gas fields and the San Juan Basin to Washington, when needed.
• The Gas Transmission Northwest Company system transports Canadian natural gas from the Canada/Idaho border through Washington and Oregon. In Malin, Oregon) where the Gas Transmission Northwest Company system delivers into the California Gas Transmission Company system, it also delivers into the Tuscarora Pipeline Company (0.1 Bcf per day) system, which extends natural gas transportation from the northern California border to the Reno, Nevada, area.
• Puget Sound Energy owns the largest natural gas storage depot in Washington: the Jackson Prairie Underground Natural Gas Storage Facility in Lewis County. This reservoir can hold approximately 44 Bcf of natural gas to meet peak demand in winter
In total, the system includes five major petroleum refineries (BP West Coast Products and Phillips 66 Company in Ferndale, Shell Oil Products and Tesoro West Coast in Anacortes, and U.S. Oil & Refining in Tacoma).
For more information, including pipeline routes, by county see: http://www.utc.wa.gov/regulatedIndustries/transportation/pipeline/Pages/pipelineMaps.aspx
Pipeline forecastThe three petroleum pipelines moved 50.3 million tons in 2015 and are expected to move 52.8 million tons in 2035.
The two natural gas pipelines moved 1.9 billion cubic feet per day in 2015. There is no available forecast.
C34
W S D O T | W A S H I N G T O N T R A N S P O R T A T I O N P L A N , P H A S E 2 – I M P L E M E N T A T I O N | 2 0 1 7 - 2 0 4 0
PUBLIC REVIEW DRAFT - SEPTEMBER 2017 - APPENDIX C
How do pipelines connect to other modes?Natural gas carried in pipelines does not connect to other modes. There are proposals to build plants that will take natural gas from pipelines and then convert it to liquefied natural gas (LNG) and moved by ship or truck
Hazardous liquid relies on connections to many modes:
• Crude oil is transported by ship to Puget Sound refineries
• Refined product (gas, diesel and jet fuel) moves by pipeline or barge from refineries to distribution centers.
º Most of the refined product moves by pipeline. One of the major pipeline terminals is Vancouver, WA – Tidewater barge facility. From Tidewater it is barged upriver to Pasco.
º Oregon does not have refineries and receives the majority of its petroleum products from Washington.
• Product moves from distribution centers by truck to gas stations
How are pipelines funded?Private companies own, operate, and fund pipelines.

C35
W S D O T | W A S H I N G T O N T R A N S P O R T A T I O N P L A N , P H A S E 2 – I M P L E M E N T A T I O N | 2 0 1 7 - 2 0 4 0
PUBLIC REVIEW DRAFT - SEPTEMBER 2017 - APPENDIX C
Washington State All States
Calendar Year
Number of Serious Incidents
Fatalities InjuriesCalendar
Year
Number of Serious Incidents
Fatalities Injuries
1997 1997 49 10 77
1998 1998 70 21 81
1999 1 3 8 1999 66 22 108
2000 2000 62 38 81
2001 2001 40 7 61
2002 2002 36 12 49
2003 2003 61 12 71
2004 2 1 1 2004 44 23 56
2005 2005 38 16 46
2006 2006 32 19 34
2007 2007 42 15 46
2008 1 0 1 2008 36 8 54
2009 1 0 2 2009 46 13 62
2010 2010 34 19 103
2011 2 0 3 2011 32 12 51
2012 2012 28 10 54
2013 2013 24 8 42
2014 1 0 1 2014 27 19 94
2015 2 0 3 2015 28 10 49
2016 2016 37 16 80
2017* 2017*
Statewide Total
10 4 19National
Total832 310 1,299
*None as of March 30, 2017Source: U.S. DOT Pipeline and Hazardous Materials Safety Administration https://www.phmsa.dot.gov/pipeline/library/data-stats/pipelineincidenttrends
What are the safety statistics for pipelines?
Table 14: 1997-2017 Safety Statistics for Pipelines

C36
W S D O T | W A S H I N G T O N T R A N S P O R T A T I O N P L A N , P H A S E 2 – I M P L E M E N T A T I O N | 2 0 1 7 - 2 0 4 0
PUBLIC REVIEW DRAFT - SEPTEMBER 2017 - APPENDIX C
Public Transportation System (Transit)What is the public transportation system?Public transportation includes fixed route, demand response, vanpool, intercity rural bus service, Medicaid and non-emergency transportation, light rail, monorail, streetcar, and passenger ferry service.
Infrastructure includes public roads, buses, vans, transit centers, bus shelters and stops, bus rapid transit platforms, park and ride lots, ferry terminals, ferry vessels, light rail train cars and light rail/monorail tracks.
Service provides are public transit authorities, cities, non-profit and for profit transportation providers, intercity bus carriers, universities, and tribes.
Where is the public transportation system located?The 31 transit districts offer the majority of the service and they are located across the state (see Figure PT -1). As of 2015, approximately 5.8 million people (83 percent of the state’s population) live within the boundaries of a transit district.
Tribes, non-profits and other community transportation providers, and WSDOT’s Intercity Bus Program (Figure 13) also provide transit service.

C37
W S D O T | W A S H I N G T O N T R A N S P O R T A T I O N P L A N , P H A S E 2 – I M P L E M E N T A T I O N | 2 0 1 7 - 2 0 4 0
PUBLIC REVIEW DRAFT - SEPTEMBER 2017 - APPENDIX C
Figu
re 1
2: W
ash
ingt
on
Sta
te’s
Pu
blic
Tra
nsi
t A
uth
ori
ties

C38
W S D O T | W A S H I N G T O N T R A N S P O R T A T I O N P L A N , P H A S E 2 – I M P L E M E N T A T I O N | 2 0 1 7 - 2 0 4 0
PUBLIC REVIEW DRAFT - SEPTEMBER 2017 - APPENDIX C
What is the current condition of the public transportation system?• In 2015, 34.6 percent of the transit fleet vehicles exceeded the Federal Transit Administration’s
(FTA) definition of minimum useful life.
• In 2014, 37.3 percent met this definition.
Figure 13: Statewide Intercity Bus Network

C39
W S D O T | W A S H I N G T O N T R A N S P O R T A T I O N P L A N , P H A S E 2 – I M P L E M E N T A T I O N | 2 0 1 7 - 2 0 4 0
PUBLIC REVIEW DRAFT - SEPTEMBER 2017 - APPENDIX C
What is the current demand for public transportation?
Table 15: Passenger Trips by Service Mode
2010 2011 2012 2013 2014 2015
2014-2015
Change (%)
Fixed Route 186,970,986 190,234,530 191,966,046 194,239,523 198,169,160 197,621,978 -0.28
Route Deviated 2,161,333 2,157,594 2,388,370 2,404,556 2,373,499 2,070,774 -12.75
Demand Response 4,674,872 4,557,744 4,427,943 4,379,465 4,356,667 4,277,233 -1.82
Vanpool 7,745,157 8,289,335 8,635,720 8,425,655 8,255,460 8,124,675 -1.58
Commuter Rail 2,480,052 2,626,711 2,803,123 2,968,041 3,361,318 3,851,831 14.59
Light Rail 8,352,838 9,546,221 10,476,045 11,453,266 12,619,200 13,126,042 4.02
Total 212,385,238 217,412,135 220,697,247 223,870,506 229,135,304 229,072,533 -0.03
What is the future demand for public transportation? There is no statewide common metric for forecasting demand. Each agency determined demand differently. The most common method to determine demand is to use population forecasts as a proxy.
Factors influencing demand include:
• Affordability of housing and transportation.
• Gas prices.
• Aging population.
• Traffic congestion.
• Density.
• Funding levels.
• Evolving technologies.
• Attitudes toward owning personal vehicles.
How does public transportation connect to other modes?Public transportation connects to other systems at airports, ferry terminals, transit stations, park and ride lots, tribal reservations, and train stations. The purpose of public transportation is to ensure that people can access the transportation system in order to interact with each other and the broader community to ensure quality of life.

C40
W S D O T | W A S H I N G T O N T R A N S P O R T A T I O N P L A N , P H A S E 2 – I M P L E M E N T A T I O N | 2 0 1 7 - 2 0 4 0
PUBLIC REVIEW DRAFT - SEPTEMBER 2017 - APPENDIX C
How is public transportation funded?• Public transit agencies are primarily funded through voter-approved local taxes. In 2015, local
taxes contributed $1,790 million to public transit.
• In 2015, public transit agencies collected $314.0 million in fare revenues. The majority of this revenue ($255 million) was collected from users of fixed-route bus service.
• The 2015 average farebox recovery rate (the percent of annual operating costs recovered by passenger fares) for fixed-route service offered by public transit agencies was 26.2 percent.
• In 2015, Washington public transit agencies received $348 million in federal funds.
• During the 2015-17 biennium, the state transportation budget provided $144,633,000 million in funds to public transit agencies through the Special Needs ($41,250,000), Regional Mobility (RCW 47.66.030) ($74,976,000), Rural Mobility (RCW 47.66.100) ($20,438,000), Vanpool ($6,969,000), and Transit Coordination grant programs ($1,000,000).
• As described above, the Travel Washington Intercity Bus program is funded in part by the FTA. The FTA 5311 Non-Urban Program requires states to set-aside 15 percent of their federal transit apportionment to support intercity bus service. The federal grant funds require a 50 percent local match for operating assistance. WSDOT has been granted FTA authority to use the private investment in the intercity system (primarily from Greyhound) as the required match, and therefore is supporting the four Travel Washington routes with only federal funds. The private contractors are allowed to keep fares and fees.
• For detailed information on all sources of funding, see the Washington State Legislature Joint Transportation Resource Manual at http://leg.wa.gov/JTC/trm/Pages/TRM2017.aspx.
What are the public transportation safety statistics?
Table 16: Urbanized Area Formula Grant Recipients
Reportable Event Fatalities Injuries
2013 112 8 116
2014 104 3 107
2015 159 3 140
2016 (as of 4/3/17) 164 7 116
Source: https://www.transit.dot.gov/ntd/ntd-dataIncludes passengers, pedestrians, transit employees, bicyclists, motorists, trespassers and suicides

C41
W S D O T | W A S H I N G T O N T R A N S P O R T A T I O N P L A N , P H A S E 2 – I M P L E M E N T A T I O N | 2 0 1 7 - 2 0 4 0
PUBLIC REVIEW DRAFT - SEPTEMBER 2017 - APPENDIX C
Reportable Event Fatalities Injuries
2013 7 0 2
2014 8 0 5
2015 4 0 3
Reportable Event Fatalities Injuries
2013 0 0 0
2014 0 0 0
2015 2 0 6
Table 17: Rural Subrecipient Safety Data
Source: FTA NTD https://www.transit.dot.gov/ntd/ntd-data
Table 18: Tribal Subrecipient Safety Data
Source: https://www.transit.dot.gov/ntd/ntd-data
Rail System: Freight & PassengerWhat is the statewide rail system?Washington has more than 3,000 miles of railroad tracks that provide mobility for goods moving into, out of, within and through the state. Rail uses a system of main lines, branch lines, industrial spurs and rail yards operated by these types of carriers:
Class I railroads• Own 60 percent of the statewide infrastructure.
• Freight service
º 2 Privately owned
– BNSF Railway operates on 1,633 miles of track.
– Union Pacific operates on 532 miles of track.
º In most parts of the state, the infrastructure is actually owned by the Class I freight railroads, which allows passenger rail to operate over it using a series of operating agreement.
• Passenger rail
º Two long-distance (Empire Builder and Coast Starlight)
º Intercity (Amtrak Cascades)

C42
W S D O T | W A S H I N G T O N T R A N S P O R T A T I O N P L A N , P H A S E 2 – I M P L E M E N T A T I O N | 2 0 1 7 - 2 0 4 0
PUBLIC REVIEW DRAFT - SEPTEMBER 2017 - APPENDIX C
º Commuter (Sounder)
Class II railroads• Freight service
• Uses Class I infrastructure
• One privately owned
º Montana Rail Link connects to BNSF Railway in Spokane.
Class III railroads (short lines)• Owns 40 percent of the statewide infrastructure.
• Freight and Passenger (Tourist trains) Service
• 17 Privately-operated
º Own 20 percent of rail mileage in the state
• Eight Publicly-operated
º Own 20 percent of rail mileage in the state
º WSDOT owns the Palouse River and Coulee City (PCC) rail system and contracts with private railroads to operate each of the branches.

C43
W S D O T | W A S H I N G T O N T R A N S P O R T A T I O N P L A N , P H A S E 2 – I M P L E M E N T A T I O N | 2 0 1 7 - 2 0 4 0
PUBLIC REVIEW DRAFT - SEPTEMBER 2017 - APPENDIX C
Where is the statewide rail system located?
Figure 14: Washington Rail Network
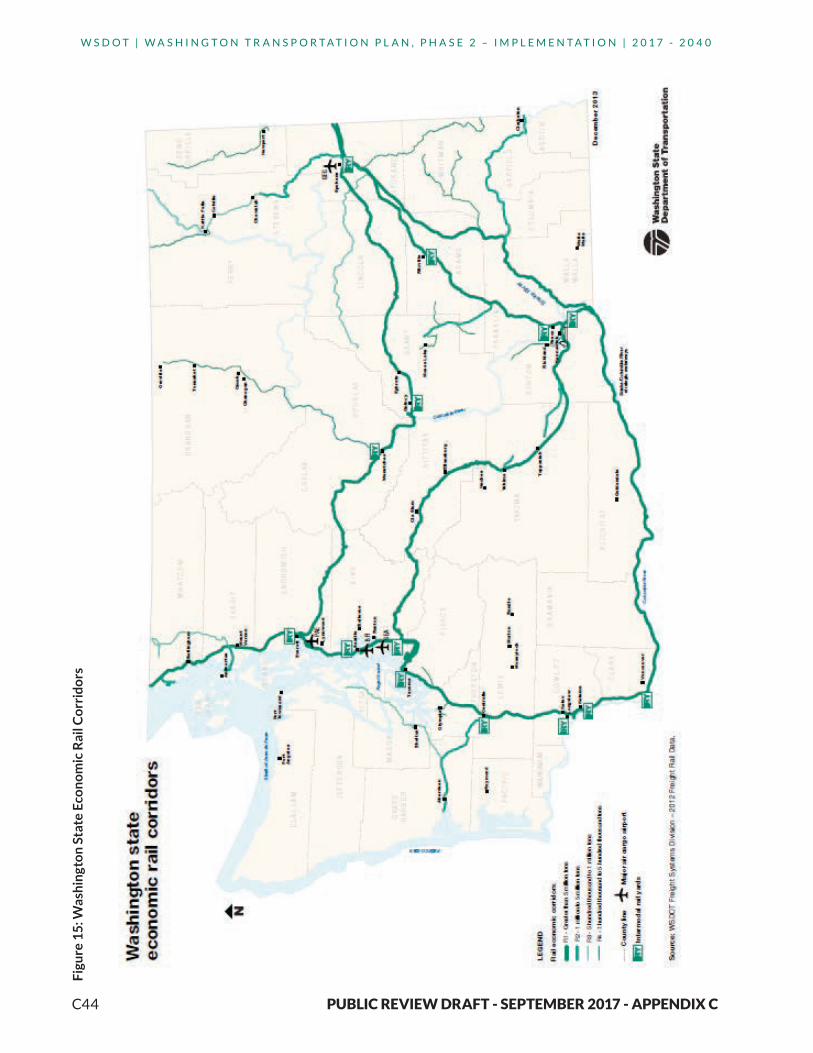
What is the location of freight economic rail corridors?WSDOT worked with the Freight Mobility Strategic Investment Board, Metropolitan Planning Organizations, Regional Transportation Planning Organizations, counties, cities, tribal governments, and ports to develop objective criteria in defining the statewide system of Freight Economic Corridors.
Freight Economic Corridors are used to identify and map supply chains, identify system condition and capacity issues, and to develop performance measures to improve freight mobility.
C44
W S D O T | W A S H I N G T O N T R A N S P O R T A T I O N P L A N , P H A S E 2 – I M P L E M E N T A T I O N | 2 0 1 7 - 2 0 4 0
PUBLIC REVIEW DRAFT - SEPTEMBER 2017 - APPENDIX C
Figu
re 1
5: W
ash
ingt
on
Sta
te E
con
om
ic R
ail C
orr
ido
rs
C45
W S D O T | W A S H I N G T O N T R A N S P O R T A T I O N P L A N , P H A S E 2 – I M P L E M E N T A T I O N | 2 0 1 7 - 2 0 4 0
PUBLIC REVIEW DRAFT - SEPTEMBER 2017 - APPENDIX C
What is the condition of the rail system?The Washington State Rail Plan 2013-2035 identifies these significant near and long-term challenges facing statewide rail transportation:
• Economic and demographic growth will increase demand for passenger and freight rail services, particularly on privately owned Class I railroads.
• The state’s public and private short-line (Class II) railroads, which provide Washington communities and shippers valuable access to the North American freight rail network, face infrastructure investment needs.
• Federal passenger rail policy has provided capital funding to expand frequency and reliability of intercity passenger rail (Amtrak Cascades), but the agreement also requires Washington to bear greater operating costs.
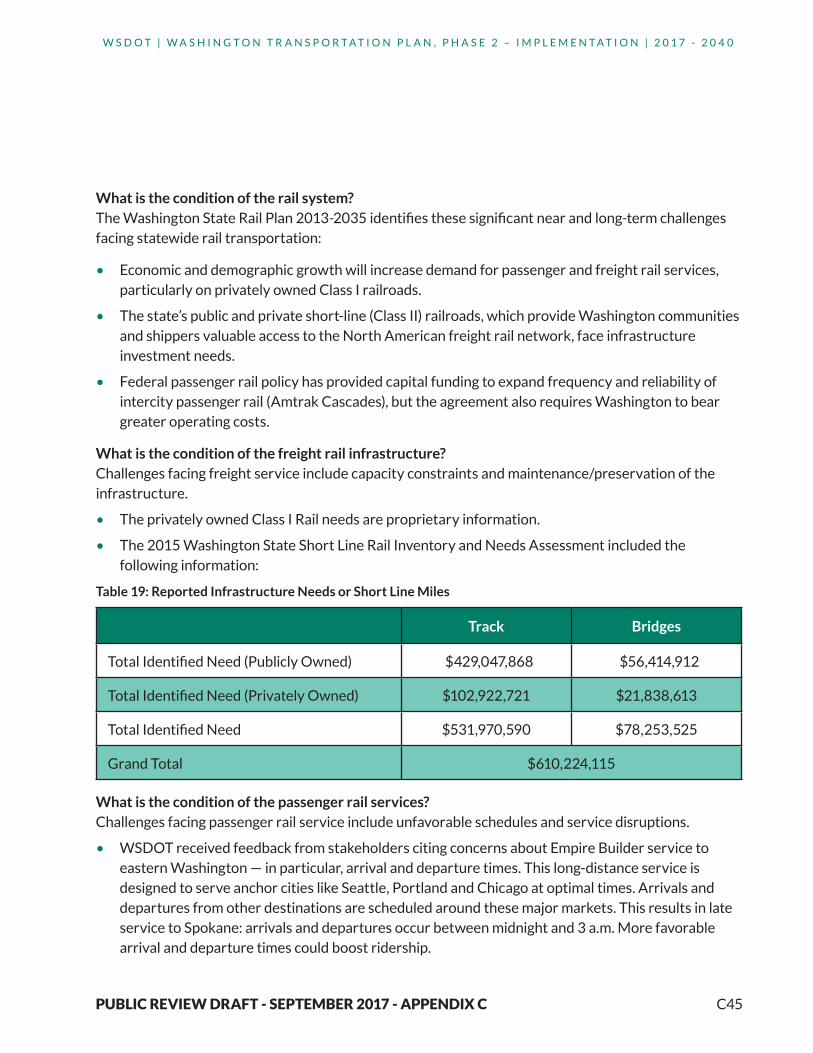
What is the condition of the freight rail infrastructure?Challenges facing freight service include capacity constraints and maintenance/preservation of the infrastructure.
• The privately owned Class I Rail needs are proprietary information.
• The 2015 Washington State Short Line Rail Inventory and Needs Assessment included the following information:
Table 19: Reported Infrastructure Needs or Short Line Miles
Track Bridges
Total Identified Need (Publicly Owned) $429,047,868 $56,414,912
Total Identified Need (Privately Owned) $102,922,721 $21,838,613
Total Identified Need $531,970,590 $78,253,525
Grand Total $610,224,115
What is the condition of the passenger rail services? Challenges facing passenger rail service include unfavorable schedules and service disruptions.
• WSDOT received feedback from stakeholders citing concerns about Empire Builder service to eastern Washington — in particular, arrival and departure times. This long-distance service is designed to serve anchor cities like Seattle, Portland and Chicago at optimal times. Arrivals and departures from other destinations are scheduled around these major markets. This results in late service to Spokane: arrivals and departures occur between midnight and 3 a.m. More favorable arrival and departure times could boost ridership.
C46
W S D O T | W A S H I N G T O N T R A N S P O R T A T I O N P L A N , P H A S E 2 – I M P L E M E N T A T I O N | 2 0 1 7 - 2 0 4 0
PUBLIC REVIEW DRAFT - SEPTEMBER 2017 - APPENDIX C
• From December through February (the worst of the rainy season), landslides may disrupt the Amtrak Cascades, particularly in landslide prone areas between Seattle and Everett, and passengers may have to travel part of their trip on an Amtrak-provided motorcoach. These landslides primarily occur north of Seattle. WSDOT recognizes that this does not support customer service needs and may reduce the number of people that will take the train during that time frame. WSDOT is working with its partners to develop strategies and actions that will reduce the impact of landslides and to help prevent them in the future.
What is the current demand for freight rail?In 2014:
• 121.8 million tons
• The total amount of freight transported in the state in 2014
º 48.6 percent of the total was imported to the state and terminated within the state
º 31.5 percent of the total moved through Washington (starting outside the state and not terminating here)
• Farm products such as soybean, corn, and wheat are the largest commodities transported.
º There was a net increase of 8.9 million tons of farm products (34.3 percent) between 2013 and 2014, mostly due to an increase in soybean and corn shipments.
º Hazardous materials increased more than three million tons (23.3 percent) due to increased crude oil shipments by rail in the state.
º Coal traffic also increased two million tons (11.9 percent), rising to 19.3 million tons during 2014.
Source: Gray Notebook Edition 62, which notes that 2015 data was not available as of June 30, 2016.
What is the future demand for freight rail?According to the Washington State Rail Plan 2013-2305, the two main factors that drive freight growth are population and income. Increased consumption leads to increased business activity and greater demand for goods that use the rail system.
In 2015:
• Statewide population was estimated to be approximately 7.1 million (source: OFM).
• Statewide per capita income was $51,146 (source: OFM).
By 2040:
• Statewide population is expected to be 8.8 million (source: OFM)
• Statewide per capita income is expected to be $70,850 (source: OFM using 2009 money).

C47
W S D O T | W A S H I N G T O N T R A N S P O R T A T I O N P L A N , P H A S E 2 – I M P L E M E N T A T I O N | 2 0 1 7 - 2 0 4 0
PUBLIC REVIEW DRAFT - SEPTEMBER 2017 - APPENDIX C
According to the Washington State Rail Plan 2013-2035, forecasts for the commodities that will use the rail system are:
In 2035:
• Approximately 68 million annual tons of cargo
º An average compound annualized growth rate of 3.4 percent.
º 55 percent is expected to be inbound.
º 19 percent is expected to move outbound.
º 22 percent is expected to be through movements.
º 4 percent is expected to be intrastate flows.
• The growth is projected to be heavily weighted to inbound flows, which are projected to increase 90 million tons, compared to an increase of 50 million tons for outbound movements.
• This growth appears to be primarily linked to increased exports through Washington and other Pacific Northwest and British Columbia ports, along with increased consumption associated with a growing state population and per-capita income.
What is the current and future demand for passenger service?Amtrak
Figure 16: Empire Builder and Coast Starlight Ridership, 1981 to 2035

C48
W S D O T | W A S H I N G T O N T R A N S P O R T A T I O N P L A N , P H A S E 2 – I M P L E M E N T A T I O N | 2 0 1 7 - 2 0 4 0
PUBLIC REVIEW DRAFT - SEPTEMBER 2017 - APPENDIX C
Amtrak Cascades• Intercity passenger service is provided by Amtrak Cascades.
• Sponsored by Washington and Oregon.
• 467 miles long between Eugene, OR and Vancouver, B.C.
º 300 miles in Washington.
º 134 miles in Oregon.
º 33 miles in British Columbia.
• Uses freight rail lines owned by BNSF Railways and Union Pacific Corporation.
• Operates over 4,000 trains annually.
• Runs 11 daily trains.
• Four daily round trips between Seattle and Portland.
• Two daily round trips between Seattle and Vancouver, B.C.
• Two daily round trips between Portland and Eugene (Oregon).
• Stations in:
º Bellingham
º Mount Vernon
º Stanwood
º Everett
º Edmonds
º Seattle
º Tukwila
º Tacoma
º Olympia/Lacey
º Centralia
º Kelso/Longview
º Vancouver
C49
W S D O T | W A S H I N G T O N T R A N S P O R T A T I O N P L A N , P H A S E 2 – I M P L E M E N T A T I O N | 2 0 1 7 - 2 0 4 0
PUBLIC REVIEW DRAFT - SEPTEMBER 2017 - APPENDIX C
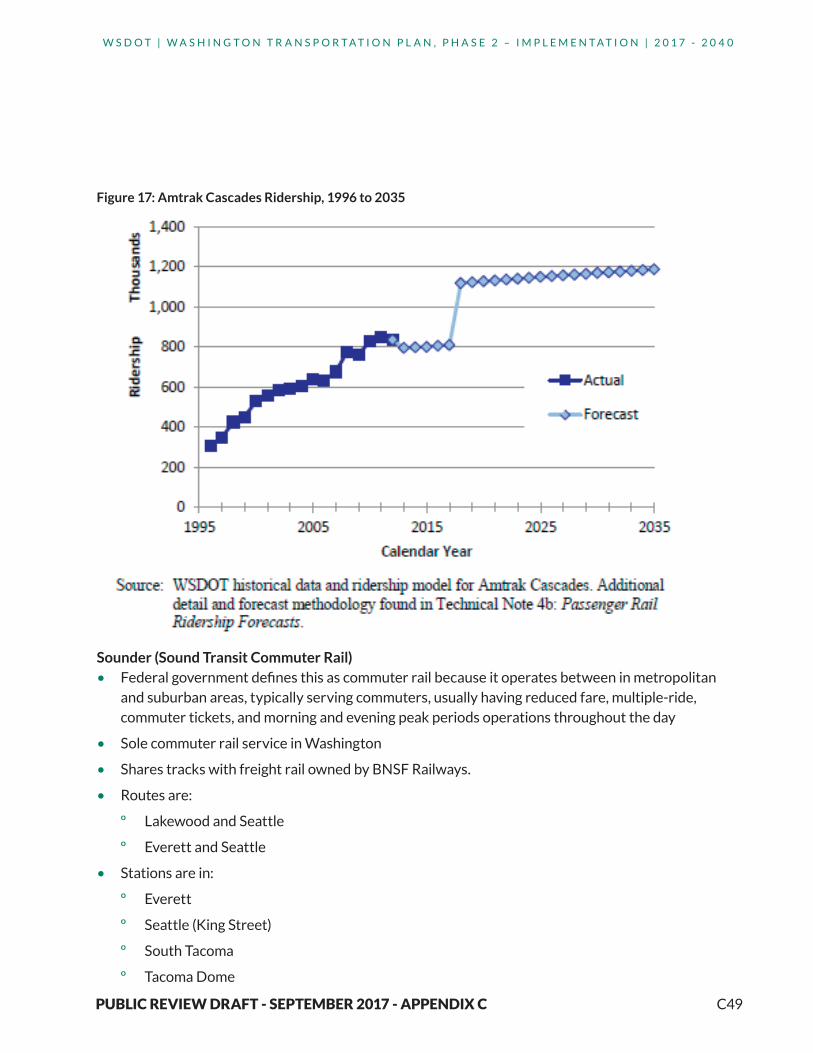
Figure 17: Amtrak Cascades Ridership, 1996 to 2035
Sounder (Sound Transit Commuter Rail)• Federal government defines this as commuter rail because it operates between in metropolitan
and suburban areas, typically serving commuters, usually having reduced fare, multiple-ride, commuter tickets, and morning and evening peak periods operations throughout the day
• Sole commuter rail service in Washington
• Shares tracks with freight rail owned by BNSF Railways.
• Routes are:
º Lakewood and Seattle
º Everett and Seattle
• Stations are in:
º Everett
º Seattle (King Street)
º South Tacoma
º Tacoma Dome

C50
W S D O T | W A S H I N G T O N T R A N S P O R T A T I O N P L A N , P H A S E 2 – I M P L E M E N T A T I O N | 2 0 1 7 - 2 0 4 0
PUBLIC REVIEW DRAFT - SEPTEMBER 2017 - APPENDIX C
º Puyallup
º Sumner
º Auburn
º Kent
º Tukwila
º Mukilteo
º Edmonds
º Lakewood
Figure 18: Sound Ridership, 2000 to 2035

C51
W S D O T | W A S H I N G T O N T R A N S P O R T A T I O N P L A N , P H A S E 2 – I M P L E M E N T A T I O N | 2 0 1 7 - 2 0 4 0
PUBLIC REVIEW DRAFT - SEPTEMBER 2017 - APPENDIX C
How does freight rail connect to other modes?Intermodal Rail Yards:
• Port of Seattle Intermodal Terminals
• Port of Tacoma Intermodal Terminals
• Tacoma South Intermodal Facility
• Seattle International Gateway
• Argo Intermodal Facility (Seattle)
• South Seattle Intermodal Facility
• Yardley Yard (Spokane)
• Port of Quincy Intermodal
• Port of Pasco Intermodal
How does passenger rail connect to other modes?Most stations are multimodal hubs with connections to transit, biking, walking, and taxis. Some are served by intercity bus (Greyhound).
What are the safety statistics for the rail system?According to the Federal Rail Administration Office of Safety Analysis, the number of highway-rail incidents were:
Table 20: Highway-Rail Incidents, 2014-2017
2014 2015 2016 2017
Count % Count % Count % Count %
Washington 2 1.2 4 2.1 3 2.3 1 0.8
National 167 100 194 100 132 100 124 100

C52
W S D O T | W A S H I N G T O N T R A N S P O R T A T I O N P L A N , P H A S E 2 – I M P L E M E N T A T I O N | 2 0 1 7 - 2 0 4 0
PUBLIC REVIEW DRAFT - SEPTEMBER 2017 - APPENDIX C
Total Total CY CountsMonth to
Month CountsJan-Dec
% Change Over Time
By Mode Type
Cases% of Total
CY 2013
CY 2014
CY 2015
CY 2015
CY 2016
CY 2013 to CY 2015
CY 2014 to CY 2015
Month to Month % Change CY
2015 to CY 2016
Grand Total 134 100.0 24 34 37 37 39 54.2 8.8 5.4
Automobile 60 44.8 6 16 14 14 24 133.3 -12.5 71.4
Pedestrian 24 17.9 9 6 3 3 6 -66.7 -50.0 100.0
Truck-trailer 21 15.7 3 3 8 8 7 166.7 166.7 -12.5
Pickup Truck 16 11.9 3 6 7 7 . 133.3 16.7 .
Other Motor Vehicle
5 3.7 1 2 1 1 1 . -50.0 .
Truck 4 3.0 1 1 1 1 1 . . .
Other 2 1.5 . . 2 2 . . . .
Van 1 0.7 1 . . . . . . .
Motorcycle 1 0.7 . . 1 1 . . . .
Table 20: Highway-Rail Incidents, January - December 2016
Highway-Rail IncidentsSelections: Railroad - All Railroads
State - Washington | County - All CountiesNo Region Selection
Public and Private RoadsCalendar Year (CY) January - December 2016
Last Database Reported Month/Year = 1/2017

C53
W S D O T | W A S H I N G T O N T R A N S P O R T A T I O N P L A N , P H A S E 2 – I M P L E M E N T A T I O N | 2 0 1 7 - 2 0 4 0
PUBLIC REVIEW DRAFT - SEPTEMBER 2017 - APPENDIX C
Total Total CY CountsMonth to
Month CountsJan-Dec
% Change Over Time
By Mode Type
Cases% of Total
CY 2014
CY 2015
CY 2016
CY 2016
CY 2017
CY 2014 to CY 2016
CY 2015 to CY 2016
Month to Month % Change CY
2016 to CY 2017
Grand Total 115 100.0 34 37 39 39 5 14.7 5.4 -87.2
Automobile 55 47.8 16 14 24 24 1 50.0 71.4 -95.8
Pedestrian 20 17.4 3 8 7 7 2 133.3 -12.5 -71.4
Truck-trailer 15 13.0 6 7 . . 2 . . .
Pickup Truck 15 13.0 6 3 6 6 . . 100.0 .
Other Motor Vehicle
4 3.5 2 1 1 1 . -50.0 . .
Truck 3 2.6 1 1 1 1 . . . .
Other 2 1.7 . 2 . . . . . .
Motorcycle 1 0.9 . 1 . . . . . .
Table 21: Highway-Rail Incidents, January - December 2017
Highway-Rail IncidentsSelections: Railroad - All Railroads
State - Washington | County - All CountiesNo Region Selection
Public and Private RoadsCalendar Year (CY) January - December 2017
Last Database Reported Month/Year = 1/2017

C54
W S D O T | W A S H I N G T O N T R A N S P O R T A T I O N P L A N , P H A S E 2 – I M P L E M E N T A T I O N | 2 0 1 7 - 2 0 4 0
PUBLIC REVIEW DRAFT - SEPTEMBER 2017 - APPENDIX C
How is freight rail funded?Private sources fund Class I Railroads. Occasionally, the Class Is have partnered with the public sector on capital projects such as grade crossings.
Public sources for Class III include:
• Freight Rail Assistance Program
• Freight Rail Investment Bank
How is passenger rail service funded?Amtrak is a government owned corporation funded by the federal government and fare box recovery.
Amtrak Cascades is funded by ticket sales and sponsorship by WSDOT and ODOT.
Sounder is a regional transit district located in portions of King, Snohomish, and Pierce counties. It is funded by sales and uses tax collected in the district; regional car tab tax (MVET) for vehicles registered in the district; regional property tax for properties located in the district; and rental car sales tax for transactions in the district.
Waterways: Ferries and Marine CargoWhat are the waterways? For the purposes of Phase 2, the following waterways are addressed:
• The Salish Sea (The Puget Sound, The Strait of Juan de Fuca, and The Strait of Georgia),
• Columbia-Snake River System
• Pacific Ocean coast
• Lake Chelan
What and where is ferry service? Ferry service includes the ferries regulated by the Utilities and Transportation Commission. Ferry service is located on the Salish Sea, the Columbia River, and Lake Chelan as shown on the table below.
Publicly owned ferries are
• A substitute for a bridge and managed as a road or highway.
• Public transportation and managed as a transit service

C55
W S D O T | W A S H I N G T O N T R A N S P O R T A T I O N P L A N , P H A S E 2 – I M P L E M E N T A T I O N | 2 0 1 7 - 2 0 4 0
PUBLIC REVIEW DRAFT - SEPTEMBER 2017 - APPENDIX C
Operator/ Manager Routes Purpose
# of Ferry Boats
# of Terminals
Funding Sources
Total Riders
(includes drivers)
2016
Total Vehicles
2016
WSDOT: WSF 14 across the Puget Sound
State Highway &
Transit22 20
State Gas Tax, FTA
Grant24,204,895 10,546,355
WSDOT: Eastern Region Keller Ferry
SR21 – across Lake Roosevelt
State Highway 1 0 State Gas
Tax54,020 (2015)
DSHS Steilacoom - McNeil Island Transit 1 0
State General
Fund
Colville Confederated Tribes
Gifford –Inchelium Highway 1 0 Tribal
820 (from WSDOT
traffic portal for SR 25)
King County Water Taxi
Vashon Island – Downtown
SeattleTransit 2 2
Property Tax, FTA
Grant601,942
Kitsap County Passenger Ferry
Bremerton-Annapolis &-Port
OrchardTransit 2 4
Local Sales Tax, FTA
Grant
Service Began in
2017
Service Began in
2017
Pierce CountySteilacoom-Anderson &
Ketron IslandsHighway 2 3
State Gas Tax, County
Road Fund
89,294 101,702
Skagit County Anacortes – Guemes Island Highway 1 2
State Gas Tax, County
Road Fund
194, 101 73,397
Wahkiakum County
Puget Island – Westport, OR Highway 1 2
County Road
Fund and WSDOT
47,450 (2015)
Whatcom County Bellingham area -Lummi Island Highway 1 2
State Gas Tax, County
Road Fund
186,097 114,268
Table 22: State, Tribal and Local Government Ferries
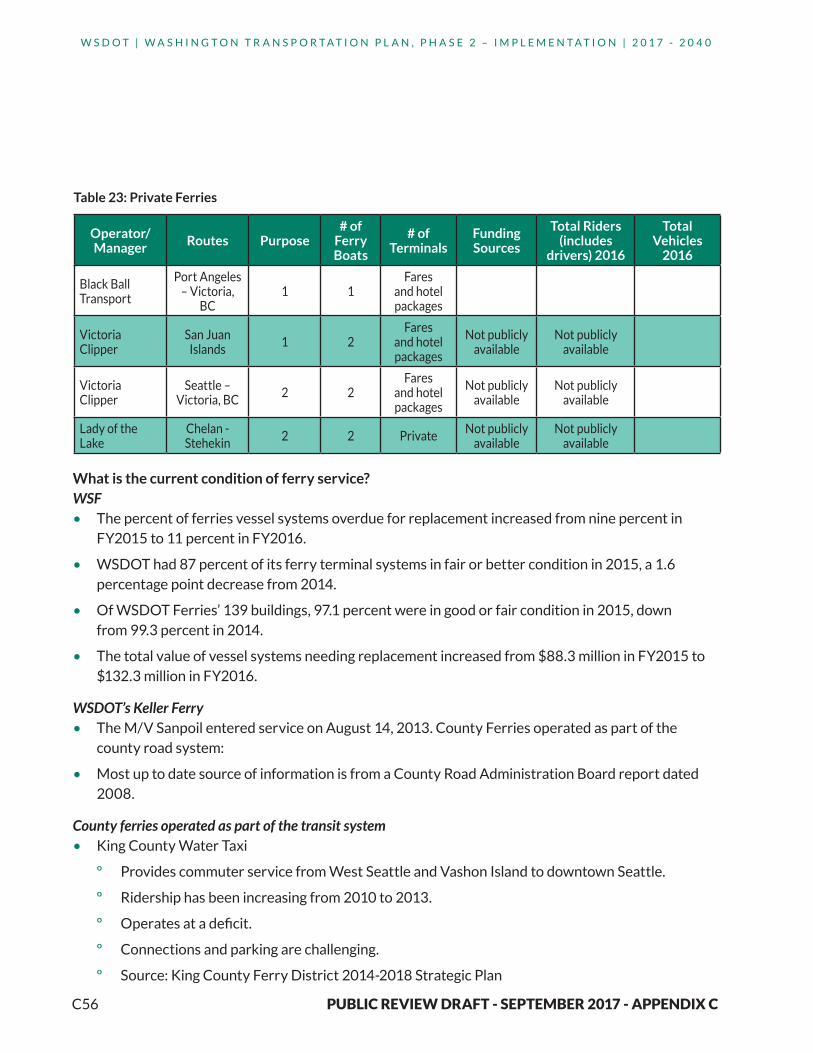
C56
W S D O T | W A S H I N G T O N T R A N S P O R T A T I O N P L A N , P H A S E 2 – I M P L E M E N T A T I O N | 2 0 1 7 - 2 0 4 0
PUBLIC REVIEW DRAFT - SEPTEMBER 2017 - APPENDIX C
Operator/ Manager Routes Purpose
# of Ferry Boats
# of Terminals
Funding Sources
Total Riders (includes
drivers) 2016
Total Vehicles
2016
Black Ball Transport
Port Angeles – Victoria,
BC1 1
Fares and hotel packages
Victoria Clipper
San Juan Islands 1 2
Fares and hotel packages
Not publicly available
Not publicly available
Victoria Clipper
Seattle – Victoria, BC 2 2
Fares and hotel packages
Not publicly available
Not publicly available
Lady of the Lake
Chelan - Stehekin 2 2 Private Not publicly
availableNot publicly
available
What is the current condition of ferry service? WSF• The percent of ferries vessel systems overdue for replacement increased from nine percent in
FY2015 to 11 percent in FY2016.
• WSDOT had 87 percent of its ferry terminal systems in fair or better condition in 2015, a 1.6 percentage point decrease from 2014.
• Of WSDOT Ferries’ 139 buildings, 97.1 percent were in good or fair condition in 2015, down from 99.3 percent in 2014.
• The total value of vessel systems needing replacement increased from $88.3 million in FY2015 to $132.3 million in FY2016.
WSDOT’s Keller Ferry• The M/V Sanpoil entered service on August 14, 2013. County Ferries operated as part of the
county road system:
• Most up to date source of information is from a County Road Administration Board report dated 2008.
County ferries operated as part of the transit system• King County Water Taxi
º Provides commuter service from West Seattle and Vashon Island to downtown Seattle.
º Ridership has been increasing from 2010 to 2013.
º Operates at a deficit.
º Connections and parking are challenging.
º Source: King County Ferry District 2014-2018 Strategic Plan
Table 23: Private Ferries
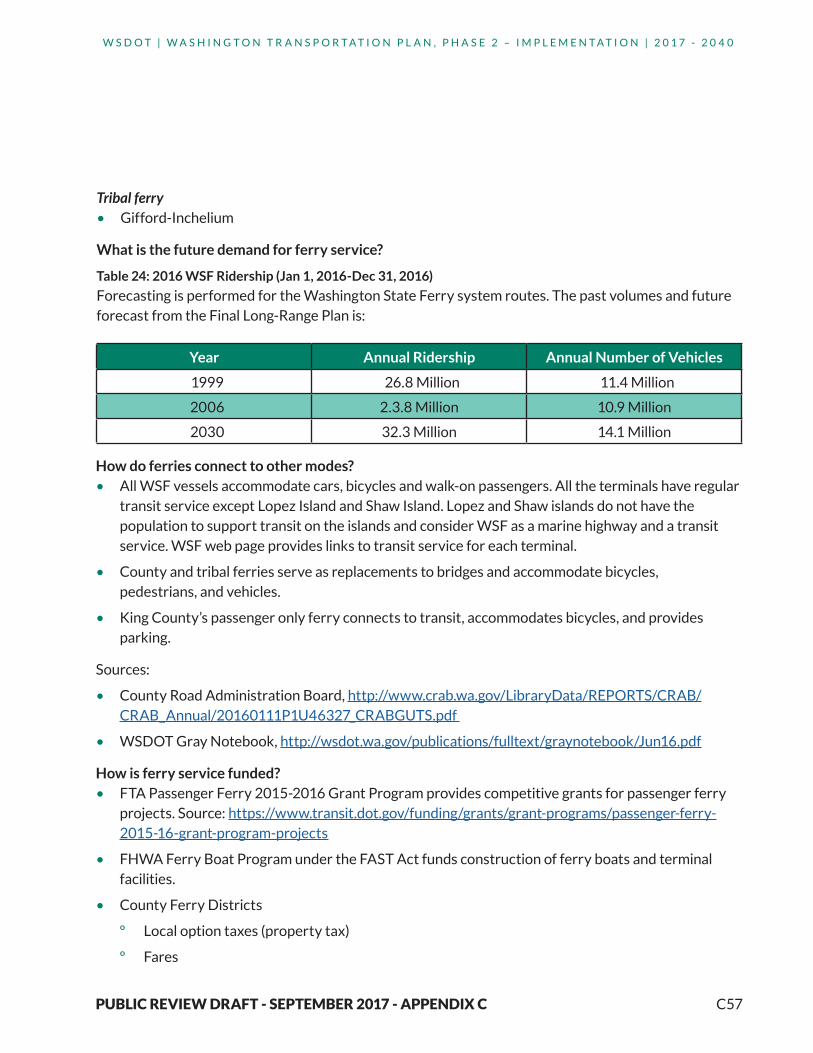
C57
W S D O T | W A S H I N G T O N T R A N S P O R T A T I O N P L A N , P H A S E 2 – I M P L E M E N T A T I O N | 2 0 1 7 - 2 0 4 0
PUBLIC REVIEW DRAFT - SEPTEMBER 2017 - APPENDIX C
Tribal ferry• Gifford-Inchelium
What is the future demand for ferry service?
Table 24: 2016 WSF Ridership (Jan 1, 2016-Dec 31, 2016)
Forecasting is performed for the Washington State Ferry system routes. The past volumes and future forecast from the Final Long-Range Plan is:
Year Annual Ridership Annual Number of Vehicles
1999 26.8 Million 11.4 Million
2006 2.3.8 Million 10.9 Million
2030 32.3 Million 14.1 Million
How do ferries connect to other modes?• All WSF vessels accommodate cars, bicycles and walk-on passengers. All the terminals have regular
transit service except Lopez Island and Shaw Island. Lopez and Shaw islands do not have the population to support transit on the islands and consider WSF as a marine highway and a transit service. WSF web page provides links to transit service for each terminal.
• County and tribal ferries serve as replacements to bridges and accommodate bicycles, pedestrians, and vehicles.
• King County’s passenger only ferry connects to transit, accommodates bicycles, and provides parking.
Sources:
• County Road Administration Board, http://www.crab.wa.gov/LibraryData/REPORTS/CRAB/CRAB_Annual/20160111P1U46327_CRABGUTS.pdf
• WSDOT Gray Notebook, http://wsdot.wa.gov/publications/fulltext/graynotebook/Jun16.pdf
How is ferry service funded?• FTA Passenger Ferry 2015-2016 Grant Program provides competitive grants for passenger ferry
projects. Source: https://www.transit.dot.gov/funding/grants/grant-programs/passenger-ferry-2015-16-grant-program-projects
• FHWA Ferry Boat Program under the FAST Act funds construction of ferry boats and terminal facilities.
• County Ferry Districts
º Local option taxes (property tax)
º Fares

C58
W S D O T | W A S H I N G T O N T R A N S P O R T A T I O N P L A N , P H A S E 2 – I M P L E M E N T A T I O N | 2 0 1 7 - 2 0 4 0
PUBLIC REVIEW DRAFT - SEPTEMBER 2017 - APPENDIX C
• Public Transportation Benefit Area
º Local option taxes (MVET, Sales Tax)
º Fares
• WSDOT
º Passenger fares
º Gas tax
What are the safety statistics for ferries?The rate of passenger injuries per million riders increased from 0.27 in the first quarter of FY2016 to 0.94 in the first quarter of FY2017, representing a jump from two to seven total passenger injuries.
The rate of Occupational Safety and Health Administration recordable crew injuries per 10,000 revenue service hours decreased from 4.4 in FY2016 to 3.0 in FY2017. This represents five less injuries compared to the same quarter in FY2016, and continues to be well below ferries’ annual goal of having a rate of less than 7.6 crew injuries per 10,000 revenue service hours.
Source: http://wsdot.wa.gov/publications/fulltext/graynotebook/Sep16.pdf#page=21
Waterways: Marine CargoWhat is the marine cargo system? Marine cargo uses ships and barges on the three commercially navigable waterways serving Washington:
• Pacific Ocean which is used to move freight to and from overseas markets on a variety of ships and barges from ports along the U.S. coast (including in Alaska) and Hawaii.
• Salish Sea, which provides access for major ports in western Washington to the Pacific Ocean.
• Columbia-Snake River System provides access for inland Washington ports to the Pacific Ocean.
How are the marine cargo facilities funded?Marine cargo uses public port districts that are created by voters and funded through:
• Property taxes
• Service fees
• Bonds
• Grants and gifts
What are the safety statistics for public port districts?The U.S. Coast Guard enforces the regulations under the International Convention for the Safety of Life at Sea on foreign- flagged vessels trading in US ports. Washington ports are in Sector Puget Sound. In 2016, the US Coast Guard conducted 390 safety inspections and 341 security examinations. They

C59
W S D O T | W A S H I N G T O N T R A N S P O R T A T I O N P L A N , P H A S E 2 – I M P L E M E N T A T I O N | 2 0 1 7 - 2 0 4 0
PUBLIC REVIEW DRAFT - SEPTEMBER 2017 - APPENDIX C
reported zero major control actions and 8 detentions. For more information, see https://www.uscg.mil/hq/cgcvc/cvc2/psc/annual_report/annualrpt16.pdf.
Existing FundingWhile Washington has emerged from the recent Great Recession 2007-2009, the state continues to face financial uncertainty. A mix of federal, state, and local sources fund Washington’s transportation infrastructure. State and federal motor fuel taxes provide the majority of transportation-related revenues. With motor fuel taxes unlinked to inflation and dependent on consumption rates, Washington should secure alternate funding sources, or move away from a flat fixed rate tax system. As the state’s transportation maintenance and improvement needs continue to outstrip revenue projections, Washington should prioritize use of existing primary funding sources to preserve the existing infrastructure and adopt user-based funding mechanisms for improvements necessary to maintain transportation system performance in the future. Source: WTP 2035 – Page 74
See individual modes for more information on funding.
Table 25: Forecast Biennium Comparison of All State Transportation Revenues November 2016 forecast - 10
year period
Source of Revenue2015-2017 Biennium
(millions of dollars)2017-2019 Biennium
(millions of dollars)
10-Year:2016-2025
(millions of dollars)
Motor Vehicle Fuel Tax
$3,288.78 $3,634.94 $18,109.20
Licenses, Permits, and Fees
$1,290.81 $1,471.20 $7,530.50
Ferry Revenues $376.20 $388.57 $1,978.92
Toll Revenue $367.98 $402.63 $2,133.09
Vehicle Sales Tax $93.35 $100.36 $520.45
Aviation Revenues $5.40 $6.85 $33.31
Rental Car Tax $65.22 $69.52 $359.61
Driver-Related Fees $303.49 $294.76 $1,507.32
Business/Other Revenues
$28.65 $32.61 $152.07
Total Projected Revenue
$5,819.89 $6,401.43 $32,324.47
Source: Washington State Transportation Revenue Forecast Council, Transportation Revenue Forecast
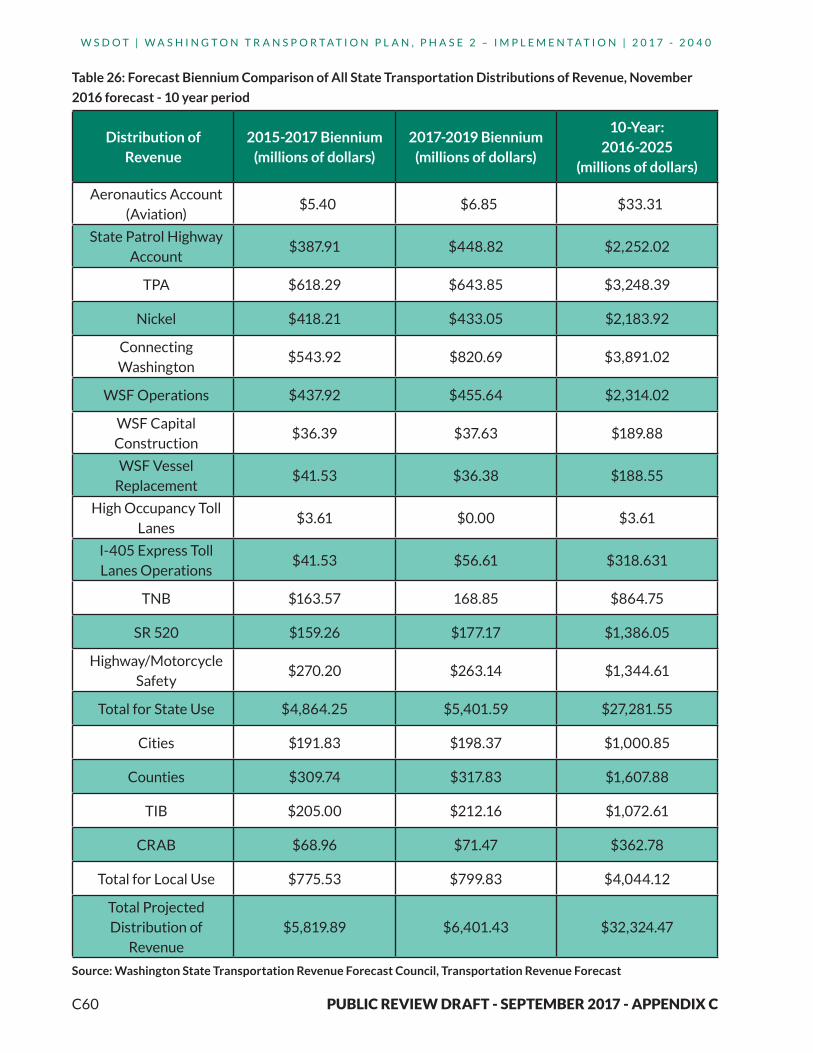
C60
W S D O T | W A S H I N G T O N T R A N S P O R T A T I O N P L A N , P H A S E 2 – I M P L E M E N T A T I O N | 2 0 1 7 - 2 0 4 0
PUBLIC REVIEW DRAFT - SEPTEMBER 2017 - APPENDIX C
Distribution of Revenue
2015-2017 Biennium(millions of dollars)
2017-2019 Biennium(millions of dollars)
10-Year:2016-2025
(millions of dollars)
Aeronautics Account (Aviation)
$5.40 $6.85 $33.31
State Patrol Highway Account
$387.91 $448.82 $2,252.02
TPA $618.29 $643.85 $3,248.39
Nickel $418.21 $433.05 $2,183.92
Connecting Washington
$543.92 $820.69 $3,891.02
WSF Operations $437.92 $455.64 $2,314.02
WSF Capital Construction
$36.39 $37.63 $189.88
WSF Vessel Replacement
$41.53 $36.38 $188.55
High Occupancy Toll Lanes
$3.61 $0.00 $3.61
I-405 Express Toll Lanes Operations
$41.53 $56.61 $318.631
TNB $163.57 168.85 $864.75
SR 520 $159.26 $177.17 $1,386.05
Highway/Motorcycle Safety
$270.20 $263.14 $1,344.61
Total for State Use $4,864.25 $5,401.59 $27,281.55
Cities $191.83 $198.37 $1,000.85
Counties $309.74 $317.83 $1,607.88
TIB $205.00 $212.16 $1,072.61
CRAB $68.96 $71.47 $362.78
Total for Local Use $775.53 $799.83 $4,044.12
Total Projected Distribution of
Revenue$5,819.89 $6,401.43 $32,324.47
Source: Washington State Transportation Revenue Forecast Council, Transportation Revenue Forecast
Table 26: Forecast Biennium Comparison of All State Transportation Distributions of Revenue, November
2016 forecast - 10 year period

C61
W S D O T | W A S H I N G T O N T R A N S P O R T A T I O N P L A N , P H A S E 2 – I M P L E M E N T A T I O N | 2 0 1 7 - 2 0 4 0
PUBLIC REVIEW DRAFT - SEPTEMBER 2017 - APPENDIX C
POPULATION DEMANDSThe state’s demographics are changing. Recent trends indicate the following:
• Statewide population is growing:
º 4.1 million in 1980.
º 6.7 million in 2010.
º From 2014 to 2015, the population increased by 93,200 to reach a statewide total of over 7 million. This was the largest one-year increase since 2008.
º 8.8 million in 2040 (projected).
• Urban areas are growing:
º 75 percent of new residents to the state live in the five largest metropolitan counties: Clark, King, Pierce, Snohomish and Spokane counties.
• Rural communities have affordable housing and transportation challenges.
º Housing may be more affordable in rural areas, but transportation can be a barrier to meeting basic needs. This is due to the distance to services and the inadequacy of public transportation, since low-density population equates to higher service costs.
º Roads are narrow and often have no shoulders for walking or biking.
• The population is aging:
º 1.2 million people, or 14 percent of the state’s total population, were 65 and older in 2015.
º A projected 1.85 million people, or 21 percent of the state’s total population, will be 65 and older in 2040.
º Aging populations often have disabling conditions or face other mobility challenges.
• The population is becoming more diverse:
º 30 percent of the state’s population represents non-white ethnicities and races.
º Washington is the third-most linguistically diverse state in the country with over 163 different languages spoken.
º Limited-English proficiency is a barrier to those who access information about transportation services.
• The statewide number of people with special needs is increasing. “Special needs” includes persons, including their personal attendants, who because of physical or mental disability, income status, or age are unable to transport themselves or to purchase appropriate transportation:
º 30 percent of the state’s population met the criteria in 2016.
º 40 percent of the state’s population are projected to meet the criteria in 2040.

C62
W S D O T | W A S H I N G T O N T R A N S P O R T A T I O N P L A N , P H A S E 2 – I M P L E M E N T A T I O N | 2 0 1 7 - 2 0 4 0
PUBLIC REVIEW DRAFT - SEPTEMBER 2017 - APPENDIX C
º In some rural areas, tribes provide the only public transportation for those with special needs.
• The millennial population in the state’s workforce is growing:
º By and large, this demographic group has chosen to live in areas with transportation options limited to driving-only.
• Poverty rates are growing (for a single-parent family with two children, poverty is defined at $20,090 per year or less):
º 14 percent of the state’s residents live in poverty.
º 19 percent of the state’s children live in poverty.
º An estimated 94 percent of welfare recipients do not own a car.
º 17 of 39 counties are considered “high poverty.”
º Increased housing costs are pushing people to less expensive suburban and rural areas. These areas have fewer transportation options. A recent study found that shorter commuting time is the single strongest factor in the odds of escaping poverty.
Source: Washington State Public Transportation Plan http://www.wsdot.wa.gov/Transit/TransportationPlan
EMPLOYMENT AND ECONOMIC CONDITION DEMANDS Distressed areas are counties where the three-year unemployment rate is at least 20 percent higher than the statewide average. The yearly list of distressed areas (Washington State counties) is compiled by averaging the employment and unemployment numbers for the previous three years. We create the distressed areas list in cooperation with the Federal Bureau of Labor Statistics. It is updated annually, usually in the spring.
For more information about distressed areas, see Chapter 43.168 of the Revised Code of Washington.

C63
W S D O T | W A S H I N G T O N T R A N S P O R T A T I O N P L A N , P H A S E 2 – I M P L E M E N T A T I O N | 2 0 1 7 - 2 0 4 0
PUBLIC REVIEW DRAFT - SEPTEMBER 2017 - APPENDIX C
Figure 19:Estimated Percentage of Population in Poverty by Census Block
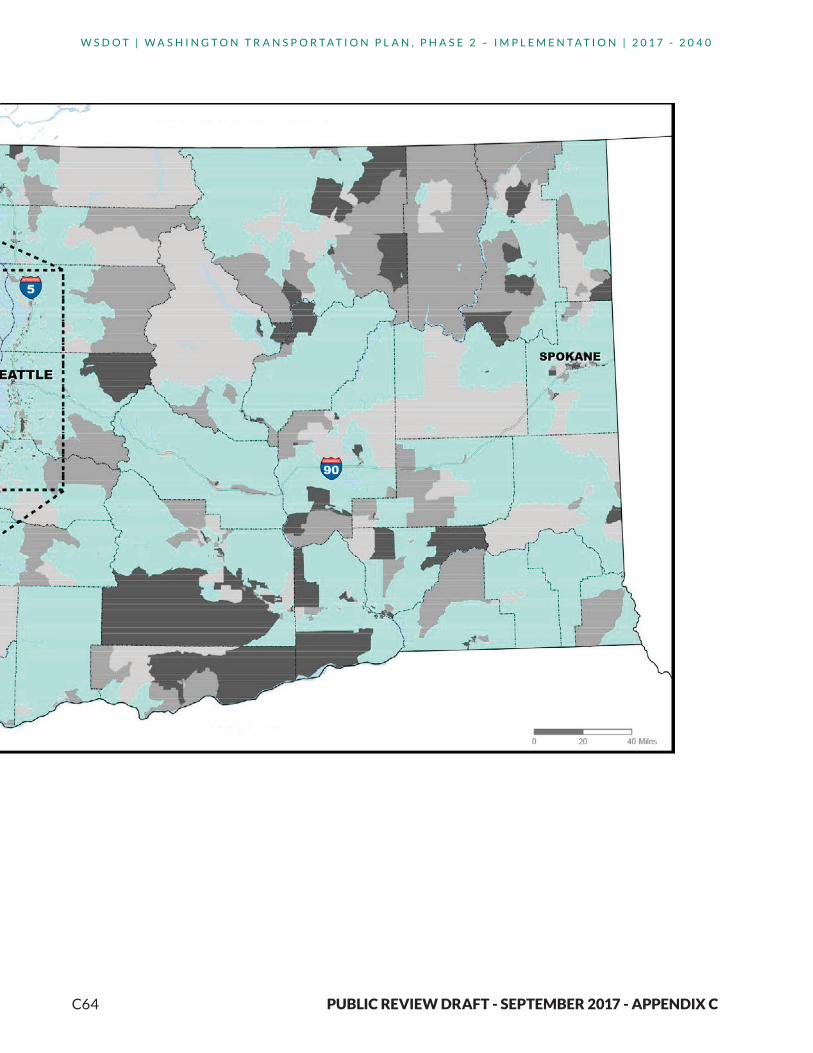
C64
W S D O T | W A S H I N G T O N T R A N S P O R T A T I O N P L A N , P H A S E 2 – I M P L E M E N T A T I O N | 2 0 1 7 - 2 0 4 0
PUBLIC REVIEW DRAFT - SEPTEMBER 2017 - APPENDIX C
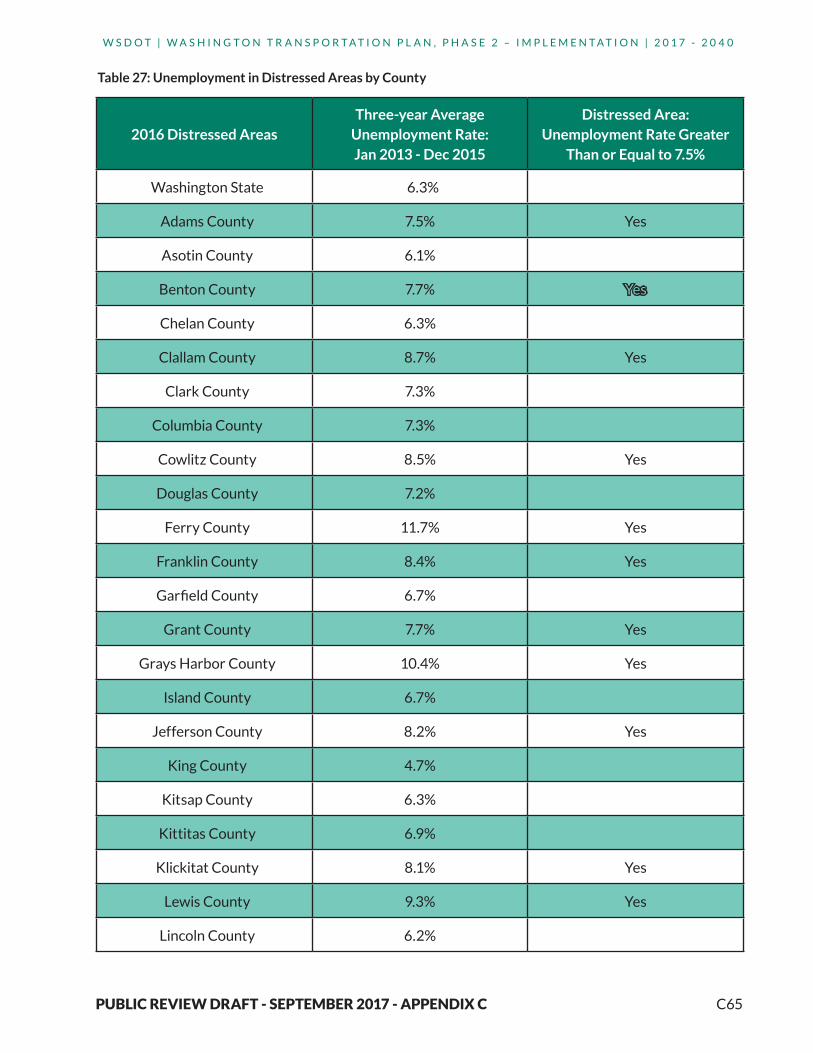
C65
W S D O T | W A S H I N G T O N T R A N S P O R T A T I O N P L A N , P H A S E 2 – I M P L E M E N T A T I O N | 2 0 1 7 - 2 0 4 0
PUBLIC REVIEW DRAFT - SEPTEMBER 2017 - APPENDIX C
2016 Distressed AreasThree-year Average
Unemployment Rate: Jan 2013 - Dec 2015
Distressed Area: Unemployment Rate Greater
Than or Equal to 7.5%
Washington State 6.3%
Adams County 7.5% Yes
Asotin County 6.1%
Benton County 7.7% Yes
Chelan County 6.3%
Clallam County 8.7% Yes
Clark County 7.3%
Columbia County 7.3%
Cowlitz County 8.5% Yes
Douglas County 7.2%
Ferry County 11.7% Yes
Franklin County 8.4% Yes
Garfield County 6.7%
Grant County 7.7% Yes
Grays Harbor County 10.4% Yes
Island County 6.7%
Jefferson County 8.2% Yes
King County 4.7%
Kitsap County 6.3%
Kittitas County 6.9%
Klickitat County 8.1% Yes
Lewis County 9.3% Yes
Lincoln County 6.2%
Table 27: Unemployment in Distressed Areas by County

C66
W S D O T | W A S H I N G T O N T R A N S P O R T A T I O N P L A N , P H A S E 2 – I M P L E M E N T A T I O N | 2 0 1 7 - 2 0 4 0
PUBLIC REVIEW DRAFT - SEPTEMBER 2017 - APPENDIX C
2016 Distressed AreasThree-year Average
Unemployment Rate: Jan 2013 - Dec 2015
Distressed Area: Unemployment Rate Greater
Than or Equal to 7.5%
Mason County 8.7% Yes
Okanogan County 7.6% Yes
Pacific County 10.1% Yes
Pend Oreille County 10.5% Yes
Pierce County 7.2%
San Juan County 5.3%
Skagit County 7.5% Yes
Skamania County 8.5% Yes
Snohomish County 5.3%
Spokane County 7.2%
Stevens County 9.7% Yes
Thurston County 6.7%
Wahkiakum County 10.3% Yes
Walla Walla County 6.4%
Whatcom County 6.6%
Whitman County 5.3%
Yakima County 8.9% Yes
¹ Prepared by Washington State Employment Security Department in cooperation with the federal Bureau of Labor Sta-tistics https://fortress.wa.gov/esd/employmentdata/reports-publications/regional-reports/distressed-areas-list.
Table 27: Unemployment in Distressed Areas by County (continued)
C67
W S D O T | W A S H I N G T O N T R A N S P O R T A T I O N P L A N , P H A S E 2 – I M P L E M E N T A T I O N | 2 0 1 7 - 2 0 4 0
PUBLIC REVIEW DRAFT - SEPTEMBER 2017 - APPENDIX C
FREIGHT DEMANDSOn a per capita basis, Washington is the most trade-dependent state in the nation (followed by Texas and Louisiana) with total imports and exports valued at $137.5 billion and gross business income for freight-dependent industry sectors valued at $550.5 billion in 2015. This is up from Washington’s third-place position in 2014.
WSDOT supports freight systems and freight-dependent industries by directly managing the state’s highway system, ferry system, a short line railroad and several freight rail programs. WSDOT also provides policy analysis and planning coordination for the state’s interests in all modes of the state’s freight transportation system. The state’s multimodal freight system extends beyond the network of highways and local roads, mainline and short line railroads, and navigable waterways. It also includes the rail terminals, ports, air cargo facilities, weigh stations, border crossings and other infrastructure involved in the movement of goods and commerce. WSDOT’s work on freight movement contributes to “Goal 2: Prosperous Economy” in Results Washington, Gov. Jay Inslee’s performance management effort, by improving travel and freight reliability on strategic corridors. Source: GNB 62
See individual modes for more information on current and future freight demand. Updated freight information was not available. It will be with the state’s 2017 Freight System Plan due in December 2017.