Embed Size (px)
Citation preview

Technical Justification for the ENIQ 2nd Pilot Study
December 2005
ENIQ Report nr. 26
EUR 22208 EN

Mission of the Institute for Energy The Institute for Energy provides scientific and technical support for the conception, development, implementation and monitoring of community policies related to energy. Special emphasis is given to the security of energy supply and to sustainable and safe energy production. European Commission Directorate-General Joint Research Centre (DG JRC) http://www.jrc.cec.eu.int/ Institute for Energy, Petten (the Netherlands) http://ie.jrc.cec.eu.int/ Contact details: Arne Eriksson Tel: +31 (0) 224 56 5383 E-mail: [email protected] Legal Notice Neither the European Commission nor any person acting on behalf of the Commission is responsible for the use which might be made of this publication. The use of trademarks in this publication does not constitute an endorsement by the European Commission. The views expressed in this publication are the sole responsibility of the author and do not necessarily reflect the views of the European Commission. © European Communities, 2006 Reproduction is authorised provided the source is acknowledged. Printed in the Netherlands Cover: JRC IE R. Houghton (No commercial use. Credit “Audiovisual Library European Commission”.)
European Commission Directorate General Joint Research Centre Institute for Energy Petten, The Netherlands
TECHNICAL JUSTIFICATION FOR THE ENIQ 2nd PILOT STUDY
December 2005 ENIQ Report nr. 26 EUR 22208 EN
Approved by the Steering Committee of ENIQ for publication


Foreword
The present work is one outcome of the activity of the ENIQ Task Group for Qualification (TGQ) on the ENIQ Second Pilot Study. ENIQ, the European Network for Inspection and Qualification, is driven by the nuclear utilities in the European Union and Switzerland and managed by the European Commission’s Joint Research Centre (JRC). It is active in the field of in-service inspection (ISI) of nuclear power plants by non-destructive testing (NDT), and works mainly in the areas of Qualification of NDT systems and Risk-informed in-service inspection (RI-ISI). This technical work is performed in two task groups: TG Qualification and TG Risk. A key achievement of ENIQ has been the issue of a European Qualification Methodology Document, which has been widely adopted across Europe. This document defines an approach to the qualification of inspection procedures, equipment and personnel based on a combination of technical justification (TJ) and test piece trials (open or blind). The TJ is a crucial element in the ENIQ approach, containing evidence justifying that the proposed inspection will meet its objectives in terms of defect detection and sizing capability. A Qualification Body reviews the TJ and the results of any test piece trials and it issues the qualification certificates. ENIQ has previously conducted a pilot study to assess the feasibility of the ENIQ Methodology in practice. This first pilot study was successful but, because the component chosen for the study was an austenitic weld, could not fully explore the use of TJs. This is because techniques such as mathematical modelling, at the time of the study, tended to be applicable only to isotropic materials. Assessment of the inspectability of austenitic welds usually requires the use of test pieces with the same metallurgical structure. Accordingly, ENIQ decided to conduct a second pilot study using a ferritic BWR-type nozzle to shell weld as the subject of the study. The main objective of the 2nd pilot study was to show how to fully exploit the potential of TJs in the qualification of inspection procedures and thereby reduce the number of test piece trials on full-scale components. A specification was drawn up of the clad ferritic BWR-type nozzle to shell weld and the defects that the inspection was required to find. An automated ultrasonic inspection was designed to detect them. The evidence in this TJ came mainly from physical reasoning, theoretical modelling and results from previous work. The effect of the cladding was quantified partly using new experimental measurements on a clad “parametric studies” block, and partly from existing evidence in the literature. However, in the event, lack of resources or time limitations prevented some of the measures that would normally be taken in producing a TJ such as parametric studies of the influence of cladding. Nevertheless, a TJ has been
1

produced which predicts whether the designated inspection would be successful in detecting the specified range of defects in the test piece. This TJ has been assessed in the Second Pilot Study by comparing its findings with the outcome of a practical inspection, conducted on a full-scale mock-up of the clad ferritic nozzle-to-shell weld component containing deliberately introduced defects. The outcome of this assessment is reported in the Final Report on the Second Pilot Study [ENIQ Report no 27]. This TJ has been developed as a consensus document amongst the members of TGQ. It is believed by TGQ to contain the right level of information for this particular application. It also represents the first practical use of the revised Recommended Practice 1 on Influential/essential parameters (Issue 2, EUR 21751EN). However, it is recognised that some issues have not been addressed sufficiently in this TJ due to limited timescales and shortage of funds. It is also emphasised that every TJ is different and the balance of contents on the various issues covered will depend on the particular application. The contributors, in alphabetical order, are listed below. Special recognition should be given to Ian Atkinson, KANDE International, who has authored this TJ and edited it in accordance with comments from other ENIQ members. Thanks are also due to several specific individuals listed below who made a particularly significant input into the commenting process. J-A Berglund Ringhals NPP, Sweden R Booler Inspection Validation Centre, Serco, United Kingdom, Chairman of Task Group Qualification since November 2005 R Chapman British Energy, United Kingdom D Couplet Tractebel, Belgium A Eriksson Directorate General JRC, European Commission L Horácek NRI- Řež, Czech Republic A Jonsson Forsmark NPP, Sweden P Kelsey Rolls-Royce Marine Power, United Kingdom P Krebs Engineer Consulting, Switzerland L Le Ber CEA – Saclay, France B Neundorf Vattenfall Europe Nuclear Energy, Germany T Seldis Directorate General JRC, European Commission, Co-chairman of TGQ H Söderstrand SQC Swedish NDT Qualification Centre, Sweden C Waites Serco, United Kingdom A Walker Rolls-Royce Marine Power, United Kingdom J Whittle John Whittle & Associates, United Kingdom, Chairman of TGQ until November 2005 H Wirdelius SQC Swedish NDT Qualification Centre, Sweden
2

The Steering Committee of ENIQ has formally approved this Technical Justification for publication as an ENIQ report during the 29th SC meeting held in Petten (NL) on 13-14 December 2005. The voting members of the Steering Committee of ENIQ are, in alphabetical order: R Chapman British Energy, United Kingdom, ENIQ Chairman D Couplet Tractebel, Belgium C Faidy EDF-Septen, France K Hukkanen Teollisuuden Voima OY, Finland P Krebs Engineer Consulting, Switzerland B Neundorf Vattenfall Europe Nuclear Energy, Germany, ENIQ Vice-Chairman J Neupauer Slovenské Elektrárne, Slovakia S Pérez Iberdrola, Spain U Sandberg Forsmark NPP, Sweden J Shejbal Dukovany NPP, Czech Republic D Szabó Paks NPP, Hungary R Van Beusekom EPZ, The Netherlands European Commission representatives in the Steering Committee: A Eriksson Directorate General JRC, European Commission, ENIQ Network Manager T Seldis Directorate General JRC, European Commission, Scientific Secretary to ENIQ
3

4
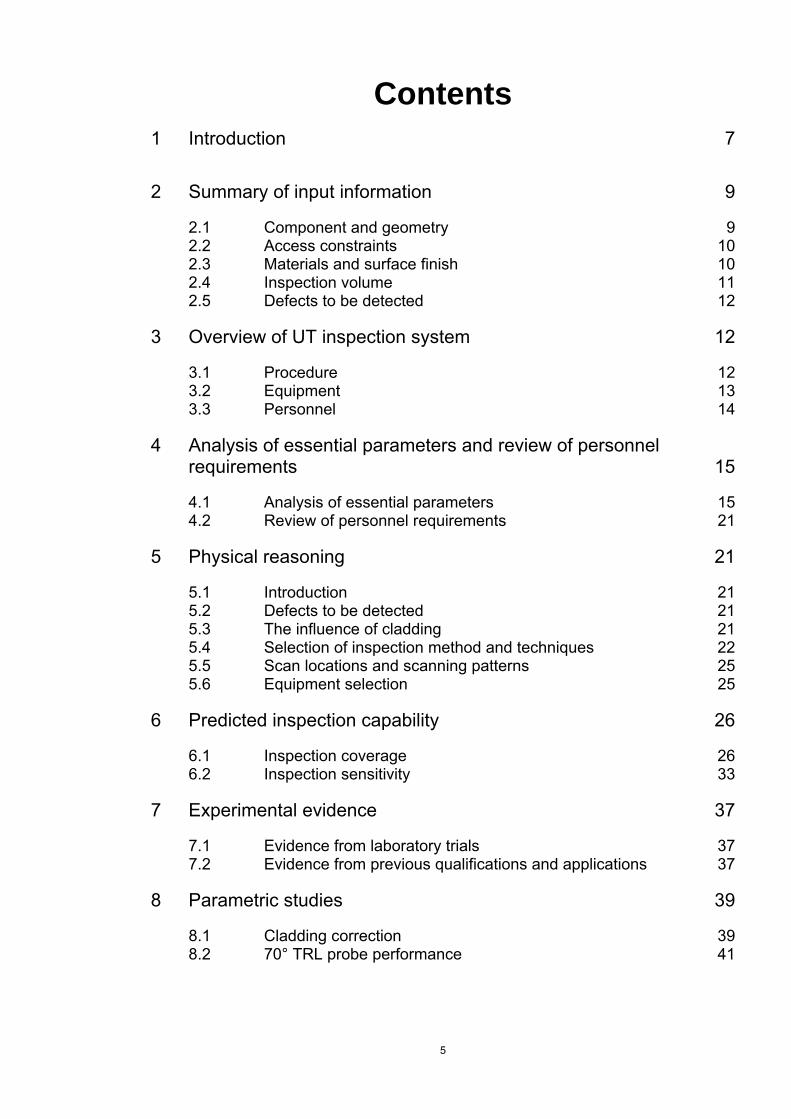
Contents 1 Introduction 7
2 Summary of input information 9
2.1 Component and geometry 9 2.2 Access constraints 10 2.3 Materials and surface finish 10 2.4 Inspection volume 11 2.5 Defects to be detected 12
3 Overview of UT inspection system 12
3.1 Procedure 12 3.2 Equipment 13 3.3 Personnel 14
4 Analysis of essential parameters and review of personnel requirements 15
4.1 Analysis of essential parameters 15 4.2 Review of personnel requirements 21
5 Physical reasoning 21
5.1 Introduction 21 5.2 Defects to be detected 21 5.3 The influence of cladding 21 5.4 Selection of inspection method and techniques 22 5.5 Scan locations and scanning patterns 25 5.6 Equipment selection 25
6 Predicted inspection capability 26
6.1 Inspection coverage 26 6.2 Inspection sensitivity 33
7 Experimental evidence 37
7.1 Evidence from laboratory trials 37 7.2 Evidence from previous qualifications and applications 37
8 Parametric studies 39
8.1 Cladding correction 39 8.2 70° TRL probe performance 41
5
9 Equipment and data analysis considerations 42
9.1 Evidence in support of selected hardware 42 9.2 Evidence in support of selected software 44
10 Review of evidence and statement of capability 45
11 Input on test-pieces for practical trials 48
12 Conclusions and recommendations 49
13 References 50
Appendix 1: Set 2 essential parameters of the NDT system group 53
6

1 Introduction
The objective of the ENIQ (European Network for Inspection and Qualification) 2nd Pilot Study (1) is to show how to fully exploit the potential of technical justifications in the qualification of inspection procedures and thereby reduce the need to perform test piece trials on full-scale components. This document is a model technical justification (TJ) developed to illustrate the use of TJs in the qualification process. In order to be realistic it addresses an actual inspection, namely the defect detection elements of a procedure for the ultrasonic inspection of a BWR nozzle to shell weld testpiece. This testpiece is designated ENIQ nozzle assembly 21 and is populated with deliberately introduced defects. It should be noted that the purpose of the testpiece is to enable the simulation of a real inspection and not to provide testpiece data for this TJ or for qualification trials. It is intended that the predictions made within the TJ will be tested against the results obtained from an inspection performed on the test piece using the selected procedure. The results will be used to assess the adequacy of the TJ alone for qualification, and hence show the extent to which qualification of the inspection procedure needs large scale test piece trials. The way in which this TJ has been produced is not consistent with the normal sequence of events in a qualification exercise. It has been written after the inspection has been performed, although without benefit of knowledge of the performance achieved. In addition resource constraints have restricted the amount of work performed on development trials and parametric studies. Consequently there are a number of areas where the evidence supporting the capability claimed for the inspection procedure is not as strong as would have been expected if the procedure and TJ had been developed in parallel, with an iterative approach being taken to address potential weaknesses in the procedure as they were identified. Where particular examples of this nature have been identified, comments to this effect have been included in the form of footnotes to the text. This TJ is written according to the guidelines given in the ENIQ Recommended Practice 2 Issue 1 (2) and in Recommended Practice 1 Issue 2 (3). It is based in part upon an earlier draft document (4). Section 2 summarises the input information that is relevant to the capability of the inspection. Section 3 provides an overview of the inspection system describing the basic principles of the procedure and summarises the main items of equipment. Section 4 makes an assessment of the main factors (the Set 1 essential parameters) that affect the capability and performance of the inspection. These
7

parameters define the limits for which the capability as described in this Technical Justification is valid. Section 5 describes the physical reasoning that has been used to select and define the inspection techniques and includes the choice of probe frequency, beam angles and crystal size. Section 6 provides a prediction of the inspection capability based upon geometric modelling of inspection coverage for the ultrasonic beams used and amplitude response modelling for a range of hypothetical defects, including some considered to be “worst case”. The models used ignore the effects of the austenitic cladding which is present on nozzle assembly 21. Section 7 provides supporting experimental evidence from inspections of test specimens containing real and artificial defects, performed in previous studies. Section 8 gives evidence derived from parametric studies on the effects of austenitic cladding on beam propagation and defect response. This is used with the modelling predictions from section 6, to show whether the inspection techniques applied are capable of detecting the defects of concern in Nozzle Assembly 21. Section 9 demonstrates why the equipment that has been selected for the inspection is capable of meeting the inspection objectives. Section 10 gives a statement of capability which summarises how the evidence that has been given in the previous sections demonstrates the extent to which the inspection techniques and equipment are able to meet the inspection objectives. Section 11 provides advice to the qualification body on the selection and positioning of defects within the test-pieces, which in the case of a real qualification might be required for performing any necessary open and blind trials. In the present exercise there is no intention to produce such testpieces. However, this section has been retained to show what would be expected in the case of a TJ for a real qualification. Section 12 presents the conclusions of this technical justification. Section 13 lists the references used to support the arguments advanced in this document. Appendix 1 presents a list of all the Set 2 essential parameters that have been considered in the course of the production of this TJ but which are not addressed explicitly elsewhere in the text.
8

2 Summary of input information
2.1 Component and geometry
2.1.1 Component description The component is a full-scale nozzle assembly (Nozzle Assembly 21) and is a replica of a BWR nozzle to shell weld. It consists of a ferritic steel shell plate, curved in one direction, into which is welded a forged ferritic steel nozzle. The inner surface of the component is clad with two layer austenitic stainless steel strip cladding. The main dimensions of the component are given in Table 1:
Dimension Value Shell inner diameter 6430mm
Shell thickness 160mm (plus cladding) Nozzle inner diameter 270mm Shell-weld diameter 700mm
Weld preparation angle 4° relative to nozzle axis Nozzle inner surface to shell-weld
centre 215mm
Nozzle inner corner radius 95mm
Cladding 2 layer strip, 60 mm width. Thickness = 6-8 mm. Aligned parallel to shell axis1
Table 1: Main dimensions of ENIQ nozzle assembly 21
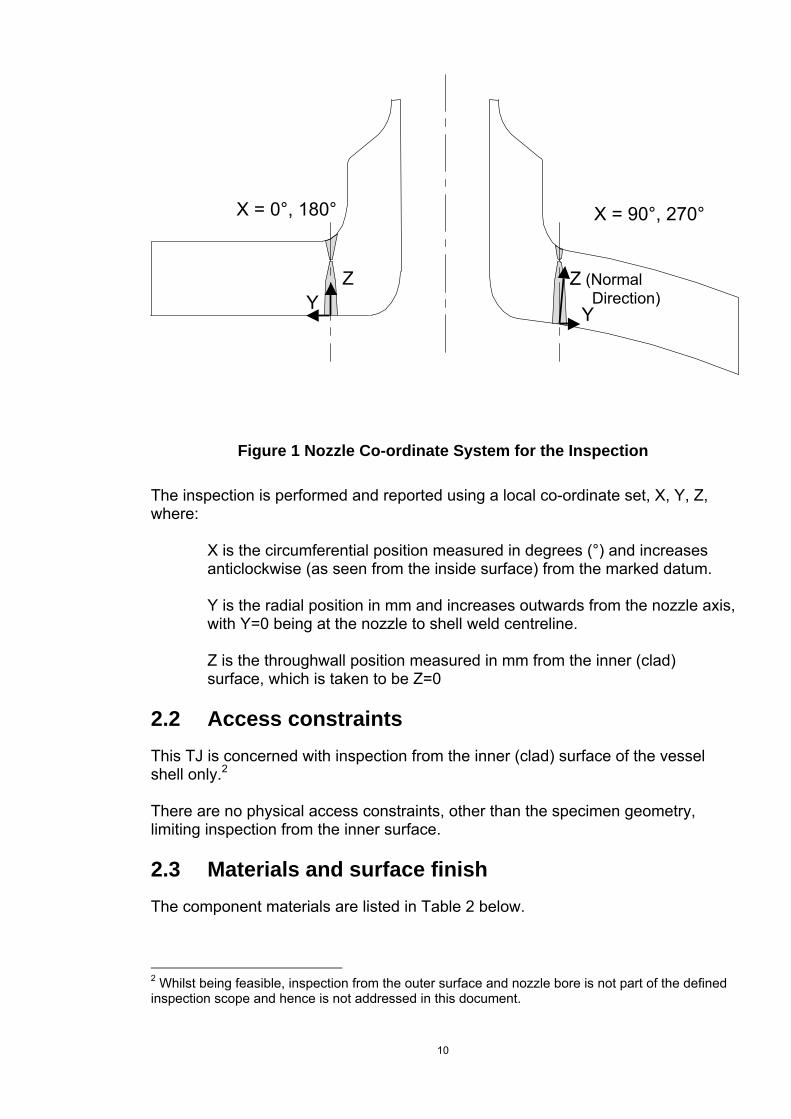
2.1.2 Component geometry The component is a conventional set-in nozzle design. Figure 1 shows sections through the component at the 0° and 90° positions. The weld is located in cylindrical geometry and has the characteristic that the root occurs at a constant axial location with respect to the nozzle axis. This means that the depth of the root from the vessel surface varies with azimuthal location. The inspection procedure (5) specifies a co-ordinate system. This co-ordinate system is marked onto Figure 1 and described below.
1 The alignment of the cladding on nozzle assembly 21 is not typical of usual practice. Usually cladding is applied circumferentially around a cylindrical vessel.
9
X = 0°, 180° X = 90°, 270°
Z (Normal Direction)
Y
ZY
Figure 1 Nozzle Co-ordinate System for the Inspection The inspection is performed and reported using a local co-ordinate set, X, Y, Z, where:
X is the circumferential position measured in degrees (°) and increases anticlockwise (as seen from the inside surface) from the marked datum.
Y is the radial position in mm and increases outwards from the nozzle axis, with Y=0 being at the nozzle to shell weld centreline. Z is the throughwall position measured in mm from the inner (clad) surface, which is taken to be Z=0
2.2 Access constraints This TJ is concerned with inspection from the inner (clad) surface of the vessel shell only.2 There are no physical access constraints, other than the specimen geometry, limiting inspection from the inner surface. 2.3 Materials and surface finish The component materials are listed in Table 2 below.
2 Whilst being feasible, inspection from the outer surface and nozzle bore is not part of the defined inspection scope and hence is not addressed in this document.
10

Item Material CommentsShell Plate Ferritic Steel 3
Nozzle Forging Ferritic Steel Nozzle to Shell Weld Ferritic Steel Cladding Austenitic Stainless Steel 2 layer 60mm strip cladding
applied parallel to shell axis
Table 2 Material details for the ENIQ nozzle assembly 21 Weld caps have been removed and surface roughness in the inspection area is required to be 6.3µm Ra or better. In addition there should be no coatings or protective layers present which would limit inspection capability. No limits for surface error of form are specified.4 2.4 Inspection volume The inspection volume covers the inner third of the vessel thickness in the region of the weld and the heat affected zone (HAZ). The thickness of the vessel plus cladding is nominally 168mm maximum, the width of the weld at the surface is approximately 50mm and the HAZ is taken to be up to 10mm wide. Hence the inspection volume is effectively 70mm wide by 56mm deep and extends around the full circumference of the weld.
Figure 2 Inspection volume
3 Information on material grade would normally be included. 4 Generally it is expected that surface error of form should also be addressed.
10 mmShell Side Nozzle Side
Clad Surface
56 mm
m70 m
11
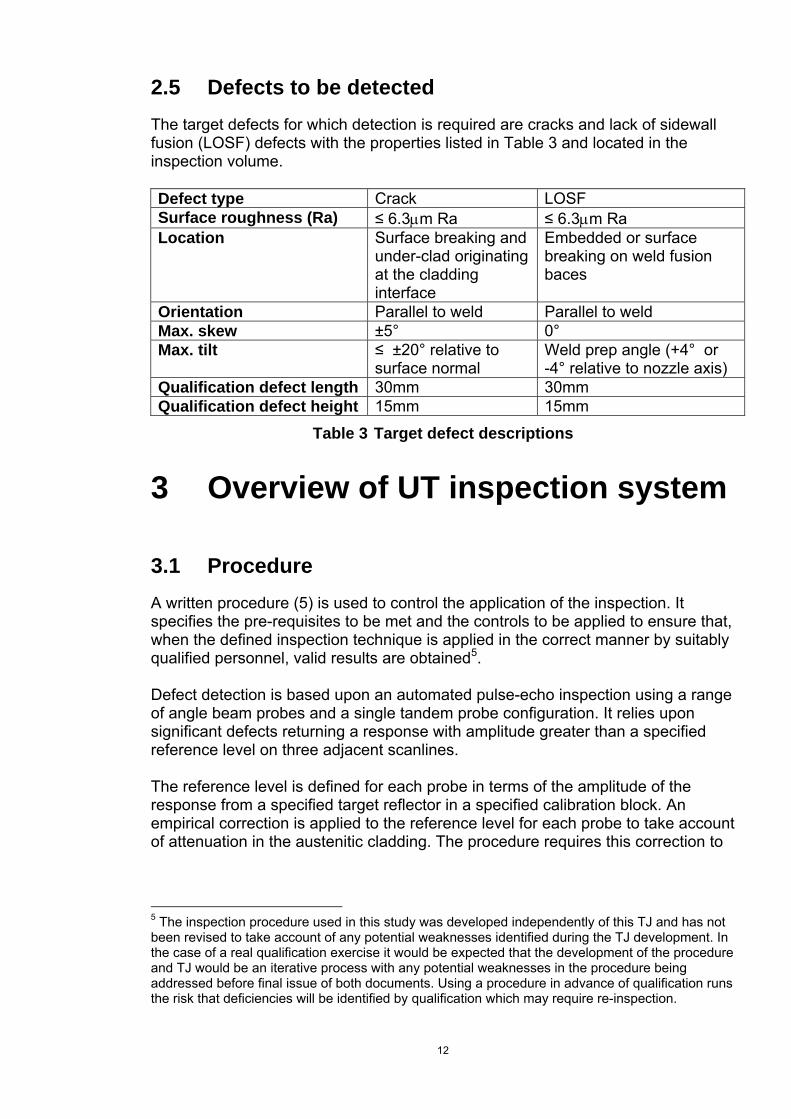
2.5 Defects to be detected The target defects for which detection is required are cracks and lack of sidewall fusion (LOSF) defects with the properties listed in Table 3 and located in the inspection volume. Defect type Crack LOSF Surface roughness (Ra) ≤ 6.3µm Ra ≤ 6.3µm Ra Location Surface breaking and
under-clad originating at the cladding interface
Embedded or surface breaking on weld fusion baces
Orientation Parallel to weld Parallel to weld Max. skew ±5° 0° Max. tilt ≤ ±20° relative to
surface normal Weld prep angle (+4° or -4° relative to nozzle axis)
Qualification defect length 30mm 30mm Qualification defect height 15mm 15mm
Table 3 Target defect descriptions
3 Overview of UT inspection system
3.1 Procedure A written procedure (5) is used to control the application of the inspection. It specifies the pre-requisites to be met and the controls to be applied to ensure that, when the defined inspection technique is applied in the correct manner by suitably qualified personnel, valid results are obtained5. Defect detection is based upon an automated pulse-echo inspection using a range of angle beam probes and a single tandem probe configuration. It relies upon significant defects returning a response with amplitude greater than a specified reference level on three adjacent scanlines. The reference level is defined for each probe in terms of the amplitude of the response from a specified target reflector in a specified calibration block. An empirical correction is applied to the reference level for each probe to take account of attenuation in the austenitic cladding. The procedure requires this correction to
5 The inspection procedure used in this study was developed independently of this TJ and has not been revised to take account of any potential weaknesses identified during the TJ development. In the case of a real qualification exercise it would be expected that the development of the procedure and TJ would be an iterative process with any potential weaknesses in the procedure being addressed before final issue of both documents. Using a procedure in advance of qualification runs the risk that deficiencies will be identified by qualification which may require re-inspection.
12

be based upon the results of parametric studies into the influence of 2 layer strip austenitic cladding on inspection sensitivity.6 The probes are scanned over the surface of the component in order to achieve coverage of the inspection volume. Scanning is performed using an automated manipulator controlled by the inspection system. The component geometry and the size of the probes used limit the coverage achievable with some probes deployed from the nozzle side of the weld. Checks on system performance are performed before, during and after inspection to ensure the correct operation of key components. Inspection data are analysed off-line. 3.2 Equipment
3.2.1 Probes Near vertical defects in the nominal depth zone 20mm - 60mm are sought for using conventional single crystal, low frequency (1.5MHz) 45° shear wave probes in a tandem arrangement directed radially towards the nozzle axis. Tilted defects extending into this depth zone are sought using 1.5MHz 70°, 60° and 45° angled shear wave probes scanned radially towards and away from the nozzle axis. In-cladding and underclad defects down to a depth of 20mm are sought using 2MHz, 70°, twin crystal, angled compression wave (TRL) probes focussed at 8mm and 12mm depth. Details of the probes are given in Table 4 below. All probes have a case size of 40mm x 40mm and flat contact areas. Angle ° Mode Frequency
MHzNo. of elements
Element size mm
Comment
45 Shear 1.5 1 32x25 Also used in tandem configuration with separation of 220mm
60 Shear 1.5 1 32x21 70 Shear 1.5 1 32x18 70 Comp. 2 2 2(25x15) Focal depth 12mm 70 Comp. 2 2 2(Ø18) Focal depth 8mm
Table 4 Inspection probe parameters
6 This was the intent as stated in the inspection procedure; in practice a correction of 6dB was applied based on previous experience and the avoidance of high noise levels when the probes were applied to the component.
13
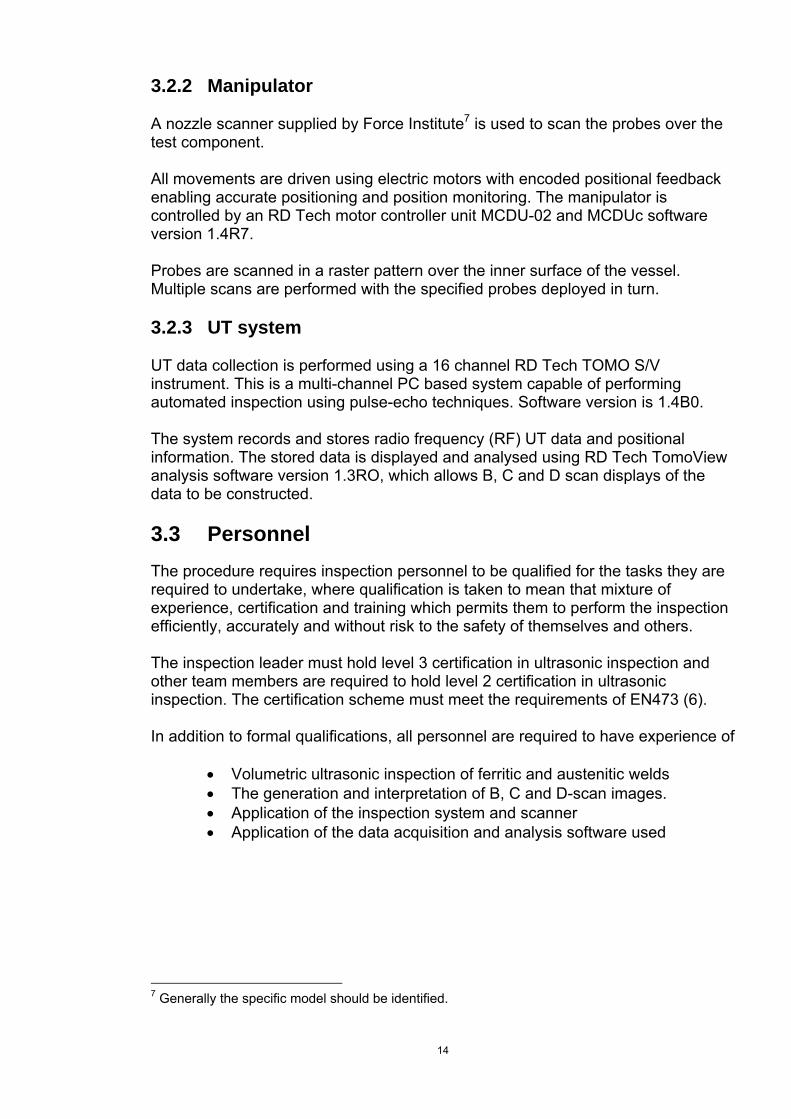
3.2.2 Manipulator A nozzle scanner supplied by Force Institute7 is used to scan the probes over the test component.
All movements are driven using electric motors with encoded positional feedback enabling accurate positioning and position monitoring. The manipulator is controlled by an RD Tech motor controller unit MCDU-02 and MCDUc software version 1.4R7. Probes are scanned in a raster pattern over the inner surface of the vessel. Multiple scans are performed with the specified probes deployed in turn. 3.2.3 UT system UT data collection is performed using a 16 channel RD Tech TOMO S/V instrument. This is a multi-channel PC based system capable of performing automated inspection using pulse-echo techniques. Software version is 1.4B0. The system records and stores radio frequency (RF) UT data and positional information. The stored data is displayed and analysed using RD Tech TomoView analysis software version 1.3RO, which allows B, C and D scan displays of the data to be constructed. 3.3 Personnel The procedure requires inspection personnel to be qualified for the tasks they are required to undertake, where qualification is taken to mean that mixture of experience, certification and training which permits them to perform the inspection efficiently, accurately and without risk to the safety of themselves and others. The inspection leader must hold level 3 certification in ultrasonic inspection and other team members are required to hold level 2 certification in ultrasonic inspection. The certification scheme must meet the requirements of EN473 (6). In addition to formal qualifications, all personnel are required to have experience of
• Volumetric ultrasonic inspection of ferritic and austenitic welds • The generation and interpretation of B, C and D-scan images. • Application of the inspection system and scanner • Application of the data acquisition and analysis software used
7 Generally the specific model should be identified.
14
4 Analysis of essential parameters and review of personnel requirements
4.1 Analysis of essential parameters
4.1.1 Structure of the parameter analysis The analysis of the essential parameters is structured as recommended by ENIQ Recommended Practice 1 (3) and is divided into two groups.
• Input Group – this includes all the parameters defining the component, defects and required performance.
• NDT System Group – this includes all the parameters of the inspection procedure, and the equipment needed to apply it, that have to be addressed in order meet the inspection objectives defined by the input group.
The essential parameters of the inspection are presented in tabular form, with a brief analysis of each parameter, its value and, where appropriate, the tolerance or allowable range associated with it, and a reference to other sections of this document, or to external sources, where treatment in greater depth or further information can be found. In a small number of cases the brief analysis is considered to be sufficient and no further references are given. The NDT system group parameters have been subdivided into Set 1 and Set 2 essential parameters. The Set 1 essential parameters are those which particularly affect the outcome of the inspection and these are considered in detail in the text of this TJ. The Set 2 essential parameters are those which affect the outcome only if they differ by a substantial margin from the values specified in the inspection procedure. The Set 2 essential parameters particularly include many equipment parameters that are selected on the basis of previous experience, including applicable codes and standards, and often demonstrated in the course of development work and empirical trials. Where this is the case, the parameters are noted as being selected on the basis of experience and/or practical trials and where applicable a range of acceptable values is given along with the specific value(s) for the parameter given by the inspection procedure.8 For the sake of
8 Inspection procedures often identify a single value for a Set 2 essential parameter that allows effective inspection without explicitly exploring the sensitivity of the inspection to changes in that value. If the TJ presents only this value it may be impossible to make subsequent changes to the procedure without invalidating the qualification. In this model TJ Appendix 1 lists separately the acceptable range of parameter values and the specific values defined by the procedure, as this gives greater flexibility for making procedural changes, provided that the TJ is accepted by the qualification body. For the purpose of this TJ it has been assumed that the values presented in
15
clarity the Set 2 essential parameters that have been considered in the development of this TJ are presented separately in Appendix 1. It should be noted that a particular parameter may not always be a single entity. For example, the parameter 'Nominal beam angle' lists several different beam angles which are used to give complete coverage of the inspection volume. In this case the separate beam angles do not constitute a range of values for the parameter; instead they form a set which constitutes a single value for the parameter as all of them are needed to achieve the desired inspection capability.
Appendix 1 have been verified in the course of procedure development or by previous experience, as is normally the case. This assumption is not wholly correct, therefore the parameter values given in the present TJ should not be used to support directly any other procedure qualification.
16

4.1.2 Input group
Influential parameter
Analysis Reference
Component dimensions, shape and error of form.
The inspection is of a single component; therefore variation between components is not an issue. Dimensions are controlled within usual engineering tolerances by manufacturing procedures. Undetected variations outside the expected tolerances could compromise the ability of the procedure to deliver the predicted performance.9
6.1
Cladding type Austenitic 2 layer strip cladding covers the inspection surface. This is likely to affect sensitivity, coverage and signal to noise performance in a complex way depending upon wave mode, frequency, beam angle and probe position relative to the boundaries between strips.
Ref (7),7, 8.1
Cladding Orientation
Cladding is applied parallel to the vessel axis, consequently the orientation of the inspection beams relative to the cladding direction changes with azimuthal position and hence the magnitude of any cladding effects will also depend upon azimuth.
Ref (7), 7.1, 8.1
Access constraints
The inspection is deployed from the clad surface of vessel. The limited scanning extent between the weld and the nozzle inner radius will limit coverage from the nozzle side of weld for some probes.
6.1, 7
Surface finish The weld cap is removed and a surface roughness <6.3µm Ra and the absence of surface deposits is specified. These are controlled by manufacturing procedures. Pre-inspection checks give confirmation. Variations outside tolerance would compromise inspection sensitivity.
Defect type Defect types sought are fatigue cracks and LOSF which are smooth and planar in nature. Detection of such defects depends strongly upon their orientation relative to the interrogating beams.
6.1.
Defect morphology
Defect surface roughness is specified as <6.3µm Ra which is smooth on the scale of the ultrasonic wavelength. Smooth defects give a strong specular response with low scattering away from the specular direction.
6.2
Defect location Defects are located in or adjacent to the weld and its heat affected zone. 6.1 Defect size The qualification defect size is 15mm high x 30mm long. Defect size influences signal amplitude. 6
9 Generally it is expected that the inspection procedure would require a survey of the component to ensure that it is within specification or to identify regions where the design capability might not be achieved.
17
Influential parameter
Analysis Reference
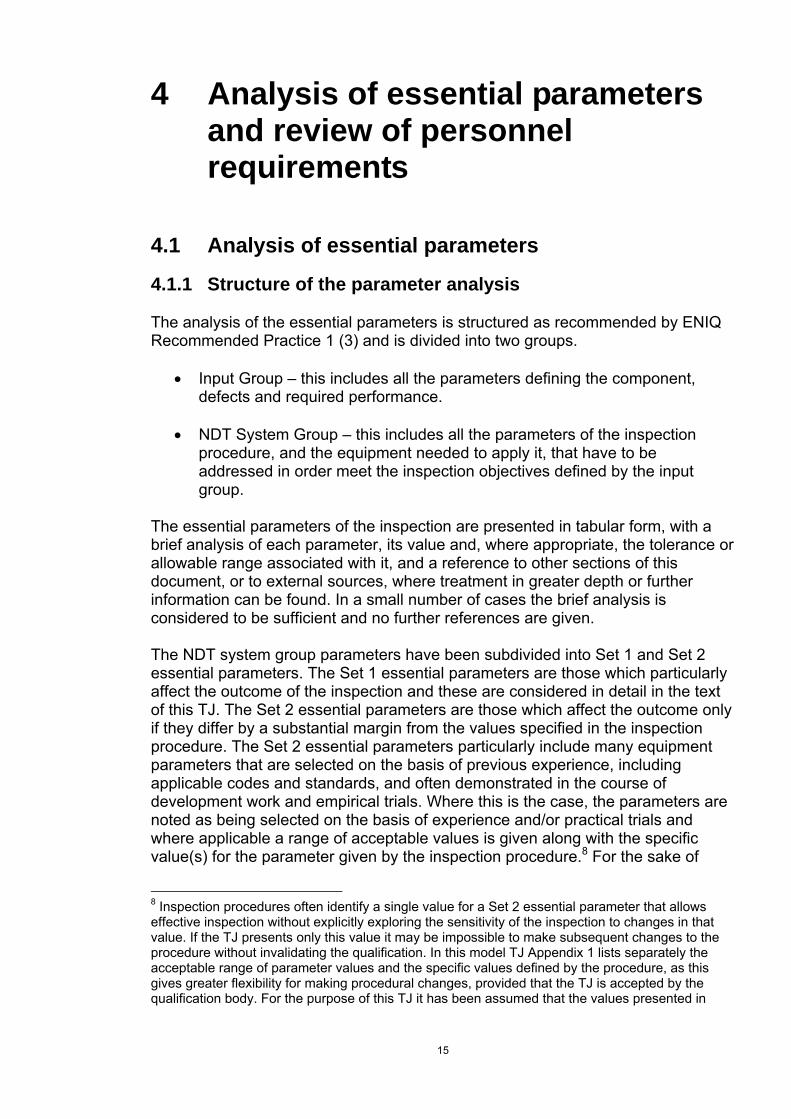
Defect tilt and skew
Specified ranges for qualification defects are: Cracks - Tilt ≤ ±20°, Skew ≤ ±5°, LOSF defects - Tilt +4° or -4°, Skew 0° Defect orientation influences signal amplitude and needs to be considered along with the component geometry and defect location. The fact that defects of concern are predominantly likely to be near vertical makes defect tilt a key parameter of the inspection.
6, 10
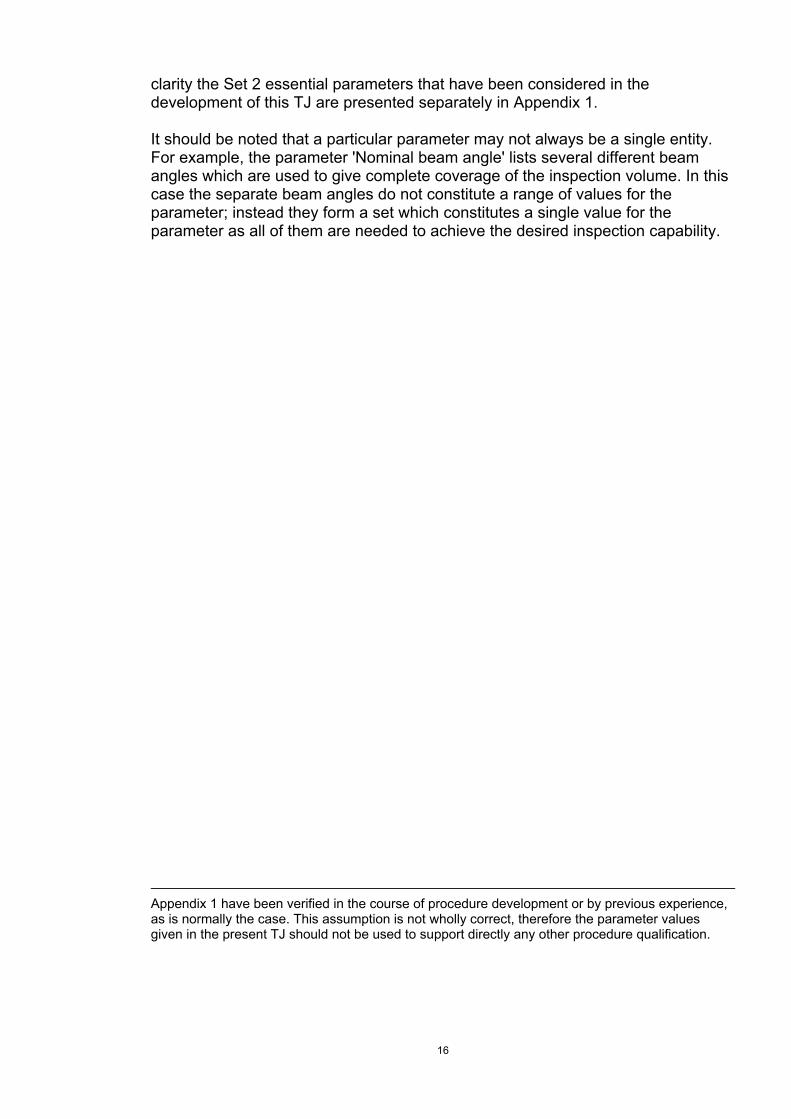
4.1.3 NDT system group set 1 parameters
Influential parameter
Value / Tolerance Analysis Reference
Wave mode Longitudinal waves used for surface breaking and underclad cracks. Shear waves used for bulk of inspection volume.
High angle longitudinal wave probes are less affected by cladding effects than shearwave probes. There is substantial evidence in support of the use of 70°TRL probes for cladding inspection. There is substantial evidence supporting the use of conventional P/E techniques with shearwave probes but cladding effects need to be considered in this case.
5.4.2, 7.2, Ref (7)
Nominal beam angle
See Table 4 Choice based on past experience, physical reasoning, modelling and empirical trials.
5.4.3
Probe frequency
Shearwave probes 1.5MHz Longitudinal wave probes 2MHz. Allowed variation fixed by probe specification.
A relatively low frequency is used to minimise cladding losses. Past experience and empirical trials indicate that these values give an acceptable compromise between cladding losses and resolution, accuracy, signal strength and probe size.
5.4.2
Probe element size
See Table 4 Element size influences coverage and signal amplitude through effect on beam divergence, near-field length and probe sensitivity. It also dictates overall probe size and hence has an influence on coverage and coupling performance.
5.4.4, 9.1.1.
18

Influential parameter
Value / Tolerance Analysis Reference
Inspection technique
Single and Tandem probe P/E. 70° TRL for near surface defects
Multiple beam angles are used to obtain minimum misorientation angles for postulated defects and to give redundant coverage. The tandem technique is appropriate for near vertical defects. Use of 70°TRL probes is appropriate for near surface defects in and under cladding.
5.4 6.1.1 Ref (7)
Scanning sensitivity
Tandem: Ø8mm SDH at 40mm depth = 80% FSH Shear wave: Ø6.4mm SDH DAC (80% FSH) 70°TRL: Ø3.2mm SDH DAC. (80% FSH) UCC 70°TRL: Ø3.2mm SDH at 5mm depth = 80% FSH Periodic checks specify that changes > ±3dB require re-evaluation of data and changes > ±6dB require re-scanning.
Selected to optimise received signal from postulated defects and set using calibration targets. A correction is applied to account for losses arising from the presence of the cladding layer. Incorrect setting may cause reportable defects to be missed, or false calls to be generated. The values used are based upon previous experience and are justified by this TJ. This is a key parameter of the inspection.
6.2, 8.1
Noise Level Noise levels should not exceed: Shearwave probes 10%FSH (12.5% of reference level) TRL probes 20%FSH (25% of reference level)
Defect signals must be detectable above noise with sufficient margin to avoid error. Insufficient signal to noise will result in missed defects. Therefore all elements of the system including probes, cables and amplifiers must have adequate S/N performance. In the present case the most important source of noise is likely to be due to grain scattering in the cladding layer, this will be relatively localized in time and only likely to cause problems for defects located close to the cladding interface. Other sources of noise are expected to be negligible in comparison. The values specified by the inspection procedure require
8.1
10 Normally results from technique development trials and/or parametric studies on clad blocks would be used to give more direct supporting evidence.
19
Influential parameter
Value / Tolerance Analysis Reference
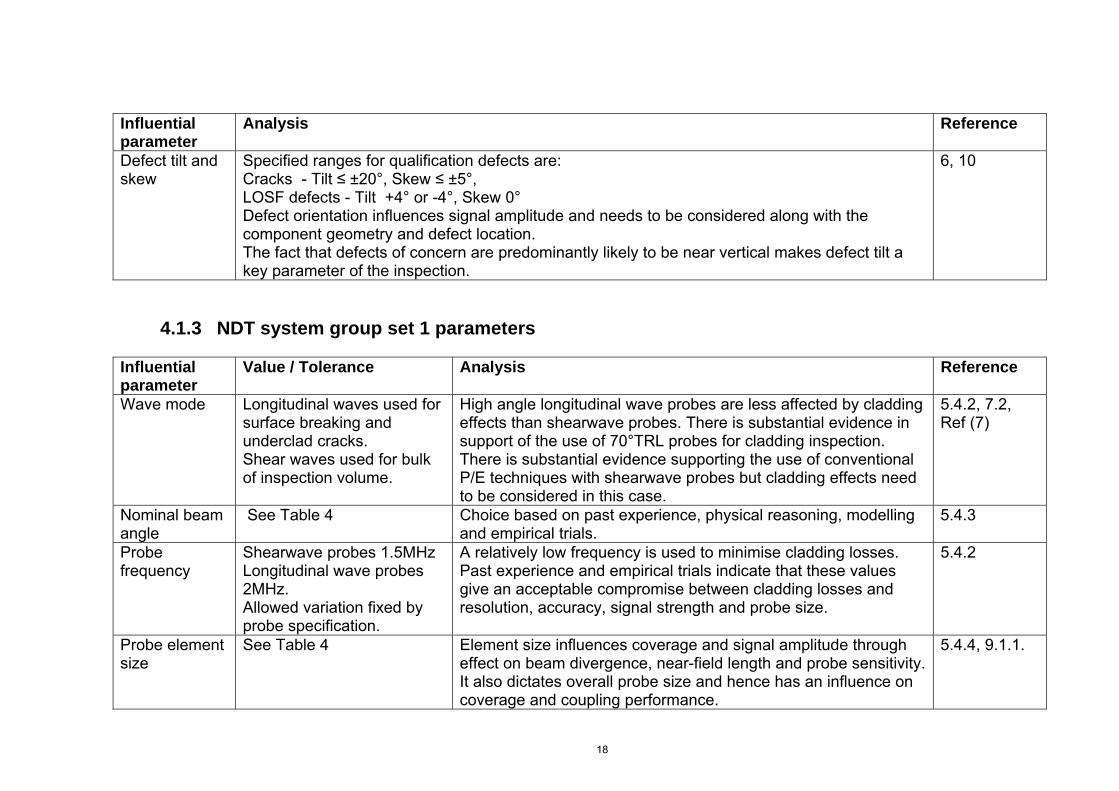
recordable indications to have a minimum margin of 6dB over the noise level for shearwave and TRL probes. This value is justified on the basis of previous experience.10
Scanning extent
Covers designated inspection volume +10mm extra on each side for each probe where geometry allows.
The scans need to sweep out the inspection volume to the maximum extent possible within geometric constraints. Use of scan lengths longer than the minimum necessary to cover inspection volume allows for possible datum setting and index point errors. Coverage from the nozzle side of the weld is restricted for higher angle beams.
6.1 6.2
Recording and reporting criteria
Signal amplitude must be >25% reference for tandem and shearwave probes and >50% reference for longitudinal wave probes with S/N >6dB in both cases
The procedure fixes recording and reporting criteria based upon the results of empirical trials and previous experience, with a correction applied to account for the effect of losses in the cladding layer.
8.1
Manipulator design
A purpose designed nozzle scanner is used to scan the selected probes over the available inspection surface.
The use and correct application of a scanner appropriate to the nozzle geometry is an essential parameter of the inspection. Selection of a different manipulator or incorrect use could adversely affect coverage and accuracy of inspection.
9.1.3
Manipulator accuracy
Estimated as ±3mm for each axis.
The overall accuracy of flaw location depends upon the manipulator accuracy, especially as probes are scanned individually and the results combined in analysis. Providing the scanner is assembled and mounted in accordance with the manufacturer's instructions and mechanical backlash is allowed for in position setting, the accuracy achievable will depend mainly upon the error inherent in the use of visual methods for datum setting.
9.1.3
20

4.2 Review of personnel requirements The experience and training requirements indicated in section 3.3 follow industry practice for situations where inspection specific personnel qualification is not deemed to be necessary. In this case the inspection geometry is relatively simple, as are the defect species sought. Further to this, the inspection techniques deployed are well established and the analysis procedure is conventional in nature. Consequently the use of personnel with recognized UT inspection qualifications and auditable training records provides a sound basis for high reliability inspection, which is strengthened by the procedure requirements for technique and implementation specific experience and training.
5 Physical reasoning
5.1 Introduction The purpose of this section is to provide a detailed qualitative justification of the techniques, procedure and equipment to be applied to the detection of defects in ENIQ Nozzle 21. 5.2 Defects to be detected Nozzle assembly 21 contains deliberately inserted defects designed to represent those which could occur in a real component during manufacture or service. These are specified in Section 2.5 and the inspection volume is described in Section 2.4. 5.3 The influence of cladding The cladding on Nozzle assembly 21 is two layer strip cladding with a strip width of 60mm and a thickness of 6 to 8mm. Reference (7) indicates that it is likely that: • The interface between the cladding and the base material will be essentially
smooth and flat with variations of the order of 0.5mm, which are most likely to occur where the edges of the strips overlap.
• The grain structure will be columnar and normal to the surface, although it is likely that there will be some variation in the tilt of the columnar grains where the edges of the strips overlap.
Consequently transmission properties will depend upon the location and orientation of the probes relative to the cladding strip boundaries. The magnitude of the effects observed will depend upon probe frequency, wave mode, beam angle and probe size.
21

The influence of cladding will be further discussed in section 7 and its likely effect on the performance of the inspection is addressed in section 10. 5.4 Selection of inspection method and techniques
5.4.1 Method The requirement to detect embedded defects dictates the use of a technique with volumetric inspection capability. The orientation of the expected defects relative to the inspection surface effectively restricts the choice of available techniques to those employing the ultrasonic method. Of the available UT techniques, multiple probe automated pulse-echo (P/E) is suitable for ensuring full volumetric coverage for defect detection, although for effective inspection it is necessary to select probe parameters which reduce the adverse influence of transmission through the cladding. The capabilities of automated multi-probe P/E techniques have been extensively demonstrated in international round robin inspection exercises such as PISC (8) and in numerous nuclear qualification and performance demonstration programmes. Due to the steep weld preparation angle in Nozzle assembly 21, the defects of concern are predominantly orientated close to the normal to the inspection surface. The tandem technique is designed to detect vertical and near vertical planar defects in parallel sided components by specular reflection of the ultrasonic beam from the face of the flaw. Tandem inspection is sensitive over a limited depth range that depends upon the probe beamspread, the probe separation and the thickness of the component. The geometry of Nozzle assembly 21 allows coverage of the bulk of the specified inspection volume with a single pair of 45° probes separated by 220mm11 (Section 6.1.1) and hence this technique has been selected as the primary means of detection for near vertical flaws. 5.4.2 Wave mode and frequency The probes deployed (Section 3.2.1) for the inspection of the bulk of the inspection volume are single crystal, low frequency, angled shear wave units. The shear wave mode is conventionally used for the inspection of ferritic welds where material anisotropy is not an issue. The relatively low frequency of 1.5MHz has been selected to minimize the effects of beam skewing and variable attenuation arising from passage of the beam through the anisotropic cladding layer (7). It also reduces the near field length of the probes, thereby reducing the likely variability of response for defects at short range. In the case of the tandem inspection the use of shearwaves avoids losses and the generation of geometrical echoes arising from mode conversion at the reflecting surfaces.
11 The modelling in Section 6.1.1 indicates that 220mm is not the optimum probe separation.
22

Following conventional practice for clad components, 2MHz, 70° TRL type focussed probes are used for the detection of in-clad and underclad cracks (7). The defects specified have a maximum surface roughness of 6.3µm RA. For the detection probes used, the wavelength of the centre frequency is > 2mm, which is very much larger than the mean surface roughness. The defects can therefore be considered as ultrasonically smooth and expected to give rise to specular reflections and edge diffracted signals, with minimal diffuse scattering from the defect surface. 5.4.3 Beam angle In pulse echo inspection for defect detection, beam angles are generally selected so that specular reflection from the face of the defect will return a strong signal to the detecting probe. In the case of single probe techniques this implies normal or near normal incidence on the defect (note this does not apply to corner trap signals in the case of far surface breaking defects, but these are not relevant to the case considered here). In the case of the tandem technique where reflection from the far surface of the component is also involved, the requirement is that the specular reflections involved direct the beam along a closed path between the transmitter and receiver probes. The range of angles used in the inspection (tandem 45° plus 45°, 60°and 70° pulse echo) has been chosen to maximise coverage of the inspection volume for the defect species listed in section 2.512. A necessary condition for detection of defects by single probe UT inspection is that the volume containing the defects is fully insonified by the beams used. For buried, planar defects and P/E inspection, the amplitude response from defects is influenced strongly by the angle between the defect normal and the incident beam, which is referred to as the misorientation angle (γ). Response amplitude and hence the effectiveness of amplitude based defect detection criteria depends upon γ, as well as other parameters including defect size and surface roughness. Work by Toft (9) investigated experimentally the relationship between γ and signal amplitude for probes of similar frequency and dimensions and targets of similar size to those specified in the present procedure. Toft concluded that a value for γ of 15° was the maximum for which detection could be assumed for smooth defects. Uncertainties regarding differences in probes, inspection sensitivity and defect shape mean that it is not possible to apply this value directly to the present case. However, it can be taken as being indicative that defects with misorientation angles of this order or greater will not be detected and misorientation angle has been used in the study reported in section 6 as a means for identifying worst case conditions for which a detailed sensitivity analysis was then performed. Defect roughness also influences response amplitude, with rough defects giving rise to scattered signals that can be detected over a wider range of angles than specularly 12 Section 6.1.2 shows that some of these probes contribute very little to the overall inspection capability.
23
reflected signals. In the present case however, the defects sought are smooth (Section 5.4.2) and hence scattering away from specular cannot be relied upon to aid detection of defects with high misorientation angles. For surface breaking and underclad defects, located at or near normal to the inspection surface, it is not possible to obtain misorientation angles less than 15° with the 70° TRL probes. However, such probes have been shown to be effective for detection of defects in similar geometries (see Section 7.2.2) over many years. For embedded defects the inspection procedure relies heavily on a tandem inspection (10) using a pair of 45° probes. Such inspections are effective for defects which are orientated near perpendicular to the inspection surface (i.e. low tilts), although the inspection is more complex in this application than is the case for flat plate specimens. In a flat plate the transmitted beam and received beam axes are coplanar and a maximum response is obtained when a defect is located at the optimum depth for the particular tandem configuration. However, for the inspection of a nozzle to shell weld in a cylindrical vessel, the surface normals at the transmitter, receiver and the reflection point on the vessel OD are, in general, not coplanar. This means that the tandem scans applied here must generally rely upon beam spread to enable detection, and consequently inspection sensitivity is likely to be lower than would be achieved in a flat plate. More detailed amplitude response modelling for a selection of defects and probes is presented in section 6.2. 5.4.4 Probe type and dimensions The probes used are standard commercial products manufactured and supplied by probe manufacturers working to recognized quality standards13. This gives confidence in their basic fitness for purpose and reliability. Additionally it gives a basis for the expectation that results obtained from a particular probe would be indicative of those obtained with another probe of the same type. The overall size of the probe is largely determined by the dimensions of the active elements (Table 4). Element size, in conjunction with operating frequency, determines the beamspread and nearfield length of the probe and also influences the overall probe sensitivity. Consequently, it is an essential parameter of the inspection, although it only needs to be considered in the event that a change of probe is made and the replacement probe does not have a specification identical to the original. The probes used in the present inspection are designed for automated scanning and have dimensions compatible with the manipulator probe holder. The probes are not contoured to the inspection surface as the radius of curvature is sufficiently large, and the probes sufficiently small, that the use of a flat contact area is acceptable provided the surface error of form is within specification. 13 Normally the relevant standard(s) would be referenced.
24

5.5 Scan locations and scanning patterns Pulse echo scans are performed by raster scanning each probe over the designated scanning area, with the probe orientated at 0° or 180° probe skew. The radial scan limits are set to ensure that the beam centreline scans through the inspection volume, to the maximum extent achievable within the constraints applied by the specimen geometry. Where there are no constraints, the radial scan limits are extended 10mm beyond the minimum necessary for full coverage. Scan limits parallel to the weld are extended 3° (~18mm) beyond the minimum required in order to ensure capture of all relevant data. The scan increments are 1mm in the radial direction and 0.5° (~3mm) in the azimuthal direction. 5.6 Equipment selection
5.6.1 Probes See section 5.2 above. 5.6.2 UT Instrument The UT techniques used in this inspection rely upon the detection and recording of relatively low amplitude, high frequency, ultrasonic signals reflected from the faces or diffracted from the edges of the defects sought. This can be achieved through the use of a suitably specified digital UT instrument developed and produced to meet recognized technical and quality standards14. The requirement to perform instrument calibration checks on a yearly basis15 ensures that performance is maintained within the limits of the manufacturer's specification and the periodic probe checks required by the inspection procedure should give warning of any deterioration in performance within this interval. The present inspection uses an RDTech Tomoscan S/V UT instrument and associated software to collect and display the inspection data. This is a 16 channel, PC based system designed for use in automated and semi-automated UT inspection applications. The operational requirements of the inspection are within the capabilities of this instrument which has an established performance record, including numerous qualified inspections in the nuclear industry16
14 Specific international or national standards should normally be referenced. 15 This is usually a requirement of the inspection organization's quality management system and should be referenced. Often the inspection procedure will require the use of an instrument bearing a current valid calibration label. 16 Specific references should be included where appropriate.
25

6 Predicted inspection capability
The assessment is presented in two parts, aimed at:
• Establishing the completeness of the inspection’s volumetric coverage and identifying worst-case defects based upon the misorientation angle (γ) between the ultrasonic beam and the normal to the defect face (in the case of the tandem inspection an equivalent parameter based upon the average misorientation of the incident and reflected beams is used).
• Using a validated amplitude response model to predict the inspection’s capability to detect worst-case defects.
It ignores any possible influence of the cladding at this stage and assumes that transmission properties are independent of position on the surface, such that there are no local variations in beam direction, attenuation and signal to noise ratio. Note that account is taken of cladding effects in consideration of the overall sensitivity of the system by inclusion of a correction factor experimentally obtained from scanning representative probes on representative testpieces; this is treated separately in section 8.1. 6.1 Inspection coverage The entire inspection volume can be insonified by all of the pulse-echo probes when these are deployed from the vessel side of the weld. This is evident because the region of the component surface from which the inspection is to be deployed is cylindrical and free from rapid changes of gradient on the inspection surface. Where the inspection surface is curved, the curvature is concave and consequently, whilst there is a tendency for the coverage density to reduce slowly with depth, there are no regions where coverage is excluded. For deployment from the nozzle side of the weld, proximity to the nozzle bore prevents 60° and 70° probes being scanned far enough away from the weld to insonify the deepest part of the inspection volume on the nozzle side of the weld centreline and hence there is some restriction in coverage that increases with increasing beam angle. The 70° TRL probes are deployed only for the inspection of the near surface region (to a depth of 20mm) and there is no restriction in coverage at that depth. The 45° probe achieves full coverage from both sides of the weld. The tandem probes are not deployed from the nozzle side of the weld as there is insufficient room to scan the probes. To illustrate the coverage that is achieved, a geometric modelling exercise has been conducted using ‘KANDE InSight Predictive V1.02’ software to calculate the minimum misorientation angles achievable for a range of postulated defects when using the
26
specified probes. This is a ray tracing model that calculates misorientation angles based upon beam direction, flaw location and orientation, and component geometry. Limited account is taken of probe beam spread and hence the predictions made tend to be conservative. In accordance with KANDE International’s internal software quality control procedures, the model has been validated analytically using a selection of specific cases and by comparison with alternative calculations (11). The model considers a regular array of planar targets lying on the weld fusion boundaries and calculates the misorientation angle for each target for every location of a given probe on the inspection surface. The results are presented as rectangular colour coded plots of the minimum misorientation angle achieved at each defect site by the entire probe scan. The minimum misorientation angle is displayed as a function of defect position with the lower edge of the plotted results corresponding to the inspection surface. Note that the vertical axis of the plots represents axial position and not depth below the inspection surface (Z) as; in general, the direction of Z is not parallel to the nozzle axis, although in this case the difference is small. Note also that it has been assumed that at the frequency used to perform the inspection there will be no effect on coverage due to the presence of the cladding layer. 6.1.1 Tandem Inspection When deployed on a flat parallel sided component, a single tandem configuration is sensitive to defects at a specific depth which is determined by the:
• relative orientation of the transmitter and receiver probes and the backwall which completes the transmission path
• thickness of the specimen
• separation of the probe index points. When applied in the nozzle to shell weld geometry similar considerations apply, and additionally the optimum depth varies slightly with azimuthal location due to surface curvature, which changes continuously between the 0° and ±90° positions. The geometric model has been used to assess the quality of incidence on defects using a modified version of the misorientation angle approach. In this approach, insonification is credited when a modelled flaw is intersected by both the transmitter and receiver beam axes (appropriately reflected by the component surface). When this is the case, a further calculation stage is performed, in which the angle between the flaw normal and the mean of the transmitter and receiver beam axes is calculated and used to infer the quality of incidence for detection; the closer this angle is to zero, the better the incidence condition.
27

The results are given in the following figures. It can be seen that the insonification conditions are better in general for defects on the inner fusion face (Figure 3), where the misorientation angle is ≤ 4° at most azimuthal locations and at worst is ≤ 8°.
Figure 3 Tandem misorientation angle prediction for nozzle side fusion face defects.
Note: Defects are plotted on a developed radial section. The plot axes are axial location (distance parallel to the nozzle axis increasing away from the vessel) plotted vertically and azimuthal angle about the nozzle axis with the 0° and 180° positions aligned with the vessel axis. The lower pair of lines plotted are the intersections of the weld fusion boundaries with the vessel surface, the intermediate line marks the approximate location of the weld root and the upper line marks the effective end of the modelled region of the component. The same plotting convention is used for all plots.
28

For defects located on the shell side fusion face the situation is not quite so good with the misorientation angle being between 4° and 12° for most azimuthal locations, with the highest misorientation (~15°) occurring near the 90°/270° azimuthal position (Figure 4).
Figure 4 Tandem misorientation angle prediction for shell side fusion face defects.
Refer to Figure 3 for an explanation of the plot convention. Similar performance can be inferred for the untilted surface breaking and underclad cracks defined in the inspection scope, where the effect of the changing surface curvature is to introduce changes in effective defect tilt and skew of the order of 5°. However, it should be noted that the tandem separation used (220mm) means that optimum coverage is achieved near the deepest (furthest from the inspection surface)
29

part of the inspection volume (55mm in the 0° and 90° locations). This can be seen in the tandem results where a band of coverage is predicted centred about a depth from the inner surface of about 55mm. Thus any coverage for near surface defects is obtained significantly off the beam axes and therefore at reduced sensitivity. The modelling performed has partially included the influence of beam spread but not in sufficient detail to make accurate predictions of coverage for near surface flaws. It can however, be concluded that capability will reduce as defect depth below the surface decreases and hence that near surface defects will constitute a worst case for the tandem inspection. Complementary coverage of the near surface region is supplied by the 70°TRL probe inspections (Section 6.1.2). 6.1.2 Angle beam probes Figure 5 and Figure 6 show predictions of misorientation angle for fusion face defects in the range 0-50mm depth insonified with 70° probes scanned pointing towards and away from the bore (0° and 180° probe skews). The 45° and 60° probe predictions are not shown as these achieve less favourable incidence conditions than do the 70° probes. The fusion faces are inclined at 4° to the nozzle axis. This means that at 0° and 180° azimuth positions (equivalent to the case of a flat plate), the lowest misorientation angle achievable is 16° (90° - 70°- 4° =16°).
30
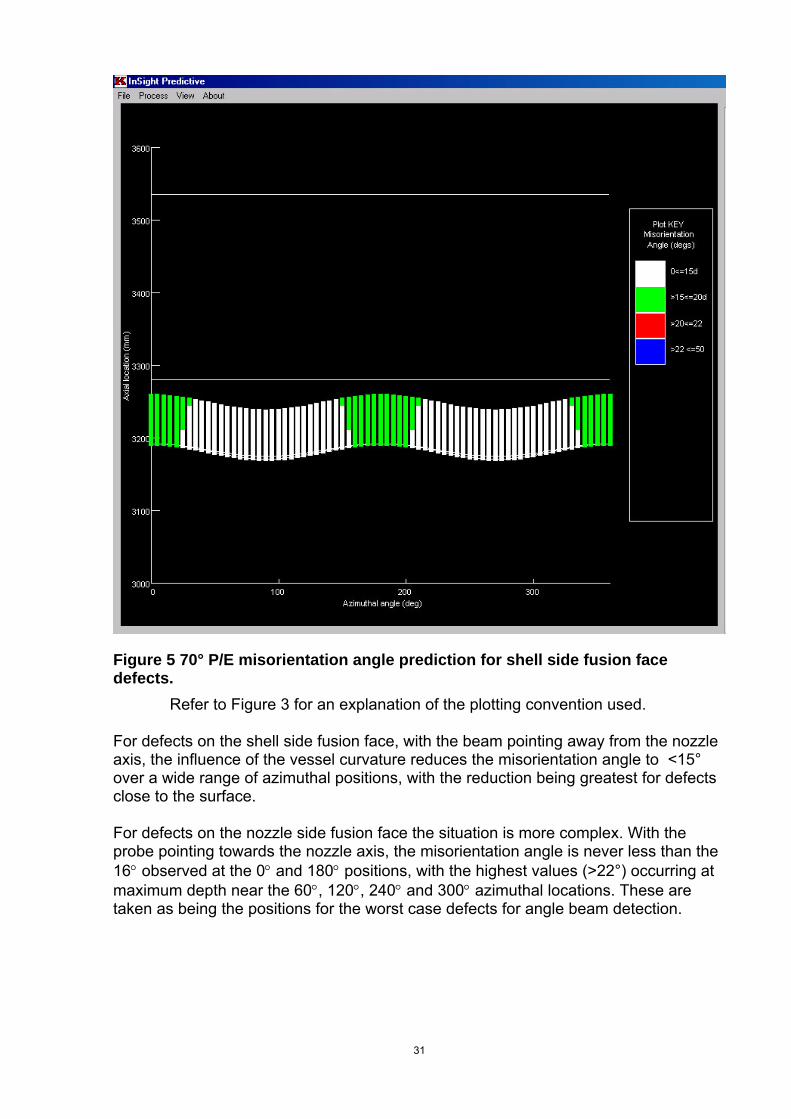
Figure 5 70° P/E misorientation angle prediction for shell side fusion face defects.
Refer to Figure 3 for an explanation of the plotting convention used. For defects on the shell side fusion face, with the beam pointing away from the nozzle axis, the influence of the vessel curvature reduces the misorientation angle to <15° over a wide range of azimuthal positions, with the reduction being greatest for defects close to the surface. For defects on the nozzle side fusion face the situation is more complex. With the probe pointing towards the nozzle axis, the misorientation angle is never less than the 16° observed at the 0° and 180° positions, with the highest values (>22°) occurring at maximum depth near the 60°, 120°, 240° and 300° azimuthal locations. These are taken as being the positions for the worst case defects for angle beam detection.
31

It is noted that close to the 90° and 270° azimuthal positions, the combination of fusion face angles and vessel curvature is such that a marginally lower misorientation angle is given by inspection from the nozzle side with a probe skew of 180°, but this is of limited benefit as coverage of the deepest part of the nozzle side fusion face is prevented by geometric restrictions.
Figure 6 70° P/E misorientation angle prediction for nozzle side fusion face defects.
Refer to Figure 3 for an explanation of the plotting convention used. For surface breaking and underclad cracks without skew or tilt, the minimum misorientation angle obtained using 70° probes will be close to 20°, the same as in the flat plate case. This applies at all azimuthal positions because the probe to defect distances are short (≤ 50-60mm) and the surface curvature is relatively large. The worst case occurs for untilted defects with maximum skew (5°), as the presence of
32

defect tilt reduces the misorientation when seen from one side or the other until at maximum tilt (20°) near normal incidence will be achieved. 6.1.3 Summary of worst case defects From the geometrical modelling performed the following worst case defects have been identified: • Surface breaking or underclad cracks orientated normal to the local surface (tilt =
0°) and possessing maximum skew (5°). This is a worst case for 70°TRL probe inspection. As the qualification defect height exceeds the cladding thickness by a factor of 2 to 3 times, all surface breaking defects will extend into the ferritic material to beyond the focal depth of both types of 70°TRL probe used. It is therefore considered highly probable that the response from surface breaking cracks will be very similar to that for underclad cracks, with surface breaking cracks constituting the overall worst case.
• A near surface lack of fusion defect located on the shell-side fusion face at 60°
azimuth. This is a worst case for tandem probe inspection as it relies on probe beamspread to achieve coverage of the near surface region and the transmitted and received beams are not coplanar.
• A lack of fusion defect located at maximum depth on the shell-side fusion face at
the 90° azimuth position. This is a worst case for those defects for which the tandem inspection is optimised and is not expected to be worst case overall.
6.2 Inspection sensitivity For the applied inspection, defect detection relies on the defect reflecting an incoming ultrasonic pulse, such that it generates a signal at the receiver with amplitude greater than or equal to a specified reference value:
For the shear wave probes the reference level is 12dB below Ø6.4mm SDH DAC. For the tandem probes the reference level is 12dB below the signal from a Ø8mm SDH at 40mm depth17. The deeper focussed 70°TRL probe uses a level 6dB below Ø3.2mm SDH DAC. The UCC 70°TRL probe uses a level 6dB below the signal from a Ø3.2mm SDH at a depth of 5mm.
17 This is not at the optimum depth for the tandem probe separation used.
33
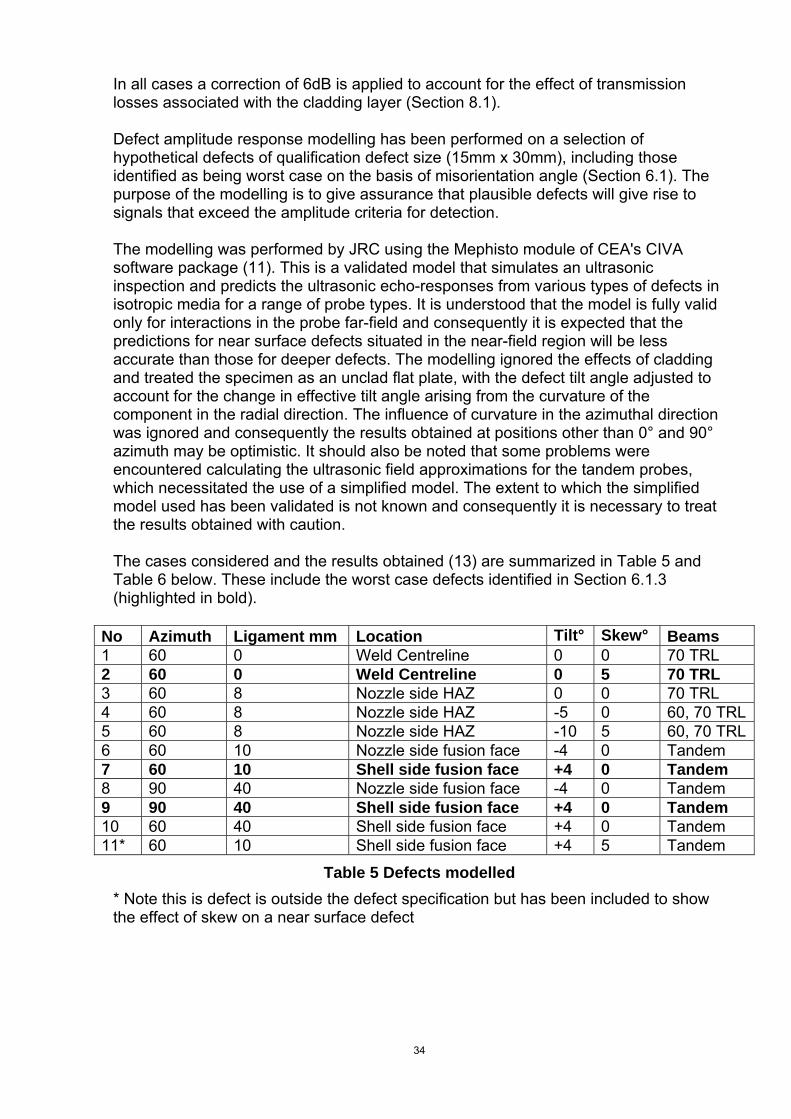
In all cases a correction of 6dB is applied to account for the effect of transmission losses associated with the cladding layer (Section 8.1). Defect amplitude response modelling has been performed on a selection of hypothetical defects of qualification defect size (15mm x 30mm), including those identified as being worst case on the basis of misorientation angle (Section 6.1). The purpose of the modelling is to give assurance that plausible defects will give rise to signals that exceed the amplitude criteria for detection. The modelling was performed by JRC using the Mephisto module of CEA's CIVA software package (11). This is a validated model that simulates an ultrasonic inspection and predicts the ultrasonic echo-responses from various types of defects in isotropic media for a range of probe types. It is understood that the model is fully valid only for interactions in the probe far-field and consequently it is expected that the predictions for near surface defects situated in the near-field region will be less accurate than those for deeper defects. The modelling ignored the effects of cladding and treated the specimen as an unclad flat plate, with the defect tilt angle adjusted to account for the change in effective tilt angle arising from the curvature of the component in the radial direction. The influence of curvature in the azimuthal direction was ignored and consequently the results obtained at positions other than 0° and 90° azimuth may be optimistic. It should also be noted that some problems were encountered calculating the ultrasonic field approximations for the tandem probes, which necessitated the use of a simplified model. The extent to which the simplified model used has been validated is not known and consequently it is necessary to treat the results obtained with caution. The cases considered and the results obtained (13) are summarized in Table 5 and Table 6 below. These include the worst case defects identified in Section 6.1.3 (highlighted in bold).
No Azimuth Ligament mm Location Tilt° Skew° Beams1 60 0 Weld Centreline 0 0 70 TRL 2 60 0 Weld Centreline 0 5 70 TRL 3 60 8 Nozzle side HAZ 0 0 70 TRL 4 60 8 Nozzle side HAZ -5 0 60, 70 TRL5 60 8 Nozzle side HAZ -10 5 60, 70 TRL6 60 10 Nozzle side fusion face -4 0 Tandem 7 60 10 Shell side fusion face +4 0 Tandem 8 90 40 Nozzle side fusion face -4 0 Tandem 9 90 40 Shell side fusion face +4 0 Tandem 10 60 40 Shell side fusion face +4 0 Tandem 11* 60 10 Shell side fusion face +4 5 Tandem
Table 5 Defects modelled * Note this is defect is outside the defect specification but has been included to show the effect of skew on a near surface defect
34

Defect Tandem 45° 60° shear 70° shear 70° TRL1 -4.2 2 -7.2 3 -1.1 4 -0.6 1.4 1.1 5 1.7 4.4 1.4 6 16.5 7 15.8 8 41.8 9 32.8 10 33.7 11 15.4
Table 6 Amplitude modelling results (dB relative to reporting threshold) Note blank entries indicate that modelling was not performed. The results presented in Table 6 indicate that for the bulk of inspection volume, i.e. from the clad interface to a depth of 56mm, the most effective defect detection performance will be given by the tandem probes. The modelling predicts a very high amplitude tandem probe response, which is consistent with the orientation of the postulated flaws being close to the surface normal. The largest response will be obtained from defects at maximum depth (D8 to D10), as the probe separation is optimized for this region. The response will decrease closer to the inspection surface but the modelling predicts that even at a depth of 10mm (D6 and D7) the expected signal amplitude for qualification size defects will be significantly above the reporting threshold and that the influence of skew up to 5° is minimal (D7 and D11). The 70° TRL probes are intended to give coverage of the region between 0 and approximately 20mm deep; the modelling results (D4 and D5) indicate that the response for defects in this region with moderate tilt (5° and 10°) should be above threshold, albeit only marginally so. For defects with higher degrees of tilt, up to the limit of 20°, the fact that coverage is available from both sides of the weld means that as the response from one direction diminishes, that from the other will increase as the beam strikes the face of the defect increasingly closer to normal incidence. For surface breaking or underclad cracks without significant tilt, the situation is less satisfactory. The results for D1 and D3 indicate that the response for such defects will be below the recording threshold and the result for D2 confirms that the presence of skew will make the situation worse.18
The modelling indicates that the angled shearwave probes applied to the bulk of the inspection volume give only limited additional capability. The 60° and 70° probes are predicted to return a response above the threshold level for a defect with 10° tilt but the margin is not large and reduces for smaller tilt angles or if skew is also present.
18 Uncertainty regarding the validity of the 70°TRL probe model limits the reliance that can be placed on these results.
35

Under no conditions was a response approaching the reporting threshold predicted for the 45° probes and these have therefore been omitted. The restricted coverage from the nozzle side limits the 70° probe deployed from that side to providing coverage of the shell side fusion face only (Figure 7). Hence the deepest parts of a large surface breaking or underclad crack located in the nozzle side HAZ would not be seen by this probe and if unfavourably tilted (positive tilt) would give a very poor response to the 70° probe scanned on the shell. However there would be no restriction on detecting the upper part of such a defect with the 70° shearwave probe or the 70° TRL probes scanned facing away from the nozzle axis.
Scanning restriction prevents coverage of shaded area from nozzle side.
Figure 7 Coverage with 70° probe 6.2.1 Modelling Summary The modelling performed indicates that most of the capability for the detection of defects in the ferritic part of the inspection volume is given by the tandem probes, which are optimised for vertical and near vertical defects. Additional capability for surface breaking and underclad cracks is given by the 70° TRL probes, especially for defects with tilt values approaching the maximum. The 45° shear wave probe provides no significant capability for the detection of the specified defects.
36

The defect detection capability of the 60° and 70° shearwave probes is likely to depend upon both defect orientation and location, the latter through the influence of the expected variation of inspection sensitivity with azimuthal position arising from the use of a single value of the cladding correction at all locations. Therefore, although these probes add some redundancy of coverage it is not claimed that they add significantly to the capability given by the Tandem and 70°TRL probes for the specified defects.
7 Experimental evidence19
7.1 Evidence from laboratory trials20 The misorientation angle concept used in sections 5 and 6 of this report is based in part upon a study which was made as part of the investigation of inspection capability for the Sizewell ‘B’ PWR in the UK (9). Amongst other studies, this report presents results of experiments on the relationship between misorientation angle and signal amplitude for a range of defect types for both pulse-echo and tandem inspections. These results and other similar studies are the basis for the use of a misorientation angle approach to detection assessment. General experimental and practical data is provided by this reference, and while this is not directly applicable to the present inspection, due to differences in reference levels, defect parameters and probe parameters, it can be taken to indicate that misorientation angles less than or of the order of 15° are required to achieve detection of smooth planar flaws. 7.2 Evidence from previous qualifications and
applications
7.2.1 Fusion face defects Nozzle to shell weld examinations making use of techniques similar to those identified here have been the subject of international trials - most notably DDT (14) and PISC (15). In both cases capability for high reliability inspection was demonstrated for similar inspections in similar geometries and for similar defect species. It should be noted
19 In the case of a real qualification, it is often the case that technique development work and equipment trials supply a substantial body of evidence in support of the selected inspection techniques. Such information would normally be presented in this section and would in some cases form a major part of the TJ. 20 A limited amount of data from pre and post cladding inspections of Nozzle assembly 21 has been used to provide information of the type that would more usually be derived from experimental measurements on simplified test specimens but in the present exercise this has been treated as evidence from parametric studies and is included in section 8.
37

however, that these trials concerned the inspection of PWR geometry nozzles and, as has been discussed in sections 5 and 6, the performance of the techniques applied must be optimised for the particular geometry to be inspected. Consequently the available round-robin data cannot be taken as direct proof of total capability in this area. This evidence does, however, indicate that the techniques are likely to be effective when applied correctly. 7.2.2 Surface related defects The use of twin crystal 70° compression probes to look for near surface defects under cladding in complex geometry nozzles has been investigated through a number of independent trials, notably: • Defect Detection Trials (DDT) (14) • PISC - II (15) • Sizewell B inspection qualification trials (16) Considering each of these trials in turn: DDT: One of the plates (plate 4) used in the UKAEA DDT trials represented a PWR inlet nozzle. The test piece contained 20 sub-surface defects comprising a mixed population of smooth and rough cracks. The cladding was a mixture of manual and automated following practices employed by Uddcomb at that time for cladding Reactor Pressure Vessels. The nozzle inner radius region was manually clad. The defect population of the inner radius region consisted of a total of 14 defects comprised of 10 EDM slots and 4 carbon cracks. The defects ranged in size from 4 to 28 mm in height and from 27 to 138 mm in length. All the defects were oriented in the radial axial plane of the nozzle, but one was tilted 10° with respect to the local surface normal and another was skewed by 10°. From these trials it was concluded that the best results for detection were obtained from twin crystal 2 MHz 70°compression probes which detected all the defects. PISC II: Plate 3 used in the PISC II trials represented a PWR nozzle and Plate 9 a BWR nozzle. Each plate contained 3 defects representing inner radius cracks. The sizes of the defects are given in terms of their enclosing volume and the actual defect size cannot be determined from the reported data because insufficient information is provided. However, all six defects were detected by the teams using twin crystal 70° compression probes.
38

Sizewell B (Inspection qualification trials) The relevant inspections were those performed during the inspection qualification of the shop inspections i.e. the automated inspections of the nozzle inner radii for underclad cracking. The defect specification for this was:
Through wall extent 5 to 10 mm Length 10 to 25 mm Tilt ± 20° Skew ± 20° (from the radial direction)
The defects were all EDM slots representing smooth defects with near zero ligaments to the clad ferritic interface. The inspections were conducted as blind trials and included the use of 2 MHz 70° TRL probes. These were shown to be capable of achieving 80% detection capability for all the defects in the test block exceeding 9 mm through wall extent, with better than 80% confidence. It is recognised that without direct evidence of equivalence of all relevant inspection parameters, the above studies cannot be taken to fully justify the capability of 70°TRL probes in the present case. However, they do strongly indicate that such probes have the capability to detect smooth planar underclad cracks if properly applied.
8 Parametric studies
8.1 Cladding correction There have been a number of parametric studies into the effect of two layer cladding on ultrasonic propagation that are relevant to the inspection under consideration. Extensive studies were performed by the United Kingdom Central Electricity Generating Board (CEGB) in support of the case for the construction of the Sizewell B PWR. These studies were performed upon a series of test blocks containing artificial defects and clad with a number of cladding types, including 2 layer strip cladding in two different orientations. It was concluded that:
For strip cladding with a machined surface, an increase of scanning sensitivity by 2 to 4dB is sufficient to maintain detection probability when using 45° and 60° shearwave probes with a frequency of not more than 1.5MHz (17). If using low frequency shearwave probes on machined strip cladding, 45° beams were relatively unaffected, 60° beams were affected to some degree
39

but probably remained useable and 70° beams were seriously distorted by transmission through the cladding. This implies that if reliance is placed upon high angle beams to ensure full volumetric coverage, there is a danger that localised variations in effective beam angle will give rise to regions which are not interrogated as intended (18). In a strip clad component, the region most affected by cladding noise would be a shallow zone extending 25mm from the inspection surface. Noise levels show little variation with frequency within the range 1 to 3MHz, or with beam angle in the range 45° to 60° but signal to noise levels could vary significantly due to the dependence of signal amplitude on beam distortions introduced during transmission through the cladding (19). These problems could be avoided by the use of 70°TRL probes for near surface inspection. In tests on a strip clad specimen, the noise recorded by probes of the type specified in the present inspection was approximately 20dB below the amplitude from a 3mm SDH situated at the focal range of the probe and was insensitive to probe orientation (20).
Studies performed by AEA Technology for Forsmark Kraftgrupp (21) compared the influence of different types of cladding, including 2 layer strip cladding, on inspection. These studies concluded that:
The biggest effect was upon high angle shearwave beams orientated perpendicular to the welding direction. There was no evidence for rapid variation in transmission properties as a function of direction relative to the welding direction. Direct comparison with unclad material indicated a mean loss of sensitivity of up to ~10dB (standard deviation ~4dB) when using 1.5MHz shearwave probes. Repeat measurement following machining of the clad surface showed that much of this loss of sensitivity is due to the influence of surface error of form at the junction between adjacent strips, rather than the intrinsic properties of the cladding. This is consistent with the findings of the CEGB study referred to above (17) which used a machined surface. Changes in beam angle were shown not to be significant for 45° and 60° shearwave probes and for 70° longitudinal wave probes.
A study performed as part of the ENIQ 2nd Pilot Study project (22) investigated the loss due to 2 layer strip cladding on the one way transmission of a 1.5MHz 60° shearwave beam orientated perpendicular to the welding direction. This study showed that:
Generally the loss compared with unclad material was low (~2dB) but localised losses of the order of 9dB, attributable to surface error of form, could occur. This is consistent with the other studies referred to above implying a general
40
loss in two way transmission of ~4dB but with significant localised variations arising from the effect of surface error of form on probe coupling.
Taken together the above studies indicate that the greatest influence of 2 layer strip cladding on the current inspection will be on the shearwave beams directed perpendicular to the welding direction. The 70° shearwave is likely to be rendered unreliable by virtue of beam distortion. The 45° and 60° beams should be useable provided that 18dB is added to the reference calibration level in order to account for the effect of the cladding losses. In the present case a cladding correction of 6dB21 is applied. This is larger than any effect directly attributable to the structure of the cladding layer in all of the above studies, although not sufficient to account for the maximum losses observed when the effect of surface error of form at the intersection of the cladding strips is taken into consideration. It is argued that in the present inspection it would be extremely improbable that a defect of qualification size (15mm x 30mm) could be located in a position where all the interrogating probes were located at positions where surface error of form could reduce the sensitivity by the maximum amount seen in the parametric study. Also the losses reported are for transmission perpendicular to the cladding direction and constitute the worst case. The transmission direction relative to the cladding varies with azimuthal position and around most of the nozzle the actual loss expected will be lower than the correction applied. Applying the maximum correction for all beam angles, modes and probe orientations would make the inspection sensitivity for most of the inspection volume more sensitive than required and is considered likely to result in false calls arising from cladding noise. The author is not aware of any published material addressing specifically the issue of cladding correction for 70°TRL probes of the type recommended for performing underclad crack detection (7). This may be because in many such inspections use is made of calibration blocks with representative cladding, which renders correction unnecessary. In the absence of specific information it is considered reasonable to assume that, as with the shearwave probes, the greatest effect on the performance of the 70°TRL probes will be due to the influence of surface error of form on probe coupling, and hence to apply the same correction as for the other probes used. 8.2 70° TRL probe performance A limited number of inspection results from pre and post clad inspections of nozzle assembly 21 have been made available to the author (23), with the intention of showing the influence of cladding on the 70° TRL probe performance. This was done
21 The cladding correction and acceptable noise levels defined in the procedure were determined empirically before the parametric analysis was performed, with the main determining factor being the avoidance of excessive noise indications. In the opinion of the author the parametric studies indicate that a correction of 10dB would have been more appropriate than the 6dB value used, although this would need to be balanced against the risk of increasing the number of false calls arising from noise exceeding the recording threshold.
41

by selecting two pairs of defects where the parameters of one defect from each pair after cladding was approximately equivalent, in terms of location, size and orientation, to those of the other defect in the unclad state. The results obtained from this comparison were inconclusive; in the unclad state the maximum response from an untilted 5mm high surface breaking defect was only 1.4dB above the reporting threshold and the equivalent post cladding defect, which was wholly embedded in the cladding, was not detected. A 5mm high defect with 10° tilt and 5° skew gave a peak response 10dB above the recording threshold in the unclad state but the equivalent defect in cladding was not detected. It should be noted that the amplitude response modelling reported in Section 6.2 predicts responses 1.1dB below and 1.4dB above the recording threshold respectively for 15mm high defects in locations similar to these. The latter result especially suggests that the model may be unduly pessimistic. These results for the 70°TRL probes are somewhat surprising as other studies (24) indicate that techniques using probes of the type deployed in this procedure are capable of detecting defects ≥5mm throughwall extent in cladding.
9 Equipment and data analysis considerations22
9.1 Evidence in support of selected hardware
9.1.1 UT probes UT probes have been selected on both theoretical and empirical considerations and Section 5.4 discusses how the beam mode, angle, frequency, and crystal size have been selected for the inspections. The probes specified are manufactured to rigorous specifications intended to achieve control of performance and their performance is checked prior to the inspection commencing and on a regular basis during use to identify any degradation. The tolerances that are applied to these checks are such that variations in performance between individual probes which are notionally identical are judged to have an insignificant effect upon the signals and signal to noise ratios from defects. Hence individual probe choice will not significantly affect the inspection outcome, even at the extremes of the allowable ranges. This assertion is justified by the experience gained 22 The information in this section is indicative of the type of information that should be included in the justification of equipment selection. The details are not necessarily correct as the author is not familiar with all details of the inspection systems and software. In some instances, for example probes and the inspection manipulator, additional support for the claimed performance could be provided by the inclusion of references to purchase acceptance test results or use in previous qualification trials.
42
over many years from the application of national and international standards for the manufacture and use of ultrasonic probes. 9.1.2 UT system (hardware) Key performance parameters of UT digital flaw detectors for general use are:
1. Timebase linearity 2. Amplifier linearity 3. Dynamic range 4. Pulser output 5. Filter characteristics 6. Programmable delay and recording window length 7. Sampling frequency 8. Sampling (amplitude) resolution 9. Pulse repetition frequency 10. Signal averaging
Experience gained over many years of operation in the industrial sector has resulted in the codification of instrument requirements in national and industry standards23 and the basic justification for the selection of the UT system therefore relies primarily upon an acceptance that initial compliance with such standards, coupled with yearly calibration and regular checks to monitor continued compliance, is adequate to ensure the accuracy and repeatability of measurements performed. In addition, the particular instrument to be used for inspection will be subject to periodic tests and calibration to ensure compliance with the procedure requirements throughout the duration of the inspection. Appropriate values for the parameters in the above list have been determined empirically and are fixed by the procedure (See Appendix 1). Erroneous selection of alternative values could degrade performance. Experience shows that variation in performance between notionally identical instruments is unlikely to significantly affect performance. 9.1.3 Scanner and positional control The inspection is designed to be implemented by a dedicated nozzle scanning mechanism with a minimum of radial (Y) and azimuthal (X) movements and sufficient compliance in the axial (Z) direction as to allow the probes to remain in contact with the inspection surface over the full scan extent. The use of such a scanner increases the reliability of indication positional information by accurately recording the location of the probe in the component co-ordinate system at the time when a particular data point was collected. This allows the position of
23 Normally the applicable standards should be referenced explicitly.
43

indications to be determined accurately and repeatably and helps ensure that full coverage is achieved. A properly designed nozzle scanner with motor drive, position encoding, a suitable motor controller and appropriate control software should be capable of providing positional resolution on the major axes of the order of 0.1mm and positioning accuracy of the order of ±1mm. The major error in position measurement is therefore likely to be that arising from the use of visual methods for setting the datum position. It is estimated that an overall setting accuracy of ±3mm is achievable in practice, which is more than adequate to ensure that defects are properly located. During UT data collection positional information is recorded by the UT system. The overall positional accuracy depends predominantly upon accurate setting of the encoder conversion factors to ensure that the direction and magnitude of movements agrees with those required by the inspection procedure. Provided that a suitable manipulator is mounted and used in accordance with the requirements of the inspection procedure it is considered that positional accuracy will be sufficient for defect detection requirements. The present procedure specifies the use of a nozzle scanner supplied by Force Institute. 9.1.4 Calibration blocks Calibration blocks have two main purposes. Firstly to ensure that essential parameters relating to the equipment (e.g. beam angle, pulse length, timebase and amplifier linearity) are as specified and secondly to ensure that parameters relating to the procedure (e.g. timebase extent and recording sensitivity) are properly set. The inspection procedure describes 4 fine grained forged CL508 ferritic steel calibration blocks which are used for probe checks and initial sensitivity setting. It is recognized that variations in material microstructure, component geometry, surface finish and defect morphology could all adversely affect inspection capability and that it is not generally feasible to address the full range of these variables when designing test blocks. This inspection uses calibration blocks that are independent of component details and individual defect behaviour and where necessary makes an empirical correction for differences between the test blocks and the inspection component. 9.2 Evidence in support of selected software The data collection, display and analysis software must be fully compatible with the UT instrument used to perform the inspection.
44
The data collection software is required to be capable of capturing and recording RF and/or peak detected data over the full range of interest determined by the input group parameters and by other parameters of the NDT system group. The data display and analysis software is required as a minimum to be able to display records in A, B, C and D scan formats, to have controls for the selection and optimisation of views containing potential defect indications and tools capable of determining the location, extent and amplitude of any defect indications. In the present procedure data is collected using TomoScan software version 1.4BO and analysed using TomoView version 1.3RO. These programs allow multiple probe P/E inspections to be performed and analysed and are appropriate for the tasks for which they are used. These programs and earlier versions from which these have been derived are commercial products, developed, produced and tested with appropriate quality systems. They have a substantial history of previous use in nuclear inspections, including qualified inspections24.
10 Review of evidence and statement of capability
In order to meet the inspection requirements relating to the detection of defects in Nozzle assembly 21, automated ultrasonic inspection will be performed using the pulse-echo technique and probes of a relatively low frequency. The proposed methods are appropriate for the morphology and orientation of the expected defects. The inspection will be applied according to a written procedure which has been developed specifically for this inspection. The procedure is to be implemented by a team of trained inspection personnel having the requisite qualifications, experience and job specific training. An automated manipulator is used to perform the required scanning movements. It is considered that the most significant error in defect location is likely to arise from the use of visual methods for datum setting. The size of the likely errors relative to the size of the qualification defect and the fact that coverage of the whole inspection volume is achieved using a single probe setup makes it highly unlikely that defect detection capability would be compromised by such errors. A commercial digital UT system with a substantial record of successful deployment in similar inspections is used to collect, record and analyse the inspection data. The
24 Normally relevant documented examples would be referenced where available.
45
designed performance of the system hardware is considered adequate for the inspection requirements and is maintained in use by appropriate periodic checks. The performance of the associated data collection and analysis software is also considered to be adequate for the inspection requirements. The essential parameters of the inspection have been identified and examined in detail. It is concluded that: provided the equipment is selected and maintained according to the specified requirements and the procedure is properly applied by qualified and experienced personnel, the performance objectives of the inspection should be partially met as discussed below. Geometric modelling has shown that full coverage of the inspection volume can be achieved and has indicated those regions where defect response is likely to be lowest. Amplitude response modelling using a validated model has been performed for plausible defects, including worst case defects, located within the inspection volume, in order to predict the likely defect response relative to the reporting threshold. For the ferritic part of the inspection volume, most of the defect detection capability is given by the use of the tandem probes, which are predicted to achieve incidence on fusion face and untilted surface breaking or underclad cracks with a misorientation angle of less than 15° and hence likely to give rise to recordable indications at all azimuthal locations . Amplitude modelling indicates that even in the worst cases identified, qualification size defects will give rise to signals more than 15dB above the recording threshold. For tilted surface breaking and underclad cracks in the near surface region, detection capability is given by the use of 70° TRL probes. Amplitude modelling predicts that near surface defects with tilt ≥ 5° will be detected but that untilted cracks will not be reliably detected with these probes and that the presence of defect skew will reduce performance still further. However, given the qualification defect size, the tandem inspection is predicted to be capable of detecting untilted cracks, with or without skew, in the near surface region. Given the empirical evidence from a number of round robin trials and qualification exercises (Section 7.2.2), where 70° TRL probes gave good performance for the detection of smooth cracks, similar to those considered here, the modelling results suggest that either the selected reporting threshold is too high, or that the predicted response is pessimistic. The limited parametric study presented in Section 8.2, albeit involving only two cases, suggests that the latter may be the case, but it is recommended that empirical trials are performed to fully resolve this point. The 60° and 70° shearwave probes give some redundancy of coverage for defects of qualification size but are not expected to give highly reliable defect detection due to high misorientation angles and the poor near surface resolution which is typical of low frequency single crystal probes. The tandem probes can be deployed only from the vessel side of the weld, but this is of no consequence as the primary defects sought by this configuration are orientated at +4° or -4° relative to the nozzle axis, and although the modelling indicates some sensitivity to azimuthal position, the predicted defect signal amplitudes remain
46
substantially above the reporting threshold even in the worst case locations. It is noted that this assessment relies in part upon the use of a model of unspecified validity, i.e. no account is taken of non-coplanarity of the incident and reflected rays and simplified field approximations had to be used (Section 6.2). Consequently it is advised that some degree of empirical confirmation of the predicted performance should be sought. Scanning restrictions on the nozzle side of the weld limits deployment of the 60° and 70° shearwave probes. This would make it difficult to detect the full extent of a large defect with maximum specified (20°) tilt away from the nozzle axis, located on the nozzle side of the weld. However, of the specified defect types only an underclad crack with a height greater than ~30mm could be expected to be found in this region of restricted coverage and such a defect would by definition have some part within the depth range where there is no restriction on access. The likely effect of the austenitic strip cladding layer has been assessed using previously published information and a dedicated parametric study. It has been concluded that provided the specified correction is applied to the inspection sensitivity for each probe, inspection performance will not be impaired. The cladding correction applied does not fully compensate for the maximum predicted cladding related losses. However, the evidence indicates that these maximum losses are most likely related to surface error of form and are therefore likely to occur only at localised positions. They depend both upon the position of the probe relative to the boundaries between individual cladding strips and the orientation of the probe relative to the cladding. Therefore basing the correction upon the worst case would be overly conservative and could increase the risk of false calls arising from cladding noise. The value chosen for the cladding correction (6dB) is considered sufficient to compensate for the expected cladding losses over most of the inspection surface, given the fact that the qualification flaw height and length are approximately 25% and 50% respectively of the cladding strip width. Hence it is considered unlikely that a localised reduction in performance would completely mask such a defect. As the cladding correction is based upon consideration of shearwave transmission, and as longitudinal waves are relatively unaffected by transmission through cladding (7), its application to the 70°TRL probes is considered to be more conservative than is the case for the shearwave probes. A requirement for flaw location accuracy is not stated in the inspection scope. Errors in flaw location arising from variations in beam angle caused by transmission through the cladding layer are considered not to be significant for defect detection capability as the evidence shows that 1.5MHz, 45° ultrasonic beams, as used for the tandem inspection, and the 2MHz 70° TRL probe beams, used to detect surface breaking and underclad cracks, are not significantly affected by beam skewing. The same is not true for the 70° shearwave beams, but as these beams do not contribute significantly to the detection capability, this is unlikely to be of any consequence.
47

In summary, based upon considerations of physical reasoning, supported by theoretical modelling and experimental evidence from previous work and from parametric studies, it is concluded that for qualification size defects: • The tandem probe inspection deployed should be capable of detecting all defects
located anywhere within the ferritic material. • The 70°TRL probe inspection should be capable of detecting surface breaking
unskewed cracks with tilt angles exceeding 5°, and skewed cracks with tilt angles exceeding 10°, although the margin for detection is predicted to be small in both cases.
• On the basis of the presented evidence it would appear that untilted cracks or lack
of fusion defects may not be detected using 70°TRL probes, a result which appears to be at variance with evidence from other studies, where probes of the same type have been shown to be capable of detecting untilted cladding cracks ≥5mm in throughwall extent (24). However, in the present case the qualification defect size is such that even surface breaking defects will extend into the region where detection via the tandem probe inspection can be expected and the predicted amplitude responses are sufficiently high that even worst case defect skew (5°) is unlikely to compromise this capability. Despite this, largely in consideration of the fact that there is some uncertainty regarding the validity of some of the modelling results, it is recommended that empirical trials be performed to determine actual capability for surface breaking defects.
Note that one possible requirement from the technical justification is to consider the consequences of all significant parameters being subject to variation within their individual tolerance. This has not been considered here explicitly and it should be noted that although it has been concluded that the effect of varying many of the individual essential parameters within the allowable limits will be negligible, it is not claimed that operation with all essential parameters simultaneously set to their limiting values will give results within the specified requirements.
11 Input on test-pieces for practical trials25
Although the geometry of the nozzle to be inspected is expected to influence inspection performance to some degree, the curvatures involved are sufficiently large that for investigation of the P/E inspection capability for the specified defects it should 25 This section is included for conformity with the RP2 (2). In the context of the Pilot Study it is not relevant as there is no intention to produce qualification testpieces. In a real inspection this section would provide guidance to the qualification body. It should also be noted that some or all of these testpieces might not be required if more parametric studies were performed.
48
be sufficient to work with parallel sided flat plate specimens without unduly prejudicing the validity of the results obtained. This is not true in the case of the tandem inspections and it is recommended that as a minimum any specimen built to test tandem inspection capability should have curvature representative of the vessel shell. As the weld concerned is made with and between ferritic material it is not necessary to reproduce the weld in the test pieces and the testpieces can be produced from ferritic plate. As the defects of concern are smooth and planar they can be represented by simple targets such as slots or fatigue cracks. The influence of the cladding layer is identified as a key feature of the inspection and it is advised that at least one testpiece should be produced with representative 2 layer strip cladding and a selection of defects that will allow the predicted performance to be tested. Defects to be included in the testpieces should include those listed in Table 5 and as a minimum should consist of the following worst case defects:
2 - untilted, skewed, surface breaking defect 7 - near surface defect on shell side fusion face 9 - maximum depth, shell side fusion face defect at worst azimuthal location.
This will not only demonstrate capability for worst case defects, it will also provide an indication of the validity of the modelling results for those cases not tested empirically. If simplified testpieces are used for practical trials, manipulator operation may be tested using either a full scale model component of the nozzle geometry or any available nozzle with similar geometry and dimensions.
12 Conclusions and recommendations
The key essential parameters of the input group for the proposed inspection are those that define the defect population i.e. defect type, defect size and defect orientation. Consequently the essential parameters of the equipment group that should be addressed in qualification to ensure that the inspection meets the specified requirements are:
Use of the tandem technique for the detection of defects orientated close to the surface normal and on the weld fusion faces, and those parameters that directly affect its application i.e. probe separation, beamspread, scan limits and inspection sensitivity.
49
Use of 70° TRL probes for the detection of near surface defects and in particular the inspection sensitivity and recording threshold applied to the use of these probes. The value of the cladding correction applied to account for the loss of signal that arises from the presence of two layer strip cladding on the inspection surface.
Following consideration of these and all other essential parameters listed in section 4.1, it is concluded, based upon consideration of physical reasoning, theoretical modelling, parametric studies and documented previous experience, that the inspection procedure under consideration (5), provided it is properly implemented by suitably qualified and experienced personnel, is capable of detecting all defects in the ferritic part of nozzle assembly 21 that meet or exceed the qualification defect specification, but that reliability could be improved by optimising the tandem setting and by increasing the sensitivity of the near surface inspections. The claimed performance relies heavily upon the predicted capability of a single tandem probe set-up. As there is some uncertainty regarding the validity of the calculation performed (22) it is recommended that empirical confirmation of the predicted performance is sought using simplified test blocks, at least one of which should be clad with 2 layer strip cladding and include skewed surface breaking defects. The capability for detecting all surface breaking and underclad defects of qualification size through the use of 70° TRL probes cannot be fully justified. Defects with tilt angles between 10° and 20°, with or without skew and unskewed defects with tilt between 5° and 10° should be detected, although the evidence is not extensive. However, defects orientated perpendicular to the inspection surface are predicted to give a response below the reporting threshold, and even though it is likely that such flaws will be detected by the tandem probe inspection, it is recommended that empirical trials be performed to determine the actual capability for such flaws.
13 References
1) ENIQ TGQ(00). Method of Working. Issue 1. 26 September 2002. 2) ENIQ recommended practice 2: Recommended contents for a technical
justification. Issue 1. ENIQ Report nr. 4, EUR18099 EN. July 1998.
3) ENIQ recommended practice 1: Influential/Essential Parameters. Issue 2 ENIQ Report nr. 24, EUR21751 EN. June 2005.
50
4) Technical Justification for the 2nd Pilot Study Phase 1 Inspection of ENIQ Nozzle Assembly 1. AEAT/RD02581001/R1 Draft1.
5) Inspection Procedure for the 2nd ENIQ Pilot Study. ENIQ.PILOT2(04) 4 Draft 3. March 2004.
6) EN 473:2000 Non-destructive testing – Qualification and certification of NDT
personnel –General principles.
7) RJ Hudgell IIW Handbook on the Ultrasonic Examination of Austenitic Clad Steel Components. EUR 15787 EN 1994.
8) Ultrasonic Inspection of Heavy Steel components: The PISC II Final Report.
Edited by RW Nichols. Elsevier 1988. 9) Experimental Studies of Ultrasonic Reflection from Various Types of
Misorientated Defect. MW Toft CEGB OED/STN/87/20060/R 10) J Krautkrämer and H Krautkrämer Ultrasonic Testing of Materials. 4th Edition.
Springer-Verlag. 1990. Pg 105.
11) KANDE International internal document KP4/1/3/001.0 October 2005.
12) CIVA, an integration software platform for the simulation and processing of NDT data, P Calmon, S Leberre, T Sollier, P Benoist, in proceedings of the 16th World Conference on NDT. 2004
13) Inspection Simulations – Input for Writing a Technical Justification. ENIQ.PILOT2 (05) 3 Draft 1. August 2005.
14) The UKAEA defect detection trials on test-pieces 3 and 4. The British Journal of
Non-Destructive Testing, February 1984, Volume 26, Number 2 B Watkins, D Lock, KJ Cowburn, RW Ervine.
15) PISC II Report No. 5 - September 1986 (Final Issue) 16) Qualification of Sizewell ‘B’ Ultrasonic Inspections - Messages for Performance
Demonstration. PJ Conroy, KS Leyland & C Waites. October 1993 17) The influence of strip and MMA austenitic cladding on the ultrasonic detection
of artificial defects. AM Stansfield. CEGB report NWR/SSD/82/0007/R. 1982. 18) The influence of austenitic cladding structure on transmission of ultrasonic
shear waves and its effect on defect detection. AB Wooldridge and PG Duffy. CEGB report NWR/SSD/82/0006/R. 1982
51
19) An investigation of ultrasonic shear wave noise caused by austenitic cladding. D Denby. CEGB report NWR/SSD/82/008/R. 1982.
20) Measurements of ultrasonic noise from austenitic cladding relative to calibration
reflectors using twin crystal 70° compression wave probes. AM Stansfield. CEGB report NWR/SSd/84/0007/R. 1984.
21) A comparison of the influence on ultrasonic inspection of 3-wire and MMA cladding with that of strip cladding. MJ Whittle & I Atkinson. AEAT-5414 Issue 1. April 1999.
22) ENIQ 2nd pilot study. Report parametric study. ENIQ.PILOT.2 (05) 2 Draft 3. April 2005.
23) Investigation of cladding effect on the inspection results of surface-breaking defects – TRL probes. T Seldis JRC September 2005.
24) Effect of cladding on inspection results. M. Bièth, L. Fabbri, J.L. Monjaret. 2nd International Conference on NDE in Relation to Structural Integrity for Nuclear and Pressurized Components, New Orleans May 2000.
52

Appendix 1: Set 2 essential parameters of the NDT system group
Influential parameter
Acceptable value/range and tolerance
Procedure Value Analysis Reference
Actual beam angle
Nominal ± ≤ 5° Nominal ±5° for each probe *
Tolerance made up of ±2° from probe manufacturing specification and ±3° from allowable variation between repeat calibrations.
6.2
Pulse length <6 cycles at 10% peak height limits
Not specified, value and allowed variation fixed by probe spec.*
Short pulse lengths are required to give adequate resolution between defects and geometric signals and to minimise scatter noise generated in the cladding layer.
9.1
Number of probe elements
1 or 2 per probe 1 or 2 Twin crystal TRL probes have short near surface dead zone allowing inspection close to surface. Single crystal probes are adequate for all other beams.
7.2.2
Case size Max <60mm x 60mm Min depending upon crystal dimensions.
40mm x 40mm * Must be small enough to allow adequate contact on surface and access to all scanning areas and large enough to allow desired probe performance to be achieved. There is some evidence that typical strip clad surfaces may suffer from error of form at the boundaries between strips that is sufficient to degrade the performance of probes of the specified size. Coupling performance could be improved by the use of smaller probes but other aspects of probe performance are likely to be adversely affected by such a change.
8.1
Shoe profile Flat or profiled to surface.
Flat.* The specified surface curvature and max. probe sizes are such that flat probes will have a couplant gap not >0.5mm and should therefore give adequate coupling
Index point Design value - no Not specified, value Has only minor influence on defect detection capability.
53

Influential parameter
Acceptable value/range and tolerance
Procedure Value Analysis Reference
position constraintAccuracy of marking ±1mm Allowable random variation between measurements ±2mm Allowable systematic change due to shoe wear <±2mm
fixed by probe specification. Tolerance ±3mm (±1mm from probe spec and ±2mm allowable variation between repeat calibrations. *
Scan lengths exceed minimum required for volumetric coverage and accurate positioning is not necessary for flaw detection.
Delay to start of window
0≤ value ≤ 0.8 x minimum beam path length / velocity
0 mm * Must be set to allow capture of relevant signals. Instrument performance is subject to annual checks.
Data collection window length
For angle probes value > max depth/cos(α) + 10% For Tandem probes value > T/cos(45°) +10%
Angle probes 0-80mm to 0 -180mm according to beam * Tandem probes26
Must be set to allow capture of relevant signals. Instrument performance is subject to annual checks.
Time delay calibration
≤ ±10% ±10% on time delay* Detection capability is insensitive to time delay deviations given the specified data collection windows. Routine calibration checks enable the detection of instrument failure or incorrect setting.
PRF ≤ 10kHz Not specified Generally a compromise between data collection speed, 26 Procedure does not specify value for Tandem probes
54
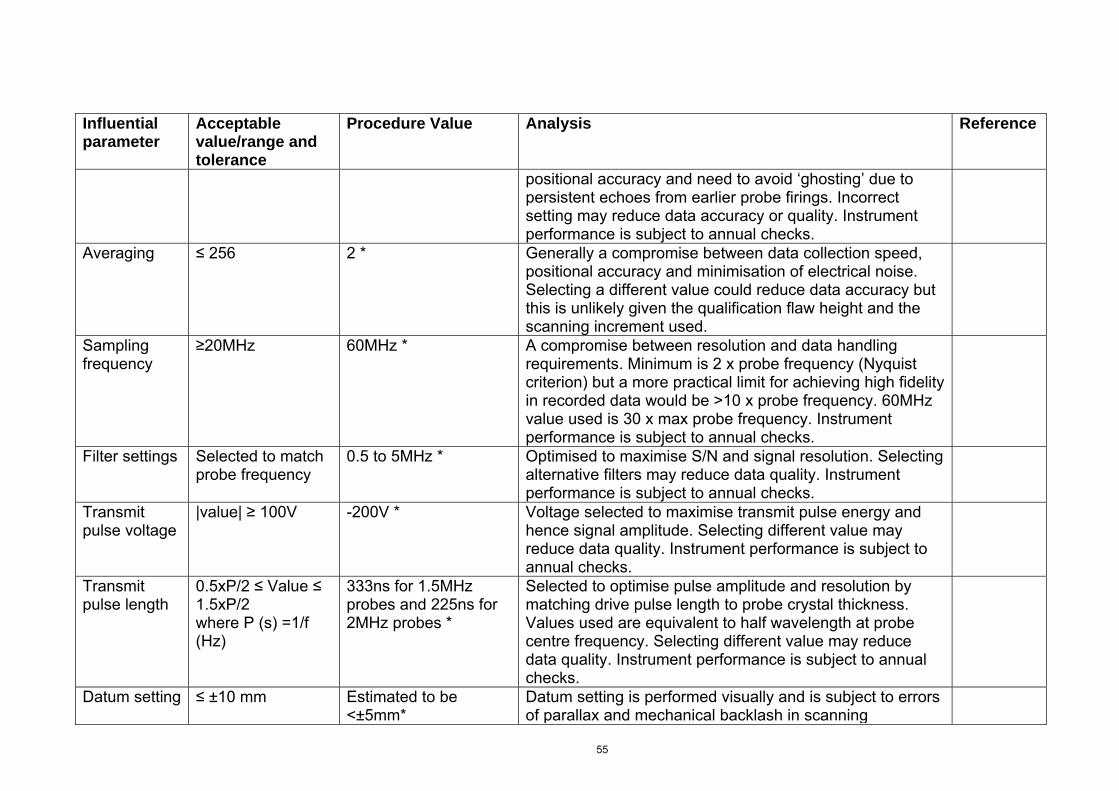
Influential parameter
Acceptable value/range and tolerance
Procedure Value Analysis Reference
positional accuracy and need to avoid ‘ghosting’ due to persistent echoes from earlier probe firings. Incorrect setting may reduce data accuracy or quality. Instrument performance is subject to annual checks.
Averaging ≤ 256 2 * Generally a compromise between data collection speed, positional accuracy and minimisation of electrical noise. Selecting a different value could reduce data accuracy but this is unlikely given the qualification flaw height and the scanning increment used.
Sampling frequency
≥20MHz 60MHz * A compromise between resolution and data handling requirements. Minimum is 2 x probe frequency (Nyquist criterion) but a more practical limit for achieving high fidelity in recorded data would be >10 x probe frequency. 60MHz value used is 30 x max probe frequency. Instrument performance is subject to annual checks.
Filter settings Selected to match probe frequency
0.5 to 5MHz * Optimised to maximise S/N and signal resolution. Selecting alternative filters may reduce data quality. Instrument performance is subject to annual checks.
Transmit pulse voltage
|value| ≥ 100V -200V *
Voltage selected to maximise transmit pulse energy and hence signal amplitude. Selecting different value may reduce data quality. Instrument performance is subject to annual checks.
Transmit pulse length
0.5xP/2 ≤ Value ≤ 1.5xP/2 where P (s) =1/f (Hz)
333ns for 1.5MHz probes and 225ns for 2MHz probes *
Selected to optimise pulse amplitude and resolution by matching drive pulse length to probe crystal thickness. Values used are equivalent to half wavelength at probe centre frequency. Selecting different value may reduce data quality. Instrument performance is subject to annual checks.
Datum setting ≤ ±10 mm Estimated to be <±5mm*
Datum setting is performed visually and is subject to errors of parallax and mechanical backlash in scanning
55

Influential parameter
Acceptable value/range and tolerance
Procedure Value Analysis Reference
mechanism. Errors could be random and/or systematic and will limit defect location accuracy achievable but have little effect on detection capability.
Datum identification and marking
≤ ±10 mm As per manufacturing specification. Expected to be < few mm
Datum positions are marked on the specimen. Accuracy of defect location depends on accuracy of datum marking. Errors will result in a systematic error in reported defect location but will have no influence on detection capability.
Scanner alignment
Z axis must be aligned within 5° of nozzle axis.
Not specified Scanner is aligned using visual checks against datum marks. Significant misalignment would give rise to systematic location errors.
Scanning speed
≤ 100mm/s ≤ 50mm/s * An upper limit is set to ensure that the inspection volume is adequately sampled and that coupling is maintained.
Component temperature
Tcomponent ≤40°C Tcal block = Tcomponent ±15°C
Not specified Temperature can affect beam angle and sensitivity but component and calibration blocks are at ambient temperature and hence temperature is not an important parameter in this case.
Display presentation
C scan or B and D scan
Projected volumetric C-scan used
Selection and use of data presentation options is addressed by operator training.
Data display parameters
Display software should allow adjustment of image size, extent and amplitude resolution.
Not addressed Poor selection of display parameters may limit performance achievable. It is assumed that operator training addresses display optimization.
Cable type Low loss 50Ω screened coaxial cable with diameter ≥ 2.5mm
RG58 and RG174 * Selected to give adequate performance. Selection of different cable types could affect S/N performance and hence change effective inspection sensitivity.
56
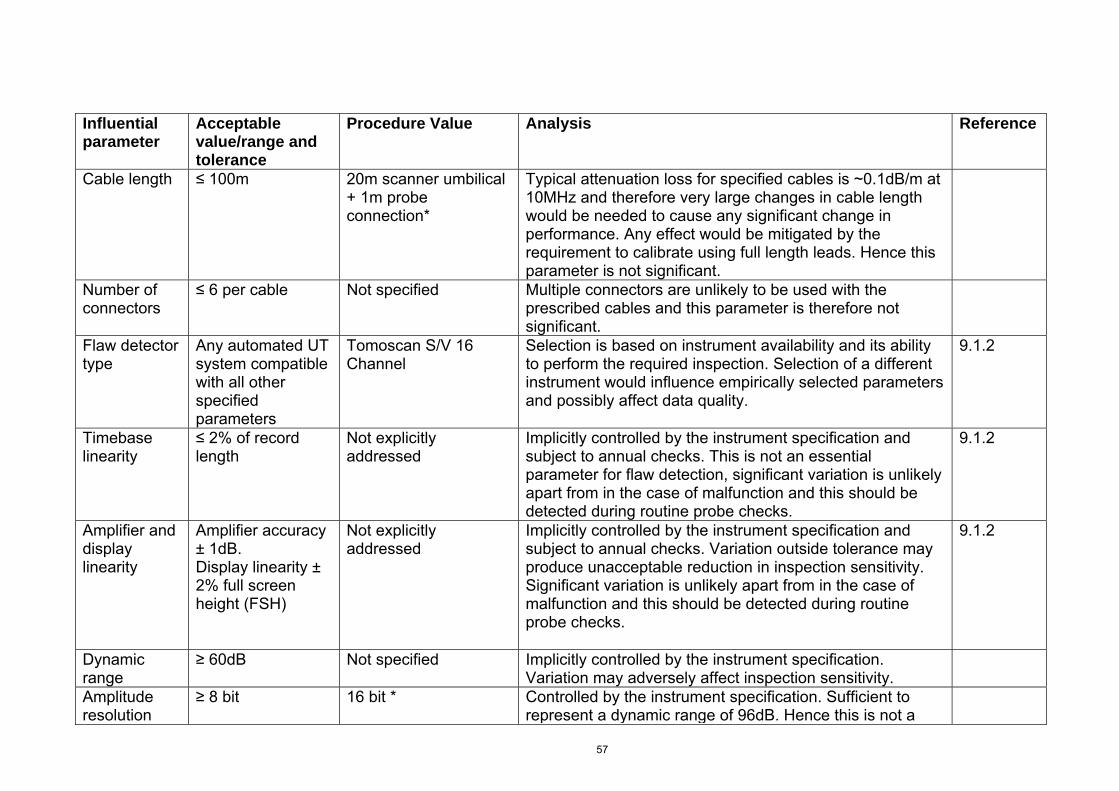
Influential parameter
Acceptable value/range and tolerance
Procedure Value Analysis Reference
Cable length ≤ 100m 20m scanner umbilical + 1m probe connection*
Typical attenuation loss for specified cables is ~0.1dB/m at 10MHz and therefore very large changes in cable length would be needed to cause any significant change in performance. Any effect would be mitigated by the requirement to calibrate using full length leads. Hence this parameter is not significant.
Number of connectors
≤ 6 per cable Not specified Multiple connectors are unlikely to be used with the prescribed cables and this parameter is therefore not significant.
Flaw detector type
Any automated UT system compatible with all other specified parameters
Tomoscan S/V 16 Channel
Selection is based on instrument availability and its ability to perform the required inspection. Selection of a different instrument would influence empirically selected parameters and possibly affect data quality.
9.1.2
Timebase linearity
≤ 2% of record length
Not explicitly addressed
Implicitly controlled by the instrument specification and subject to annual checks. This is not an essential parameter for flaw detection, significant variation is unlikely apart from in the case of malfunction and this should be detected during routine probe checks.
9.1.2
Amplifier and display linearity
Amplifier accuracy ± 1dB. Display linearity ± 2% full screen height (FSH)
Not explicitly addressed
Implicitly controlled by the instrument specification and subject to annual checks. Variation outside tolerance may produce unacceptable reduction in inspection sensitivity. Significant variation is unlikely apart from in the case of malfunction and this should be detected during routine probe checks.
9.1.2
Dynamic range
≥ 60dB Not specified Implicitly controlled by the instrument specification. Variation may adversely affect inspection sensitivity.
Amplitude resolution
≥ 8 bit 16 bit * Controlled by the instrument specification. Sufficient to represent a dynamic range of 96dB. Hence this is not a
57
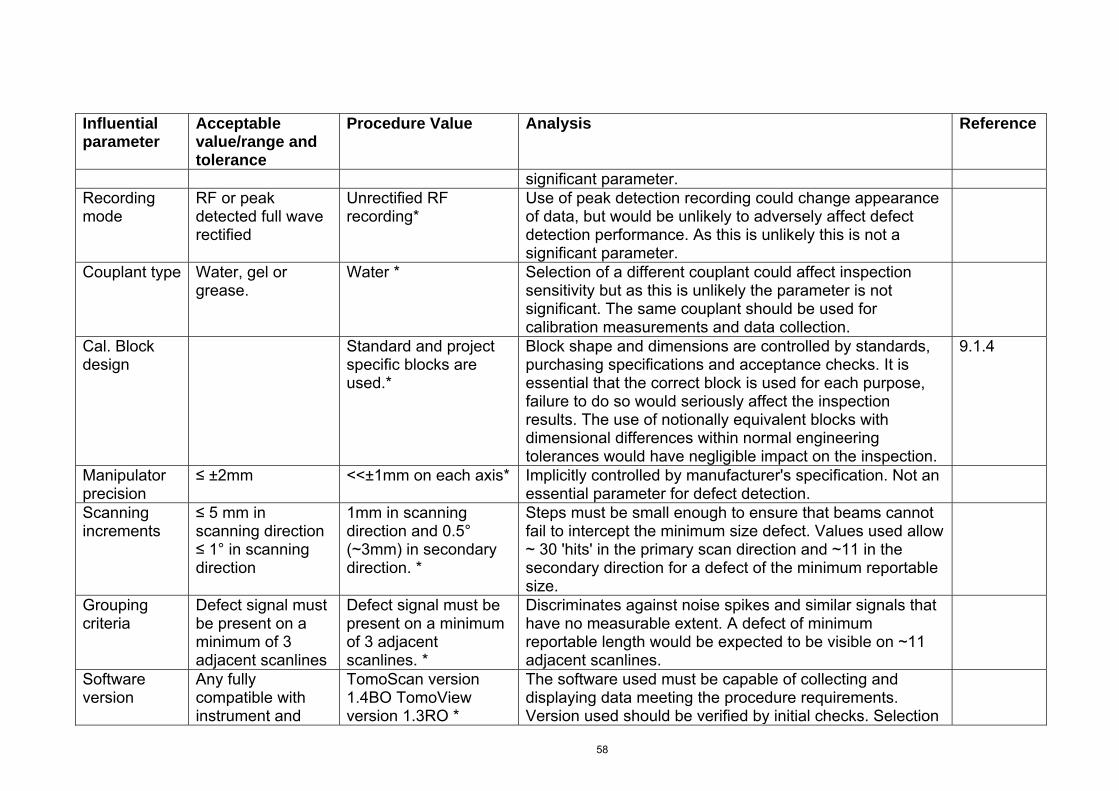
Influential parameter
Acceptable value/range and tolerance
Procedure Value Analysis Reference
significant parameter. Recording mode
RF or peak detected full wave rectified
Unrectified RF recording*
Use of peak detection recording could change appearance of data, but would be unlikely to adversely affect defect detection performance. As this is unlikely this is not a significant parameter.
Couplant type Water, gel or grease.
Water * Selection of a different couplant could affect inspection sensitivity but as this is unlikely the parameter is not significant. The same couplant should be used for calibration measurements and data collection.
Cal. Block design
Standard and project specific blocks are used.*
Block shape and dimensions are controlled by standards, purchasing specifications and acceptance checks. It is essential that the correct block is used for each purpose, failure to do so would seriously affect the inspection results. The use of notionally equivalent blocks with dimensional differences within normal engineering tolerances would have negligible impact on the inspection.
9.1.4
Manipulator precision
≤ ±2mm <<±1mm on each axis* Implicitly controlled by manufacturer's specification. Not an essential parameter for defect detection.
Scanning increments
≤ 5 mm in scanning direction ≤ 1° in scanning direction
1mm in scanning direction and 0.5° (~3mm) in secondary direction. *
Steps must be small enough to ensure that beams cannot fail to intercept the minimum size defect. Values used allow ~ 30 'hits' in the primary scan direction and ~11 in the secondary direction for a defect of the minimum reportable size.
Grouping criteria
Defect signal must be present on a minimum of 3 adjacent scanlines
Defect signal must be present on a minimum of 3 adjacent scanlines. *
Discriminates against noise spikes and similar signals that have no measurable extent. A defect of minimum reportable length would be expected to be visible on ~11 adjacent scanlines.
Software version
Any fully compatible with instrument and
TomoScan version 1.4BO TomoView version 1.3RO *
The software used must be capable of collecting and displaying data meeting the procedure requirements. Version used should be verified by initial checks. Selection
58
Influential parameter
Acceptable value/range and tolerance
Procedure Value Analysis Reference
procedure requirements
of different versions may invalidate empirical evidence supporting procedure.
* Selection is based on past experience and/or on the results of empirical trials performed during procedure development and may be further qualified by successful completion of any qualification trials subsequently performed.
59

European Commission EUR 22208 EN – DG JRC – Institute for Energy TECHNICAL JUSTIFICATION FOR THE ENIQ 2nd PILOT STUDY Editors Ian Atkinson Arne Eriksson Thomas Seldis Abstract This Technical Justification is the outcome of the activity of ENIQ – the European Network for Inspection and Qualification - as a part of the ENIQ second pilot study. The main objective of the 2nd pilot study was to show how to fully exploit the potential of Technical Justifications in the qualification of inspection procedures and thereby reduce the number of test piece trials on full-scale components. A specification was drawn up of the ferritic BWR-type nozzle to shell weld and the defects that the inspection was required to find and an automated ultrasonic inspection was designed to detect them. The evidence in this TJ came mainly from physical reasoning, theoretical modeling and results from previous work. The Technical Justification predicts whether the designated inspection would be successful in detecting the specified range of defects in the test piece. This Technical Justification has been developed as a consensus document amongst the members of ENIQ .

The mission of the Joint Research Centre is to provide customer-driven scientific and technical support for the conception, development, implementation and monitoring of EU policies. As a service of the European Commission, the JRC functions as a reference centre of science and technology for the Union. Close to the policy-making process, it serves the common interest of the Member States, while being independent of special interests, whether private or national.