Embed Size (px)
Citation preview

Technical X
-- . .........'L:SCULSSnSDiscusssions
Washington, D.C.October 1975
Provisional Agenda Item 20
AA
.A 4-
CD23/DT/1 (Eng.)14 August 1975ORIGINAL: SPANISH
METHODOLOGIES FOR THE FORMULATION OF NATIONAL FOOD ANDNUTRITION POLICIES AND THEIR INTERSECTORAL IMPLEMENTATION
g ~ ~ ~ 7 I: A = -7 ,' ;r11A

This working document, prepared for consideration and
analysis by the participants in the Technical Discussions ofthe XXIII Meeting of the Directing Council of the Pan AmericanHealth Organization, has primarily emphasized the role of theministries of health in the formulation and implementation of
national food and nutrition policies and plans, as well as the
responsibilities that devolve upon them directly in executing
and evaluating specific food and nutrition programs withinthe health sector itself.
The methodological aspects implicit in the formulation
of national food and nutrition policies have not been dealt
with in detail, since it was deemed to be of greater practicalinterest to analyze the strategies and activities that must
be carried out by the health sector in that process.
Furthermore, various PAHO/WHO/FAO expert committees
have produced documents on the methodological principles forthe intersectoral formulation and execution of those policies.
More recently, methodological guidelines have been
prepared for the Interagency Project for the Promotion ofNational Food and Nutrition Policies (PIA/PNAN), the Instituteof Nutrition of Central America and Panama (INCAP) and the
Caribbean Food and Nutrition Institute (CFNI), and have beenused as an important reference source by the countries of the
Region.

METHODOLOGY FOR THE FORMULATION OF NATIONAL FOOD ANDNUTRITION POLICIES AND THEIR INTERSECTORAL IMPLEMENTATION
CONTENTS Page
1. Introduction . . . . . . . . . . . . . . . . . . . . . . 1
2. Ministries of Health and the Formulation of National Foodand Nutrition Policies and Plans . . . . . . . . . . . . 2
3. Activities of the Health Sector in the Field of Food andNutrition . . . . . . . . . . . . . . . . . . . . . . . 5
3.1 Strengthening and Expansion of Nutrition Activities inPrimary Health Services . ... . . . . . . . . . . . 6
3.1.1 Assessment of the Nutritional Status of the Individual . 7
3.1.2 Nutrition Education . .. .... . . . . . . . 7
3.1.3 Food Supplementation . . . . . . . . . . . . . . . . . . . 7
3.1.4 Nutritional Recovery . . . . . . . . . . . . . . . . . . . 8
3.2 Measures for the Prevention and Control of SpecificNutritional Diseases 9
3.2.1 Vitamin A Deficiency.. ....... 9
3.2.2 Nutritional Anemias . . . . . . . . . . . . . . . . . . . 12
3.2.3 Endemic Goiter . . . . . . . . . . . . . . . . . . . . . 13
3.3 Surveillance of the Nutritional Status of the Population . 14
3.4 Organization and Administration of Hospital FeedingServices 15
3.5 Preparation and Training of Nutrition Personnel for HealthServices ... . . 16
3.5.1 Nutrition Specialists with Primary Responsibility in theHealth Sector . . . . . .. 17
3.5.2 Health Services Personnel with General Responsibility inNutrition . . . . . . . . .. . . . . . . . . . . . . 17
3.5.3 Planning Officer in Food and Nutrition . . . . . . . 18
4. Prospects for Improving the Nutrition and Food Situation inthe Region . .... ............. 18
5. Participation of the Health Sector in the Solution of theNutrition Problems of the Region . . .. . . . 19
6. Conclusions. .... 23

METHODOLOGIES FOR THE FORMULATION OF NATIONAL FOOD ANDNUTRITION POLICIES AND THEIR INTERSECTORAL IMPLEMENTATION
1. INTRODUCTION
It is an indisputable fact that proper nutrition is an essential elementfor the health, education and economy of a country, and therefore an importantfactor in social progress.
Some economic studies have calculated the monetary benefit of nutritionprograms and activities among the younger age groups of the population and howthey are reflected in the economic output of adults, thus demonstrating theimportance of investing in the nutritional training and protection of humanresources.
Moreover, apart from purely economic considerations, proper nutritionmust be regarded as a fundamental right of the individual, since a personsuffering from malnutrition accompanied by mental retardation loses the rightto think, which is a requirement for the freedom of expression which todaywe all take for granted.
An analysis of the degree of development of nutrition programs inLatin America and the Caribbean shows that they have failed to attain anysignificant level in overall national planning. The building of airports,roads, hospitals and schools, inter alia, are tangible and politically moreappealing actions than the solution of nutrition problems, which requiremore comprehensive, multisectoral approaches.
Until a few years ago, efforts to achieve better nutritional levels forthe population were confined to ministries of health and institutes of nutrition,and their medical specialists, nutritionist/dietitians and food technologists;to a few research and teaching institutions; and to international technicalcooperation agencies, with little participation on the part of financingagencies.
Furthermore, most of the nutrition programs for low-income groups,like food supplementation for groups of mothers and children, frequentlycarry a connotation of public assistance or social welfare, and not of com-prehensive public health services.
In addition, their effectiveness is reduced by the limitations placedupon them by other socioeconomic factors affecting the health level of thepopulation. In order to change that situation, it is essential for thehealth sector to coordinate its activities with those of all the other sectorsdirectly or indirectly involved in food production, marketing, consumptionand utilization; otherwise, its activities will continue to have very littleeffect.
-2-
Fortunately, the Latin American and Caribbean governments, faced withthe prospect of a deterioration in the food and nutrition situation, havebegun to show an increased awareness of the relevance which the health sectorhas traditionally attributed to nutrition, and there is now a broad multisec-toral move to promote and support the formulation and implementation of foodand nutrition policies and plans.
It is important to note that that recognition came about becausegovernments and bilateral and international technical cooperation and financ-ing agencies have understood that while the health sector receives the directimpact of the problems, a deeper analysis of the problem shows that the sec-tors of education, agriculture and the economy are seriously affected by itsconsequences.
Suffice to mention the fact that the economic and technical effortsbeing invested in primary education are to some extent being frustrated becausea great many chuldren are entering school with diminished ability to learnbecause of mental retardation, which is due in part to malnutrition. Thelow output of agricultural workers in areas where malnutrition is prevalentis another serious obstacle to the economic-and social development of theRegion.
Those considerations lend strength to the argument that, in order toaccelerate the economic development of a country, timely and effectivemeasures must be taken to protect its human resources, for they will laterbecome the most important instrument of the nation's advancement.
There is clearly a growing recognition that simultaneous and coordinatedmultisecqoral action must be taken to fight malnutrition, not only on the partof international and bilateral technical assistance and financing organiza-tions, but on the part of national development planners who are giving highpriority to food and nutrition programs in the countries of the Region.
2. MINISTRIES OF HEALTH AND THE FORMULATION OF NATIONAL FOOD AND NUTRITIONPOLICIES AND PLANS
The dynamics of population variables in the Region and the rate ofdevelopment of agricultural production and other economic activities seemsto indicate that present conditions of malnutrition and undernourishmentmay worsen unless there are significant economic and social readjustments.
The average income of two-thirds of low-income population groups rosebarely US$50 over a period of 20 years. That hardly favors future nutri-tion prospects of the vulnerable groups (children and pregnant and nursingwomen) and is beyond any doubt one of the determining factors of the highrates of malnutrition.
Once we recognize that the factors causing malnutrition affect severalsectors at the same time, we have to envisage the need for coordinated programs

-3-
ensuring the availability and proper consumption of food and, at the sametime, fostering the prevention, control and treatment of the diseases, ej-pecially acute communicable diseases that affect the biological utilizationof nutrients.
On the other hand, the responsibility of the health sector in multi-sectoral nutrition and food programs is determined by its role in the diagnosisand surveillance of the nutritional status and dietary level of the population;by the importance of formulating recommendations on nutrient requirements andfood consumption levels; by the implementation of specific programs for theprevention, control of.and recovery from nutritional and infectious diseases;and by the necessary nutritional promotion and orientation of the food pro-duction and distribution plans that must be carried out in order to ensurethe nutritional well-being and proper feeding of the population.
Of outstanding importance among the essential factors for improvingthe food and nutrition status of the population are the following:
Production, distribution and consumption of foods designed to satisfythe nutritional requirements of the community;
Development of integrated health and nutrition activities for high-riskpopulation groups, including environmental sanitation; and
Education of the community in its broadest sense.
In order for those three factors to be translated into concrete andcoordinated activities, the following requirements must be met:
A political decision to cope with the nutritional and food problem;
A broad knowledge of the nutritional and food situation of the countryor region and its determining factors;
Adaptation of the infrastructure at the national and local levels forpurposes of planning and carrying out plans and programs; and
Proper allocation of financial resources.
It is essential to bear in mind that the alignment of the economic,social and political variables related to the activities mentioned aboverequires a period of time which varies with each country and that, whilethat process is going on, large groups of the population will continue tosuffer the consequences of malnutrition, and that the problem is likely toincrease in magnitude and to take a toll difficult to justify in human terms.
Therefore, until the above-mentioned alignment is achieved, nutritionprograms carried out by the health services will continue to be of inestimablevalue in reducing the impact of the harm and in fostering higher levels ofhealth and nutrition.

-4-
The participation of the Ministries of Health in this important taskmay be summarized as follows:
a) To undertake studies on food consumption and nutrition levels of thepopulation including an analysis of the indicators that directly orindirectly determine the nutritional situation;
b) To disseminate information on nutrition and food problems to thevarious decision-making levels of governments, universities andprivate enterprise, but also, and particularly, to the communityitself, so that it will become an informed group demanding andobtaining greater government attention to the problem;
c) To promote intersectoral coordination as a means of ensuring a properapproach to the multisectoral activities to be undertaken;
d) To make recommendations on specific action and participate in thenational planning process, including the analysis and identificationof possible alternatives for solving nutrition and food problems;
e) To evaluate together with the other sectors the effectiveness of theactivities undertaken; and
f) To carry out nutrition activities as an integral part of the provisionof primary health services; that should be strengthened and expandedwhether or not a national food and nutrition plan exists.
It must be recognized that the greatest obstacle to the formulationand execution of national food and nutrition plans is the lack of politicalwill on the part of governments to establish the necessary intersectoral co-ordination. This may be explained by inadequate knowledge of the magnitudeof the problem or by failure to recognize its existence. Even when it isrecognized, governments may consider that it does not deserve priority becauseit does not fit in with the principles, objectives and styles of developmentadopted by those governments and/or because they do not clearly understandthe alternatives for solving it proposed by the expert groups.
Traditionally, little attention has been paid by economists to themicroeconomic variables of the problem, whereas nutrition experts have focusedtheir analysis almost exclusively on the macroeconomic aspects related toincome, overcrowding, unemployment, poor land distribution, lack of humanresources, etc. That indicates the importance of bringing the two groupstogether and the need for the two disciplines to achieve a sufficient measureof mutual understanding to enable them to fix priorities which will satisfythe nutritional needs of the population on the one hand and the economicexigencies of the development process on the other.
So long as public health officers do not provide the economists withappropriate indicators, not only for measuring the magnitude of the problem
* l

-5-
but also for evaluating the progress of the programs adopted, and especiallytheir effectiveness, there will continue to be delays in taking importantdecisions in the field of food and nutrition.
Lastly, it is essential to understand that not all countries are onthe same footing when it comes to formulating and executing national foodand nutrition plans; therefore a single strategy cannot be adoptedI ratherthe strategy must be geared to the level achieved in each country.
The situation may be outlined briefly as follows:
i) There are countries which have the political will to formulateand execute a plan but do not have the necessary basic informationor a sufficient infrastructure in planning and implementation todo so.
In such cases, the development of specific nutrition interventionprograms will help to generate the facilities required for formu-lating plans of long-range importance.
ii) There are countries that have sufficient nutrition and food in-formation but where national planning is weak and there is nocoordination between the sectoral planning groups.
However, if there is the political will to strengthen the nationalplanning process and the operational structures, the food andnutrition plan can be drawn up and incorporated in the medium-termnational development plan.
iii) There are countries possessing all three requirements: satisfactoryinformation and planning and operational infrastructures. Thisgroup includes countries which have the proper technical resourcesto implement a national food and nutrition plan.
However, the limiting factor is the political decision of thegovernment to come to grips with the nutrition and food problemor to accord it high priority.
3. ACTIVITIES OF THE HEALTH SECTOR IN THE FIELD OF FOOD AND NUTRITION
The foregoing considerations relate to the basic role of the healthsector in promoting national food and nutrition plans. This chapter dealswith the general framework of the nutrition activities that are the specificresponsibility of the health sector.
'World Health Organization. Report of the Meeting of WHO Regional Advisorsin Nutrition. (Document HP/NUT/74.1, mimeographed). Geneva, 1974.

- 6-
Given the present nutrition and food situation and existing problems 41and restrictions, the following areas should receive the highest priorityin the health sector's plans and programs:
a) Strengthening and expansion of nutrition activities in primaryhealth services;
b) Measures of intervention for the control of specific nutritionaldiseases;
c) Surveillance of the nutritional status of the population;
d) Organization and strengthening of hospital feeding services; and
e) Preparation and training of nutrition personnel for the healthservices.
3.1 Strengthening and Expansion of Nutrition Activities in Primary HealthServices
It is generally acknowledged that the primary health services in theRegion are not satisfactory. In 1970, Latin America and the Caribbean hadan estimated population of 270 million, 46 per cent of which (approximately125 million) was concentrated in communities with fewer than 2,000 inhabi-tants or scattered over wide areas where the only health services availableare those connected with vertical programs like malaria and Aedes aegypti Ieradication.
Furthermore, a large part of that population is unemployed, low-income,has a high rate of fertility and high rates of morbidity and mortality frominfectious diseases and, most particularly, suffers from moderate and ad-vanced degrees of malnutrition which seriously restricts its productivecapacity.
It is also important to note that most of the development plans ofthe countries of the Region focus on aligning variables relating to thepopulation as a whole and not specific groups, so that it is difficult toaim programs directly and exclusively at the marginal population groups inurban and rural areas. A distinction must therefore be made between ageneral health strategy which reaches a large segment of the population anda cluster of actions aimed at the most disadvantaged and vulnerable groups,which are estimated to comprise approximately 160 million people in LatinAmerica and the Caribbean.
Nutrition activities in the primary health services should be partof maternal and child health, family health, immunization and environmentalsanitation programs.
.~~~~~~~~~~~~~~~~~~~~~~~~~I

- 7
Basically, the following are nutrition activities:
a) assessment of the nutritional status of the individual;
b) nutrition education;
c) food supplementation; and
d) nutritional recovery.
Further, there are other activities broadly related to nutrition whichshould be incorporated in and/or coordinated with primary health services,namely prevention and treatment of infectious diseases, food hygiene andstorage and provision of potable water supply and sewage disposal facilities.
3.1.1 Assessment of the Nutritional Status of the Individual
One of the routine tasks of the primary health services should be toassess the nutritional status of the individual by anthropometric methods,clinical examination and dietary history.
Measurement of weight and height and altertness to signs of malnutritionin children under five years of age should be a matter of the highest priority.Similarly, weight control and hemoglobin tests in pregnant women should begiven priority wherever possible.
During the history-taking, information should be obtained on the dietof children, pregnant or nursing mothers and the family generally in orderto know how to orient educational activities.
3.1.2 Nutrition Education
In carrying out their work in education, health services personnelmust underscore the importance of breast feeding and the introduction ofnew foods of high nutritional value during the weaning period; teach howfood should be correctly prepared and handled; and give advice on the feedingof the child and mother during pregnancy and nursing as well as in times ofillness, particularly from gastroenteritis and other acute infections.
Nutrition education is an integral part of maternal and child careand is given individually at the time of the clinic interview or visit to thedoctor and to special groups organized for that purpose (mothers' clubs, etc.)
3.1.3 Food Supplementation
The subsidized distribution of food supplements for the nutritionalprotection of vulnerable groups is fully justified so long as there is nothingdone to change the various social and economic factors which cause malnutrition.

-8-
Increasing use should be made in food supplementation of locallyproduced foods (vegetable mixtures, fortified food pastes, etc.) and activecommunity participation should be encouraged.
Faced with the prospect of a reduction in international food aid forfood supplementation programs, it is essential for countries to consider theuse of conventional and non-conventional foods by establishing a system ofexchange of technology, where necessary, and by ensuring broad participationby local agricultural and commercial sectors.
Chile, Colombia, Ecuador and Guatemala, which have begun to replaceexternal food aid by the production and distribution of local foods of highnutritional value and low cost, are clear examples of what could also bedone in other countries.
3.1.4 Nutritional Recovery
Protein-calorie malnutrition in children will continue to requirehigh priority in primary health services and hospital pediatric care so longas the basic factors creating the problem remain.
In view of the severity of protein-calorie malnutrition in childrenunder 5 years, nutritional recovery measures may be adapted to the followingclassification proposed by Gomez et al:
a) advanced malnutrition (third degree)
b) moderate malnutrition (second degree)
c) mild malnutrition (first degree)
In advanced malnutrition, generally associated with acute infections,the predominant factor is the danger that the child will die; it thereforerequires immediate and concentrated action by medical and nursing personnel.
However, in groups with moderate and mild malnutrition, the dangerthat the child will die is not immediate, and the remedial measures shouldtherefore be aimed at arresting the progress of the malnutrition and reducingthe number of cases.
To achieve that objective, practical, viable and clearly definedstandards should be established indicating the regimens or alternatives fortreating malnourished children in hospitals, health centers and health sta-tions and nutritional recovery services, and for establishing referencesystems between care and follow-up of patients.
Gomez, F., G. R. Ramos, J. Cravioto, and S. Frank. Malnutrition in Infancyand Childhood with Special Reference to Kwashiorkor. In: Advances inPediatrics. Levin S.(ed.), New York, Year Book Publishers, Vol. 7, p. 131,1955.
11

-9-
In order to prepare health services personnel for those activities,
the Pan American Health Organization has drawn up guidelines on the organi-
zation of health services in rural areas and the use of auxiliary personnel
and on t~e nutrition activities to be carried out locally by a general health
service, which give a detailed description of techniques and procedures.
Moreover, WHO and UNICEF have jointly drawn up a guideline on nutrition ac-
tivities in primary health services.
For a quick review of the foregoing, Table 1 presents a summary of
the nutrition activities which can be carried out by local health services.
Finally, it is absolutely essential for the primary health services
to coordinate their activities with the local agricultural and educational
services so that they will more effectively influence those sectors to change
the social and economic factors affecting health and nutrition.
3.2 Measures for the Prevention and Control of Specific Nutritional Diseases
Vitamin A deficiency, nutritional anemias--especially caused by iron
and folate deficiency--and endemic goiter are serious public health problems
in some parts of the Region.
Measures for the prevention and control of those diseases may be
instituted by adopting a vertical approach to the problem in which the primary
health services need not necessarily participate. Those measures relate to
the fortifying of foods on the national or regional scale.
On the other hand, when a horizontal approach is adopted, the local
health services have a large part to play because it involves the distribution
of specific nutritional supplements (iron sulfate, folic acid, vitamin A, etc.)
to vulnerable groups.
3.2.1 Vitamin A Deficiency
On the basis of epidemiological and clinical evidence, a number of
strategies have been advanced for solving the problem of vitamin A deficiency
and xerophthalmia. Obviously, the action to be taken will be determined by
the nature of the problem and the resources available, given the specific
national and local conditions.
1Pan American Health Organization. Scientific Publication No. 290, 1974.
2Pan American Health Organization. Scientific Publication No. 179, 1969.
3World Health Organization. A Guideline for Nutrition Activities Through
Local Health Services for Joint WHO/UNICEF StrateRn. (Document NUT/74.3,
mimeographed). Geneva, 1974.

Table 1
NUTRITION ACTIVITIES IN LOCAL HEALTH SERVICES
Activity
1. Assessment of the nutritional statusof the individual
2. Nutrition education
3. Food supplementation
4. Nutritional recovery
5. Other activities related to nutrition
Note: For these activities, there should bestandards manuals showing clearly thetasks and procedures for each member ofthe health team.
Procedures
Clinical examination of children and pregnant and nursingwomen to determine: protein-calorie malnutrition,vitamin deficiency, anemia and goiter
Identification of high-risk individuals based on clini-cal examination and socioeconomic status
Interpersonal education (interviews and organized groups)with special emphasis on:
Breast-feeding of the newbornFeeding of the healthy and sick childFeeding during pregnancy and lactationCounseling of the family on the best distributionof available foods in accordance with the nutri-tional needs of the most vulnerable groups andinformation on cost and nutritional value
Distribution of conventional foods or highly nutritionalfood mixtures, preferably locally produced, to complementthe diet, according to the following order of priorities:
Pregnant or nursing mothersChildren under the age of 2Children between 2 and 6Children between 7 and 14Distribution of nutritional supplements to correctvitamin A and iron deficiencies, particularly amongmothers and children
Identification and selection of patients (children under 5)with moderate and severe degrees of malnutrition
Medical and dietary treatment for malnourished childrenby doctors, nurses and duly trained health aides
Organization of a system of home assistance throughvolunteers who would supervise the use of the foodsdistributed and instruct parents in improving familyhealth
Protection of the child population through immunizations:BCG, DPT, polio, measles, rubella and smallpox
Proper treatment of children with diarrhetic and respiratorydiseases
Family counseling on spacing of births
_ _
0

- 11 -
Three methods are regarded as useful in this area:
- nutrition education;
- fortification of foods for general consumption(such as cereals and sugar);
- direct nutritional supplementation
The first method seeks to correct the deficiency by educating the
community on the consumption of foods rich in vitamin A, although it is dif-
ficult to make significant changes in the short run in the dietary habits
of the population. Moreover, the most efficient sources of vitamin A (animal
products) are generally not available, for reasons of economic status, to
those groups where the deficiency is a serious problem. However, foods of
vegetable origin rich in B-carolene, a precursor of vitamin A, is an econo-
mically feasible alternative.
The fortification of cereals, rice, milk, butter, fats and sugar with
vitamin A is feasible with present technological knowledge. There has been
special interest in fortifying sugar with vitamin A as a solution to the
problem in the developing countries. Sugar seems to be an appropriate ve-
hicle for the following reasons: production is usually centralized; con-
sumption is widespread and sufficient to bring the nutrient to the sectors
of the population suffering from the deficiency in sufficient quantities;the taste of the fortified product is acceptable; and there is a satisfactorystability of the vitamin A incorporated in the fortified product and a high
consumption of it does not produce the toxicity attributable to the nutrient.
Nevertheless, excess consumption of sugar may have adverse effects
on the mouth and the general health of the individual. Therefore, if this
method is used, a prohibition must be placed on propaganda and educational
campaigns aimed at promoting increased consumption of sugar on grounds thatit has additional nutritional value.
There is ample evidence that the absorption and storing of vitamin Aenables certain vulnerable groups to consume progressively larger doses of
the nutrient. In that way, the vitamin is stored and gradually released,that is, it "immunizes" against xerophthalmia for a relatively long period.It is best taken orally, which allows that method to be easily applied.
Based on the experiments performed by a number of research workers,PAHO/WHO has designed specific standards for vitamin A supplements to youngchildren and nursing mothers. In essence, they call for distribution tochildren under seven years every three months of a water-soluble vitamin Acapsule of 100,000 IU beginning the third month after birth, and the admin-istratioy of an oral dose of 100,000 IU to mothers immediately followingdelivery .
1Pan American Health Organization. Vitamin A Deficiency in the Americas,Scientific Publication No. 190.

- 12 -
Application of this method is limited by the extent of development of thehealth services, since that will determine the degree of coverage of high-risk groups.
It will be seen from the foregoing that there are methods for develop-ing intervention in this area, which constitutes a serious nutritional prob-lem in some countries. Not all local situations are identical and it isfeasible to apply either one method or a combination of methods, but theimportant thing is to initiate action based on the present state of knowledge.
3.2.2 Nutritional Anemias
PAHO's collaborative study on nutritional anemias in Latin Americaand the Caribbean established the fact that iron deficiency in pregnant andnon-pregnant women is a common and significant cause of nutritional anemiasamong low-income groups. Moreover, folate deficiency is often found in thesame groups.
On the basis of those findings and the recommendations of the WHO Groupof Experts on Nutritional Anaemias, a series of steps must be taken to pre-vent anemia based on iron deficiency in pregnant women; they involve directnutritional supplementation with iron sulphate and folic acid.
For women 25 per cent of whose caloric intake is from foods of animalorigin and who have iron reserves at the beginning of pregnancy, it is suf-ficient to administer a daily supplement of 60 mg of iron and 500 mg of folic /acid in order to maintain optimal hemoglobin concentrations.
In countries where less than 10 per cent of caloric intake is of animalorigin, iron deficiency is widespread and many women are anemic at the onset ofpregnancy. Consequently, the supplementary dosage of iron should be muchhigher, up to 120-240 mg daily and 500 mg of folic acid. Iron and folicacid supplements should be given not later than the second trimester ofpregnancy and continued until the end of the nursing period.
The most effective way of eliminating iron deficiency in any groupis probably by enriching foods with that nutrient. However, there are prob-lems of technology which should be resolved before recommending the strategyon a large scale.
b an American Health Organization. Analysis of PAHO Collaborative Studiesof Nutritional Anemias in Latin America and the Caribbean (DocumentRD/8/14). Washington, 1969.
2World Health Organization. Nutritional Anaemias. Technical Report SeriesNo. 503, Geneva 1972.
II
- 13 -
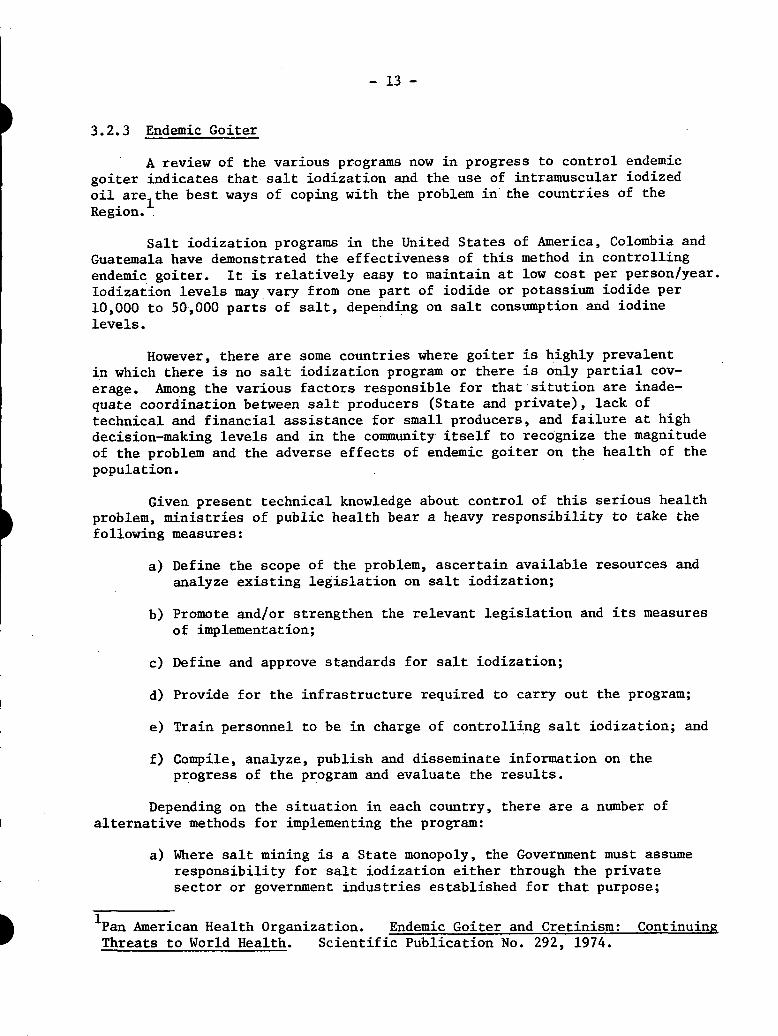
3.2.3 Endemic Goiter
A review of the various programs now in progress to control endemicgoiter indicates that salt iodization and the use of intramuscular iodized
oil arelthe best ways of coping with the problem in the countries of the
Region.
Salt iodization programs in the United States of America, Colombia andGuatemala have demonstrated the effectiveness of this method in controllingendemic goiter. It is relatively easy to maintain at low cost per person/year.
Iodization levels may vary from one part of iodide or potassium iodide per
10,000 to 50,000 parts of salt, depending on salt consumption and iodine
levels.
However, there are some countries where goiter is highly prevalentin which there is no salt iodization program or there is only partial cov-
erage. Among the various factors responsible for that sitution are inade-quate coordination between salt producers (State and private), lack of
technical and financial assistance for small producers, and failure at highdecision-making levels and in the community itself to recognize the magnitude
of the problem and the adverse effects of endemic goiter on the health of thepopulation.
Given present technical knowledge about control of this serious healthproblem, ministries of public health bear a heavy responsibility to take thefollowing measures:
a) Define the scope of the problem, ascertain available resources andanalyze existing legislation on salt iodization;
b) Promote and/or strengthen the relevant legislation and its measuresof implementation;
c) Define and approve standards for salt iodization;
d) Provide for the infrastructure required to carry out the program;
e) Train personnel to be in charge of controlling salt iodization; and
f) Compile, analyze, publish and disseminate information on theprogress of the program and evaluate the results.
Depending on the situation in each country, there are a number of
alternative methods for implementing the program:
a) Where salt mining is a State monopoly, the Government must assumeresponsibility for salt iodization either through the privatesector or government industries established for that purpose;
1Pan American Health Organization. Endemic Goiter and Cretinism: ContinuingThreats to World Health. Scientific Publication No. 292, 1974.

- 14 -
b) Where salt mining is in the hands of private industry, theGovernment should draw up the relevant legislation, demand thatit be enforced, and provide technical and financial aid to smallproducers as well as promote the organization of cooperatives.
The intramuscular injection of iodized oil is justified in the fol-lowing conditions:
a) Areas with a high incidence of cretinism; and
b) Areas where communities do not have access to consumption ofiodized salt owing to difficulties of marketing the product whenit leaves the production centers.
In that case, it is recommended that iodized oil be administeredintramuscularly every three years according to the followingschedule:
Age Dose Amount of iodine
up to 1 year 0.5 cc 232.5 mg1-45 years 1.0 cc 475.0 mg
3.3 Surveillance of the Nutritional Status of the Population
The World Health Organization has repeatedly pointed to the need for 4systems of nutritional surveillance which would enable countries to obtainadequate, timely and permanent information on the nutritional status of thepopulation by compiling, analyzing and disseminating information on whichnational food and nutrition agencies could base appropriate action.
This system should provide periodic reports on the scope and determin-ing factors of the problem, help to evaluate programs, offer a basis fordeveloping research, and forecasting needs and future trends in the nutri-tional level of the population.
In this connection, the Pan American Health Organization is workingon a scheme for using epidemiologicallsurveillance systems for the continuousassessment of the nutritional status.
WHO has also scheduled a meeting this year of a Committee of Expertson Nutritional Surveillance, which will probably propose specific indicators,standards and methods for organizing such a system.
Pan American Health Organization. Use of Systems of EpidemiologicalSurveillance of Communicable Diseases for Surveillance of the NutritionalStatus. (Mimeographed document), 1975.

- 15 -
It should once again be stressed that the health sector has immediateresponsibility for ensuring a proper nutritional level and monitoring in.The nutritional-surveillance system adopted will depend on the level ofdevelopment of the health structure in each country.
It should be borne in mind that the reporting of cases of malnutritionand other deficiency diseases should be done not only by the health servicesbut by the community itself. The diversity in levels of care and healthservices will determine the type and number of nutritional surveillanceactivities that can be brought into the system.
In health areas-with populations of known size and characteristics,nutritional surveillance can be organized on the basis of representativesamples of the population. It could also be done for duly identified high-risk groups.
The following indicators may be of value in organizing a nutritionalsurveillance system:
Availability of foodstuffs;Energy and protein consumption among vulnerable groups;Family spending on food and quality of housing;Mortality in the following age groups:
Under 1 year of age1-4 years of ageOver 5 years of age
WeightHeightArm circumferenceHemoglobin levelHematocrit reading 1Clinical symptoms according to WHO criteria
A surveillance system incorporating all those indicators is difficultto put into practice. In present circumstances, a minimum surveillance sys-tem in the primary health services should include the following indicators:
Age, weight, height and, optionally, dependingon available resources, hemoglobin level andhematocrit reading
3.4 Organization and Administration of Hospital Feeding Services
Contemporary concepts of hospital administration recognize that thefood services constitute an important aspect of patient care and that theoperation of the food department represents a large item of expenditure inthe budget and must be highly efficient.
1World Health Organization. Evaluation of the Nutritional Status of theCommunity. Monograph series No. 53, 1968.
- 16 -
In other words- this essential hospital service depends for its proper
organization and functioning on scientific knowledge of nutrition, the attitude
and behavior of the patient and, most important, the basic principles of
administration. Furthermore, the technical and administrative activities
of the food service should be integrated with the other hospital departments.
According to a study made in 45 hospitals of six countries of Latin
America and the Caribbean, some of the factors affecting the efficient op-
eration of the food services may be identified as follows:
a) Most hospitals do not apply proper principles of administration.
b) There is an obvious lack of appropriate techniques for solving
problems of food hygiene and quality at the service level.
c) There are not enough personnel with sufficient technical training,
knowledge and administrative experience. There are no clearly
defined criteria for deciding the type and amount of human resources
required for the food services.
d) Further, the shortage of nutritionist/dietitians with experience
inadministering food services reflects the lack of training pro-
grams in this field.
e) The introduction of technical and administrative standards for
the organization and operation of food services in hospitals of
different-levels and complexity is a priority need in the countries
of the Region.
The situation described above clearly requires priority attention,
since one of the main obstacles is the lack of understanding of the functions
of the food and dietary services and how they are related to the cost of
hospital administration and, what is even more important, what is their
essential function in the overall care of the patient.
3.5 Preparation and Training of Nutrition Personnel for Health Services
For purposes of the planning and implementation of nutrition programs
in the health services, the various members of the professional team must
possess some basic notions of nutrition, particularly those with direct re-
sponsibility for maternal and child care and family health activities.
Health programs require nutrition personnel of various categories:
some will have primary responsibility and competence in the field of nutri-
tion within the health services, while others will be working in disciplines
other than health which are essential for coordinating multisectoral programs.
Both categories of personnel should familiarize themselves with the basic
concepts of nutrition during their training.
Pan American Health Organization. Report on the Administration of Hospital
Food Services in Six Countries of Latin America and the Caribbean, 1972.

- 17 -
3.5.1 Nutrition Specialists with Primary Responsibility in the Health Sector
Among the professional personnel responsible for nutrition programs in
public health, there is the medical nutritionist (a doctor trained in public
health or clinical medicine, with specialization in nutrition). Ministries
of public health must have one or more professionals of this category with
responsibility for directing and coordinating nutrition programs and rep-
resenting the health sector in the national planning process in all matters
related to nutrition and food consumption.
Another specialist who very often is a member of the health team is
the nutritionist/dietitian, who has had university training and holds a
university degree.
The nutritionist/dietitian provides advisory services not only to
health personnel but to teaching and supervisory personnel of institutional
feeding programs. In some countries these professionals are assuming wider
responsibilities for heading the intermediate-level nutrition programs of
the health structures, which means that greater attention must be paid to
their postgraduate training in administration and health planning.
There is another intermediate category of nutrition personnel, namely
the assistant dietitian/nutritionist, who receives training in nutrition for
work in the food services of hospitals and social welfare institutions. At
the present time, this level of personnel should be given special attention
in the developing countries as a strategy for improving institutional food
services.
3.5.2 Health Services Personnel with General Responsibility in Nutrition
Most of the health service's direct work in nutrition is done by
doctors, nurses and auxiliary health personnel and, for them to perform their
functions competently, they should receive instruction in nutrition during
their basic training, or at least intensive courses in postgraduate training.
Basic health services personnel vary according to the levels of
the health structure. In most countries, the simplest health units consist
of auxiliary personnel with four years of formal education and three months'
training in public health. These multipurpose aides, who handle most of
the health activities required by the community, should be trained in a
realistic way to perform their functions, including maternal and child care,
nutrition and family h.ealth activities.
The content of nutrition training programs depends on the priorities,
responsibilities and functions established and prevailing local conditions.
Nevertheless, consideration should be given to the following aspects:
a) The importance of nutrition in the health level of the individualand the community;

- 18 -
b) Watching diet during periods of pregnancy and nursing;
c) Breast feeding and its value in infant nutrition;
d) Food control and food hygiene and their relationship to gastro-
intestinal diseases;
e) Control of infectious diseases (including water supply and wastedisposal systems);
f) Surveillance of the nutritional state of pregnant women and
children under 5 years; and
g) Health education, including family health.
For the reasons given earlier, emphasis is placed on the importanceof the training given to health aides, who represent the best staff resourcefor widening the coverage of primary health services. Nutrition specialists,in collaboration with health administrators and nurses, should work outpractical and simple methods for training those aides. It is urgently neces-sary to prepare descriptive manuals of the activities and tasks of auxiliary
health personnel in all the countries of the Region.
3.5.3 Planning Officer in Food and Nutrition
In view of the multidisciplinary and interdisciplinary nature of
nutrition, it is important for the health sector to promote and participateactively in training programs for high-level executive personnel who willberesponsible for sectoral planning.
These planning officers may come from public health, economic ac-tivities, agriculture, the social sciences, inter alia, and should have a
broad knowledge of economics, human nutrition and food science so that theycan take an active part in the process of planning the economic and socialdevelopment of the country.
4. PROSPECTS FOR IMPROVING THE NUTRITIONAL AND FOOD SITUATION INTHE REGION
The analysis of the main causes of the low nutritional and food levelof the Region given in Annex I of this document indicates that distortionsin income distribution are one of the priority elements of the problem. Weknow that 50 per cent of the population of the Region is made up of low-incomegroups which consume less than 16 per cent of the total available of goodsand services.
On the other hand, the availability of land is not a factor whichrestricts the increase in food production, not even in countries wherecalorie and protein deficiencies go hand in hand with a high rate of popu-lation growth. It has been estimated that in order to attain the "high

- 19 -
demand for food" projected by FAO for 1980, the cultivated area would haveto be expanded by 27.9 million hectares. By adding those new lands to -heavailable arable area, the total land used in South America would still beonly 27 per cent and in Central America 40 per cent, which means that thereserves of cultivable land would still be far from exhausted.
There is a consensus on the part of the governments of Latin Americaand the Caribbean that the region possesses lands, minerals and sources ofenergy which are awaiting, in addition to the necessary financial investment,the organization of institutions and the application of technology beforetheir potential can be. transformed into goods and services in the field offood and nutrition. With that prospect of additional resources, the existenceof undernourishment and malnutrition in the Region represents a serious con-tradiction which must be eliminated for social and economic reasons.
Consequently, the nutrition activities in public health described earlierwould make it possible to raise the nutritional and food level of the Regionprovided measures were simultaneously taken to bring large groups of thepopulation out of extreme poverty and marginality. The potential of thecountries of the Region is sufficiently large that the increase in domesticconsumption resulting from income redistribution will not adversely affectthe foreign earnings obtained by exports of agricultural products; on thecontrary, it would strengthen and benefit production.
5. PARTICIPATION OF THE HEALTH SECTOR IN THE SOLUTION OF THE NUTRITIONPROBLEMS OF THE REGION
In view of the foregoing considerations and the effect of malnutritionon the health level of the population, malnutrition is obviously an importantdimension of the overall problem, and must be systematically attacked. Gov-ernments should weigh whether malnutrition should be regarded as a phenomenonstrictly limited to the health sector without regard for its repercussions onproductivity and the general well-being of the population before adoptingthat conclusion as policy.
Obviously, if the health sector merely deals with malnutrition as adisease, and better levels of food and nutrition are not fostered, thereare not likely to be lasting effects on the health and well-being of thepopulation.
Generally speaking, it may be said that the availability and effectiveconsumption of food, and consumer education, are the most significant extra-sectoral factors affecting the problem of malnutrition whereas, intrasectorally,
1Pan American Health Organization. Ten-Year Health Plan for the Americas.Official Document 118. 1973.
2Pan American Health Organization. Nutrition in the Health Planning Process.(Mimeographed document), Washington, D.C. 1968.

- 20 -
the problem is confined to control of malnutrition as a disease in itself andas a determining factor in other pathological conditions. The interrelation-ship between the two areas makes it imperative to seek a solution throughcomplementary efforts based on preventive and curative health activities,including the promotion of good nutrition.
The health sector should understand that this complementarity must bebased on the recognition that changes in and control of the extrasectoralfactors will have a decisive impact on the solution of the problem ofmalnutrition.
It therefore becomes necessary to create a unit or technical groupto formulate national food and nutrition policies and plans within the organswith high-level responsibility and actual authority for overall developmentplanning.
The unit should be organized as part of the national planning body,independent of any particular sectoral office but with close intersectoralcoordination, and should be responsible to a high level of the government.This is important because the unit will have to work with a number of govern-ment sectors at the same time, and must not be considered as the instrumentof any particular sector.
The unit's main function should be to formulate national food andnutrition policy on the basis of an analysis of the nutritional implicationsof sectoral policies and their interaction with and effects on the nutritionalstate of the population.
The policy should be submitted for approval by the government bodyresponsible for establishing the country's social and economic developmentpolicies. In order to discharge its responsibility, the planning unit fornational food and nutrition policies should take a series of successive steps,as suggested in Table 2.
Bearing in mind the interdisciplinary and intersectoral nature of thevarious activities involved in the process, it would be advisable for theplanning unit to include representatives of disciplines such as statistics,agronomy, economics, nutrition, public health and planning. The group shouldreceive technical support and advice from the sectoral planning units of thevarious ministries engaged in carrying out the food and nutrition policy.
The health sector is basically responsible for acting as a catalystof the process of formulating these policies, since it is in that sector thatthe availability and consumption of food produces an impact on the healthlevel owing to the direct and indirect effects of malnutrition.
Since the investigation and collection of information on the food andnutrition problem is within the competence of the health sector, the ministriesof health shall be directly responsible for the following:
(I

- 21 -
Table 2
SUCCESSIVE STEPS IN THE FORMULATION, EXECUTION, EVAI UATION
AND READJUSTMENT OF A FOOD AND NUTRITION POLICY
Collection of information
* ~ ~ ~~~~~~~I ~
Analysis
Identification of basic food and nutrition
problems, nutrition implications of existing
policies and programs and areas requiring
action; {
Establishment of provisional objecives andgoals (alternate hypothesis)
limitations oof the diagnosis
Harmonization of the projections o:
supply and demand
f food
a n-Agoals IU En .LL UJCV. L V lugoals I
Tentative proposals for alternative
Idenif~/Ic osectoral programs or options
aIdentification of possibler Ealternative programs or , Establishment of priorities and cost/
options _- 0benefit analysis
Decisions on nutrition
Formulation of a national sect
food and nutrition policy - Approval and financing
| - - (/programs and projects
_ ; eL
programs and
of sectoral
Evaluation
[Expansion I
adjustment
Incorporation of the nationalfood and nutrition program inthe national development plan
Execution of programs andprojects by the sectoral
bodies (ministries, in-stitutes, etc.)
1Rueda-Williamson, R., and J.M. Bengoa. National Food and Nutrition Policies
for Latin America. Colombian Institute for Family Welfare (ICBF), 1975.
'C--
l

- 22 -
a) Assessing the magnitude and nature, structure and extent of the 41phenomenon;
b) Estimating the quantity and quality of the nutrients and caloriesrequired to maintain satisfactory nutritional levels in the variouspopulation groups;
c) Determining the vulnerability of the population and making pro-jections of nutrition requirements on the bais of anticipatedvariations within each sample group;
d) Translating those nutrition requirements in terms of quantityand quality of food which should be consumed; and
e) Investigating and proposing technical alternatives for the sub-stitution and fortification of foods in the light of the specificnutrition problems and availability of food, cost of production,prices to the consumer and possible restrictions due to the needsof the economy as a whole as regards exports and imports.
In implementing a food and nutrition policy, while the most substan-tive and long-range actions must be taken by other sectoral areas, the healthsector is responsible for giving them technical advice within the strictlimits of its knowledge and competence, with a view to helping to achievethe established goals.
Despite variations in organization from country to country, thehealth sector is directly or indirectly responsible for treating the peoplesuffering from malnutrition and for fostering a satisfactory nutritionalsituation through protective programs and nutrition education. It clearlybears responsibility for monitoring food quality and food hygiene.
As regards the evaluation of food and nutrition policy, the healthsector has a dual responsibility: on the one hand, it must assess the ef-fectiveness of the policy in terms of how it improves the nutritional statusof the population and, on the other, it must evaluate its participation,as regards the sector, in the execution of that policy. That evaluation isessential because it will make it possible to identify the changes that maybe required in the policy which has been adopted and to establish how thesector's role should be readjusted in continuing the policy.
In the absence of a well-defined interministerial policy, the minis-tries of public health and the nutrition institutes, where they exist, shouldprogram the nutrition activities of the national health plan and establishthe rules and regulations for developing and evaluating the nutrition program.
The nutrition units or technical groups in the ministries of healthor nutrition institutes should participate, together with the professionals
II

- 23 -
working in maternal and child health, communicable disease control, environ-
mental sanitation and health education in planning and coordinating programs,
including the prevention, control and treatment of deficiency diseases.
The ministries of health should establish standards governing recom-
mended daily nutritional intakes by the various population groups, including
model diets for individuals and groups in the care of the health services,
standards for quality control of food and food hygiene, and recommendations
for the treatment and prevention of specific deficiency diseases.
Guidelines should also be drawn up for organizing and operating
nutrition education and nutritional recovery services, food demonstration
units, food and dietary services in hospitals and industries, nutrition
education and supplementary feeding in health centers, schools, kindergartens
and other institutions.
The teaching of nutrition in schools of medicine, nursing, nutrition
and diet, dentistry, veterinary science and educational science, as well as
in courses for intermediate-level personnel--nursing aides, health promoters
and nutrition and food aides--should be the constant concern and responsibi-
lity of the ministries of health. The latter should also be responsible for
the teaching of nutrition in primary and secondary schools and for informationprograms on nutrition aimed at specific community groups--mothers, agricul-
tural and industrial workers, etc.--based on general, easily applicablestandards.
Lastly, there are logistical aspects to the nutrition program which
require special attention, such as the administration of food supplement
programs to vulnerable groups using the health services.
In some countries, this is the responsibility of the ministries of
health or the nutrition or family welfare institutes. When it is not, the
guidance they may provide and the leadership they exercise in coordinating
international and bilateral food aid will help to maximize the use of re-
sources and the effectiveness of action.
The advisory and supervisory role of health sector agencies in food
and nutrition is quite clear and constitutes a most important responsibility.
6. CONCLUSIONS
This document reviewed the factors and strategies which go into the
formulation and execution of food and nutrition policies and plans in the
countries of the Region.
It underscored the role of the health sector and, basically, of the
ministries of health in this process, which is of the utmost significance for
the economic and social development of Latin America and the Caribbean.

- 24 -
The health sector should of course exercise undisputed leadershipin the solution of food and nutrition problems affecting large numbers of
people, particularly the economically, socially and geographically marginal
groups.
The sector exercises its responsibility both directly, through the
health services, in activities for the prevention of and recovery from themost prevalent nutritional deficiencies and, indirectly, by stimulating,
advising and guiding the other sectors which help to shape a national foodand nutrition system.
The formulation and execution of national food and nutrition policiesthrough coordinated intersectoral action designed to develop and implementprograms aimed at the production, consumption and proper use of foods required
to meet the biological needs of the population is the catalyst the ministries
of health need in order to achieve the objectives laid down by the Health
Ministers of the Americas in the Ten-Year Health Plan, 1971-1980.
Annex
. .~~~~~~~~~~~~~~~~~~~~~~~~~~~~~~~~~~~~~~~~(
.~~~~~~4

CD23/DT/1 (Eng.)ANNEX
FOOD AND NUTRITION SITUATION IN THELATIN AMERICAN AND CARIBBEAN COUNTRIES

TABLE OF CONTENTS
Page
1. PRESENT SITUATION . . . . . . . . . . . . . . .
1.1 General Considerations . . . . . . . . . . . .
1.2 Population Characteristics . . . . . .. . . .
1.3 Nutritional Level of the Population . . . . . .
1.3.1 Protein-calorie Malnutrition .
1.3.2 Nutritional Anemias .. . . . .
1.3.3 Endemic Goiter and Cretinism . . . . . .
1.3.4 Hypovitaminosis A . . . . . . . . . . .
1.3.5 Cardiovascular Diseases and Diabetes .
1.4 Food Situation . . . . . . . . . . . . . . . .
1.5 Factors Determining Nutritional Status . . . .
1.6 Impact of Nutritional Problems on Economic and
Development . . . . . . . . . . . . .. .
2. HUMAN RESOURCES FOR NUTRITION . . . . . . . . .
2.1 Availability . . . . . . . . . . . . . . . . .
2.2 Utilization .. . . . . . . . . . .
2.3 Education and Training . . . . . . . . .
3. FOOD AND NUTRITION PROGRAMS . . . . . . . . . .
3.1 Technical Nutrition Units . . . . . . . . . . .
3.2 Surveillance of Nutritional Status . . . . . .
3.3 Food Supplementation . . . . . . . . . . . . .
3.4 Nutrition Education . . . . . . . . . . . . . .
3.5 Institutional Food Services . . . . . . . . . .
3.6 Fortification of Foodstuffs . . . . . . . . . .
3.7 Food Mixtures . . . . . . . . . . . . . . . . .
.... . . . . . 1
. . . . . . I14
... ... ..... 11
..... . .... 11
....... . 1120
. .. .. . .. 20
. . . . . . 20
.. . . .. . 23
Social· . . · 25
30
30
30
33
.. . .. . 34
.. . .. 34
.. . .. 40
.. . .. 40
.. . .. 43
.. . . . . . . 43
.. . . . .. 43
.. . . . . .. 47
4. NUTRITION RESEARCH
5. FOOD AND NUTRITION POLICIES
6. CONCLUSIONS . . . . . . . . . . . . . . . . . . . . . . . .
7. BIBLIOGRAPHY . . . . . . . . . . . . . . . . . . . . . . .
47
51
53
55

FOOD AND NUTRITION SITUATION IN THELATIN AMERICAN AND CARIBBEAN COUNTRIES
1. PRESENT SITUATION
1.1 General Considerations
Nutritional deficiencies are highly prevalent in the countries of the
Region and help worsen the health problems of the population.
The presence of nutritional diseases, in particular protein-calorie
malnutrition in infants, is accompanied by high mortality and morbidity rates,
primarily in children under five years of age.
The synergism between malnutrition and infectious diseases establishes
a vicious circle, the end results of which are reflected in various degrees
of retardation in the physical growth of children, often irreversible. Fur-
thermore, this nutritional dwarfism is often accompanied by varying degrees
of mental retardation, the characteristics and significance of which have
been pointed out by a number of investigators.
Nutritional status has a specific effect on the capacity of the indi-
vidual for physical work, both as regards its duration and its intensity.
In Latin America and the Caribbean area, where automation and mechanization
are limited, maximum individual output is a fundamental factor for the economy.
Finally, there are many factors determining nutritional problems; they
are present in various development sectors and are not exclusive to the health
sector. This multicausation is related in one way or another to the follow-
ing three basic aspects: (1) availability of food; (2) balanced diet; and
(3) control of diseases that can interfere with the proper utilization of
nutrients or cause an excessive loss of them.
1.2 Population Characteristics
It is acknowledged that the characteristics of the population largely
determine the nature and importance of health and nutrition problems, as well
as the need for health services and the degree to which they are used.
These characteristics include age structure, growth rate, urban/rural
ratio, cultural conditions, educational levels, income and employment level
of the economically active population and, to a greater or lesser extent,
constitute the background food and nutrition problems.
In 1972 the estimated population of the countries of the region was
290 million inhabitants and during the period 1965-1972 the average annual
growth rate was 2.7 per cent (Table No. 1).

Table No. 1
ESTIMATED POPULATION (1972),AND ESTIMATED
ANNUAL PERCENTAGE INCREASE (1963-1972)POPULATION (1980-2000)
Estimated Annualmid-year percentage Estimated population(2)(3)
Country population increase1972(1) (1963-1972) 1980 1985 1990 1995 2000
AntiguaNetherlands AntillesArgentinaBahamasBarbadosBelizeBermudaBoliviaBrazilCanadaColombiaCosta RicaCubaChileDominicaEcuadorEl SalvadorUnited States of AmericaGrenadaGuadeloupeGuatemalaFrench GuianaGuyanaHaitiHonduras
73,000230,000
23,923,000185,000240,000128,00056,000
5,195,00098,854,00021,848,00022,491,000
1,843,0008,749,000
10,123,00073,000
6,508,0003,760,000
208,230,00096,000
337,0005,409,000
56,000754,000
5,073,0002,687,000
2.01.51.54.10.12.92.02.62.91.63.23.22.0
1.73.4
1.10.51.42.94.72.32.13.1
26,856
276
6,456125,503
28,9282,493
10,07511,467
8,4734,904
230,955
7,018
1,0455,9883,557
30,107
303
145,366
33,8612,961
11,01912,540
5,907248,711
8,103
1,238
31,909
168,373
39,6313,493
12,01713,745
11,7747,122
266,238
9,357
1,469
5,182
33,637
195,021
45,810
13,07115,007
8,593282,766
10,776
1,742
35,274
10,081225,886
54,289
14,18316,283
16,14910,372
300,406
12,355
2,06112,3477,205
... /...
-

w
Table 1 (continued)
Country
Cayman IslandsFalkland IslandsTurks and Caicos IslandsVirgin Islands (US)Virgin Islands (UK)JamaicaMartiniqueMexicoMontserratNicaraguaPanamaParaguayPeruPuerto RicoDominican RepublicSt. Kitts-Nevis and AnguillaSt. Pierre and MiquelonSt. VincentSt. LuciaSurinamTrinidad and TobagoUruguayVenezuela
Estimatedmid-year
population1972(1)
11,0002,0006,000
67,00012,000
1,923,000344,000
52,641,00012,000
1,988,0001,524,0002,581,000
14,456,0002,809,0004,305,000
65,0006,000
91,000115,000419,000
1,043,0002,956,000
10,919,000
Annualpercentageincrease(1963-1972)(1)
2.3
4.84.31.41.83.5
3.03.43.11.32.91.5
0.92.63.11.41.23.4
Estimated
1980
population (2 ) ( 3 )
_ _ _ _ _ _ _ _ _ _ _ _ _ _ _ _ _ _ _ _ T|~
1985 1990 19951 T T I
67,288
2,8181,9393,45618,527
5,446
1,2603,255
14,870 I
3,3472,2544,12121,612
6,300
1,3863,377.7,546
2
3,9572,6214,86025,142
7,287
3,82720,285
4,6463,0465,677
29,099
8,431
2000
5,4603,5416,61933,491
9,753
3,99926,100
(l)Source: Demographic Yearbook, 1972, United Nations.Vol. XXVI, No. 1, 1 January 1974, United Nations
Population and Vital Statistics Report, Series A,
(2)America en Cifras, 1974 - Situaci6n demografica: Estado y movimiento de la poblaci6n, OEA, Instituto
Interamericano de Estadisticas, 1974
(3)In 10,000 inhabitants
w
L
I I I l #
2
wI

-4-
With respect to the age structure (Table No. 2), more than 40 per cent
of the population is under 15 years of age and, on an average, 15 per cent
belong to the age group under five years of age; because of this, priorityconsideration is given to its nutritional care, especially through maternaland child health services.
Table No. 3 shows that approximately 60 per cent of the population of
the Region live in rural areas. Despite the fact that this proportion has
gradually decreased, the rural population constitutes a high priority group
in the extension of health service coverage and consequently in their nutri-tional surveillance and care.
1.3 Nutritional Level of the Population
According to various health and nutrition surveys carried out in the
last ten years in the countries of the Region in which PASB, INCAP, CFNI,ICNND, the United States National Institutes of Health and various nationalgroups of nutritional specialists have participated, two general conclusions
may be drawn:
a) Although such studies are incomplete and do not reflect the situa-
tion prevailing in all countries of the Region or all the geographical areasof the same country, they clearly show that nutritional problems exist inmost of the countries.
b) The results of an analysis of vital indicators and of the nutri-
tional surveys undertaken show that protein-calorie malnutrition; iron,vitamin B 12 and folatedeficiency anemias; endemic goiter and cretinism;and hypovitaminosis A are serious public health problems in most of the
countries of the Region. At the same time, cardiovascular diseases, diabe-tes and obesity connected with nutrition are becoming increasingly important
as public health problems in Latin America and the Caribbean area.
1.3.1 Protein-calorie Malnutrition
Protein-calorie malnutrition is the cause of high mortality and mor-
bidity rates in children under five years of age. As Table No. 4 shows, theprevalence of severe protein-calorie malnutrition (degrees II and III) ranges
from 10 to 35 per cent in children under five years of age in 23 countries in
the Region. This fact is undoubtedly responsible in part for the high mor-tality recorded, especially that due to infectious diseases and nutritionaldeficiencies, in that age group.
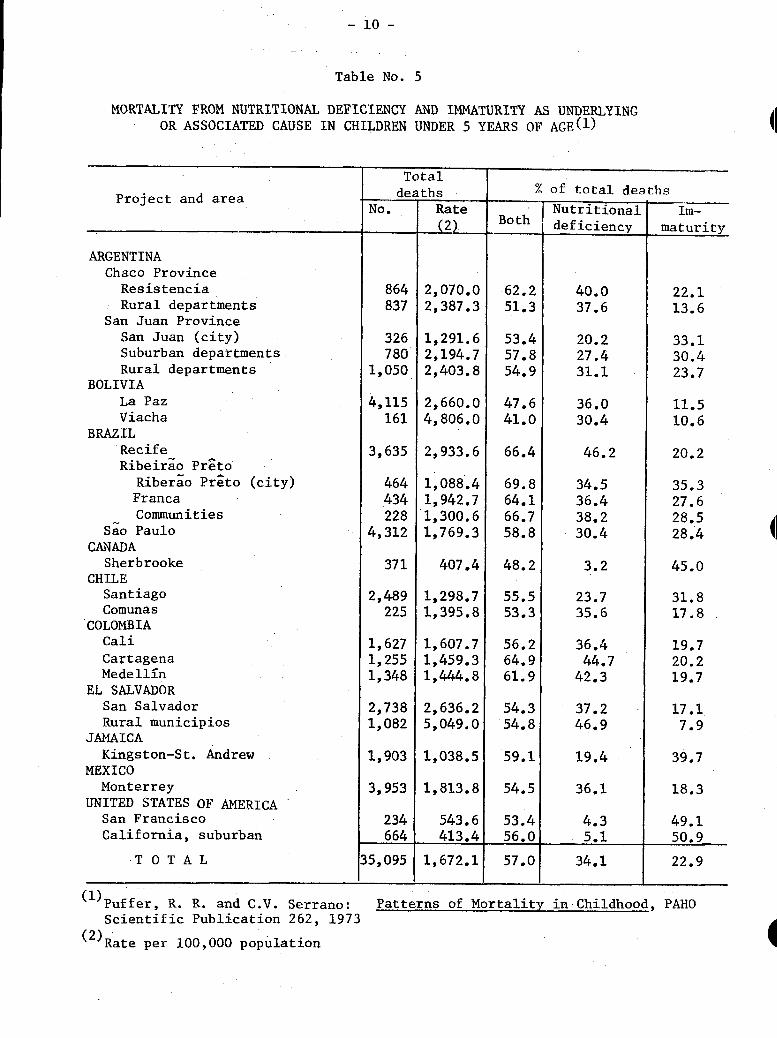
The findings of the Inter-American Investigation of Mortality in
Childhood sponsored by PAHO shows that the basic associated cause of a
high percentage of the deaths of children under five years of age is anutritional deficiency; this ranges from 41 per cent in Viacha, Bolivia,
to 69.8 per cent in Ribeirao Preto, Brazil (Table No. 5).
41

-5-
Table No. 2
PERCENTAGE DISTRIBUTION OF POPULATION
BY AGE GROUP, ACCORDING TO RECENT CENSUSES( 1
Country Under 5 5-14 15-44 45-64 65 years
.year s years years years and over
Antigua 14.7 29.5 34.9 14.8 6.2
Netherlands Antilles 16.1 25.3 39.4 14.4 4.8
Argentina 10.1 19.2 44.5 19.2 7.0
Bahamas 15.9 27.7 41.1 11.9 3.5
Barbados 10.9 26.1 37.7 17.0 8.3
Belize 18.1 31.2 35.5 10.9 4.3
Bermuda 8.9 20.7 46.3 17.7 6.4
Bolivia 16.2 25.6 42.9 11.7 3.5
Brazil 14.9 26.8 a) 47.3 b) 9.1 c) 1.8
Canada 8.4 21.2 43.7 18.7 8.1
Colombia 17.6 29.0 40.2 10.2 3.0
Costa Rica 20.1 29.1 38.3 9.5 2.9
Cuba 13.8 23.2 41.9 15.2 5.9
Chile 12.7 26.9 42.7 13.0 4.7
Dominica 18.0 31.1 32.4 12.6 5.9
Ecuador 18.5 28.7 40.0 9.9 2.8
El Salvador 16.8 29.3 40.3 10.1 3.4
United States of America 8.4 20.1 41.1 20.6 9.9
Grenada - 13.4 33.8 34.7 12.4 5.9
Guadeloupe 14.8 28.2 38.8 13.3 4.8
Guatemala 17.3 27.8 42.0 10.2 2.8
French Guiana 14.5 23.6 42.3 14.3 5.3
Guyana 15.8 31.3 38.5 10.8 3.6
Haiti 17.4 25.8 42.0 11.7 3.1
Honduras 18.9 27.8 41.4 9.5 2.4
Cayman Islands 5.6 d) 33.0 e) 39.2 14.7 7.5
Falkland Islands 10.6 15.5 a) 52.2 b) 17.6 c) 4.1
Turks and Caicos Islands 15.8 31.3 32.3 14.4 6.2
Virgin -Islands (US) 13.3 22.4 47.6 12.9 3.8
Virgin Islands (UK) 14.8 24.4 43.8 11.8 5.2
Jamaica 16.0 30.2 34.7 13.7 5.5
Martinique 43.0 37.9 13.8 5.2
Mexico 16.9 29.3 40.2 9.9 3.7
Montserrat 13.5 26.2 31.9 17.5 10.8
Nicaragua 17.6 30.7 39.7 9.0 2.9
Panama 16.2 27.2 41.3 11.6 3.7
Panama Canal Zone 8.6 23.2 51.1 15.4 1.7
Paraguay 18.7 27.8 40.2 10.2 3.2
Peru 17.4 27.6 41.3 10.5 3.1
Puerto Rico 11.7 24.8 42.0 15.0 6.5
Dominican Republic 17.0 30.5 40.2 9.1 3.1
St. Kitts-Nevis and Anguilla 14.7 34.0 28.3 16.0 7.1
St. Pierre and Miquelon 11.3 21.0 42.7 17.9 7.1
... /.

-6-
Table No. 2 (continued)
Under 5 5-14 15-44 45-64 65 yearsCountry Country years years years years and over
St. Vincent 16.7 34.5 32.8 11.2 4.9St. Lucia 18.4 31.3 32.9 12.2 5.3Surinam - 48.0 * 52.0 0-Trinidad and Tobago 13.0 29.1 40.4 13.0 4.4Uruguay 9.9 18.1 44.4 19.8 7.8Venezuela 16.2 29.0 41.6 10.2 2.9
Northern America 8.4 20.2 41.3 20.4 9.7Latin America 15.4 26.9 43.3 11.0 3.3Middle America 16.6 28.3 40.5 10.8 3.9South America 14.9 26.2 44.7 11.1 3.1
(l)Source: Demographic Yearbook, 193O and 1972; United Nations and 1970 PopulationCensus of the Commonwealth Caribbean, University of the West Indies, 1973.Published in Health Conditions in the Americas, PAHO Scientific Publication287, 1974
(a) 15-49 (b) 50-69 (c) 70+ (d) 5-24 (e) 25-44
HI
4I
I

-7 -
Table No. 3
RURAL POPULATION, BY COUNTRY, 1960-1980(1)
1960 1970 1980CountryI % I % I _
Netherlands AntillesArgentinaBahamasBarbadosBelizeBermudaBoliviaBrazilCanadaColombiaCosta RicaCubaChileDominicaEcuadorEl SalvadorUnited States of AmericaGrenadaGuadeloupeGuatemalaFrench GuianaGuyanaHaitiHondurasCayman IslandsFalkland IslandsTurks and Caicos IslandsVirgin Islands (U.S.)Virgin Islands (U.K.)JamaicaMartiniqueMexicoMontserratNicaraguaPanamaParaguayPeruPuerto RicoDominican RepublicSt. Kitts-Nevis and.AnguillaSt. Pierre and MiquelonSurinam
55.726.438.159.746.288.670.153.931.552.266.748.235.6
66.862.630.2
(2)89.0(2)56.072.434.471.385.978.462.550.066.743.8
70.560.750.7
62.858.864.654.856.170.0
60.065.5
52.319.628.656.342.987.065.843.523.840.463.544.527.179.0(2)60.959.125.9
52.569.031.765.182.273.960.050.066.740.779.2(2)62.450.0
4390 5 ( 2 )90:257.953.161.349.152.561.6(2)71.160.062.3
48.714.220.552.739.481.561.133.618.030.460.140.920.0
54.755.622.0
48.965.529.358.277.868.854.550.066.738.2
53.539.036.5
53.047.257.843.548.752.4
60.058.7
. ... /

-8-
Table No. 3 (continued)
1960 1970 1980
Trinidad and Tobago 60.5 49.8 38.9Uruguay 28.1 21.6 16.3Venezuela 41.7 31.6 23.0Leeward Islands(a) 69.5 64.9 59.9Windward Islands(b) 82.7 80.7 78.1
(Antigua, Virgin Islands (UK), Montserrat and St. Kitts-Nevis-Anguilla
(b)Dominica, Grenada, St. Lucia and St. Vincent
(1)Health Conditions in the Americas, PAHO Scientific Publication 287, 1974
(2)Four-Year Projections for the Eastern Caribbean, 1971
4I

-9-
Table No. 4
PROTEIN-CALORIE MALNUTRITION IN CHILDREN UNDER FIVE YEARS OF AGE
Country
AntiguaBarbadosBelize (A)
Year
197019691973
Bermuda"Bolivia 1966-69Brazil | 1968Canada 1970-72Colombia 1966Costa Rica 1966Chile 1974Dominica 1970Ecuador 1965-69El Salvador(6 ) 1969Grenada(5 1972Guatemala 1969Guyana(5) 1971Haiti 6 1961-65Honduras( ) 1966Turks and Caicos Is. 1973Virgin Islands (UK)Jamaica 1969-71Montserrat 1971Nicaragua(6) 1966Panama(6) 1967Paraguay 1973Peru 1965-71Dominican Republic 1970St. Kitts-Nevis
and Anguilla 1974St. Vincent(7) 1969St. Lucia(5) 1974 (CFN)Trinidad and Tobago(4)Venezuela (0-6 years) 1974
Totalexamined· · · I~
322248
3,546(3 )
968569
1,3313,378
547,709117
9,000
964
372
63241,75083,1651,100
1,2092,490
363
23,271
normal
7024.40.
60.31.
33.42.84.71.60.26.
18.39.21.27,5
43.240.92.256.92 5 .0
61.237,5156.1
51.1
I degree%
27.639.040.0
29.048.4
45.643.711.519.728.948.544.049.043.043.043.0
39.028.041.848o84.932.849.0
33.3479033.0
35.3
Malnutrition( 2)II degreelIII degree
% I %
0.31.21.2
5.0 )0.72.70.01.71.50.83.41.23.10005.91.77.02.30.3
5.01.40.01.81.10,70.840o
15l
0.11.51.9
1.4
2.111.018.0
10.217.23.6
19.312.23.15019.6
22.910.026.516.027.227.2
9.03.5
13.210,82.210.923.0
50414.09.0
12.2
(1)Four-Year Health Projections, 1971-75 and various sources
(2)According to the Gomez Classification, I = slight, II = moderate, III = serioi
(3)5-1/2 years of age
(4)MCH Profiles English-Speaking Caribbean - WHO/PAHO - Zone I, 1975
(5)National Nutrition Surveys
(6)Estimated for 1965 population
(7)Gurney, G.M., Available Data on the State of Food and Nutrition of the Peoplesof the Commonwealth Caribbean, CFNI, 1975
_ __ �_
- 10 -
Table No. 5
MORTALITY FROM NUTRITIONAL DEFICIENCY AND IMMATURITY AS UNDERLYINGOR ASSOCIATED CAUSE IN CHILDREN UNDER 5 YEARS OF AGE(1)
Total
Project and areaProject and area deaths % of total deathsNo. Rate I Nutritional Im-
(2 Both deficiency maturity. . e c
ARGENTINAChaco Province
Resistencia 864 2,070.0 62.2 40.0 22.1Rural departments 837 2,387.3 51.3 37.6 13.6
San Juan ProvinceSan Juan (city) 326 1,291.6 53.4 20.2 33.1Suburban departments 780 2,194.7 57.8 27.4 30.4Rural departments 1,050 2,403.8 54.9 31.1 23.7
BOLIVIALa Paz 4,115 2,660.0 47.6 36.0 11.5Viacha 161 4,806.0 41.0 30.4 10.6
BRAZIL
Recife 3,635 2,933.6 66.4 46.2 20.2Ribeirao Preto
Riberao Preto (city) 464 1,088.4 69.8 34.5 35.3Franca 434 1,942.7 64.1 36.4 27.6Communities 228 1,300.6 66.7 38.2 28.5
Sao Paulo 4,312 1,769.3 58.8 30.4 28.4CANADA
Sherbrooke 371 407.4 48.2 3.2 45.0CHILE
Santiago 2,489 1,298.7 55.5 23.7 31.8Comuna s 225 1,395.8 53.3 35.6 17.8
COLOMBIACali 1,627 1,607.7 56.2 36.4 19.7Cartagena 1,255 1,459.3 64.9 44.7 20.2Medellln 1,348 1,444.8 61.9 42.3 19.7
EL SALVADORSan Salvador 2,738 2,636.2 54.3 37.2 17.1Rural municipios 1,082 5,049.0 54.8 46.9 7.9
JAMAICAKingston-St. Andrew 1,903 1,038.5 59.1 19.4 39.7
MEXICOMonterrey 3,953 1,813.8 54.5 36.1 18.3
UNITED STATES OF AMERICASan Francisco 234 543.6 53.4 4.3 49.1California, suburban 664 413.4 56.0 5.1 50.9
T O T A L 35,095 1,672.1 57.0 34.1 22.9
(1)Puffer, R. R. and C.V. Serrano: Patterns of Mortality in Childhood, PAHOScientific Publication 262, 1973
(2)Rate Der 100.000 Dpopulationr -- -__ ___ r _-______

- 11 -
The mortality rate in the age group 1-4 years in eight countries inthe Region (Table No. 6) is 10 to 33 times greater than the rates recordedin developed countries, and the infant mortality rate ranges from 18.5 to84.1 per 1,000 live births in the United States of America and Guatemala,respectively.
Enteric and diarrheal diseases are responsible for between 9 and21.5 per cent of all deaths in 11 countries. In turn, according to the above-mentioned study on mortality in childhood, diarrheal diseases are the leadingunderlying cause of death in children under five years of age. The death rateper 100,000 inhabitants ranges from 216 to 1,436 in the places studied. Deathsdue to diarrheal diseases in which nutritional deficiency is an associatedcause ranged from 42.2 (Kingston) to 78.1 per cent (Ribeirao Preto).
It should also be noted that between 30.2 (San Juan) to 83.8 per cent(Cartagena) of the deaths due to measles in children under five years of ageare associated with nutritional deficiencies.
A common denominator of the children treated in hospital services isprotein-calorie malnutrition, the prevalence of any degree of which rangedbetween 77 and 97 per cent according to observations made in Colombia, orbetween 8 and 13 per cent in the case of advanced kwashiorkor or marasmus ina study made in 10 hospitals in Brazil.
1.3.2 Nutritional Anemias
Nutritional anemias are prevalent in the countries of the Region andrange from between 0.7 in Chile to 41 per cent in Guyana (Table No. 7).
In pregnant women the prevalence ranges from 22.2 to 62.7 per cent(Table No. 8). The most common type of anemia in this group is iron defi-ciency anemia. In Brazil, Peru and Venezuela a high prevalence of vitaminB12 anemia was recorded, and in Argentina and Venezuela a folate deficiencyanemia was a frequent finding in pregnant women. Studies made by the CFNIin the Caribbean area in preschool and school-age children showed high preva-lences of anemia usually caused by iron deficiency (Table No. 9).
Among the adult population the prevalence of anemias is higher infemales than in males (Tables Nos. 10 and 11). Here again, iron deficiencyis the most common cause, although high prevalency rates of folate deficiencyare found in the adult population.
1.3.3 Endemic Goiter and Cretinism
Endemic goiter is highly prevalent in the Andean area and in extensiveareas distributed throughout the Western Hemisphere. It is estimated thatapproximately 13 million persons are affected. In 20 countries, the preva-lence of endemic goiter is over 10 per cent (Table No. 12). Endemic cretinism

- 12 -
Table No. 6
SOME INDIRECT INDICATORS OF NUTRITIONAL STATUS () 1
M o r t a 1 i t yI2Mortality __ __
Country Year Crude Maternalf-28 days 1 year 1-4 yrs -5 yrsRate(2) (3) A_. (3) (3) (2) (2)
Antigua (8) 1972 6.2 0 9.5 19.1 0.4 -
Netherlands Antilles 1971 4.9 - - 27.6 0.6 -
Argentina 1970 9.6 1.54 27.2 65.2 3.2 15.7
Bahamas 1972 5.8 1.26 18.5 35.0 1.7 -Barbados (8) 1973 8.8 0.75 26.9 33,9 1.3 7.7
Belize (8) 1973 5.9 0.19 13,3 38.5 4.3 -Bermuda (8) 1972 6.5( 9) 0 6.5 11.2 0.7 -
Bolivia 1969 5.1 _ - _ 7.4 -
Brazil . .
Canada 1972 7.4 0.16 12.4 17.1 0.9 4.2(5)
Colombia 1969 8.8 2.19 25.1 73.5 8.4 18.7Costa Rica 1972 5.9 0.99 - 59.0 3.0 12.1
Cuba 1972 5.7 0.52 19.2 28.7 0.9 6.2Chile 1972 8.8 1.63 29.0 71.1 2.6 16.1Dominica (8) 1972 6,9(9) o.74 13.4 32.0 3.7 -
Ecuador (7) 1973 9.8 1.9 23.0 75.8 14.0 26.2
El Salvador 1972 8.6 1.18 18.4(51 58,5 10.1 19.6
United States of America 1972 9.4 0.24 14.2(5 18.5 0.8 4.6(5)Grenada (8) 1972 6.9 1.7 0 8.8 16.0 1.4 -
Guadeloupe 1972 7.4 0.61 - 45.8 3.8 -
Guatemala 1971 14.1 1.64 - 84.1 25.9 39.6French Guiana 1971 8.2 0.62 - 43.1 3.7 -Guyana (8) 1970 6°7 - - 44.7( ) -Haiti .Honduras 1972 8.0 1.99 11.6 43.0 9.1 17.1
Cayman Islands 1970 5.9 - - 11.0 -
Falkland Islands 1972 6.0 - - 25.6 -
Turks and Caicos Islands 1971 9.8 - - 47.4 -
Virgin Islands (U.S.) 1970 7.6 - 24.3 -
Virgin Islands (U.K.) (8) 1972 5.2(6) 0 32.6 44.9 1.2 41 1-4
Jamaica (8) 1974 7.2 - - 25,9 4.5 9.4Martinique 1971 6.5 0.43 - 27.1 1.5 -Mexico (7) 1972 9.1 1.3 19.9 60.9 9.1 23.3
Montserrat (8) 1972 12.0 0 25.2 31.4 2.9 -Nicaragua 1969 8.3 1.64 11.3 54.4 8.7 19.6Panama 1972 6.0 1.11 17.5 33.7 5.5 11.7Paraguay 1973 9.1 4.16 - 84.0 3.2 25.2(5)
Peru (7) 1973 8.85 2.21 - 66.9 12.4 23.5
Puerto Rico 1972 6.8 0.39 - 27.1 1.0 -
Dominican Republic 1971 6.4 0.99 23.8 49.2 73 15.7St. Kitts-Nevisand Anguilla (8) 1972 11.3 0.81 42.1 69.6 3.6 -
... /.. .

- 13 -
Table No. 6 (continued)
Country Year Crude Maternalrate(2) (3)
Mortality-28 days1 3)ear 1-4 yrs3 (3) (2)
I I I 1, I '-- - I -
St. Pierre and MiquelonSt. Vincent (8)
St. Lucia (8)
Surinam (8)Trinidad and Tobago (8)
UruguayVenezuela
1970197219721971197219711972
13.09.88.45.74
6.69.86.7
0.810.470.651.490.70.95
23.5
27.9
13.421.423.6
33.369.652.321.225.240.451.7
I I -
6.24.12.41.51.15.7
-5 yrs(2)
- 19717.39.816.3
(1)Health Conditions in the Americas, PAHO Scientific Publication 287, 1974
(2)Per 1,000 population
(3)Per 1,000 live births
(4)1965 data
(5)1971 data
(6)1972 data
(7)Data provided by the Ministry of Health
(8)English-speaking Caribbean. Source: MCH Profiles
(9)1973 data
II
( )

Table No. 7
PREVALENCE OF IRON, FOLATE, AND VITAMIN B1 2 DEFICIENCY ANEMIA IN THEGENERAL POPULATION(1)
I
(l*l)National Nutrition Surveys - INCAP, 1965-69
(1 2)National Nutrition Surveys - ICNND, 1960 (military personnel)
(l*3)National Nutrition Surveys - ICNND, 1960
(2) Hb < llg/100 ml in pregnant women and preschool-age children (0-5 years); Hb < 12g/100 ml in adult femalesand school children (6-14 years); Hb < 13g/100 ml in adult males
(3) Transferrin iron < 15%
(4) 3 ng/ml
(5) < 80 pg/ml
Iron Folate Vitamin B12Tota 1 (3) (4)deficiency deficiency deficiency (5)C o u n t r y (2)
Rural Total Urban Rural Total Urban Rural Total Urban Rural Total
(1.3)Bolivia (1 3) 3.0- - -Brazil, N.E. ('3 ) - 10.0 - - - - - -.Colombia( i. 3) - 6.9 - _ . ..Costa Rica(l.l) - 3.0 6.0 17.0 - 9.0 19.0 - - - -
Chile(1.2) - 0.7 - _ . - -Ecuador(1. 3) - 2.7 _- - - -El Salvador(l.l) 4.0 - 18.0 13.0 - 8.5 24.0 - 3.2 8.0 -Guatemala(l 1 ) 6.0 - 10.0 17.0 - 22.0 17.0 - - 15.0 2.0Guyana - 41.0 - - - - - 8.4 - - -Honduras(l- 1) 6.0 10.0 18.0 17.0 - 36.0 13.0 - - 1.0 -Nicaragua(l.l) 3.0 - 11.5 7.0 - 18.0 36.0 - 1.0 2.0 -Panama(1.1) 8.0 - 12.7 20.0 - 19.7 18.3 - - - -
Peru(l.2) - 4.5 - - - -
___ __ __ __ __ __ _ __ ___ __ __ __ __ __I __ __ ___ __ __ __ __ __ __ __ __ ___ __ __ _ __ __ __ __ __ ___ __ _ __ __ __ __ __ __

Table No. 8
PREVALENCE OF IRON, FOLATE AND VITAMIN BANEMIA IN PREGNANT WOMEN(1)12
DEFICIENCY
Iron (3) Folate j Vitamin B1C o u n t r 1 defic y deficiency deficiency
(2)
Argentina(l)Brazil(l) (1)GuatemalaGuyana(6)Jamaica, 1967 (9 )
Mexico(l)Peru(l)Dominican Republic(7 )
St. Lucia( 8)Venezuela(l)
62.728.647.155.024.0
41.7 to 50.833.328.022.257.3
57.624.372.4
21.7 to 60.034.7
56.3
39.04.3
12.6
2.6 to 9.36.9
19.4
16.935.710.3
1.8 to 6.227.8
37.9I-
I
()Analysis of PAHO Collaborative9 June 1969.
Studies of Nutritional Anemias in Latin America and the Caribbean, RD 8/14,
(2)Hb < llg/100 ml in pregnant women and preschool children (0-5 years); Hb < 12g/100 ml in adult women andschoolchildren (6-14 years); Hb < 13g/ml in adult males
(3)Transferrin iron < 15%
(4)< 3 mcg/l
(5)< 80 pg/ml
(6)National Nutrition Survey, CFNI, 1971
(7)National Nutrition Survey, CFNI, 1970
(8)National Nutrition Survey, 197 4
(9)Pathak, U.N., et al; Obs. and Gyn. 29: 500, 1967
W W

Table No. 9
PREVALENCE OF IRON, FOLATE, AND VITAMIN B1 2 DEFICIENCY ANEMIA IN PRESCHOOL
AND SCHOOLCHILDREN(I )
IrT o t a 1n Folate4 Vitamin B12(2) Deficiency Deficiency ( Deficiency(5)
% % %C o u n t r y Pre- I Pre- Pre- Pre-
school School school School school School
| (0-5) (6-14) (0-5) (6-14) (0-5) (6-14) (0-5) (6-14)
Barbados, CFNI (1969) ! 32.7 9.3 40.0 - 34.0 - - -
Brazil, N.E. (1963) i 22°3 19.0Chile 2- 5.0 - - -
Grenada (1972) t 38.5 65.4 7,7 0.0 13o0 - 0.0 0.0Guyana (1971) 41.0 41.0 - - - -Paraguay (1965) - 26.0Dominican Republic (1970) 24.0 . .St. Lucia, CFNI (1974) 14,3 1 43.1
(1)National Nutrition Surveys
Hb < llg/100 ml in pregnant women and preschool children; HbHb < 13g/100 ml in adult males
(3)Serum iron < 50 mcg/100 ml
(4)< 3 ng/100 ml
(5)< 80 pg/ml
< 12g/100 ml in adult females and schoolchildren;i
(7%1

- 17 -
Table No. 10
PREVALENCE OF IRON,, FOLATE AND VITAMIN BDEFICIENCY ANEMIA IN ADULT WOMEN(1) 12
Iron Folate Vitamin BToota 1(3) (4) 12l
C o u n t r y (2) Deficiency Deficiency Deficiency 5)
Argentin . 7) 62.0Barbados 19.0 --Grenada, 1972( 7) 49.0 77 (
Guatemala 19.6 27.5 21.6Guyana, 1971 (7 ) 41.0 - -Mexico 20.4 58.8 6.4Peru 13.7 17.5 8.2
Dom. Rep., 1970(7 ) 14.0 - -St. Lucia, 1974(7) 23.4 - -Venezuela 30.3 20.0 10.1 1.0
(1)Analysis of PAHO Collaborative Studies of Nutritional Anemias in Latin America and
the Caribbean, RD 8/14, 9 June 1969.
(2)Hb < llg/100 ml in pregnant women and preschool children (0-5 years); Hb < 12g/mlin adult females and schoolchildren (6-14 years); Hb < 13g/100 ml in adult males.
(3)Transferrin iron < 15%
(4)< 3 ng/ml
(5)< 80 pg/ml
(6)Serum iron < 50 mcg/100 ml
(7)National Nutrition Survey

- 18 -
Table No. 11 (IPREVALENCE OF IRON, FOLATE AND VITAMIN B DEFICIENCY
ANEMIA IN ADULT MALES(i) 12
Iron 3olate Vitamin B1 2Country T o t a 1 Deficiency Deficiency (4 ) Deficiency(5)
2) % % %
Barbados(7) (1969) 2.3 (1)(6) _ _Guatemala(l) 2°9 2.9 25.7Guyana(7) (1971) 35.0 -_ _Jamaica(8) 11.9 -_Mexico(l) 4.9 3.9 2.9 1.0Peru(l) 5.3 5.2 10.5 2.6Dominican Republic,
1970 30 -_St. Lucia,1974-CFNI 26.7 _ _Venezuela(l) 2.3 - 11.4
(1)Analysis of PAHO Collaborative Studies of Nutritional Anemias in Latin America andthe Caribbean, RD 8/14, 9 June 1969
(2)Hb < llg/100 ml in pregnant women and preschool children (0-5 years);Hb < 12g/100 ml in adult women and schoolchildren (6-14 years); Hb <in adult males
13g/100 ml
(3)Transferrin iron < 15%
(4)< 3 ng/ml
(5)< 80 pg/ml
(6)Serum iron < 50 mcg/100 ml
(7)National Nutrition Survey
(8)Miali, W. E., P. F. Milner, H. G. Lovell, and K. L. Stanford, HaematologicalInvestigations of Population Samples in Jamaica. Br. J. Prev. Soc. Med.; 21:45, 1967
4

- 19 -
Table No. 12
PREVALENCE OF ENDEMIC GOITER AND SALT IODIZATION PROGRAMS(1)(2)
Country
ArgentinaBarbadosBelizeBoliviaBrazilColombia (3)Costa RicaChileEcuadorEl Salvador(
Guatemala(3)GuyanaHaitiHonduras (3)
JamaicaMexicoNicaraguaPanama(3)ParaguayPeruDominican Republic
Nevis4)4AnguillaSt. Lucia(4)
SurinamTrinidad and Tobago
UruguayVenezuela
IT
Prevalence
-1 ML/
xx
x
x
x
x
xx
_ _ _ _ _ _ U~
12-50
11-59
2
xxx
x
xx
xx
x
x
x
xx
x
x
x
x
Sal loizaioSalt Iodization
LegislatinCoverage
1967
None1968195319551941
1966(1931)196819611954NoNo1960None1963No195519581940( ° )
No
NoNoNoNo
19531966
90
18485100
758080-95
100
10010025
30
_ _ _ _ _ _ _ _ _ _ _ _ 1 _ _ _ _ _ _ _ _ _
(1)Endemic Goiter and Cretinism: Continuing Threats to World Health. Report of
the IV Meeting of the PAHO Technical Group on Endemic Goiter. PAHO Scientific
Publication no. 292, 1974
(2)Guidelines for Food Fortification in Latin America and the Caribbean. PAHO
Scientific Publication 240, 1972
(3)National Nutrition Surveys, INCAP, 1965-1969
(4)Four-Year Health Projections, 1971-1975
(5)only in goiterous areas
I-I 1 V -I o V . vo- r _ - I
1 n we;1 /n-_a I l-'7 A

- 20 -
exists in these geographical areas but it is not always defined as a problemto which specific priority is assigned in the health field.
1.3.4 Hypovitaminosis A
The surveys made during the period 1959-1971 in 20 countries in theRegion (Table No. 13) indicate a prevalence of vitamin A serum level defi-ciencies in the general population of between 1.9 and 45.1 per cent. Thesame studies show that the prevalence in the population under 15 years ofage is significantly greater than in the total population.
The studies made by INCAP, CFNI and other institutes have demonstratedthe presence of ocular lesions in 14 per cent of malnourished children andin 1.5 per cent of children under five years of age.
1.3.5 Cardiovascular Diseases and Diabetes
Although the information available on the mortality and morbiditycaused by these diseases is not complete, it was found that by 1970 cardio-vascular diseases were the leading cause of death in 10 countries of theRegion. Studies made on the prevalence of diabetes in several Latin Americanand Caribbean countries indicate rates ranging from 11.3 to 48 per 1,000inhabitants.
1.4 Food Situation
According to data on the availability of food in 1970, in five coun-tries the average number of calories per capita available for consumptionwas under 2,000 (Table No. 14). Furthermore, in 11 countries the availa-bility of protein per person/day is less than 60 grams and approximatelytwo-thirds of this protein is of vegetable origin.
It must be pointed out that data on the per capita availability offood do not reflect the true consumption by the population. The food con-sumption surveys give a more realistic indication of the intake of foodsand nutrients in the various groups studied.
The consumption of calories per person/day in eight countries is belowthe requirements estimated by FAO for the Region. In nine countries it isless than 2,000 calories per person/day.
The per capita/day consumption of protein ranges from 43.8 to 116grams in the Region, and animal protein as a percentage of total protein con-sumed varies from 17 to 50 per cent.
Substantial differences are to be noted in the per capita consumptionof calories between the urban and the rural areas. In seven countries, be-tween 8 and 34 per cent of the rural families consumed less than 75 per centof the established requirements. |
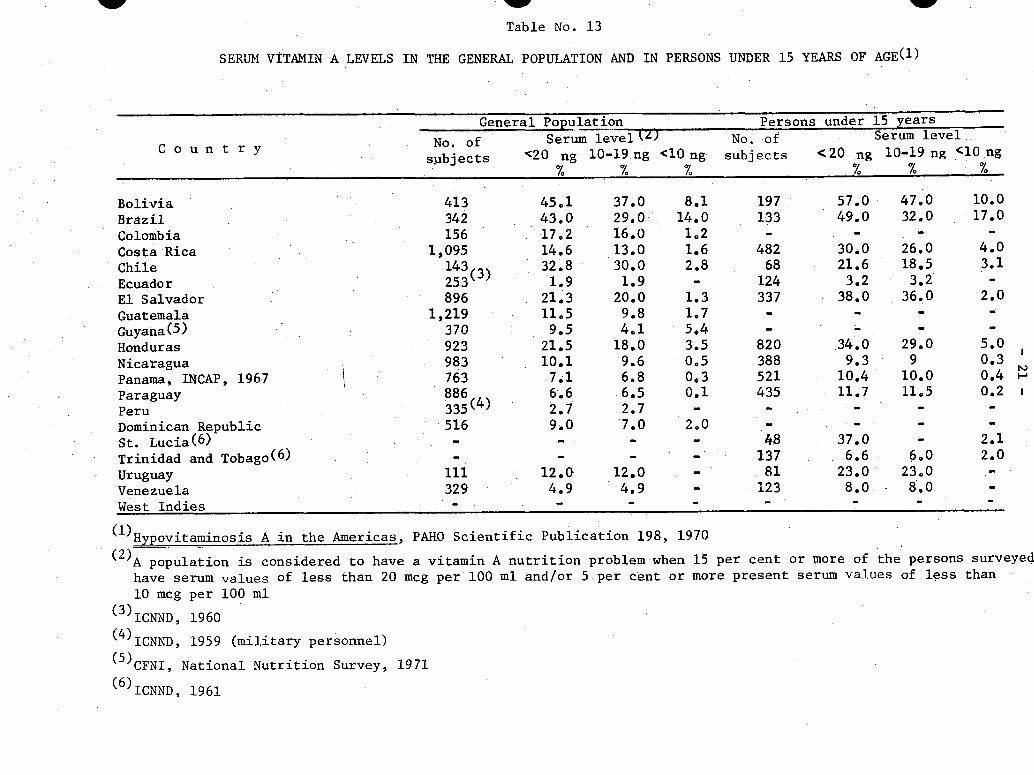
w W
Table No. 13
SERUM VITAMIN A LEVELS IN THE GENERAL POPULATION AND IN PERSONS UNDER 15 YEARS OF AGE(1)
General Population Persons under 15 years
No. of Serum levelM No.f o Serum levelC o u n t r y
C o u n t y subjects <20 ng 10-19 ng <10 ng subjects <20 ng 10-19 ng <10 ng% % % % % %
Bolivia. 413 45.1 37.0 8.1 197 57.0 47.0 10.0
Brazil 342 43.0 29.0 14.0 133 49.0 32.0 17.0
Colombia 156 17.2 16.0 1.2 - - - -
Costa Rica 1,095 14.6 13.0 1.6 482 30.0 26.0 4.0
Chile 143 32.8 30.0 2.8 68 21.6 18.5 3.1
Ecuador 253( ) 1.9 1.9 - 124 3.2 3.2 -
El Salvador 896 21.3 20.0 1.3 337 38.0 36.0 2.0
Guatemala 1,219 11o5 9.8 1,7 - -
Guyana(5) 370 9.5 4.1 5.4 - _ - -
Honduras 923 21.5 18.0 3.5 820 34.0 29.0 5.0
Nicaragua 983 10.1 9.6 0,5 388 9.3 9 0.3
Panama, INCAP, 196.7 763 7,1 6.8 0,3 521 10.4 10.0 0.4
Paraguay 886 6.6 6.5 0.1 435 11.7 11.5 0.2
Peru 335(4) 2.7 2.7 - - - -
Dominican Republic 516 9.0 7.0 2,0 -. ..St. Lucia(6) - - - - 48 37.0 2.1Trinidad and Tobago(6) - - - - 137 6.6 6.0 2.0
Uruguay 111 12.0 12.0 - 81 23.0 23.0 -
Venezuela 329 4.9 4.9 - 123 8.0 8.0 -
West Indies -
II-
(1)Hypovitaminosis A in the Americas, PAHO Scientific Publication 198, 1970
(2)A population is considered to have a vitamin A nutrition problem when 15 per cent or more of the persons surveyed
have serum values of less than 20 mcg per 100 ml and/or 5 per cent or more present serum values of less than
10 mcg per 100 ml
(3)ICNND, 1960
(4)ICNND, 1959 (military personnel)
(5)CFNI, National Nutrition Survey, 1971
(6)ICNND, 1961
W
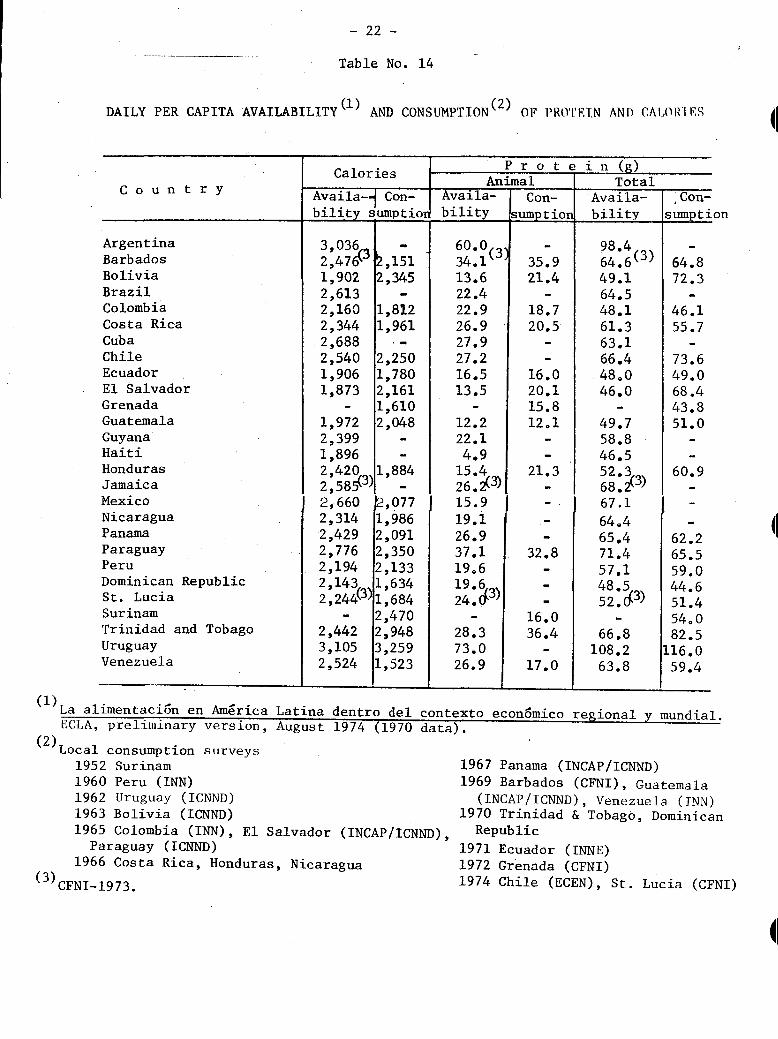
- 22 -
Table No. 14
DAILY PER CAPITA AVAILABILITY(I ) AND CONSUMPTION( 2 ) OF PROTETN AND CAIOR11F S
Country
ArgentinaBarbadosBoliviaBrazilColombiaCosta RicaCubaChileEcuadorEl SalvadorGrenadaGuatemalaGuyanaHaitiHondurasJamaicaMexicoNicaraguaPanamaParaguayPeruDominican RepublicSt. LuciaSurinamTrinidad and TobagoUruguayVenezuela
La alimentaci6n en America
Calories
Availa-4 Con-bilitv sumDtior
Availa-bilitv
Con-umntinri .timn P -- o- h 1__ -
4IP r o t e i n (a)
Animal1 __ · · ~ otaAvaila-hil itv
3,0362,4761,9022,6132,1602,3442,6882,5401,9061,873
1,9722,3991,8962 4202,585(3 )
2,6602,3142,4292,7762,1942,1432,244(3)
2,4423,1052,524
,151,345
1,8121,961
2,2501,7802,1611,6102,048
1,884
.,0771,9862,0912,3502,1331,6341,6842,4702,9483,2591,523
60.0(3)34.113.622.422.926.927.927.216.513.5
12.222.14.9
15.4262 (3)15.919.126.937.119.6
19 624:,3)
28.373.026.9
35.921.4
18.720.5
16.020.115.812.1
21.3
32.8
16.036.4
17.0
98.464,6(3)
49.164.548.161.363.166.448.046.0
49.758.846.5520368 .3)67.1
640465.471.457.148.53)52,43)
66.8108.263.8
,Con-mumnti on
64.872.3
46.155.7
73.649.068.443.851.0
60.9
62.265.559.044.651.454,082.5
116.059.4
- .- I'_ _ _ I'_ _ I__ ! I__ _ _ _
Latina dentro del contexto economico regional y mundial.ECLA, preliminary version, August 1974 (1970 data).
(2)Local consumption surveys1952 Surinam 11960 Peru (INN) 11962 Uruguay (ICNND)1963 Bolivia (ICNND) 11965 Colombia (INN), El Salvador (INCAP/ICNND),
Paraguay (ICNND) 11966 Costa Rica, Honduras, Nicaragua 1
(3)CFNI-1973.
967 Panama (INCAP/ICNND)969 Barbados (CFNI), Guatemala(INCAP/ICNND), Venezuela (INN)
970 Trinidad & Tobago, DominicanRepublic
971 Ecuador (INNE)972 Grenada (CFNI)974 Chile (ECEN), St. Lucia (CFNI)
4I
(1)
Total

- 23 -
1.5 Factors'Determining Nutritional Status
Simplified to a maximum, the factors determining nutritional status
may be divided into three large groups: (1) availability of food to meet
the needs of the population; (2) sufficient and balanced diet; and (3) ap-
propriate utilization of food by the organism.
The availability of food depends on a number of circumstances related
to agricultural livestock and fisheries production, such as soil quality,
water, climate, rainfall, irrigation, land tenure, seeds and animal species,
animal and plant diseases, fertilizers, and agricultural and fishing technology.
In analyzing the figures that show the changes that agricultural and
livestock production in Latin America has undergone during the last 20 years,
a persistent decrease in the growth rate of production is to be noted. Whereas
the annual output growth rate between 1952 and 1962 was 3.2 per cent, which
was slightly higher than the population growth rate of 2.8 per cent, during
the period 1962-1972 the output growth rate averaged 3.1 per cent annually
while the population growth rate in that period amounted to 2.9 per cent.
However, the per capita production level was 2 per cent lower that that in
the period 1952-1962.
It should be emphasized that animal diseases in the Region at present
cause a significant loss of foodstuffs of animal origin. It has been estimated
that in Latin America and the Caribbean area losses of animal products due
to livestock diseases exceed 35 per cent of total production. This means a
loss of 4.4 grams of animal protein per person/day, or 50 per cent of the
present animal protein supply of the Region, estimated by FAO at 9 grams per
person/day.
Another general feature that helps to define the framework in which
agriculture production takes place in the Region is the low fertility of the
land. In this situation, the Region uses 20 kg of fertilizers per hectare
whereas Japan and the Netherlands use about 400 kg. With respect to the
reserves of land it is estimated that 400-600 million hectares are available,
i.e., an area six times greater than that at present used.
The consumption of food by the members of a family or of a community
depends on other correlated economic or sociocultural factors. On the one
hand, capital and employment and wage levels determine the purchasing power
of the family unit; on the other, customs and food habits, beliefs and taboos
about food, health and child rearing practices determine individual and fam-
ily preferences and feeding practices.
In this regard it should be mentioned that in 10 countries the aver-
age annual per capital income is less than US$500 (Table No. 15). As is
well known, the internal distribution of these average values is very un-
equal in the different countries, and therefore it may be assumed that there
are large population groups whose income is extremely low.

- 24 -
Table No. 15
ANNUAL PER CAPITA INCOME - VARIOUS COUNTRIES IN THE REGION
1973
Co u n tryPer capitaincome inUSS (1)
ArgentinaBarbadosBoliviaBrazilChileColombiaCosta RicaDominican RepublicEcuadorEl SalvadorGuatemalaHaitiHondurasJamaicaMexicoNicaraguaPanamaParaguayPeruUruguayVenezuelaLatin America
1,136.9620.8222.4500.3801.9405.9645.3464.1337.5310.0442.9100.1(2)313.4799.2738.7461.3820.0292.4533.8807.6
1,168.6617.7
in 1970 dollars
(2)1972
Source: Statistical Profile of Latin America.
Inter-American Development Bank
11
11

- 25 -
Furthermore, illiteracy rates range between 26 and 97.4 per cent andinfluence the prevalence of taboos and false beliefs about food in the com-munity (Table No. 16).
Finally, there are a number of factors that hinder the proper utiliza-tion of the food consumed and cause losses of certain nutrients. Infectiousand parasitic diseases are determining factors of malnutrition, not only asa result of poor absorption and loss of nutrients but also as a result of theloss of appetite which they cause and the frequent dietary restrictions towhich patients are subject because of ignorance or mistaken feeding practices.
The importance of the foregoing is clearly brought out by the factthat only six countries in the Region have achieved an effective DPT vaccina-tion level (60 per cent or more) and that in the remaining countries the DPTimmunization level is below 59 per cent (Table No. 17). In the case of measles,the situation is even more dramatic, since in about half the countries theimmunization level of the susceptible population is below 40 per cent (TableNo. 18).
As for environmental sanitation, only 57 per cent of the populationof the Region have water supply services, and more than 70 per cent lacksewage disposal services (Table No. 19).
1.6 Impact of Nutritional Problems on Economic and Social Development
In a study made in Jamaica in 1968, the direct cost of the loss ofchildren's lives due to malnutrition (cost of pre- and postnatal care, rear-ing of the infant and even of burying it) was estimated at between US$110and US$190 in the case of children who died before reaching five years of age.Taking these figures as a basis, the annual cost of the loss of the lives ofchildren under five years of age in the Region would total US$110 million.These figures include only the excess mortality or preventable deaths ofchildren under five years of age, which has been estimated by PASB at 768,000if the death rates in Latin America and the Caribbean area in 1968 had beensimilar to those in the United States of America. However, this excess mor-tality of more than 2,000 deaths a day, at an approximate cost of US$300,000per day, could have been prevented by programs for the prevention of malnu-trition and infectious diseases.
Another serious obstacle to the educational and economic developmentof the countries of the Region are the serious sequalae of malnutrition inchildren that survive its adverse effects; they show manifest retardation intheir physical growth, frequently accompanied by a reduced intellectual quo-tient that limits their learning capacity. Although most countries assignhigh priority to education, and allocate between 5 and 25 per cent of theirtotal budget to this sector, these efforts are limited by the low scholasticperformance of children with a background of malnutrition.

- 26 -
Table No. 16
LITERACY RATE - VARIOUS COUNTRIES IN THE REGION
LiteracyC o u n t r y Year
% Year
Argentina 94.0 (70)Barbados 97.4 (60)Brazil 67.9 (70)Bolivia 39.8 (71)Colombia 78.5 (71)Costa Rica 85.7 (63)Chile 86.0 (70)Cuba 97.0Ecuador 71.1 (72)El Salvador 59.6 (71)Guatemala 37.9 (64)Haiti 26.0 (71)Honduras 47.3 (61)Mexico 76.2 (70)Nicaragua 57.6 (71)Panama 79.4 (70)Paraguay 80.0 (70)Peru 67.0 (70)Dominican Republic 67.2 (70)Uruguay 90.5 (63)Venezuela 77.1 (71)
Source: Economic and Social Progress in Latin America.Inter-American Development Bank
Annual Report 1972.
4I
(I
41

- 27 -
Table No. 17
NUMBER OF COUNTRIES AND POPULATION UNDER 5 YEARS OF AGE BYCATEGORIES, ACCORDING TO THE PERCENTAGE OF CHILDREN UNDER
5 YEARS OF AGE VACCINATED WITH DPT
(1972)
No. of Population under (1)C a t e g o r y . countries 5 years of age Percentage
(in thousands)
I. 80% and more
II. 60 to 79%
III. 40 to 59%
IV. 20 to 39%
V. Less than 20%
Subtotal countries with data
Countries without data
Total
2
4
7
6
3
1,197
3,853
18,262
3,472
2,621
22 29,405
3 17,942
25 47,347
(1)Population ofunder 5 years
I
the countries in each category as a percentage of the populationof age of countries for which data are available
II III IV
BahamasColombiaCosta RicaEl SalvadorMexicoPanamaPeru
EcuadorGuyanaHondurasJamaicaParaguayDominican Republic
No data available
ArgentinaBrazilTrinidad and Tobago
Source: PAHO/WHO Department of Communicable Diseases, 1974
4.1
13.1
62.1
11.8
8.9
100.0
37.9
100.0
BarbadosCuba
ChileNicaraguaUruguayVenezuela
V
BoliviaGuatemalaHaiti

- 28 -
11Table No. 18
NUMBER OFACCORDING
COUNTRIES AND POPULATION BY CATEGORIESTO THE POPULATION UNDER 5 YEARS OF AGEVACCINATED AGAINST MEASLES
(1972)
No. of Population underC a t e g o r y countries 5 years of age Percentage
(in thousands)
I. 80% and more
II. 60 to 79%
III. 40 to 59%
IV. 20 to 39%
2
2
5
2
3,975
3,509
3,254
11,184
9.8
8.7
8.0
27.6
V. Less than 20%
Subtotal countries with data
Countries without data
Total
5 18,568 45.9
16 40,490 100.0
9 5,857 14.5
25 47,347 100.0
(1)Population ofpopulation of
the countries in each category as a percentagethe countries for which data are available.
II III
of the total
V
Chile 103.2Peru 86.9
GuatemalaArgentina
Costa RicaHondurasPanamaUruguayVenezuela
43.357.256.244.840.0
BrazilEcuadorEl SalvadorHaitiParaguay
No data available
BahamasBarbadosColombiaCubaGuyanaJamaicaNicaraguaDominican RepublicTrinidad and Tobago
Source: PASB/WHO Department of Communicable Diseases, 1974
I
6.80.119.20.71.1
l
- -

- 29 -
Table No. 19
POPULATION WITH WATER SUPPLY AND SEWAGE DISPOSAL SERVICESIN THE COUNTRIES OF THE REGION
Water supply Sewage disposalC o u n t r y service service
% %
Argentina (79) 67 29Barbados (75) -100 -Belize (74) 57 3Bolivia (74) 23 12Brazil (73) 58 18Chile (74) 70 32Colombia (74) 61 41Costa Rica (73) 72 16Cuba (73) 53 26Ecuador (74) 32 24El Salvador (74) 53 15Guatemala (74) 38 14Guyana (74) 79 11Haiti (74) 12 -Honduras (74) 41 15Jamaica (73) 88 -Mexico (74) 57 26Nicaragua (74) 54 12Panama (74) 76 36Paraguay (74) 9 6Peru (74) 46 29Dominican Republic (74) 54 19Surinam (74) 68 21Trinidad and Tobago (70) 96 50Venezuela (73) 73 33
Source: PASB/WHO Department of Engineering and Environmental Sciences
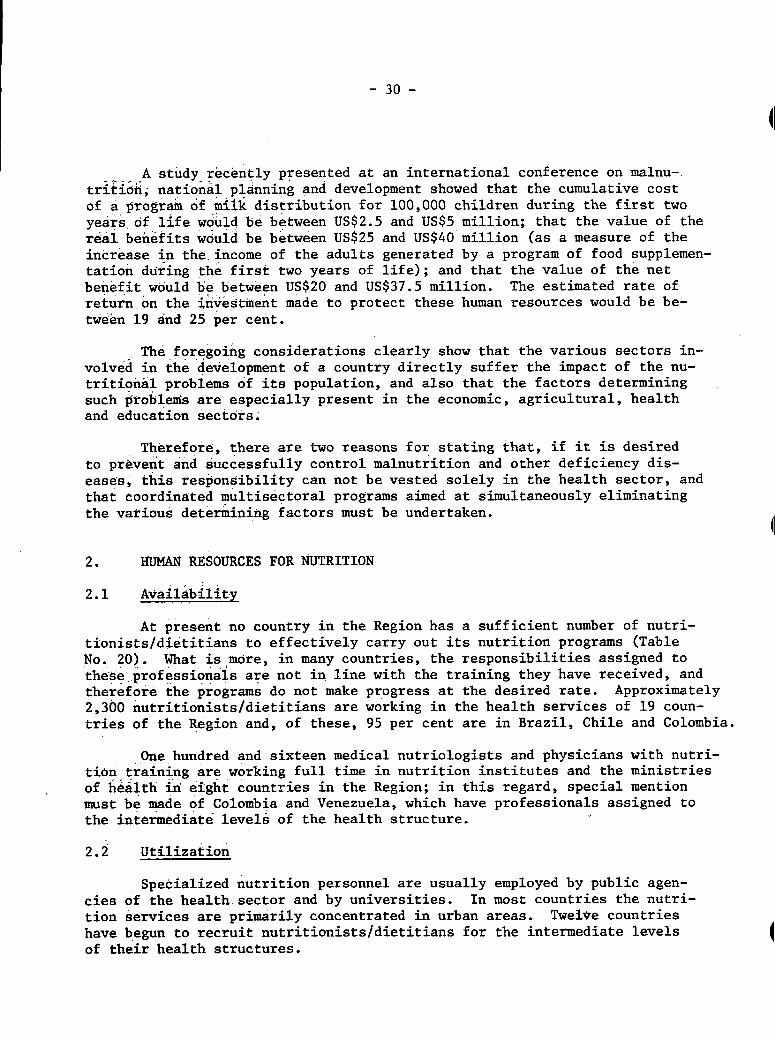
- 30 -
A study recently presented at an international conference on malnu-
trition, national planning and development showed that the cumulative cost
of a program of milk distribution for 100,000 children during the first two
years of life would be between US$2.5 and US$5 million; that the value of the
real benefits would be between US$25 and US$40 million (as a measure of the
increase in the income of the adults generated by a program of food supplemen-tation during the first two years of life); and that the value of the net
benefit would be between US$20 and US$37.5 million. The estimated rate ofreturn on the investment made to protect these human resources would be be-
tween 19 and 25 per cent.
The foregoing considerations clearly show that the various sectors in-volved in the development of a country directly suffer the impact of the nu-tritional problems of its population, and also that the factors determining
such problems are especially present in the economic, agricultural, healthand education sectors.
Therefore, there are two reasons for stating that, if it is desired
to prevent and successfully control malnutrition and other deficiency dis-
eases, this responsibility can not be vested solely in the health sector, and
that coordinated multisectoral programs aimed at simultaneously eliminating
the various determining factors must be undertaken.
2. HUMAN RESOURCES FOR NUTRITION
2.1 Availability
At present no country in the Region has a sufficient number of nutri-
tionists/dietitians to effectively carry out its nutrition programs (TableNo. 20). What is more, in many countries, the responsibilities assigned tothese professionals are not in line with the training they have received, and
therefore the programs do not make progress at the desired rate. Approximately2,300 nutritionists/dietitians are working in the health services of 19 coun-tries of the Region and, of these, 95 per cent are in Brazil, Chile and Colombia.
One hundred and sixteen medical nutriologists and physicians with nutri-tion training are working full time in nutrition institutes and the ministriesof health in eight countries in the Region; in this regard, special mentionmust be made of Colombia and Venezuela, which have professionals assigned tothe intermediate levels of the health structure.
2.2 Utilization
Specialized nutrition personnel are usually employed by public agen-
cies of the health sector and by universities. In most countries the nutri-
tion services are primarily concentrated in urban areas. Twelve countries
have begun to recruit nutritionists/dietitians for the intermediate levelsof their health structures.

vW
Table No. 20
HUMAN RESOURCES IN NUTRITION AND EDUCATION AND TRAINING CENTERS
Nutritionist/Dietitian Dietitian Postgraduateuniversity level non-university level course in
C o u n t r y Rate per Rate per nutritionNo. 10,000 pop. Schools No. 10,000 pop. Schools SchoolsCountry __ 110, perT Rate per nutrition
Argentina - - 3 - - -
Bahamas(5) 0 0 0 2 0 0 0Barbados(5) 1 0 0 1 0 0 0Belize 0 0 0 1 .08 0 0Bermuda(5) 1 0 0 2 0 0 0Bolivia 1 00 1(1) 24(2) .05 -
Brazil 886 - 8 0 0 0 2Colombia 147(3) .06(3) 4 - - --Costa Rica 7 0 0 3 0 0 - H
Chile 645(4) .63(4) 5 - - - 1Dominica(5) 0 0 0 0 0 0 0Ecuador 2 .00 1(1)' 10 .02 -
El Salvador 5 .01 1 16 .04 0Grenada(5) 0 0 0 0 0 0 0Guatemala 11 .02 1 0 0 0 1Guyana(5) 1 0.0 0 0 0 0 0Haiti 0 0 0 0 0 0 0Honduras 2 .008 0 1 .004 0 0Jamaica (5) 7 .03 0 11 .06 0 1Mexico 42 .00 2 - - - 4Montserrat 0 0 0 1 .01 0 0Nicaragua 6 .03 0 0 0 0 0Panama 12 .08 0 1 .007 0 0Paraguay 3 .03 0 - - 0 0Peru 5 - - 266 .18 3Puerto Rico - - -. .. 1
V v

Table No. 20 (continued)
Nutritionist/Dietitian Dietitian I'ostgradmlteUniversity level non-university level course in
C o u n t r y Rate per Rate per nutrition
No. 10.000 pop. Schools No. 1(),000 pop. Schools Schools
Dominican Republic 5) 0 0 0 0 0 0 0St. Kitts-Nevis and AP;guilla 0 0 0 0 0 0 0St. Pierre and MiquelonSt. Vincent(5) 0 0 0 0 0 0 0St. Lucia( 5) 0 0 0 0 0 0 0Surinam(5) 0 0 0 3 0 0 0Trinidad and Tobago(5) 3 0 0 14 0 0 0Uruguay - - 1- - -Venezuela 458 0.38 3 - - - 3
ltO
(1)First graduation 1975
(2)1969 data - Four-year Health Projections 1971-1975
(3)1974. Personnel of the Instituto Colombiano de Bienestar Familiar. No data available on personnel of othersectors.
(4)1974. Personnel of National Health Service. No data available on personnel of other sectors.
(5)Bosley, B. and I,. Wagner: Human Resources Study in Nutrition, Dietetics and Home Economics - Caribbean Region.I'AII) Report HP/AMRO-4207.1
m-

- 33 -
Very little information is available about the working conditions ofnutrition personnel in the countries of the Region. However, some nationalagencies report the following in this regard: (a) salaries and working con-ditions in institutes and universities are better than those in hospitals andother agencies of the health sector; (b) the physical facilities and the equip-ment of hospitals and health centers in semi-urban areas are unsatisfactoryand receive little support from the central level; (c) means of transporta-tion in rural communities are sometimes extremely limited; (d) nutritionistsand dietitians receive inadequate support from the medical profession;(e) there are very few opportunities for continuing education programs andrefresher programs in nutrition and dietetics; (f) in most cases there areno incentives in terms of promotion, salary increases or better working con-ditions for nutrition personnel; and (g) the responsibilities and functionsof nutrition personnel are inadequately defined.
2.3 Education and Training
a) Nutritionists/Dietitians
As a result of a conference on the training of nutritionists/dietitians,held in Caracas in 1966 and sponsored by PASB/WHO, the former schools of die-tetics were gradually converted into university level programs which are inthe process of consolidation.
At present there are 30 schools of nutrition and dietetics in theRegion, and the annual number of graduates varies from 10 to 50 per school.(Table No. 20). However, the schools face serious limitations because oflack of educational material and of suitably trained faculty members.
In recent years the quality of the curricula of most of the schoolshas been improved, but this process must be continued and their role in plan-ning the development of human resources in nutrition must be analyzed. Accountmust be taken of the needs of the country as regards the number of nutritionists/dietitians, training of intermediate personnel that will help improve the ef-fectiveness of nutritionists/dietitians, continuing education of graduates andthe nutrition training of personnel of other sectors.
b) Medical Nutriologists
Brazil, Chile, Colombia, Guatemala, Puerto Rico and Venezuela haveacademic programs for the training of nutriologists which meet not only localneeds but also requests from other countries in the Region.
c) Physicians with Training in Nutrition
Some countries such as Chile, Colombia and Venezuela are conductingnutrition courses for physicians consistent with their needs. The durationof these courses varies from six weeks to two months.

- 34 -
d) Post-basic Courses for Nutritionists/Dietitians
Brazil, Chile, Colombia, Puerto Rico and Venezuela have organizedpost-basic courses in the planning and administration of health serviceswith emphasis on nutrition.
e) Nutrition or Dietetic Auxiliaries or Assistants
In order to improve the organization and management of food servicesin hospitals and other social welfare institutions, 11 countries in the Regionare training intermediate level personnel in courses whose duration variesfrom two to six months. These courses are conducted according to the needsof each country.
f) Nutrition Training of Auxiliary Personnel for PrimaryHealth Care Services
It is important to point out that the incorporation and developmentof the aspects of food and nutrition in health auxiliary training programsis deficient in most of the countries.
If it is borne in mind that the extension of primary health care serv-
ices to increase coverage is the principal strategy of the health sector, theinservice education and training of this personnel has the highest priority.
3. FOOD AND NUTRITION PROGRAMS
3.1 Technical Nutrition Units
Generally speaking, there are technical nutrition units at the cen-tral level of the ministries of health in the countries of the Region butvery little outreach to the intermediate and local levels, as part of theprimary health care services.
Only a few of these technical units have established appropriate intra-and extrasectoral coordination arrangements that make for the active participa-tion of the health disciplines and of other national agencies concerned withthe solution of the food and nutrition problems of the population.
Thus the degree of development of the nutrition services of the minis-tries of health varies considerably between the various countries (TableNo. 21). Some have established appropriate systems for the planning, manage-ment and evaluation of the nutrition activities that are integrated into thehealth program; others show weaknesses in the administrative process, espe-cially with respect to the establishment and implementation of technicalstandards.
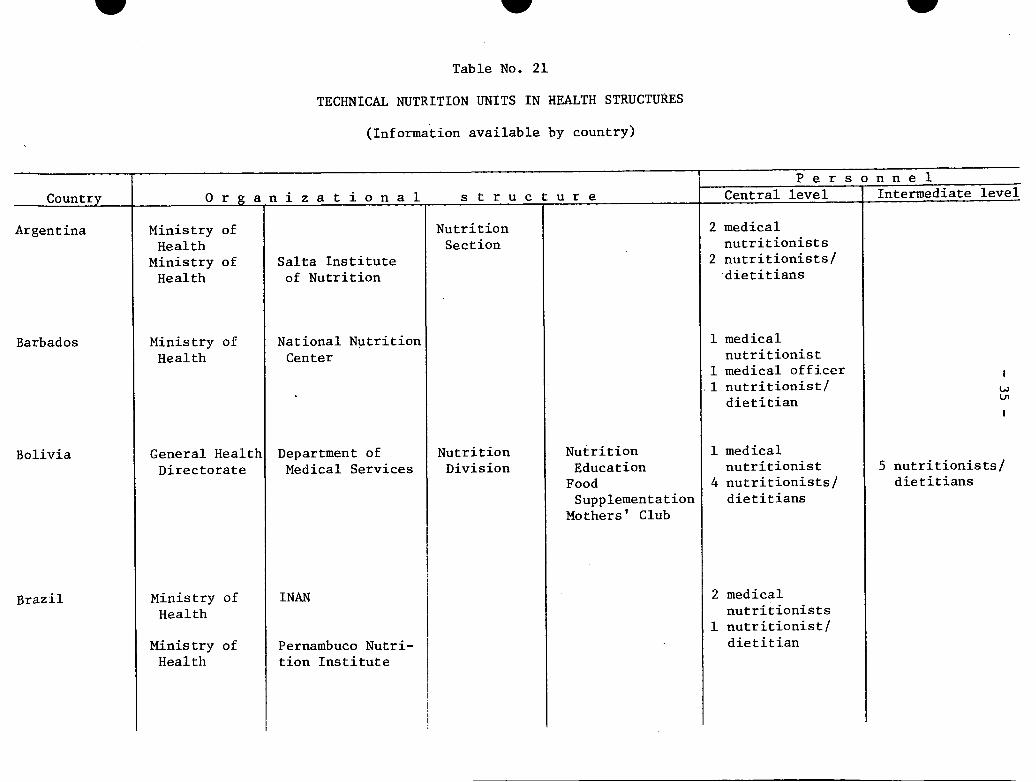
Table No. 21
TECHNICAL NUTRITION UNITS IN HEALTH STRUCTURES
(Information available by country)
w
Ii I P ersonnel
Country O r g a n i z a t i o n a 1 s t r u c t u r e Central level I Intermediate level
Ministry ofHealth
Ministry ofHealth
Ministry ofHealth
Salta Instituteof Nutrition
General Health Department of
Directorate Medical Services
Ministry ofHealth
Ministry ofHealth
INAN
Pernambuco Nutri-tion Institute
NutritionSection
NutritionDivision
NutritionEducation
FoodSupplementation
Mothers' Club
2 medicalnutritionists
2 nutritionists/dietitians
1 medicalnutritionist
1 medical officer.1 nutritionist/dietitian
1 medicalnutritionist
4 nutritionists/dietitians
2 medicalnutritionists
1 nutritionist/dietitian
5 nutritionists/dietitians
w
NationalCenter
Argentina
Barbados
Bolivia
Brazil
Nutrition

Table No. 21 (continued)
PersonnelCountry O r g a n i z a t i o n a i s t r u c t u r e Central level Intermediate level
Chile
Colombia
Costa Rica
Cuba
DominicanRepublic
Ecuador
El Salvador
Guatemala
Guyana
National Health Health PromotionService Sub-department
Office of thePresident ofthe Republic
Ministry ofHealth
Ministry ofHealth
Ministry ofHealth andWelfare
General HealthDirectorate
Ministry ofHealth
Ministry ofHealth
ColombianInstitute ofFamily Welfare
Institute ofHygiene andEpidemiology
Institute ofHygiene andEpidemiology
I Technical
Department
M.I. HealthDepartment
Ministry ofHealth
NutritionSection
NutritionSub-directorate
NutritionSection
NutritionSection
NutritionSection
NationalNutritionDivision
NationalInstitute ofNutrition
Foodsupplementation
Epidemiologicalsurveillance
ResearchApplied NutritionEducation
Nutrition inHealthInstitutionalFood ServicesResearch andEducation
NutritionSection
NutritionSection
NutritionSection
3129
medical officersnursenutritionistsnutritionists/dietitians
12 medicalnutritionists
33 nutritionist/dietitians
11medical officernutritionist/dietitian
1 medicalnutritionist
2 nutritionists/dietitians
1 medical officer3 nutritionists/dietitians
1 medical officer1 nutritionist/dietitian
1 nutritionist/dietitian
636 nutritionists/dietitians
26 medical officers114 nutritionists/
dietitians
I
w
2 medicalnutritionists
1 nutritionist/dietitian

V
Table No. 21 (continued)
Country
Haiti
Honduras
Jamaica
Mexico
Montserrat
NetherlandsAntilles
Nicaragua
Panama
___ __~____I t__
Organ i z at ion a
Department ofPublic Healthand Population
Ministry ofHealth
Ministry ofHealth
Ministry ofHealth
Ministry ofHealth
Ministry ofEducation,Health andSocial Welfare
MinistryHealth
of
Ministry ofHealth
Ministry ofHealth
GeneralDirectorate
TechnicalServices
NationalNutritionInstitute
CoordinatedHealth Services
L structure
Division ofPublic Health,Preventive andCommunityMedicine
NutritionSection
NutritionSection
NutritionDivision
NutritionDepartment
NutritionSection
NutritionSection
NutritionSection
NutritionSection
NutritionSection
NutritionOffice
P e r s o n n e 1Central level
2 medicalnutritionists
1 medical officer
11medical officernutritionist/dietitian
1 nutritionist/dietitian
3 medicalnutritionists
7 nutritionists/dietitians
5 nutritionists/dietitians
1 nutritionist/dietitian
1
13
nutritionist/dietitian
medical officernutritionists/dietitians
Intermediate level
9 nutritionists/dietitians
13 nutritionists/ .dietitians '
w
-

Table No. 21 (continued)
Personnel
Country O r a n i z a t i o n a 1 s t r u c t u r e Central level Intermediate level
Paraguay
Peru
Puerto Rico
St. Kitts,Nevis,Anguilla
St. Lucia
St. Vincent
Surinam
Ministry ofHealth andWelfare
Ministry ofPublic Health
Department ofHealth
Ministry ofHealth andEducation
Ministry ofHealth andEducation
Ministry ofHealth
Ministry ofHealth
GeneralDirectoratePolicy SettingDepartment
GeneralDirectorateSpecial HealthPrograms
NationalNutritionInstitutes
HealthDepartment
HealthDepartment
NutritionDepartment
FoodDirectorate
Institute ofNutrition
NutritionSection
NutritionSection
NutritionSection
NutritionSection
NutritionSection
lA
1 medicalnutritionist
1 nutritionist/dietitian(part-time)
25medical officersnutritionists/dietitians
4 medicalnutritionists
4 nutritionists/dietitians
1 nutritionist/dietitian
2 nutritionists/dietitians
3 nutritionists/dietitian
w00I
=I

w
Table No. 21 (continued)
PersonnelCountry O r g a n i z a t i o n a 1 s t r u c t u r e Central level Intermediate level
Trinidad andTobago
Uruguay
Venezuela
Ministry ofPublic Health
Ministry ofHealth
Ministry ofHealth andSocialWelfare
Ministry ofHealth andSocial Welfare
HygieneDivision
Medical CareDivision
Nutrition andMetabolismUnit
NutritionSection
NutritionDepartment
NationalNutritionInstitute
Nutrition andDieteticsDepartment
Nutrition inPublic HealthResearch
FoodSupplementation
ResearchEducation
Nutrition inPublic Health
ClinicalNutrition Center
InstitutionalFood Services
I medicalnutritionist
2 nutritionists/dietitians
1 nutritionist/dietitian
3 medicalnutritionists
5 nutritionists/dietitians
4- 45 medical officers - >
23 nutritionists/dietitians
w\O
w w
- 40 -
A very few countries have officially included the nutrition componentin their national health plans. This situation is to be explained in part
by the complexity of the factors determining nutritional problems and the
failure to recognize their impact on health problems. This prevents adequate
consideration of nutrition aspects as part of health plans, in particular
those for protecting mothers and children.
Nutrition activities in health programs for the control of cardio-
vascular diseases, diabetes and obesity are conspicuous by their absence in
most of the countries and, generally speaking, are only undertaken as part
of hospital care.
3.2 Surveillance of Nutritional Status
The food and nutrition information systems are insufficient and not
always suitable. With the exception of eight countries in the Region in
which knowledge about the nutritional status of the population has been up-
dated, most of the countries rely on studies made in the period 1960-1964,
which usually related to limited geographical areas of each country and whose
results can therefore not be extrapolated to the country in general.
No country in Latin American and the Caribbean area has clearly de-
fined methods for periodically and appropriately conducting epidemiological
surveillance of the nutritional status of the population (Table No. 22).
3.3 Food Supplementation
Many of the countries have food supplementation programs aimed at the
vulnerable groups of the population: mothers, preschool and school-age chil-
dren that attend local health services, primary schools, and welfareinstitutions.
For the most part these programs are based on the importation of food
donated by international (World Food Program) and bilateral agencies (USAID/
CARE and CARITAS). Some use locally produced foods, including nonconven-
tional foods (vegetable mixtures of high nutritional value).
However, coverages are still limited and administration is weak in
many cases and in particular the education component is not integrated in
such a way as to effectively contribute to the improvement of the food habits
of the population.
Table No. 23 contains the information available on food supplementa-
tion programs in certain countries, and points up the absence of data on cov-
erage levels.
HI

- 41 -
Table No. 22
SURVEILLANCE OF THE NUTRITIONAL STATUS OF THE POPULATION
Surveillance of children under 5 years of age through the health
centers.
SINS (Subsistema de Informacion de Nutricion en Salud), 1973.
The National Health Service tabulates the weight by age of the
population under 6 years of age that attends its clinics.
ECEN (Encuesta Continuada sobre el Estado Nutricional de la
Poblacion Chilena), 1974. CONPAN (Consejo Nacional para laAlimentacion y Nutrici6n).
Costa Rica
Dominica
Guyana
Montserrat
St. Kitts,Nevis,Anguilla
St. Lucia
St. Vincent
Venezuela
Periodic anthropometric survey.
Surveillance of children under 5 years of age through the healthcenters.
Surveillance of children under 5 years of age through the health
centers.
Surveillance of children under 5 years of age through the health
centers.
Surveillance of children under 5 years of age through the healthcenters.
Surveillance of children under 5 years of age through the health
centers
Surveillance of children under 5 years of age through the healthcenters.
Nutritional Diseases Report Form, 1974, prepared by the Institute
of Nutrition (it is not part of the information system of the Ministry
of Health).
Antigua
Chile

Table No. 23
FOOD SUPPLEMENTATION PROGRAMS
I Preschool and Pregnant women and Welfareunweaned children unweaned children Schoolchildren Adults institutions
% cov- % cov- % cov- % cov- % cov-
No. I erage No. erage No. erage No. erage No. erage
Bolivia (1972) 7,200 - - - 317,00 -
Colombia (1972) 530,737 - 147,827 - 1,540,325 - 189,45 - - -
Costa Rica 60,000 - - - - -
Chile (1974) 1,414,942 - 343,419 - - - -
Ecuador (1972) 40,000 4 50,014 18 360,000 26 39,000 - 34,17 -
Mexico 18,000 - 45,000 - - - - - 10,15 -
Nicaragua _- - - 1041 esc -93 C.S.
Paraguay (1974) 7,785 - 3,641 - 13,768Peru (1972) 35,000 - 18,000 - 500,00 -
Venezuela (1974) 144,809 - - - 769,645 - -
L~~~~__
IiIi

- 43 -
Vigorous efforts will be needed to change the emphasis of these pro-grams, especially now that external food aid is being sharply reduced becauseof the difficulties facing the international agricultural surpluses market.
3.4 Nutrition Education
All the countries are carrying out nutritional information and exten-sion activities, but they do not always have defined objectives and standardswith respect to content, methodology and target groups.
There are still traditional educational programs in which little atten-tion is given to food habits, local availability of foods, and especially tothe limited purchasing power of the population groups whose nutritional needsare greatest.
Noteworthy is the fact that food supplementation programs as part ofmaternal and child and family health programs lack clear-cut policies fornutrition education activities that provide appropriate advice on the feed-ing of healthy or sick individuals.
3.5 Institutional Food Services
Few countries have proper standards for the administration and manage-ment of food services in such institutions as hospitals, sanatoriums, daycare centers, or school lunchrooms.
Thus, very few institutions can serve as an example to the communityand to patients of the importance of providing nutritionally balanced dietsand of preparing foods under acceptable sanitary conditions.
This situation helps to prolong the period of hospital stay and toincrease the operating costs of hospitals, and interferes with the properuse of these institutional resources in programs for the education and train-ing of personnel in food and nutrition.
3.6 Fortification of Foodstuffs
A number of countries in the Region have enacted legislation on thefortification of foodstuffs with vitamins and minerals (Table No. 24). How-ever, some of the existing standards do not define the minimum and maximumlevels of nutrients that should be added to foods. Therefore, food producershave great freedom in this respect, with the result that the advantages thistechnical advance represents in the control of specific nutritional deficien-cies is not obtained.
Sixteen countries in the Region have salt iodization programs. However,nine of these countries have not been able to effectively implement the program

Table No. 24
FOOD FORTIFICATION IN THE WESTERN HEMISPHERE(per kilogram)
Thiamine Ribo- Niacin Iron Calcium*Country/Item mg flavin mg mg g Remarks
mg
-1. Argentina2. Brazil
3.4.5.
BelizeBoliviaCanadaWheat flour
6. ChileWheat flour
7.8.
-_~~~~~~~ - _~~ - - - ~(1)- - - - - Enrichment of wheat flour and cassava
with lysine_:- ~ ~ ~ .... _ _ i(1)
..... ____(1)
4.4-5.5 2.6-3.3 35-44 28-36 1.1-1.4 Enrichment not compulsory; labelling iscompulsory when enrichment is applied
6.3
ColombiaCosta RicaWheat flour
9. Cuba10. Dominican Republic
Wheat flourRice
1.3 13 13 1.7 Enrichment compulsory; enriched wheatflour must be labelled as such
(1)
4.4-5.5 2.6-3.3 35-44 28-36 1.1-1.4 Enrichment compulsory; enriched wheatflour must be labelled as such (at costof consumer)
. . . . - (1)
4.4-5.5 2.6-3.3 35-44 28-36 1.1-1.4 Enrichment of wheat flour and rice4.4 2.6 35 28 - compulsory
11. Ecuador12. El Salvador
Wheat flour
(1)
4.4 2.6 35 28 1.1 Enrichment compulsory (at cost of consumer):
13. GuatemalaWheat flour 4.4 2.6 35 28 1.1 Enrichment compulsory (at
industry)
cost of private
Z-1

WTabl eo. 24 (continued)
Thiamine Ribo- Niacin Iron Calcium*
Country/Item mg flavin mg mg g Remarksmg
14. HaitiWheat flour Yes Yes Yes Yes Yes Enrichment of wheat flour;
no legislation
15. HondurasWheat flour
16. MexicoWheat flour
17. NicaraguaWheat flour
18. PanamaWheat flour
4.4 2.6 35 28 1.1
4.4-8.8 2.6-5.2 35-70 28-57
4.4
4.4
2.6
2.6
35 28
35 28
1.1
1.1
19. Paraguay20. Peru
Enrichment compulsory (80% at cost
of private industry, 20% at cost of
consumer)
Enrichment compulsory
Enrichment compulsory if used in
production of bread
Enrichment compulsory if used in
the production of bread (at costconsumer)
(1)Only protein enrichment of food
products
Iof 4-
Un
21. Puerto RicoWheat flour 4.4-5.5 2.6-3.3 35-44 28-36 1.1-1.4 Enrichment of wheat flour and
rice compulsory
35 28
22. Surinam23. United Kingdom
Rice flour
24. United States of AmericaWheat flourCorn meal and gritsRiceMacaroni and noodle
products
(1)
2.4
4.4-5.54.4-6.64.4-8.8
2.6-3.32.6-4.02.6-5.3
16 16
35-4435-5335-70
28-3628-5728-57
8.8-11.0 3.8-4.9 60-75 28-36
1.1-1.41.1-1.71.1-2.2
Enrichment compulsory
Enrichment not compulsoryEnrichment not compulsoryEnrichment not compulsory
Labelling is compulsory whenenrichment is applied
W
Rice 4.4 0.7

Table No. 24 (continued)
Thiamine Ribo- Niacin Iron Calcium*Country/Item mg flavin mg mg g Remarks
mg
25. UruguayWheat flour Yes Yes Yes Yes Yes Enrichment not compulsory (at cost
of private industry and consumer)26. Venezuela
Wheat flour 4.2 2.5 30 26 Enrichment not compulsory (at costof private industry and consumer)
27. West IndiesWheat flour Enrichment not compulsoryAntigua Imported flour enrichedBarbados Some imported flour enrichedDominica Imported flour enrichedGrenada Imported flour enrichedGuyana Imported flour enrichedJamaica 4.4-5.5 2.6-3.3 35-46 28-36 1.1-1.4 Imported flour enrichedMontserrat Imported flour enrichedNevis Imported flour enrichedSt. Kitts Imported flour enrichedSt. Lucia Imported flour enrichedSt. Vincent Imported flour enriched
28. Trinidad and Tobago 4.4-5.5 2.6-3.3 35-46 28-36 1.1-1.4 Enrichment compulsory
*Calcium fortification optional in all countries
No enrichment program
Source: Guidelines for Food Fortification in Latin America and the Caribbean - Report from PAHO Technical GroupMeeting, PAHO Scientific Publication 240, 1972.

- 47 -
for the control of endemic goiter because of technical and administrative
problems, and quantifiable information is not available on the present cover-
age of the salt iodization program, a simple and effective measure for the
control of this endemic disease.
In a number of countries the enrichment of wheat flour with iron and
B complex vitamins is compulsory while in others it is optional. Projects
for the fortification of sugar with vitamin A are being carried out in other
countries.
3.7 Food Mixtures
The growing development of food industries in the Region is making an
effective contribution to the improvement of storage and distribution systems
and, in this way, more good quality food is becoming available to the popula-
tion. However, the price of the food is still beyond the reach of large
population groups. Furthermore, the coverage of food fortification projects
is still limited.
To solve the serious problem involved in the limited availability and
low consumption of proteins by the most vulnerable groups of the population,
whose economic and social level is low, some countries of the Region are carry-
ing out programs for the production of vegetable mixtures with a high protein
content that are well accepted and low priced (Incaparina, Bienestarina,
Duryea, Acamil). However, the coverage of these programs is still limited.
Chile, Colombia, Guatemala and Mexico have developed low-cost, highly
nutritious food formulas, primarily for infant feeding, and it is hoped that
they will shortly go into large-scale industrial production.
Bolivia, Ecuador and Haiti are also developing three new products,
the production of which will begin shortly.
Table No. 25 shows the situation with respect to the development of
these foods in some countries of the Region, but the information needs to be
completed with up-to-date figures of production, cost, coverage, etc., since
this is another promising program within the framework of technological and
industrial integration.
Special consideration should be given to the marketing of new products,
since earlier experiments in which this component was not properly planned
were unsuccessful.
4. NUTRITION RESEARCH
In the last two decades important studies have been carried out in
the Region on the epidemiological and clinical aspects of nutritional prob-
lems and on effective methods of controlling them (Table No. 26).

- 48 -
4ITable No. 25
HIGHLY NUTRITIONAL NONCONVENTIONAL FOODS
Country I :: Product Production/yearMetric tons
Bolivia MAYSOY (project)
Colombia COLOMBIARINA 120 (1972)BIENESTARINA 100 (1973)
5,000 (1975)
Chile FORTESAN 10,800SUPERCHIL 1,200FORTALIN 1,000NUTRILAC/LACTO-DA 400
Ecuador LECHE AVENA 800 (1975)
4,000 (1976)
Guatemala INCAPARINA 1,600
Haiti ACAMIL (project)
Mexico NUTRINPI
II
I
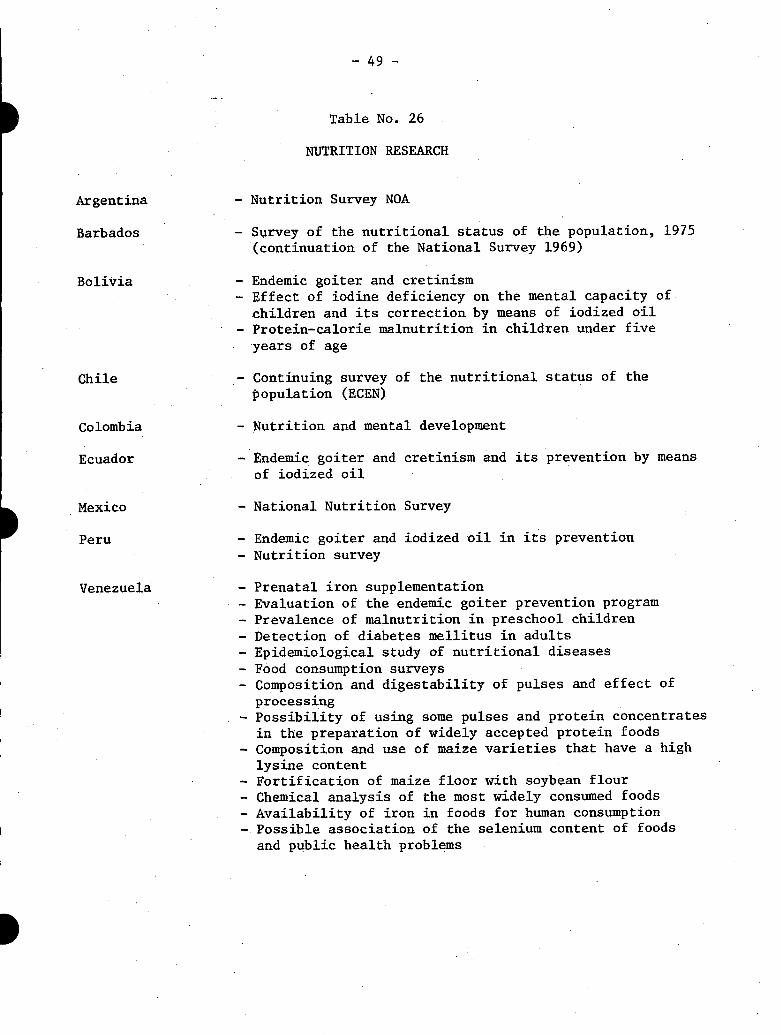
- 49 -
Table No. 26
NUTRITION RESEARCH
- Nutrition Survey NOA
- Survey of the nutritional status of the population, 1975(continuation of the National Survey 1969)
- Endemic goiter and cretinism- Effect of iodine deficiency on the mental capacity of
children and its correction by means of iodized oil- Protein-calorie malnutrition in children under five
years of age
- Continuing survey of the nutritional status of thepopulation (ECEN)
- Nutrition and mental development
- Endemic goiter and cretinism and its prevention by means
of iodized oil
- National Nutrition Survey
- Endemic goiter and iodized oil in its prevention
- Nutrition survey
- Prenatal iron supplementation- Evaluation of the endemic goiter prevention program- Prevalence of malnutrition in preschool children- Detection of diabetes mellitus in adults- Epidemiological study of nutritional diseases
- Food consumption surveys- Composition and digestability of pulses and effect of
processing- Possibility of using some pulses and protein concentrates
in the preparation of widely accepted protein foods
- Composition and use of maize varieties that have a highlysine content
- Fortification of maize floor with soybean flour
- Chemical analysis of the most widely consumed foods- Availability of iron in foods for human consumption- Possible association of the selenium content of foods
and public health problems
Argentina
Barbados
Bolivia
Chile
Colombia
Ecuador
Mexico
Peru
Venezuela

- 50 -
At present a number of countries are conducting research relating toprotein-calorie malnutrition in children under five years of age.
One Caribbean country, with the assistance of CFNI, is making a studyof the effectiveness of nutrition education in rural areas.
With respect to endemic goiter, Bolivia and Ecuador are making studiesof salt iodization and the intramuscular administration of iodized oil andits effect on the control of goiter.
A complete analysis of the effectiveness of the hypovitaminosis A con-trol program, based on the enrichment of sugar with vitamin A, is being con-ducted by INCAP in five countries in the Central American area.
In recent years important studies have been undertaken in five coun-tries of the Region for the purpose of establishing the relations betweenprotein-calorie malnutrition and the mental development of children under15 years of age. As a result of the interest investigations of this typehave awakened, there has been an increased demand in the Region for trainingof Latin American scientists in aspects relating to this subject.
With respect to cardiovascular diseases, diabetes and obesity, verylittle information is available at the country level; consequently few nutri-tion activities relating to the prevention and control of these diseases havebeen incorporated into health programs.
In the field of foodstuffs, important studies are being undertakenin various countries of the Region. These studies deal with the improvementof the protein of some cereals, the development of highly nutritious, low-costvegetable mixtures, and the fortification of basic foods with vitamins, min-erals and proteins.
Mention must also be made of the fact that, according to the foregoingconsideration, there are large gaps in our knowledge about the prevalence ofcertain diseases and of the methods of controlling them, and therefore thisfield of research needs to be strengthened and fostered.
At present, research groups must review their objectives, exchangeexperiences through a continuing flow of scientific information and, in par-ticular, give special attention to the application of scientific and techno-logical knowledge to the solution of food and nutrition problems that arehindering the economic and social development of the Region.
Basically what is required is to focus research on those areas inwhich the findings can be immediately applied to the solution of problems.
'I

- 51 -
In so far as an appropriate balance is achieved between basic andoperational research, nutrition programs can count on elements or inter-ventions that ensure effectiveness and efficiency.
5. FOOD AND NUTRITION POLICIES
Activities to prevent undernourishment and malnutrition and to ensurethe appropriate nutritional status of the population call for the simulta-neous participation of the public and private sectors.
If initiation and operation of the various programs relating to foodand nutrition in Latin America and the Caribbean area are analyzed, it maybe seen that in the past they have not been in line with the development ofpreviously established policies at the national level, nor have they beenaimed at satisfying the nutritional needs of the population.
However, it must be recognized that, in the past decade, a clearawareness has been growing that it is necessary to formulate and execute ineach country a clear-cut national food and nutrition program as the basisfor the necessary coordination of the various sectoral plans relating tothese fields, and that coordinated action makes it possible to deal simul-taneously with the complex factors determining the problem and thus to ob-tain a more comprehensive solution.
Within the general framework of these policies, objectives are es-tablished for the measures the government must take to encourage the pro-duction of foodstuffs; to import or receive in the form of external aid thefoodstuffs indicated by internal conditions; to protect specific populationgroups; to conduct research; to educate consumers in the area of food andnutrition; and to educate and train the human resources necessary for exe-cuting the programs.
Beginning in 1971, some countries in the Andean area, Central Americaand the Caribbean initiated activities with international assistance;1
progress has been made in studying food and nutrition problems, their deter-minants and the resources available for tackling them, with a view to formu-lating and implementing policies that satisfy the nutritional requirementsof the population.
These countries have set up multidisciplinary and intersectoral work-ing groups that have prepared preliminary documents on the subject. As ageneral rule, these groups are attached to or coordinated by the nationalplanning units (Table No. 27).
lInter-agency Project for the Promotion of National Food and NutritionPolicies (PIA/PNAN)

- 52 -
Table No. 27
NATIONAL FOOD AND NUTRITION POLICIES (NFNP) HIImplementation Mechanisms
Work doneCountry Agency responsible Formulation Approval
NFNP NFNP
Transitional committee, Ministry ofHealth (January 1975)
National Institute of Nutrition(30 November 1972)
CONPAN, National Food and NutritionCouncil (November 1974)
Population and Nutrition DivisionNational Planning Department(November 1975)
Yes Approved byNationalEconomic andSocial PolicyCouncil,March 1975
Higher Council for National Foodand Nutrition Policy (proposedestablishment May 1974)
Ministry of Health
Advisory Council on Nutrition(1974-1975)
Yes
Proposed Planning of NationalFood and Nutrition PolicyNational Planning Secretariat(September 1974)
Ministry of Food(August 1975)
St. Lucia
United Statesof America
National Nutrition Committee(1974-1975)
Special Senate Committee on Nutritionand Human Needs(93rd Congress)
Bolivia
Brazil
Chile
Colombia
Ecuador
Guyana
Jamaica
Paraguay
Peru
HI
Yes
Yes
(1974)
EI

- 53 -
Jamaica, Colombia and Costa Rica have formulated policies that arebeing translated into national food and nutrition plans; these emphasize theprotection of the more vulnerable groups of the population.
6. CONCLUSIONS
6.1 As a general rule, the information on the food situation and on thenutritional status of the population is incomplete, out of date, and unre-presentative, which seems to indicate that there are trends that do not ne-cessarily correspond to local conditions in all the countries.
6.2 However, the availability and consumption of calories and protein isobviously less than that recommended in various countries. It can thereforebe stated that there are surely large population groups whose nutritionalstatus is borderline or substandard.
6.3 Protein-calorie malnutrition, nutritional anemias and endemic goitercontinue to be highly prevalent problems in several countries, thereby lower-ing the collective health and welfare levels.
6.4 In some countries the present nutrition structures at the central,intermediate and local levels do not appear to exercise sufficient leader-ship in guiding and channeling resources in the planning, execution andevaluation of food and nutrition programs.
6.5 There are nutrition structures without the necessary program coordina-tion to enable them to act on the basis of common objectives and complement-arity of resources both in the health sector and in the other related sectors.
6.6 Hardly any countries have nutritional surveillance systems for reg-ularly providing the up-to-date information required for the planning,execution and evaluation of programs geared to the actual needs of eachcountry.
6.7 There is a lack of information about the quantity and quality ofhuman resources in food and nutrition and their relation to the presentnutrition needs of each country.
6.8 Centers for the education and training of professional personnel innutrition do not have sufficient teaching, bibliographic or educationalresources.
6.9 Food supplementation and nutrition education programs do not estab-lish priorities in selecting target groups, have limited coverage, and donot include educational activities adequate to existing food problems.

- 54 -
6.10 Food fortification is almost entirely limited to salt iodization, andreaches effective coverage levels in hardly any of the countries and espe*-cially in those in which the problem of endemic goiter is high.
6.11 Despite the fact that valuable studies of non-conventional feedingformulas have been made, few countries have reached the stage of actualproduction or marketing of these products.
6.12 Nutrition research has made praiseworthy progress in understandingthe physiopathological mechanisms of malnutrition and its consequences, butadditional efforts are needed to find feasible solutions that can be appliedin the short term.
6.13 With respect to national food and nutrition policies and plans, theadvances made in some countries will make it possible gradually to use themethods developed and applied throughout the Region.
In this task, national efforts can be supplemented by bilateral andinternational technical assistance.
- /1~~~I

- 55 -
BIBLIOGRAPHY
1. Inter-American Development Bank. Progreso Economico y Social enAmerica Latina, Informe Anual 1972, Washington, D.C.
2. Inter-American Development Bank. "Statistical Profile of LatinAmerica," Washington, D.C. (information pamphlet), 1975.
3. United Nations. "World Food Conference. The World Food Problem.Proposals for National and International Action." Rome, 1974.
4. United Nations, Economic and Social Council (UNICEF). "Prioritiesin Child Nutrition in Developing Countries," New York, 1975.(Doc. E/ICEF/L-1329).
5. Food and Agricultural Organization of the United Nations (FAO). PlanIndicativo Mundial Provisional para el Desarrollo Agricola, Volumen 2,Rome, 1970.
6. Organization of American States (OAS). Situaci6n y Perspectivas Ali-mentarias de America Latina, 1974.
7. Proyecto Interagencial de Promocion de Politicas Nacionales de Alimen-tacion y Nutricion (UNICEF-FAO-OPS/OMS y CEPAL). Primera Conferencia z-Subregional de Pollticas Nacionales de Alimentaci6n y Nutricion, In-forme Final, Lima, 1973.
8. Pan American Health Organization. Participacion de la OPS/OMS en laPromocion, Formulacion y Ejecucion de Politicas Nacionales de Alimen-tacion y Nutricion en Latinoamerica y el Caribe 1965-1974, Washington,D.C., 1975.
9. Pan American Health Organization. Situacion Nutricional y Alimentariaen los Palses del Area Andina. May 1975.
10. Pan American Health Organization. Basic Reference Document, III SpecialMeeting of Ministers of Health. Washington, D.C., 1972.