Embed Size (px)
Citation preview

Technical Guidance on Implementing the Stormwater Runoff Requirements for Federal Projects under Section 438 of the Energy Independence and Security Act
United States Environmental Protection Agency
Office of Water (4503T) Washington, DC 20460
EPA 841-B-09-001 December 2009 www.epa.gov/owow/nps/lid/section438


Section 438 Technical Guidance December 2009
1
Technical Guidance on Implementing the Stormwater Runoff Requirements for Federal Projects under Section 438 of the Energy Independence and Security Act
INTRODUCTION In December 2007, Congress enacted the Energy Independence and Security Act of 2007. Section 438 of that legislation establishes strict stormwater runoff requirements for federal development and redevelopment projects. The provision reads as follows:
“Storm water runoff requirements for federal development projects. The sponsor of any development or redevelopment project involving a Federal facility with a footprint that exceeds 5,000 square feet shall use site planning, design, construction, and maintenance strategies for the property to maintain or restore, to the maximum extent technically feasible, the predevelopment hydrology of the property with regard to the temperature, rate, volume, and duration of flow.”
The intent of Section 438 of the Energy Independence and Security Act of 2007 (EISA) is to require federal agencies to develop and redevelop applicable facilities in a manner that maintains or restores stormwater runoff to the maximum extent technically feasible. Until recently, stormwater programs established to address water quality objectives have been designed to control traditional pollutants that are commonly associated with municipal and industrial discharges, e.g., nutrients, sediment, and metals. Increases in runoff volume and peak discharge rates have been regulated through state and local flood control programs. Although these programs have merit, knowledge accumulated during the past 20 years has led stormwater experts to the conclusion that conventional approaches to control runoff are not fully adequate to protect the nation’s water resources (National Research Council, 2008). Implementation of Section 438 of the EISA can be achieved through the use of the green infrastructure/low impact development (GI/LID) infrastructure tools described in this guidance. The intention of the statute is to maintain or restore the pre-development site hydrology during the development or redevelopment process. To be more specific, this requirement is intended to ensure that receiving waters are not negatively impacted by changes in runoff temperature, volumes, durations and rates resulting from federal projects. It should also be noted that a performance-based approach was selected in lieu of a prescriptive requirement in order to provide site designers maximum flexibility in selecting control practices appropriate for the site. Section 14 of the Executive Order 13514, Federal Leadership in Environmental, Energy, and Economic Performance On October 5, 2009, President Barack Obama signed Executive Order 13514, “Federal Leadership in Environmental, Energy, and Economic Performance.” Section 14 of the Executive Order provides:
Stormwater Guidance for Federal Facilities. Within 60 days of the date of this order, the Environmental Protection Agency, in coordination with other Federal agencies as

Section 438 Technical Guidance December 2009
2
appropriate, shall issue guidance on the implementation of section 438 of the Energy Independence and Security Act of 2007 (42 U.S.C. 17094).
This provision contains two significant elements. First, for the first time, EPA is formally assigned the responsibility to write and issue the Section 438 guidance, in coordination with other federal agencies. Second, it establishes a deadline for EPA to do so by December 5, 2009. Purpose and Organization of this Guidance The purpose of this document is to provide technical guidance and background information to assist federal agencies in implementing EISA Section 438. Each agency or department is responsible for ensuring compliance with EISA Section 438. The document contains guidance on how compliance with Section 438 can be achieved, measured and evaluated. In addition, information detailing the rationale for the stormwater management approach contained herein has been included. This document is intended solely as guidance. This document is not a regulation nor does it substitute for statutory provisions or regulations. This guidance does not impose any legally binding requirements on federal agencies and does not confer any legal rights or impose legal obligations upon any member of the public. This document does not create a cause of action against the EPA, other federal agencies, or the United States. The following information is presented within this document: Part I: Implementation Framework
A. Background B. Benefits and outcomes of the new stormwater performance requirements C. Applicability and definitions D. Tools to implement the requirements of Section 438 E. Calculating the 95th percentile rainfall event
Part II: Case Studies on Capturing the 95th Percentile Storm Using Onsite Management Practices Case studies representing typical federal installations have been included. The case studies were selected to demonstrate the feasibility of providing adequate stormwater control for a range of site conditions and building designs. To the maximum extent technically feasible, each case study includes a description of a method that can be used to determine the design objectives of the project based on retaining the 95th percentile storm. Examples of onsite technologies and practices have also been provided. The case studies are intended to provide examples of modeling procedures that can be used to quantify treatment system performance and processes for assessing sites and determining appropriate control techniques to the maximum extent technically feasible.

Section 438 Technical Guidance December 2009
3
Part I: Implementation Framework
A. BACKGROUND This section contains background on the causes and consequences of stormwater discharges, solutions that can be used to address the causes and consequences of stormwater discharges and how to implement those solutions to comply with Section 438 of EISA. Alterations to Natural Hydrology and the Impact on Stormwater Runoff In the natural, undisturbed environment rain that falls is quickly absorbed by trees, other vegetation, and the ground. Most rainfall that is not intercepted by leaves infiltrates into the ground or is returned to the atmosphere by the process of evapotranspiration. Very little rainfall becomes stormwater runoff in permeable soil, and runoff generally only occurs with larger precipitation events. Traditional development practices cover large areas of the ground with impervious surfaces such as roads, driveways, sidewalks, and buildings. Under developed conditions runoff occurs even during small precipitation events that would normally be absorbed by the soil and vegetation. The collective force of the increased runoff scours streambeds, erodes stream banks, and causes large quantities of sediment and other entrained pollutants to enter the water body each time it rains (Shaver, et al., 2007; Booth testimony, 2008). As watersheds are developed and impervious surfaces increase in area, the hydrology of the watersheds fundamentally changes over time which results in degraded aquatic ecosystems. In recognition of these problems, stormwater managers employed extended detention approaches to mitigate the impacts of increased peak runoff rates. However, wet ponds and similar practices are not fully adequate to protect downstream hydrology because of the following inherent limitations of these conventional practices (National Research Council, 2008; Shaver, et al., 2007): Poor peak control for small, frequently-occurring storms; Negligible volume reduction; and Increased duration of peak flow.
Detention storage targets relatively large, infrequent storms, such as the two and 10-year/24-hour storms for peak flow rate control. As a result of this design limitation, flow rates from smaller, frequently-occurring storms typically exceed those that existed onsite before land development occurred and these increases in runoff volumes and velocities typically result in flows erosive to stream channel stability (Shaver, et al., 2007). Section 438 is intended to address the inadequacies of the historical detention approach to managing stormwater and promote more sustainable practices that have been selected to maintain or restore predevelopment site hydrology. A 2008 National Research Council report on urban stormwater confirmed that current stormwater control efforts are not fully adequate. Three of the report’s findings on stormwater management approaches are particularly relevant (National Research Council, 2008).

Section 438 Technical Guidance December 2009
4
1. Individual controls on stormwater discharges are inadequate as the sole solution to stormwater in urban watersheds;
2. Stormwater control measures such as product substitution, better site design, downspout disconnection, conservation of natural areas, and watershed and land-use planning can dramatically reduce the volume of runoff and pollutant load from new development; and
3. Stormwater control measures that harvest, infiltrate, and evapotranspire stormwater are critical to reducing the volume and pollutant loading of small storms.
Pre-development Hydrology. Courtesy of C. May, University of Washington.
Post-Development Hydrology. Courtesy of C. May, University of Washington.
Figure 1. Pre-Development and Post-Development Hydrology. (USDA). Figure 1 contains two sets of diagrams depicting the water balances at undeveloped and developed sites. Runoff patterns will vary based on factors such as geographic location, local meteorological conditions, vegetative cover and soils. The first set of figures represents conditions in the Pacific Northwest where storms have a long duration and low intensity, i.e., the volume of rain in an individual storm is small. The second set of figures from the U.S. Department of Agriculture represents a more generalized set of conditions, but was included to illustrate that heavily urbanized areas typically cause large increases in runoff.

Section 438 Technical Guidance December 2009
5
Land cover changes that result from site development include increased imperviousness, soil compaction, loss of vegetation, and loss of natural drainage patterns, which result in increased runoff volumes and peak runoff rates. The cumulative impacts of the land cover changes result in alterations of the natural hydrology of a site, which disrupts the natural water balance and changes water flow paths. The consequences of these impacts include:
1. Increased volume of runoff. With decreased area for infiltration and evapotranspiration due to development, a greater amount of rainfall is converted to overland runoff which results in larger stormwater discharges.
2. Increased peak flow of runoff. Increased impervious surface area and higher connectivity of impervious surfaces and stormwater conveyance systems increase the flow rate of stormwater discharges and increase the energy and velocity of discharges into the stream channel.
3. Increased duration of discharge. Detention systems generate greater flow volumes and rates. These prolonged higher discharge rates can undermine the stability of the stream channel and induce erosion, channel incision and bank cutting.
4. Increased pollutant loadings. Impervious areas are a collection site for pollutants. When rainfall occurs these pollutants are mobilized and transported directly to stormwater conveyances and receiving streams via these impervious surfaces.
5. Increased temperature of runoff. Impervious surfaces absorb and store heat and transfer it to stormwater runoff. Higher runoff temperatures may have deleterious effects on receiving streams. Detention basins magnify this problem by trapping and discharging runoff that is heated by solar radiation (Galli, 1991; Schueler and Helfrich, 1988).
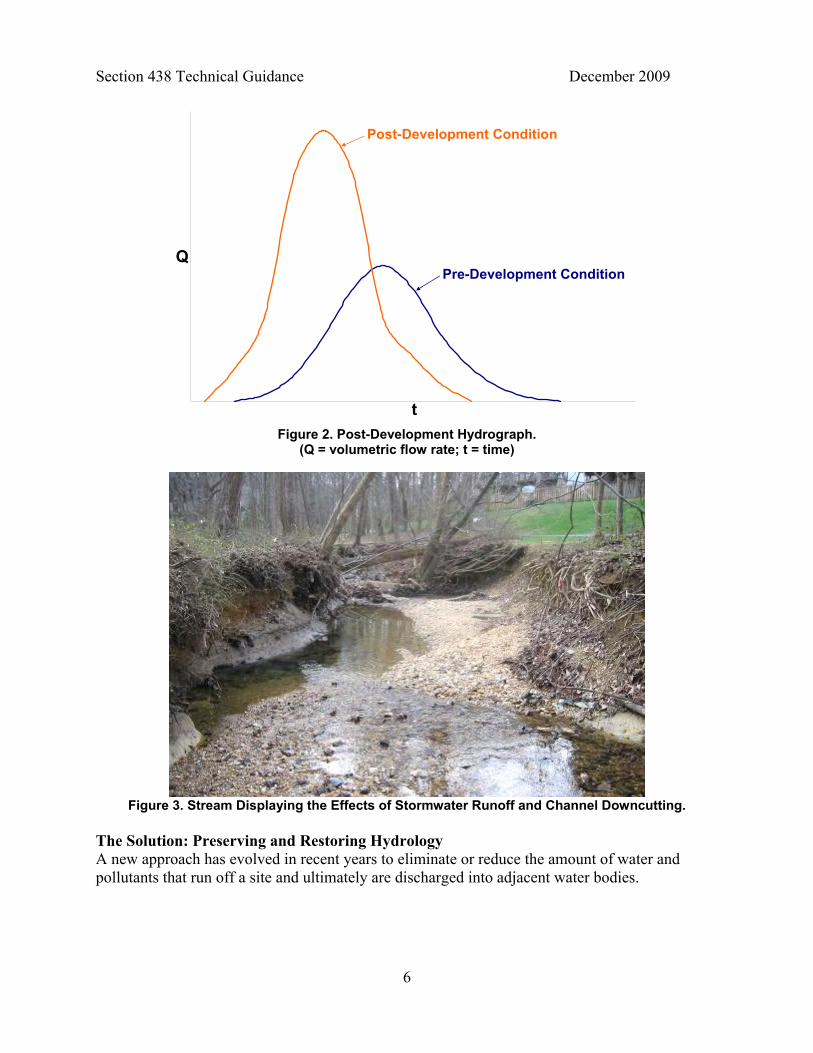
The resulting increases in volume, peak flow, and duration are illustrated in the hydrograph in Figure 2, which is a representation of a site’s stormwater discharge with respect to time. The hydrograph illustrates the impacts of development on runoff volume and timing of the runoff. Individual points on the curve represent the rate of stormwater discharge at a given time. The graph illustrates that development and corresponding changes in land cover result in greater discharge rates, greater volumes, and shorter discharge periods. In a natural condition, runoff rates are slower than those on developed sites and the discharges occur over a longer time period. The predevelopment peak discharge rate is also much lower than the post-development peak discharge rate due to attenuation and absorption by soils and vegetation. In the post-development condition there is generally a much shorter time before runoff begins because of increased impervious surface area, a higher degree of connectivity of these areas and the loss of soils and vegetative cover that slow or reduce runoff.
Section 438 Technical Guidance December 2009
6
t
Q
Post-Development Condition
Pre-Development Condition
Figure 2. Post-Development Hydrograph.
(Q = volumetric flow rate; t = time)
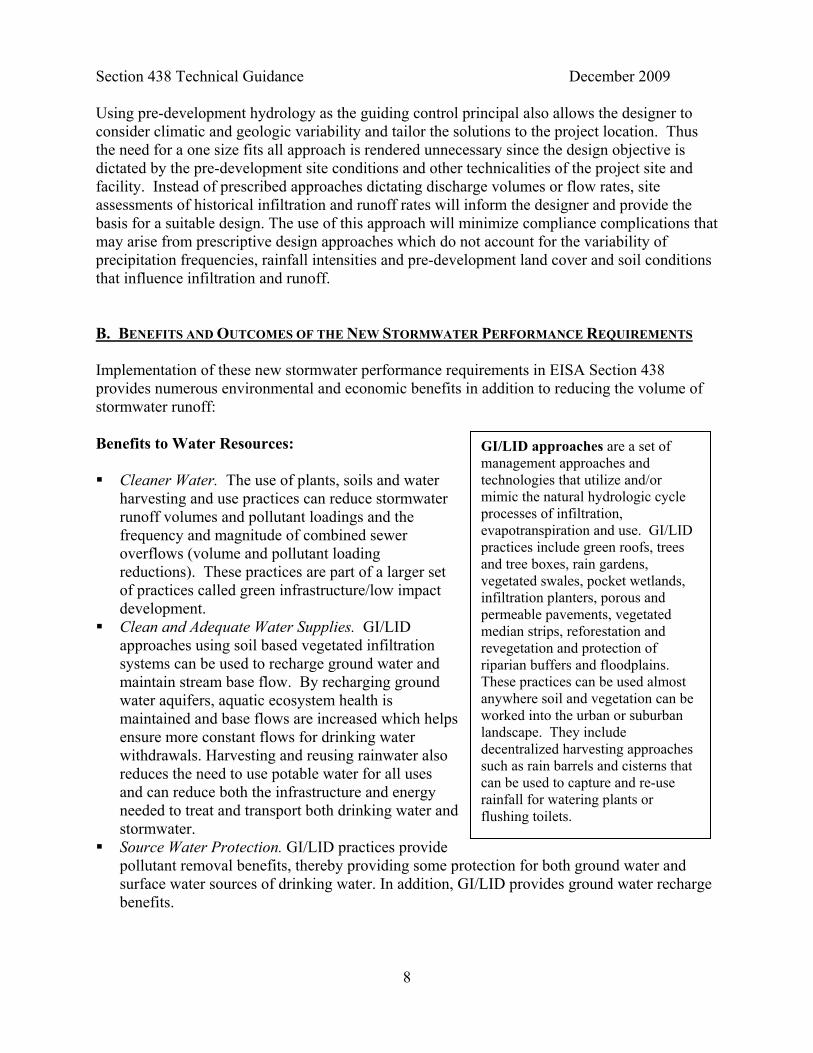
Figure 3. Stream Displaying the Effects of Stormwater Runoff and Channel Downcutting.
The Solution: Preserving and Restoring Hydrology A new approach has evolved in recent years to eliminate or reduce the amount of water and pollutants that run off a site and ultimately are discharged into adjacent water bodies.

Section 438 Technical Guidance December 2009
7
Figure 4. Parking lot bioswale and permeable pavers in Chicago.
The fundamental principle is to employ systems and practices that use or mimic natural processes to: 1) infiltrate and recharge, 2) evapotranspire, and/or 3) harvest and use precipitation near to where it falls to earth. GI/LID practices include a wide variety of practices that utilize these mechanisms. These practices can be used at the site, neighborhood and watershed/regional scales. In this document the focus is on site-level practices, which is most consistent with the terms used in Section 438: “project,” “facility,” and “property.” Although these performance requirements apply at the project site-level, flexibility exists to utilize nearby areas or areas directly adjacent to the facility to manage the runoff, i.e., evapotranspirate, infiltrate or harvest and use. Where justifiable, it also may be appropriate to evapotranspirate, infiltrate or harvest and use an equivalent or greater amount of runoff offsite as long as the runoff is discharged or used in the same receiving subwatershed or watershed. The purpose of EISA Section 438 is to replicate the pre-development hydrology to protect and preserve both the water resources onsite and those downstream. For example, if prior to development, twenty five (25) percent of the annual rainfall runs directly into the stream and the remainder infiltrates into the ground or is evapotranspired into the air, then the post-development goal should be to limit runoff to twenty five (25) percent of the annual precipitation while maintaining the correct aquifer recharge rate. This has the benefit, in most cases, of delivering water to the stream at approximately the same rate, volume, duration and temperature as the stream had naturally evolved to receive prior to development. The result will be to eliminate or minimize the erosion of streambeds and streambanks, significantly reduce the delivery of many
pollutants to water bodies, and retain historical instream temperatures. Restoring or maintaining pre-development hydrology has emerged as a control approach for several reasons. Most importantly, this approach is intended to directly address the root cause of impairment. Current control approaches have been selected in an attempt to control the symptoms (peak flow, and excess pollutants), but this strategy is not fully adequate because of the scale of the problem, the cumulative impacts of multiple developments and the need to manage both site and watershed level impacts. With current approaches, it is also difficult to adequately protect and improve water quality because the measures employed are not addressing the main problem which is a hydrologic imbalance. Designing facilities based on the goal of maintaining or restoring pre-development hydrology provides a site specific basis and an objective methodology with which to determine appropriate practices to protect the receiving environment.
Section 438 Technical Guidance December 2009
8
Using pre-development hydrology as the guiding control principal also allows the designer to consider climatic and geologic variability and tailor the solutions to the project location. Thus the need for a one size fits all approach is rendered unnecessary since the design objective is dictated by the pre-development site conditions and other technicalities of the project site and facility. Instead of prescribed approaches dictating discharge volumes or flow rates, site assessments of historical infiltration and runoff rates will inform the designer and provide the basis for a suitable design. The use of this approach will minimize compliance complications that may arise from prescriptive design approaches which do not account for the variability of precipitation frequencies, rainfall intensities and pre-development land cover and soil conditions that influence infiltration and runoff. B. BENEFITS AND OUTCOMES OF THE NEW STORMWATER PERFORMANCE REQUIREMENTS Implementation of these new stormwater performance requirements in EISA Section 438 provides numerous environmental and economic benefits in addition to reducing the volume of stormwater runoff: Benefits to Water Resources: Cleaner Water. The use of plants, soils and water
harvesting and use practices can reduce stormwater runoff volumes and pollutant loadings and the frequency and magnitude of combined sewer overflows (volume and pollutant loading reductions). These practices are part of a larger set of practices called green infrastructure/low impact development.
Clean and Adequate Water Supplies. GI/LID approaches using soil based vegetated infiltration systems can be used to recharge ground water and maintain stream base flow. By recharging ground water aquifers, aquatic ecosystem health is maintained and base flows are increased which helps ensure more constant flows for drinking water withdrawals. Harvesting and reusing rainwater also reduces the need to use potable water for all uses and can reduce both the infrastructure and energy needed to treat and transport both drinking water and stormwater.
Source Water Protection. GI/LID practices provide pollutant removal benefits, thereby providing some protection for both ground water and surface water sources of drinking water. In addition, GI/LID provides ground water recharge benefits.
GI/LID approaches are a set of management approaches and technologies that utilize and/or mimic the natural hydrologic cycle processes of infiltration, evapotranspiration and use. GI/LID practices include green roofs, trees and tree boxes, rain gardens, vegetated swales, pocket wetlands, infiltration planters, porous and permeable pavements, vegetated median strips, reforestation and revegetation and protection of riparian buffers and floodplains. These practices can be used almost anywhere soil and vegetation can be worked into the urban or suburban landscape. They include decentralized harvesting approaches such as rain barrels and cisterns that can be used to capture and re-use rainfall for watering plants or flushing toilets.

Section 438 Technical Guidance December 2009
9
Other Social and Environmental Benefits: Cleaner Air. Trees and vegetation improve air quality by filtering many airborne pollutants
and can help reduce the amount of respiratory illness (Vingarzan and Taylor, 2003). Reduced Urban Temperatures. Summer city temperatures can average 10ºF higher than
nearby suburban temperatures (Casey Trees, 2007). High temperatures are also linked to higher ground level ozone concentrations. Vegetation creates shade, reduces the amount of heat absorbing materials and emits water vapor – all of which cool hot air (Grant, et al., 2003). Reductions in impervious surface and the use of light colored pervious surfaces (e.g., permeable concrete) also can mitigate urban temperatures.
Moderate the Impacts of Climate Change. Climate change impacts and effects vary regionally, but GI/LID techniques can provide adaptation benefits for a wide array of circumstances. They can be used to conserve, harvest and use water, to recharge ground waters and to reduce surface water discharges that could contribute to flooding. In addition, there are mitigation benefits such as reduced energy demand and carbon sequestration by vegetation.
Increased Energy Efficiency. Green space helps lower ambient temperatures and, when incorporated on and around buildings, helps shade and insulate buildings from wide temperature swings, decreasing the energy needed for heating and cooling. Diverting stormwater from wastewater collection, conveyance and treatment systems can reduce the amount of energy needed to pump and treat the water. Energy efficiency not only reduces costs, but also reduces generation of greenhouse gases.
Community Benefits. Trees and plants improve urban aesthetics and community livability by providing recreational and wildlife areas. Studies show that property values are higher when trees and other vegetation are present. Increased green space also has public health benefits and has been shown to reduce crime and the associated stresses of urban living.
C. APPLICABILITY AND DEFINITIONS Applicability 1. Who is a “Sponsor” of a project? Section 438 applies to the “sponsor of any development or redevelopment project involving a Federal facility . . .” Section 438 requires that the “sponsor . . . shall use . . . strategies for the property to maintain or restore . . . the predevelopment hydrology. . .” The “sponsor” should
Figure 5. Rain water cistern.

Section 438 Technical Guidance December 2009
10
generally be regarded as the federal department or agency that owns, operates, occupies or is the primary user of the facility and has initiated the development or redevelopment project. If the federal agency hires another entity to perform activities such as site construction or maintenance, the agency should nonetheless be regarded as the sponsor and be responsible to assure compliance with the requirements of Section 438. The agency sponsor is free to contract out various duties and responsibilities that are associated with achieving compliance. 2. What is a “Federal facility”? Section 438 provides that its requirements apply to the “sponsor of any development or redevelopment project involving a Federal facility . . .” Section 401(8) of EISA states: “The term `Federal facility' means any building that is constructed, renovated, leased, or purchased in part or in whole for use by the Federal Government.” 3. What is a “footprint”? Section 438 applies to a federal facility “with a footprint that exceeds 5,000 square feet.” For the purposes of this guidance, any project involving a federal facility that disturbs 5,000 square feet or more of ground area is covered by this guidance. Existing facilities that have an overall footprint of 5,000 square feet or greater that disturb less than 5,000 square feet of land area as part of any single development or redevelopment project are not subject to Section 438 requirements. Consistent with the purpose of Section 438 to preserve or restore pre-development hydrology, the term “footprint” includes all land areas that are disturbed as part of the project. 4. What is “the property”? Section 438 provides that the project sponsor “shall use site planning, design, construction, and maintenance strategies for the property to maintain or restore, to the maximum extent technically feasible, the predevelopment hydrology of the property.” This clause has been interpreted to mean that the land surrounding the project site is available to implement the appropriate GI/LID practices where optimal. Although the performance requirements of EISA Section 438 apply only to the project footprint, the flexibility exists to utilize the entire federal property in implementing the stormwater strategies for the project. Definitions 95th percentile rainfall event. The 95th percentile rainfall event represents a precipitation amount which 95 percent of all rainfall events for the period of record do not exceed. In more technical terms, the 95th percentile rainfall event is defined as the measured precipitation depth accumulated over a 24-hour period for the period of record that ranks as the 95th percentile rainfall depth based on the range of all daily event occurrences during this period. The 24-hour period is typically defined as 12:00:00 am to 11:59:59 pm. In general, at least a 20-30 year period of rainfall record is recommended for such an analysis. This raw data is readily

Section 438 Technical Guidance December 2009
11
available and collected by most airports across the county. Small rainfall events that are 0.1 of an inch or less are excluded from the percentile analysis because this rainfall generally does not result in any measureable runoff due to absorption, interception and evaporation by permeable, impermeable and vegetated surfaces. Many stormwater modelers and hydrologists typically exclude rainfall events that are 0.1 inch or less from calculations of rainfall events of any storm from their modeling analyses of rainfall event frequencies. See, for example, the Center for Watershed Protection's Urban Subwatershed Restoration Manual 3 (available at www.cwp.org). Federal facility. The term “federal facility” means any buildings that are constructed, renovated, leased, or purchased in part or in whole for use by the federal government as defined in section 401(8) of the Energy Independence and Security Act. Development or re-development. For the purposes of this provision this term applies to any action that results in the alteration of the landscape during construction of buildings or other infrastructure such as parking lots, roads, etc, (e.g., grading, removal of vegetation, soil compaction, etc.) such that the changes affect runoff volumes, rates, temperature, and duration of flow. Examples of projects that would fall under “re-development” include structures or other infrastructure that are being reconstructed or replaced and the landscape is altered. Typical patching or resurfacing of parking lots or other travel areas would not fall under this requirement. D. TOOLS TO IMPLEMENT THE REQUIREMENTS OF SECTION 438 Section 438 of the Energy Independence and Security Act of 2007 reads as follows:
Section 438. Storm water runoff requirements for federal development projects. The sponsor of any development or redevelopment project involving a Federal facility with a footprint that exceeds 5,000 square feet shall use site planning, design, construction, and maintenance strategies for the property to maintain or restore, to the maximum extent technically feasible, the predevelopment hydrology of the property with regard to the temperature, rate, volume, and duration of flow.
The intention of EISA Section 438 is to preserve or restore the hydrology of the site during the development or redevelopment process. To be more specific, this requirement is intended to ensure that aquatic biota, stream channel stability, and historical aquifer recharge rates of receiving waters are not negatively impacted by changes in runoff temperature, volumes, durations and rates resulting from federal projects. A performance based approach was selected in lieu of a prescriptive requirement in order to provide site designers maximum flexibility in selecting control practices appropriate for the site. To meet these performance objectives, technically feasible stormwater control practices that are effective in reducing the volume of stormwater discharge should be used. To implement EISA Section 438, this guidance recommends that the federal facility use all known, available and reasonable methods of stormwater retention and/or use to the maximum extent technically feasible (METF). Tools to implement the requirements of Section 438 are described below and illustrated in Figure 8.

Section 438 Technical Guidance December 2009
12
Establishing Section 438 Performance Design Objectives Described below are options site designers can use to comply with Section 438. There may be situations where Option 1 (retaining the 95th percentile rainfall event) is not protective enough to maintain or restore the predevelopment hydrology of the project (for example, in some headwater streams). In these cases, Option 2 (site-specific hydrologic analysis) could be used to determine the types of stormwater practices necessary to preserve predevelopment runoff conditions. Option 2 could also be used if predevelopment runoff conditions can be maintained by retaining less than the 95th percentile rainfall event. Because a performance based approach was selected in lieu of a prescriptive requirement in order to provide site designers maximum flexibility in selecting control practices appropriate for the site, Option 2 was provided in recognition that there are established methodologies that can be utilized to estimate the volume of infiltration and evapotranspiration based on site-specific hydrology and thus establish the predevelopment hydrology performance design objectives.
One approach to establishing the performance design objectives is to design, construct, and maintain stormwater management practices that manage rainfall onsite, and prevent the off-site discharge of the precipitation from all rainfall events less than or equal to the 95th percentile rainfall event to the maximum extent technically feasible (METF). This objective should be accomplished by the use of practices that infiltrate, evapotranspire and/or harvest and use rainwater. The 95th percentile rainfall event is the event whose precipitation total is greater than or equal to 95 percent of all storm events over a given period of record. For example, to determine what the 95th percentile storm event is in a specific location, all 24 hour storms that have recorded values over a 30 year period would be tabulated and a 95th percentile storm would be determined from this record, i.e., 5% of the storms would be greater than the number determined to be the 95th percentile storm. Thus the 95th percentile storm would be represented by a number such as 1.5 inches, and this would be the design storm (example 95th percentile storm events for selected cities are presented in Table 1). The designer would then select a system of practices, to the METF, that infiltrate, evapotranspire or harvest and use this volume multiplied by the total area of the facility/project footprint. Methods and data used to estimate the 95th percentile event are discussed in Part II of this document. For the purposes of this guidance, retaining all storms up to and including the 95th percentile storm event is analogous to maintaining or restoring the pre-development hydrology with respect to the volume, flow rate, duration and temperature of the runoff for most sites. This 95th percentile approach was identified and recommended because this storm size represents the volume that appears to best represent the volume that is fully infiltrated in a natural condition and thus should be managed onsite to restore and maintain this pre-development hydrology for duration, rate and volume of stormwater flows. In general, only large storms generate significant runoff. In addition, this approach was identified because it employs natural treatment and flow attenuation methods that are presumed to have existed on the site before construction of infrastructure (e.g., building, roads, parking lots, driveways,) and is intended to infiltrate or evapotranspirate the full volume of the 95th percentile storm. Because this approach necessitates the use of practices that generally preclude extended detention, it will also typically address the
Option 1: Retain the 95th Percentile Rainfall Event

Section 438 Technical Guidance December 2009
13
Figure 6. Bioretention facility in Oregon.
issue of maintaining predevelopment temperatures. However, in cases where there are discharges to cool water streams or other sensitive receiving waters, additional strategies may be needed to ensure that stormwater discharges do not result in greater thermal impacts than would occur in pre-development conditions (Schueler and Helfrich, 1988). Where technically feasible, the goal of Option 1 is that one hundred percent (100%) of the volume of water from storms less than or equal to the 95th percentile event over the footprint of the project should not be discharged to surface waters. In some cases, runoff can be harvested and used and ultimately may be discharged to surface waters or a sanitary treatment system; such direct or indirect discharges must be authorized or allowed by the regulatory authority. For example, if runoff is captured for nonpotable uses such as toilet flushing or other uses that are not irrigation related, these waters potentially could be discharged into the sanitary sewer system. Preferred mechanisms for retaining discharges from storms greater than the 95th percentile event are through overflow or diversion for the volume that exceeds the 95th percentile amount. Because standard underdrains typically discharge from smaller storms as well, underdrain designs, if employed, should ensure adequate retention capacity for the 95th percentile event volume. For structures such as roofs and paved surfaces that can increase the temperature of stormwater runoff, materials that minimize temperature increases (e.g., concrete vs. asphalt; vegetated roofs) should be considered and used as appropriate. Retaining 100 percent of all rainfall events equal to or less than the 95th percentile rainfall event was identified as Option 1 because small, frequently-occurring storms account for a large proportion of the annual precipitation volume, and the runoff from those storm events also significantly alters the discharge frequency, rate and temperature of the runoff. The runoff produced by these small storms and the initial portion of larger storms has a strong negative cumulative impact on receiving water hydrology and water quality. In areas that have been developed, runoff is generated from almost all storms, both small and large, due to the impervious surfaces associated with development and the loss of soils and vegetation. In contrast, natural or undeveloped areas discharge little or no runoff from small storms because the rain is absorbed by the landscape and vegetation. Studies have shown that increases in runoff event frequency, volume and rate can be diminished or eliminated through the use of GI/LID designs and practices, which infiltrate, evapotranspire and capture and use stormwater.

Section 438 Technical Guidance December 2009
14
Option 1 was identified because it is a simplified approach to meet the intent of Section 438 in contrast to Option 2 which requires the designer to conduct a hydrologic analysis of the site based on site-specific conditions.
Table 1. Example 95th Percentile Storm Events for Select U.S. Cities (adapted from Hirschman and Kosco, 2008).
City
95th Percentile Event Rainfall
Total (in) City
95th Percentile Event Rainfall
Total (in)
Atlanta, GA 1.8 Kansas City, MO 1.7
Baltimore, MD 1.6 Knoxville, TN 1.5
Boston, MA 1.5 Louisville, KY 1.5
Buffalo, NY 1.1 Minneapolis, MN 1.4
Burlington, VT 1.1 New York, NY 1.7
Charleston, WV 1.2 Salt Lake City, UT 0.8
Coeur D’Alene, ID 0.7 Phoenix, AZ 1.0
Cincinnati, OH 1.5 Portland, OR 1.0
Columbus, OH 1.3 Seattle, WA 1.6
Concord, NH 1.3 Washington, DC 1.7
Denver, CO 1.1
0.0
1.0
2.0
3.0
4.0
5.0
6.0
7.0
0% 10% 20% 30% 40% 50% 60% 70% 80% 90% 100%
Percentile
Rai
nfa
ll D
epth
(in
ches
)
95%
Figure 7. Rainfall Frequency Spectrum showing the 95th percentile rainfall event for Portland, OR (~1.0 inches)

Section 438 Technical Guidance December 2009
15
Calculating the 95th Percentile Rainfall Event Section E of this guidance contains information on how to calculate the 95th percentile rainfall event for a specific area. A long-term record of daily rainfall amounts (ideally, at least 30 years) is needed to calculate the 95th percentile rainfall. Designers opting to use Option 1 need to do the following: 1) calculate or verify the precipitation amount from the 95th percentile storm event (this number
would be typically expressed in inches, e.g., 1.5”, and 2) employ onsite stormwater management controls to the METF that infiltrate, evapotranspire
or harvest and use the appropriate design volume. The 95th percentile event can be calculated by using the following procedures below (summarized from Hirschman and Kosco, 2008, Managing Stormwater in Your Community: A Guide for Building an Effective Post-Construction Program, Center for Watershed Protection):
Obtain a long-term rainfall record from a nearby weather station (daily precipitation is fine, but try to obtain at least 30 years of daily record). Long-term rainfall records can be obtained from many sources, including NOAA at http://cdo.ncdc.noaa.gov/pls/plclimprod/poemain.accessrouter?datasetabbv=SOD&countryabbv=&georegionabbv=.
Remove data for small rainfall events that are 0.1 inch or less and snowfall events that do not immediately melt from the data set. These events should be deleted since they do not typically cause runoff and could potentially cause the analyses of the 95th percentile storm runoff volume to be inaccurate.
Using a spreadsheet or simple statistical package, sort the rainfall events from highest to lowest. In the next column, calculate the percentage of rainfall events that are less than each ranked event (event number/total number of events). For example, if there were 1,000 rainfall events and the highest rainfall event was a 4” event, then 999 events (or a percentile of 999/1000, or 99.9%) are less than the 4” rainfall event.
Use the rainfall event at 95% as the 95th percentile storm event.
Another approach to establishing the performance design objective is to design, construct, and maintain stormwater management practices that preserve the pre-development runoff conditions following construction. Option 2 allows the designer to conduct a site-specific hydrologic analysis to determine the pre-development runoff conditions instead of using the estimated volume approach of Option 1. Under Option 2, the pre-development hydrology would be determined based on site-specific conditions and local meteorology by using continuous simulation modeling techniques, published data, studies, or other established tools. If the designer elects to use Option 2, the designer would then identify the pre-development condition of the site and quantify the post-development runoff volume and peak flow discharges that are equivalent to pre-development conditions. The post-construction rate, volume, duration and
Option 2: Site-Specific Hydrologic Analysis

Section 438 Technical Guidance December 2009
16
temperature of runoff should not exceed the pre-development rates and the predevelopment hydrology should be replicated through site design and other appropriate practices to the maximum extent technically feasible. These goals should be accomplished through the use of infiltration, evapotranspiration, and/or rainwater harvesting and use. Defensible and consistent hydrological assessment tools should be used and documented. Additional discussions of appropriate methodologies to use in assessing site hydrology have been included in the technical sections of this document. See, for example, the discussion of spreadsheet versions or curve numbers based on the Natural Resource Conservation Service Technical Release 55 (TR-55) Method in Appendix A of this document. Development The pre-development hydrologic condition of the site is the combination of runoff, infiltration and evapotranspiration rates and volumes that typically existed on the facility site before "development" on a greenfields site (meaning any construction of infrastructure on undeveloped land such as meadows or forests). In practice, determining the pre-development hydrology of a given site can be difficult if there is no suitable reference site. As a result, reference conditions for typical land cover types in the locality often are used to approximate what fraction of the precipitation ran off, soaked into the ground or was evaporated from the landscape. The use of reference conditions can be problematic if suitable data are not available or unique site conditions exist that do not fit within a typical land use cover type for the area, e.g., meadow or forest. In cases where suitable data from comparable conditions cannot be found or is otherwise inadequate to be used in conducting an Option 2 analysis for the specific area being considered for development or redevelopment, the project sponsor should use the Option 1 analytical framework. Re-development For re-development sites, existing site conditions and uses of the site can influence the amount of runoff that can be managed on site through infiltration, evapotransporation and harvest and use and thus the performance design objective. In these cases the design process in Figure 8 and Scenario 9 illustrate the decision processes that can be used. In the context of some re-development projects, fully restoring predevelopment hydrology can be difficult to achieve and Congress recognized this potential difficulty by including the METF language in the statute. In these cases, Congressional intent can be best carried out by using a systematic METF analysis to determine what practices can be implemented at the site to maintain or store the hydrologic condition of the site. Scenarios 1-8 provide examples of METF analyses that demonstrate that pre-development hydrology can be achieved. Scenario 9 provides an example of an METF analysis that demonstrates that pre-development hydrology cannot be fully achieved and illustrates the extent to which pre-development hydrology can be restored. Note: It should also be emphasized that the performance based approach in Option 1 is intended to be a surrogate for determining the pre-development reference condition and this standard is intended to be used in cases where it is more practical, cost effective, and/or expeditious than Option 1, or where it is difficult or infeasible to identify the relevant reference conditions for the site.

Section 438 Technical Guidance December 2009
17
Determination of Maximum Extent Technically Feasible Compliance with Section 438 requires that stormwater management measures are implemented to the maximum extent technically feasible (METF) to maintain or restore the pre-development hydrology conditions specifically with respect to temperature, rate, volume, and duration of flow. Performance or design goals based on the pre-development hydrology can be established by using options such as the following: Retention of the 95th percentile rainfall event (Option 1), or through a site-specific hydrologic analysis that estimates the volume of infiltration, evapotranspiration or onsite stormwater harvesting and use based on site-specific hydrologic conditions (Option 2). Technical Infeasibility For projects where technical infeasibility exists, the federal agency or department sponsoring the project should document and quantify that stormwater strategies, such as infiltration, evapotranspiration, and harvesting and use have been used to the METF, and that full employment of these types of controls are infeasible due to site constraints. Some western states place restrictions on harvesting and use due to water rights, however, these requirements do not necessarily preclude the sponsor of the project from implementing strategies such as infiltration and evapotranspiration. Documentation of technical infeasibility should include, but may not be limited to, engineering calculations, geologic reports, hydrologic analyses, and site maps. A determination that the performance design goals cannot be met on site should include analyses that rule out the use of an adequate combination of infiltration, evapotranspiration, and use measures. Examples of where site conditions may prevent the full employment of appropriate management techniques to the METF include a combination of: The conditions on the site preclude the use of infiltration practices due to the presence of
shallow bedrock, contaminated soils, near surface ground water or other factors such as underground facilities or utilities.
The design of the site precludes the use of soil amendments, plantings of vegetation or other designs that can be used to infiltrate and evapotranspirate runoff.
Water harvesting and use are not practical or possible because the volume of water used for irrigation, toilet flushing, industrial make-up water, wash-waters, etc. is not significant enough to warrant the design and use of water harvesting and use systems.
Modifications to an existing building to manage stormwater are not feasible due to structural or plumbing constraints or other factors as identified by the facility owner/operator.
Small project sites where the lot is too small to accommodate infiltration practices adequately sized to infiltrate the volume of runoff from impervious surfaces,
Soils that cannot be sufficiently amended to provide for the requisite infiltration rates, Situations where site use is inconsistent with the capture and use of stormwater or other
physical conditions on site that preclude the use of plants for evapotranspiration or bioinfiltration.
Retention and/or use of stormwater onsite or discharge of stormwater onsite via infiltration has a significant adverse effect on the site or the down gradient water balance of surface waters, ground waters or receiving watershed ecological processes.

Section 438 Technical Guidance December 2009
18
State and local requirements or permit requirements that prohibit water collection or make it technically infeasible to use certain GI/LID techniques.
Compliance with the Section 438 requirements would result in the retention and/or use of stormwater on the site such that an adverse water balance impact may occur to the receiving surface waterbody or ground water.
Please note that a single one of these characteristics is very unlikely to preclude meeting the performance standard, but a combination of factors may. In cases where the facility has a defensible showing of technical infeasibility and can provide adequate documentation of site conditions or other factors that preclude full implementation of the performance design goal, the facility should still install stormwater practices to infiltrate, evapotranspire and/or harvest and use onsite the maximum amount of stormwater technically feasible. Note: Facilities must still comply with all other applicable federal, state and local requirements.

Section 438 Technical Guidance December 2009
19
Figure 8. Section 438 Implementation Process

Section 438 Technical Guidance December 2009
20
Documenting EISA Section 438 Implementation Each agency or department is responsible for ensuring compliance with Section 438. It is recommended that: 1) the final design and as-built drawings of each facility shall be reviewed by a registered professional engineer and 2) the agency or department develop and maintain documentation of the following design criteria for each project subject to Section 438: Site evaluation and soils analysis Calculations for the 95th percentile rainfall event or the pre-development runoff volumes
and rates to identify the volume of stormwater requiring management Documentation of modifications to the performance design objective based on technical
constraints (site-specific METF determination) The site design and stormwater management practices employed on the site Design calculations for each stormwater management practice employed The respective volume of stormwater managed by each practice and the system as a
whole Operations and maintenance protocols for the stormwater management system
The information should provide the necessary documentation and detail to demonstrate compliance and operation of stormwater management practices for the entire site. Common Green Infrastructure/Low Impact Development Tools to Implement Section 438 Although Congress did not prescribe specific practices to be used to implement Section 438 it can be inferred that one of the goals of the Act was to promote the use of innovative stormwater management approaches, designs and practices that better protect receiving water quality, flow regimes and provide other important environmental benefits. GI/LID are preferred practices, to be supplemented with or replaced with conventional controls when site specific conditions dictate.
The GI/LID management approaches and technologies that federal agencies would typically use enhance and/or mimic the natural hydrologic cycle processes of infiltration, evapotranspiration, and use. Federal agencies can also use footprint reduction practices (e.g., building up instead of out) to reduce their stormwater impact. GI/LID approaches include biological systems and engineered systems. These include but are not necessarily limited to: Rain gardens, bioretention, and infiltration planters Porous pavements Vegetated swales and bioswales Green roofs Trees and tree boxes Pocket wetlands Reforestation/revegetation using native plants Protection and enhancement of riparian buffers and floodplains Rainwater harvesting for use (e.g., irrigation, HVAC make-up, non-potable indoor uses).
GI/LID practices are recommended to implement EISA Section 438 for the following reasons:
cost savings in many cases
Section 438 Technical Guidance December 2009
21
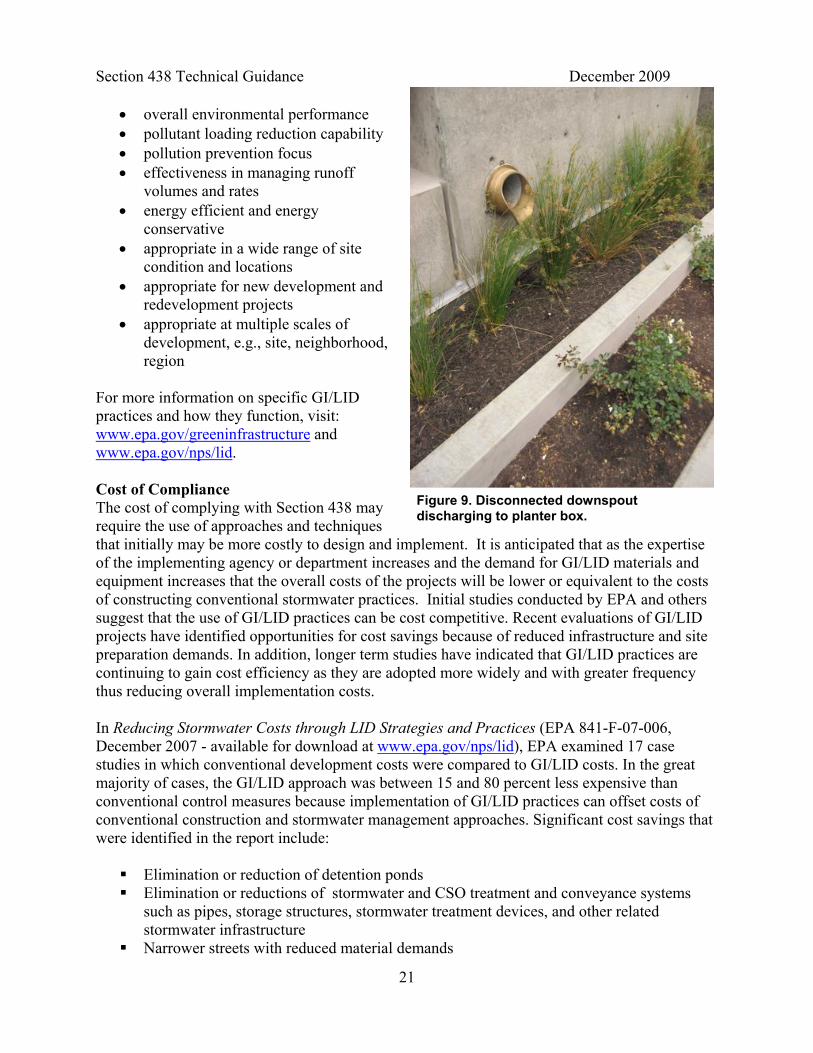
Figure 9. Disconnected downspout discharging to planter box.
overall environmental performance pollutant loading reduction capability pollution prevention focus effectiveness in managing runoff
volumes and rates energy efficient and energy
conservative appropriate in a wide range of site
condition and locations appropriate for new development and
redevelopment projects appropriate at multiple scales of
development, e.g., site, neighborhood, region
For more information on specific GI/LID practices and how they function, visit: www.epa.gov/greeninfrastructure and www.epa.gov/nps/lid.
Cost of Compliance The cost of complying with Section 438 may require the use of approaches and techniques that initially may be more costly to design and implement. It is anticipated that as the expertise of the implementing agency or department increases and the demand for GI/LID materials and equipment increases that the overall costs of the projects will be lower or equivalent to the costs of constructing conventional stormwater practices. Initial studies conducted by EPA and others suggest that the use of GI/LID practices can be cost competitive. Recent evaluations of GI/LID projects have identified opportunities for cost savings because of reduced infrastructure and site preparation demands. In addition, longer term studies have indicated that GI/LID practices are continuing to gain cost efficiency as they are adopted more widely and with greater frequency thus reducing overall implementation costs. In Reducing Stormwater Costs through LID Strategies and Practices (EPA 841-F-07-006, December 2007 - available for download at www.epa.gov/nps/lid), EPA examined 17 case studies in which conventional development costs were compared to GI/LID costs. In the great majority of cases, the GI/LID approach was between 15 and 80 percent less expensive than conventional control measures because implementation of GI/LID practices can offset costs of conventional construction and stormwater management approaches. Significant cost savings that were identified in the report include:
Elimination or reduction of detention ponds Elimination or reductions of stormwater and CSO treatment and conveyance systems
such as pipes, storage structures, stormwater treatment devices, and other related stormwater infrastructure
Narrower streets with reduced material demands

Section 438 Technical Guidance December 2009
22
Fewer square yards of sidewalks Reduced land purchases for stormwater control structures
In addition, other benefits were achieved through the use of GI/LID such as more beneficial uses of land previously dedicated to stormwater devices, increased livability and higher property values. There are many different combinations of practices that can be employed at particular sites to achieve pre-development hydrology. In selecting the appropriate set of practices to be used at the site, project sponsors should consider a broad range of factors, including cost-effectiveness of particular combinations of practices as applied to the site, as well as the potential for ancillary cost savings or community benefits (e.g., elimination or reduction of infrastructure costs, or the creation of attractive green spaces). EPA encourages project sponsors to include these factors in the planning and design phases of their projects so as to maximize triple bottom-line (economic, environmental, and social) results. E. CALCULATING THE 95TH
PERCENTILE RAINFALL EVENT A long period of precipitation records, i.e., a minimum of 10 years of data, is needed to determine the 95th percentile rainfall event for a location. Thirty years or more of monitoring data are desirable to conduct an unbiased statistical analysis. The National Climatic Data Center (NCDC) provides long-term precipitation data for many locations of the United States. You can download climate data from their Web site (www.ncdc.noaa.gov) or by ordering compact discs (NOTE: The NCDC charges a fee for access to their precipitation data). Local airports, universities, water treatment plants, or other facilities might also maintain long-term precipitation records. Data reporting formats can vary based on the data sources. In general, each record should include the following basic information:
Location (monitoring station) Recording time (usually the starting time of a time-step) Total precipitation depth during the time-step
In addition to the above information, a status flag is sometimes included to indicate data monitoring errors or anomalies. Typical NCDC flags include A (end accumulation), M (missing data), D (deleted data), or I (incomplete data). If there are no flags, the record has passed the quality control as prescribed by the NCDC and has been determined to be a valid data point. There are several data processing steps to determine the 95th percentile rainfall event using a spreadsheet. These steps are summarized below:
1. Obtain a long-term 24-hr precipitation data set for a location of interest (i.e., from the NCDC website).
2. Import the data into a spreadsheet. In MS Excel [Data / Import External Data / Import Data]

Section 438 Technical Guidance December 2009
23
3. Rearrange all of the daily precipitation records into one column if the original data set has multiple columns of daily precipitation records.
4. Review the records to identify if there are early periods with a large number of flagged data points (e.g., erroneous data points). Select a long period of good recording data that represents, ideally, 30 years or more of data. Remove all of the extra data (if not using the entire dataset).
5. Remove all flagged data points (i.e., erroneous data points) from the selected data set for
further analysis.
6. Remove small rainfall events (typically less than 0.1 inches), which may not contribute to rainfall runoff. These small events are categorized as depressional storage, which, in general, does not produce runoff from most sites.
Note: Steps 4 through 6 can be processed by applying data sort, delete and re-sort spreadsheet functions. In MS Excel [Data / Sort]
7. Calculate the 95th percentile rainfall amount by applying the PERCENTILE spreadsheet function at a cell. In MS Excel [=PERCENTILE(precipitation data range,95%)]
Section 438 Technical Guidance December 2009
24
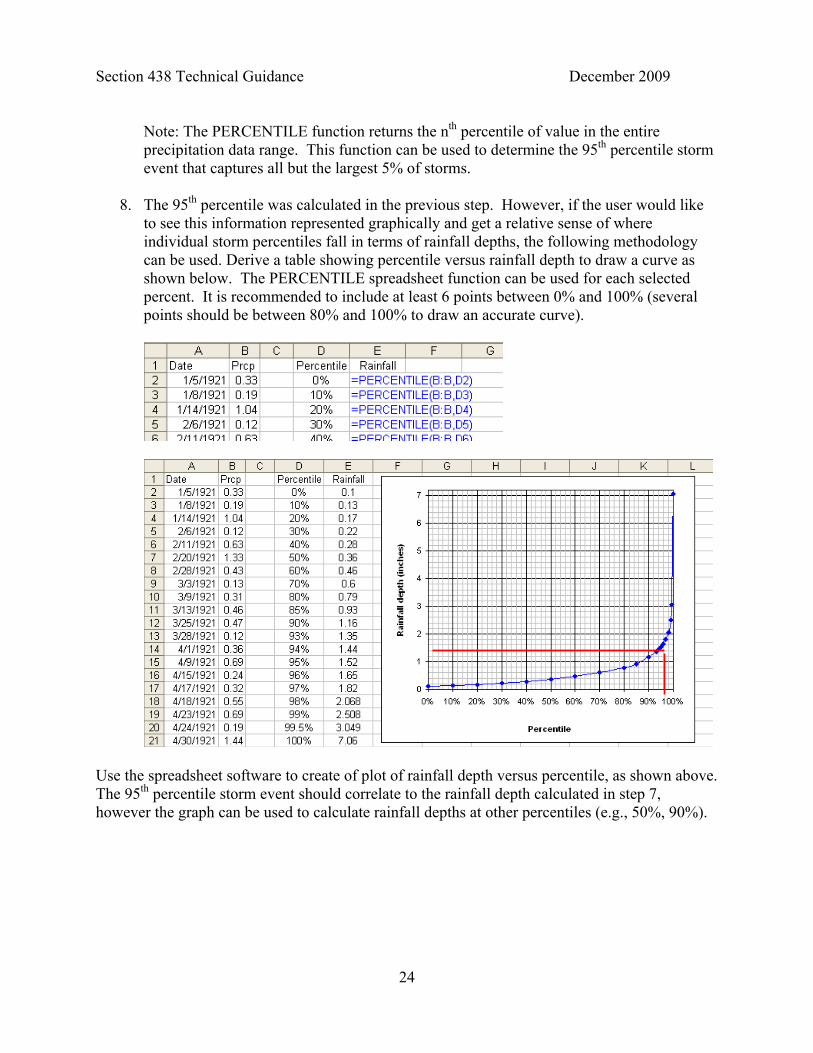
Note: The PERCENTILE function returns the nth percentile of value in the entire precipitation data range. This function can be used to determine the 95th percentile storm event that captures all but the largest 5% of storms.
8. The 95th percentile was calculated in the previous step. However, if the user would like to see this information represented graphically and get a relative sense of where individual storm percentiles fall in terms of rainfall depths, the following methodology can be used. Derive a table showing percentile versus rainfall depth to draw a curve as shown below. The PERCENTILE spreadsheet function can be used for each selected percent. It is recommended to include at least 6 points between 0% and 100% (several points should be between 80% and 100% to draw an accurate curve).
Use the spreadsheet software to create of plot of rainfall depth versus percentile, as shown above. The 95th percentile storm event should correlate to the rainfall depth calculated in step 7, however the graph can be used to calculate rainfall depths at other percentiles (e.g., 50%, 90%).

Section 438 Technical Guidance December 2009
25
Part II: Case Studies on Capturing the 95th Percentile Storm Using Onsite Management Practices
INTRODUCTION This section contains nine case studies that are intended to be representative of the range of projects that are subject to the requirements legislated in Section 438 of the Energy Independence and Security Act. The facility examples in the case studies were selected to illustrate project scenarios for differing geographic locations, site conditions, and project sizes and types. As noted in Part I, all projects with a footprint greater than 5,000 square feet must comply with the provisions of Section 438. What this means is that both new development and redevelopment projects should be designed to infiltrate, evapotranspirate, and/or harvest and use runoff to the maximum extent technically feasible (METF) to maintain or restore the pre-development hydrology of the site. Scenarios 1-8 are examples of sites where it was technically feasible to design the stormwater management system to retain the 95th percentile storm onsite. Scenario 9, however, was provided as an example of an METF analysis where site constraints allowed the designers to retain only 75% of the 95th percentile storm. Given the site-specific nature of individual projects, the case study scenarios described herein do not include site specific design features such as runoff routing, specific site infiltration rates, the structural loading capacity of buildings, etc. in terms of stormwater practice selection. It should be noted that an example of Option 2, which requires a site-specific hydrologic analysis, has not been provided in this document because of the complexity of factors and the lack of general applicability such an analysis would have. Background Numerous approaches exist for determining the volume of runoff to be treated through stormwater management. Retaining stormwater runoff from all events up to and including the 95th percentile rainfall event was identified as Option 1 because small, frequently-occurring storms account for a large proportion of the annual precipitation volume. Using GI/LID practices to retain both the runoff produced by small storms and the first part of larger storms can reduce the cumulative impacts of altered flow regimes on receiving water hydrology, e.g., channel degradation and diminished baseflow. For the purposes of this guidance, retaining all storms up to and including the 95th percentile storm event is analogous to maintaining or restoring the pre-development hydrology with respect to the volume, flow rate, duration and temperature of the runoff for most sites. Determination of the 95th Percentile Rainfall Event The 95th percentile rainfall rainfall event was determined using the long-term daily precipitation records from the National Climate Data Center (NCDC, 2007). By analyzing the frequency and rainfall depths from daily rainfall records over 24-hour periods, the 95th percentile storm event can be determined. From a frequency analysis viewpoint, the 95th percentile event is the storm event that is greater than or equal to 95% of all storms that occur within a given period of time. Regional climate conditions and precipitation vary across the U.S. Because of local values, it is essential that the implementing agency or department establish the 95th percentile storm event for

Section 438 Technical Guidance December 2009
26
the project site since the control volume may vary depending on local weather patterns and conditions. Onsite Stormwater Management Practice Determinations For the purposes of the case study scenarios, the following four categories of practices were selected as the most appropriate practices for implementing Section 438 requirements: bioretention, permeable pavements and pavers, cisterns, and green roofs. These practices were selected based on known performance data and cost. For each case study, the same hierarchy of selection criteria was used, i.e., the most cost effective practices were considered before other practices were considered. Bioretention practices were considered first because these systems generally have the lowest cost per unit of stormwater treated (Hathaway and Hunt, 2007). Thus, if the bioretention system could not be designed to adequately capture the desired runoff volume, permeable pavement and pavers, cisterns, and green roofs were considered in that order based on relative cost. In most cases a combination of practices was selected as part of an integrated treatment system. It should be noted that all treatment systems were designed to accomplish the goal of capturing the 95th percentile rainfall event onsite. Examples of onsite stormwater management practices selected for each site are presented in the results section. For the Boston, MA site, it was assumed that bioretention was not feasible in order to simulate a situation where space was severely limited; as a result, interlocking modular pavers were selected as the most cost-effective stormwater management to capture the requisite design volume. To further illustrate the range of site conditions designers may encounter, and how site conditions impact the selection of appropriate control options, Scenario #3 (Cincinnati, OH) was re-analyzed as Scenario #8. In Scenario #8, it was assumed that the site had clay soils and low infiltrative capacity. Given these site conditions, the range of potential control options was more limited and a combination of modular paving blocks, a green roof, and cisterns was ultimately selected based on cost and site suitability factors. For purposes of these modeling exercises, a number of assumptions were associated with each category of practice. These assumptions are not necessarily an endorsement of a particular design paradigm, but rather were used to keep a somewhat conservative cap on the scenarios in order to demonstrate the feasibility of the approach. For example, bioretention retrofits can and should often be located in prior impervious locations; however, in all modeled scenarios bioretention was restricted to currently landscaped areas. The assumptions were:
Bioretention areas: On-lot retention of stormwater through the use of vegetation, soils, and microbes to capture, treat and infiltrate runoff. It is assumed bioretention practices would be installed within currently landscaped pervious areas or that pervious areas would be created for bioretention cells. While termed bioretention, these systems are designed to provide infiltration as well as temporary storage. Bioretention areas would be designed to accept up to a depth of 10 inches of water across the surface of the bioretention cell (see Appendix A). The conceptual design of this storage depth would occur within the media and/or could be included as ponded storage. Further design storage beyond the 10 inches would be acceptable (and encouraged) above the media on a site-by-site basis with ponded depth generally not to exceed 12 inches.

Section 438 Technical Guidance December 2009
27
Uniform infiltration was assumed across the entire base of the bioretention cell. No additional media underneath the amended soils were included in the designs with infiltration rates in this layer governed by the in situ soils. Underdrains were not modeled directly but could be applied at the point of storage overflow such that no overflow occurs until the design depth of 10 inches is saturated. This approach was selected to maximize the storage and infiltration benefits of these systems. Designs utilizing underdrains at the base of the bioretention cell do not store the requisite volumes because the media is permeable and the underdrain conveys the runoff offsite through the underdrain before it can be infiltrated. Because standard underdrains typically discharge from smaller storms as well, underdrain designs, if employed, should ensure adequate retention capacity for the 95th percentile event volume. The bioretention footprint for modeling purposes was calculated as one uniform area that did not include side slopes. There is an expectation that actual bioretention cell construction would be distributed throughout the site with targeted locations based on hydrology (natural flow paths) and soils with greater infiltrative capacity. Side slopes may increase the surface excavation area required to accommodate the footprint and freeboard of these systems depending on the design or the bioretention system.
Porous/permeable pavement: Transportation surfaces constructed of asphalt, concrete or permeable pavers that are designed to infiltrate runoff. Infiltration was modeled for the entire porous pavement area with drainage pipes used only as overflow outlets. This design was chosen to maximize infiltration capabilities of the system. While many types of porous pavement systems can be used, modular block type pavers were generally applied in this design category under the assumption that they typically include sufficient volumetric storage in the media layer. [Note: Other types of porous pavement applications are available that support heavy loads and can be designed to temporarily store and infiltrate runoff beneath the surface of the pavement.] For these systems, an equivalent of 2 inches of design storage depth was assumed. This design depth could be achieved by specifying 10 inches of media depth that had 20% void space. Similarly, this could be achieved by designing six inches of media depth above the bottom surface, with specified media containing 33% void space. This alternative would have the overflow outlet at the 6 inch depth providing an equivalent water storage depth of 2 inches. The soils under the paver blocks may require or be subjected to some compaction for engineering stability. As a result, infiltration into underlying soils was modeled conservatively by applying the minimum infiltration rate for each soil type (see Appendix A). Generally, porous pavement is not recommended for high traffic areas or loading bays Because of this the scenarios assumed that only a percentage of total parking and road areas on a site can be converted to porous pavement. The assumed maximum percentage

Section 438 Technical Guidance December 2009
28
applied in the scenarios was set at 60% of the total paved area. Guidance on porous pavements is available at: http://cfpub.epa.gov/npdes/greeninfrastructure/technology.cfm#permpavements
Cistern: Containers or vessels that are used to store runoff for future use. Cisterns were modeled in cases where green roofs were not feasible or where it was necessary to include additional storage volume to meet the goal of onsite rainfall runoff capture. The sizes of cisterns would be calculated based on site-specific rainfall, site- specific spatial and structural conditions, use opportunities and rates, and consideration of cost per volume of storage. For simplicity, cistern volume was reported as a total volume. This total volume could be subdivided into any number of cisterns to provide the total necessary storage but should be based on the impervious area and runoff quantities which will flow to the cistern. The most efficient cost per volume storage would need to be considered on a site-by-site basis (see Appendix A).
Green roof: Roof designed with light weight soil media and planted with vegetation.
Frequently, green rooftop area is limited by structural capacity. In addition, other rooftop equipment may need to be accommodated in this space including HVAC systems and air handlers. For this reason, and to provide a somewhat conservative rate of application, it was assumed for these modeling analyses that up to 30% of a roof’s impervious area could be converted into a green roof. Green roof area was assumed to have 1 inch of total effective stormwater storage, i.e., a 2.5 inch media depth with 40% void space (see Appendix A).
General Approach Using site aerial photos, spatial analysis should be conducted to estimate the land cover types and areas for each site. The surface conditions of each site can be digitized using geographic information systems (GIS) techniques. Alternatively, computer-aided design (CAD) drawings can be used to estimate the surface area of each land cover type. The schematic in Figure 10 illustrates the processes used for selecting and determining the overall size of stormwater management practices for each site.

Section 438 Technical Guidance December 2009
29
Figure 10. Flow chart depicting the process for determining control measures
using the 95th percentile, 24-hour, annual rainfall event.
Stormwater Management Analysis &
Design Process
Collect spatial data from aerial photos (determine pervious
and impervious areas)
Collect historic rainfall data from nearest station
Determine the 95th percentile 24-hour rainfall event
Estimate the current runoff
Select onsite control measure options
Check whether control measure options
meet performance goals performance
Determine the size(s) of control measure(s)
Yes
1. Select alternative control measures using METF analysis and site limitations to determine appropriate runoff control measures if performance goals cannot be achieved
and/or
2. Exercise optional offsite runoff management approach and select appropriate control measures
No
Determine location and size(s) of onsite or off-site control measures
Design and implement control measure(s)
Yes
No Select control measure(s) to fit the site and confirm performance

Section 438 Technical Guidance December 2009
30
The following steps provide more detailed information on acquiring and calculating the necessary data to complete the processes indicated in Figure 10. This methodology was used in the scenario analyses that follow. Collecting spatial data for a site
1. Collect an aerial orthophotograph for the desired site. 2. Digitize land use/land cover conditions using GIS techniques. If CAD drawings of the
site exist, they can be used to estimate land cover area (pervious, impervious). 3. Categorize the digitized or planned land use/land cover based on surface hydrologic
conditions, e.g., rooftop, pavement, and pervious/landscaped area. 4. Estimate the size of each land use/land cover category (by polygon).
Determining the 95th percentile, 24-hr rainfall event
1. Obtain a long-term 24-hr precipitation data set for the location of interest (i.e., from the NCDC Web site or other source).
2. Import the data into a spreadsheet. In MS Excel [Data / Import External Data / Import Data] 3. Rearrange all of the daily precipitation records into one column if the original data set has
multiple columns of daily precipitation records. 4. Remove all flagged data points (i.e., erroneous data points) from the selected data set for
further analysis. 5. Remove small rainfall events (typically less than 0.1 inches) that may not contribute to
rainfall runoff. These small storms often produce little if any appreciable runoff from most sites and for modeling purposes are typically considered as volume captured in surface depression storage.
6. Calculate the 95th percentile rainfall volume by applying the PERCENTILE spreadsheet function to a range of data cells. The PERCENTILE function returns the nth percentile value in the specified precipitation data range. This function can be used to determine the 95th percentile storm event that captures all but the largest 5% of storms. In MS Excel [PERCENTILE(precipitation data range,95%)]
Estimating Current Runoff and Placing onsite control measures to capture the 95th percentile rainfall event
1. Collect spatial data for a site, e.g., rooftop, pavement, and pervious areas as above. 2. Check soil type (USDA mapping, borings, or onsite testing) for the site to determine
infiltration parameters. For this modeling, many of the assumptions that pertain to generalized soils groups and their infiltration properties come from the EPA Stormwater Management Model (SWMM 4.x) manual (see Appendix A).
3. Determine the current runoff volume that would occur during a 24 hour period by applying the 95th percentile rainfall to the existing site conditions (land use and soil properties) as above using a hydrologic model (such as TR-55 or SWMM). For this analysis, it is assumed that the rainfall amount is distributed over a 24 hour period. Actual rainfall event duration (and intensity) was not considered for determining rainfall runoff (however, timing was considered when modeling infiltration).
4. Determine flow paths so that management practice placements are in locations where flows can be intercepted and routed to practices. Because this is a site specific effort and may require detailed topographic information or further surveys this would be a task to be

Section 438 Technical Guidance December 2009
31
completed onsite and therefore is not included as a part of the modeling scenario exercise.
5. Select onsite control practices to capture the current 95th percentile runoff event; base the selection of appropriate options on site conditions, areas available for treatment options, and other factors such as site use and other constraints.
Note: The steps above have been generalized for the purposes of this guidance. It is recommended that a qualified professional engineer determine or verify that stormwater management practices are sized, placed, and designed correctly. It should also be noted that the methodology to determine rainfall amount used a 24 hour time period based on daily records. Actual rainfall events may have occurred over shorter or longer time periods. Similarly, for modeling purposes, the 24 hour rainfall amount was distributed to pervious and impervious areas (and management practices) as a uniform event occurring during a 24-hour period. A large dataset (greater than 50 years) was used to reasonably represent rainfall depth on a daily bases. It stands to reason that more frequent, shorter duration precipitation events are better represented than less frequent, longer duration precipitation events. Scenarios Eight locations were selected for the 9 case studies as shown in Figure 11 and Table 2. Case study numbers 3 and 8 were both developed based on the Cincinnati, Ohio facility, although the site parameters were altered to represent differing site conditions and design constraints. Annual average rainfall depths for these locations range from 7.5 inches to 48.9 inches. Analyses of the 95th percentile rainfall events for these locations produced rainfall depths that range from 1.00 inch to 1.77 inches (Table 2).
Figure 11. Locations for Analyzing Onsite Control Measures.
Section 438 Technical Guidance December 2009
32
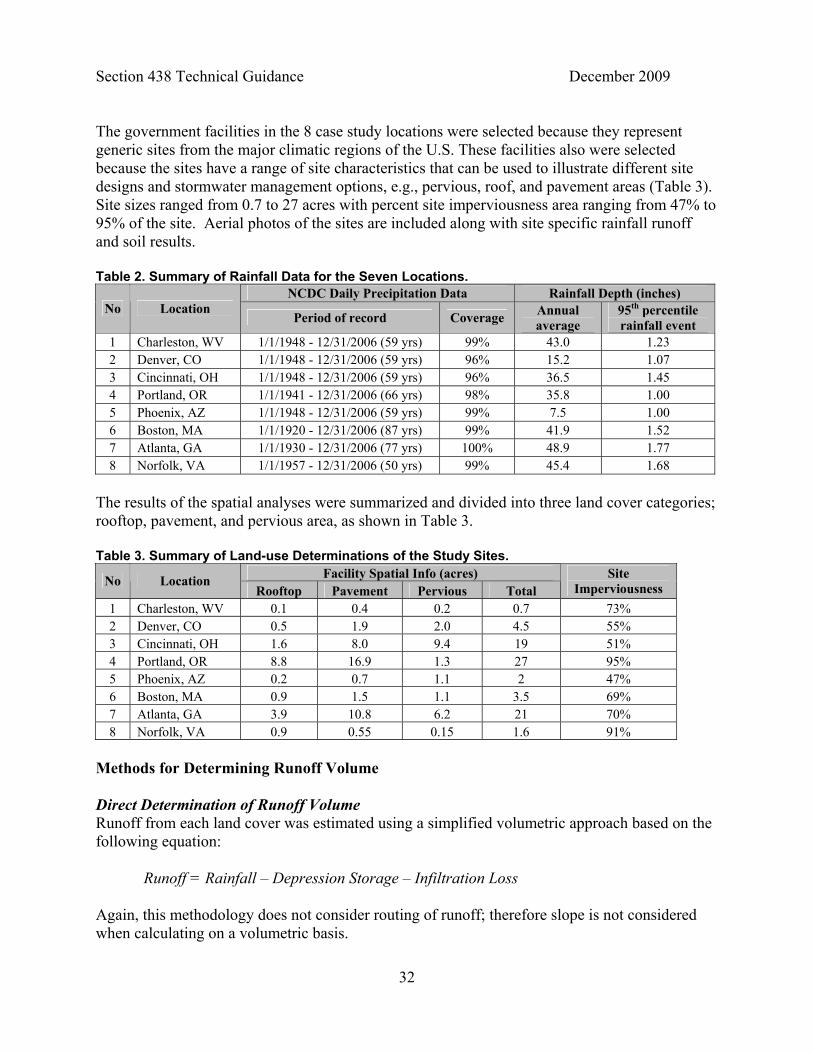
The government facilities in the 8 case study locations were selected because they represent generic sites from the major climatic regions of the U.S. These facilities also were selected because the sites have a range of site characteristics that can be used to illustrate different site designs and stormwater management options, e.g., pervious, roof, and pavement areas (Table 3). Site sizes ranged from 0.7 to 27 acres with percent site imperviousness area ranging from 47% to 95% of the site. Aerial photos of the sites are included along with site specific rainfall runoff and soil results. Table 2. Summary of Rainfall Data for the Seven Locations.
NCDC Daily Precipitation Data Rainfall Depth (inches) No Location
Period of record Coverage Annual average
95th percentile rainfall event
1 Charleston, WV 1/1/1948 - 12/31/2006 (59 yrs) 99% 43.0 1.23 2 Denver, CO 1/1/1948 - 12/31/2006 (59 yrs) 96% 15.2 1.07 3 Cincinnati, OH 1/1/1948 - 12/31/2006 (59 yrs) 96% 36.5 1.45 4 Portland, OR 1/1/1941 - 12/31/2006 (66 yrs) 98% 35.8 1.00 5 Phoenix, AZ 1/1/1948 - 12/31/2006 (59 yrs) 99% 7.5 1.00 6 Boston, MA 1/1/1920 - 12/31/2006 (87 yrs) 99% 41.9 1.52 7 Atlanta, GA 1/1/1930 - 12/31/2006 (77 yrs) 100% 48.9 1.77 8 Norfolk, VA 1/1/1957 - 12/31/2006 (50 yrs) 99% 45.4 1.68
The results of the spatial analyses were summarized and divided into three land cover categories; rooftop, pavement, and pervious area, as shown in Table 3. Table 3. Summary of Land-use Determinations of the Study Sites.
Facility Spatial Info (acres) No Location
Rooftop Pavement Pervious Total Site
Imperviousness
1 Charleston, WV 0.1 0.4 0.2 0.7 73% 2 Denver, CO 0.5 1.9 2.0 4.5 55% 3 Cincinnati, OH 1.6 8.0 9.4 19 51% 4 Portland, OR 8.8 16.9 1.3 27 95% 5 Phoenix, AZ 0.2 0.7 1.1 2 47% 6 Boston, MA 0.9 1.5 1.1 3.5 69% 7 Atlanta, GA 3.9 10.8 6.2 21 70% 8 Norfolk, VA 0.9 0.55 0.15 1.6 91%
Methods for Determining Runoff Volume Direct Determination of Runoff Volume Runoff from each land cover was estimated using a simplified volumetric approach based on the following equation: Runoff = Rainfall – Depression Storage – Infiltration Loss Again, this methodology does not consider routing of runoff; therefore slope is not considered when calculating on a volumetric basis.
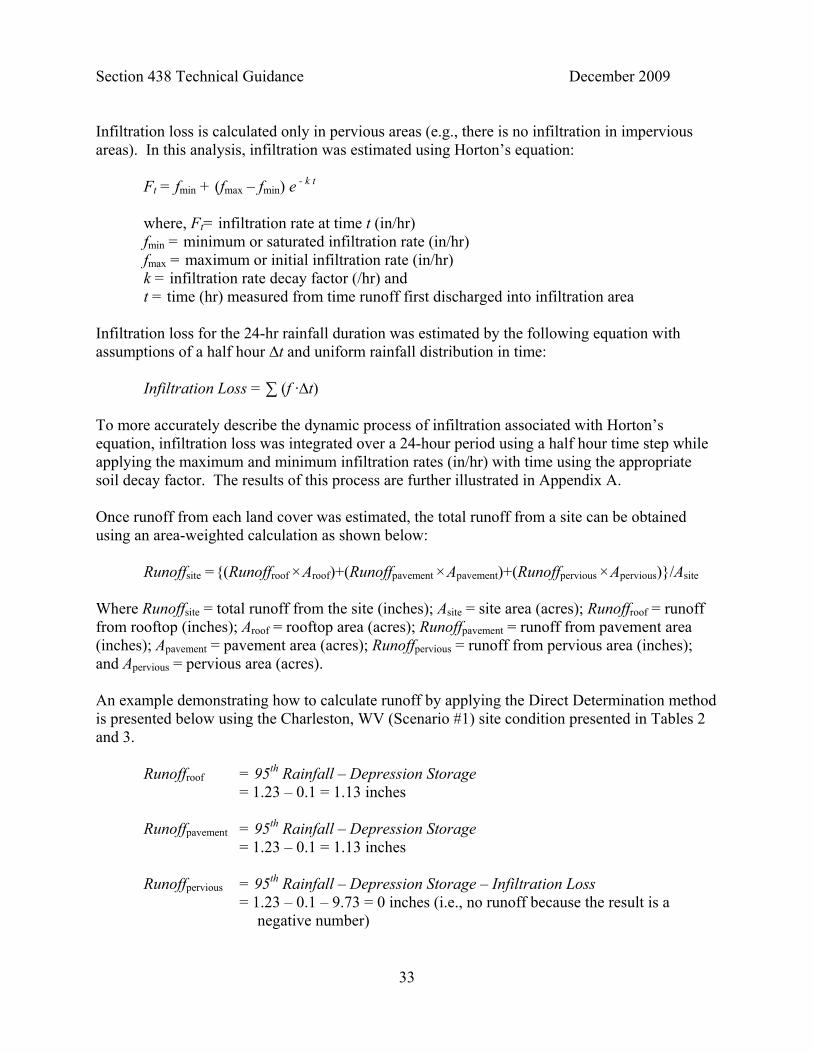
Section 438 Technical Guidance December 2009
33
Infiltration loss is calculated only in pervious areas (e.g., there is no infiltration in impervious areas). In this analysis, infiltration was estimated using Horton’s equation: Ft = fmin + (fmax – fmin) e
- k t where, Ft= infiltration rate at time t (in/hr) fmin = minimum or saturated infiltration rate (in/hr) fmax = maximum or initial infiltration rate (in/hr) k = infiltration rate decay factor (/hr) and t = time (hr) measured from time runoff first discharged into infiltration area
Infiltration loss for the 24-hr rainfall duration was estimated by the following equation with assumptions of a half hour ∆t and uniform rainfall distribution in time:
Infiltration Loss = ∑ (f ·∆t) To more accurately describe the dynamic process of infiltration associated with Horton’s equation, infiltration loss was integrated over a 24-hour period using a half hour time step while applying the maximum and minimum infiltration rates (in/hr) with time using the appropriate soil decay factor. The results of this process are further illustrated in Appendix A. Once runoff from each land cover was estimated, the total runoff from a site can be obtained using an area-weighted calculation as shown below:
Runoffsite ={(Runoffroof ×Aroof)+(Runoffpavement ×Apavement)+(Runoffpervious ×Apervious)}/Asite Where Runoffsite = total runoff from the site (inches); Asite = site area (acres); Runoffroof = runoff from rooftop (inches); Aroof = rooftop area (acres); Runoffpavement = runoff from pavement area (inches); Apavement = pavement area (acres); Runoffpervious = runoff from pervious area (inches); and Apervious = pervious area (acres). An example demonstrating how to calculate runoff by applying the Direct Determination method is presented below using the Charleston, WV (Scenario #1) site condition presented in Tables 2 and 3.
Runoffroof = 95th Rainfall – Depression Storage = 1.23 – 0.1 = 1.13 inches Runoffpavement = 95th Rainfall – Depression Storage = 1.23 – 0.1 = 1.13 inches Runoffpervious = 95th Rainfall – Depression Storage – Infiltration Loss = 1.23 – 0.1 – 9.73 = 0 inches (i.e., no runoff because the result is a
negative number)

Section 438 Technical Guidance December 2009
34
Runoffsite ={(Runoffroof ×Aroof)+(Runoffpavement ×Apavement)+(Runoffpervious ×Apervious)}/Asite ={(1.13 ×0.10)+(1.13×0.41)+(0 ×0.19)}/0.7 = 0.82 inches
Infiltration loss was estimated based on soil type B by applying the Horton equation as described above. Because the volume removed from surface runoff through infiltration was substantial, no runoff occurred from the pervious area. In cases where sites had limited physical space available for stormwater management, a series of practices was used (e.g., treatment train) to simulate the runoff and infiltrative behavior of the system. For example, if there was inadequate area and infiltrative capacity to infiltrate 100 percent of the 95th percentile storm event within a bioretention system another onsite management practice was selected to manage the runoff that could provide the necessary capacity. In this manner, excess runoff was routed to another management practice in the series of treatment cells where possible. Two types of soils were considered for every site: hydrologic soil group B and C (except for scenario 8 in which hydrologic soil group D was used). Group B soils typically have between 10 percent and 20 percent clay and 50 percent to 90 percent sand and either loamy sand or sandy loam textures with some loam, silt loam, silt, or sandy clay loam soil textures placed in this group if they are well aggregated, of low bulk density, or contain greater than 35 percent rock fragments. Group C soils typically have between 20 percent and 40 percent clay and less than 50 percent sand and have loam, silt loam, sandy clay loam, clay loam, and silty clay loam soil textures with some clay, silty clay, or sandy clay textures placed in this group if they are well aggregated, of low bulk density, or contain greater than 35 percent rock fragments (USDA-NRCS, 2007). The application of these hydrologic soil groups was intended to give reasonable and somewhat conservative estimates of infiltration capacity. General hydrologic parameters in this analysis were assumed as follows (see Appendix A for citations of assumptions):
Depression storage (or initial abstraction)
o Rooftop: 0.1 inches o Pavement: 0.1 inches o Pervious area: 0.2 inches
Horton Infiltration parameters
o Hydrologic Soil Group B Maximum infiltration rate: 5 in/hr Minimum infiltration rate: 0.3 in/hr Decay factor: 2 /hr
o Hydrologic Soil Group C
Maximum infiltration rate: 3 in/hr Minimum infiltration rate: 0.1 in/hr Decay factor: 3.5 /hr

Section 438 Technical Guidance December 2009
35
Design storage assumptions of control measures
o Bioretention: up to 10 inches (but variable based on balancing necessary storage volume, media depth for plant survivorship, and surface area limitations)
o Green roof: 1 inch (2.5 inches deep media with 40% void space) o Porous pavement: 4 inches (10 inches deep media with 40% void space)
Other Methods for Estimating Runoff Volume Runoff from a site after applying the 95th percentile storm can be estimated by using a number of empirical, statistical, or mathematical methods. Several methods were considered in this analysis. The Rational Method can be used to estimate peak discharge rates and the Modified Rational Method can be used to develop a runoff hydrograph. The NRCS TR-55 model can be used to predict runoff volume and peak discharge. TR-55 can also be used to develop a runoff hydrograph. The EPA Stormwater Management Model (SWMM) can be used to simulate rainfall-runoff, pollutant build-up and wash-off, transport-storage-treatment of stormwater flow and pollutants, backwater effects, etc. for a wide range of temporal and spatial scales. The SWMM model can be fit to model a small site with a distributed system. Hydrologic Simulation Program – Fortran (HSPF, USDA) is a watershed and land use based lumped model that can be used to compute the movement of water and pollutants when evaluating the effects of land use change, reservoir operations, water quality control options, flow diversions, etc. In general, regionally calibrated modeling parameters are incorporated into HSPF. QUALHYMO is a complete hydrologic and water quality model, which can be used to factor in snowmelt or soil moisture conditions or to simulate system behavior based on infiltration and ET, ground water storage tracking, baseflow and deep volumetric losses, and other variables. Many of the existing tools for analyzing distributed systems use some part or all of the principles or formulae of the modeling approaches highlighted above. For example, the Emoryville spreadsheet control measure model (Emoryville, CA) uses a runoff coefficient (i.e., Rational Method) for analyzing lot-level to neighborhood-scale control measure sizing. The Green Calculator (Center for Neighborhood Technologies) estimates the benefit of onsite GI/LID options on a neighborhood-scale by applying the curve numbers (i.e., TR-55) and the Modified Rational Method. The Northern Kentucky Spreadsheet Tool uses a TR-55 based approach for control measure sizing on neighborhood or site level spatial scales. The WWHM (Western Washington Hydrology Model) is a regionally calibrated HSPF model intended for use in sizing stormwater detention and water quality facilities to meet the Washington State Department of Ecology standards. WBM-QUALHYMO is a Canadian model used in conjunction with the Water Balance Model (WBM). This model can be used to continuously simulate stormwater storage routing, stream erosion, drainage area flow routing, and snowmelt runoff (and ultimately freeze-thaw). Table 4 contains a summary of these different methods based on generic modeling features.

Section 438 Technical Guidance December 2009
36
Table 4. Potential Methods for Analyzing Control Measures.
Model Considerations Rational Method TR-55 SWMM
Direct Determination HSPF QUALHYMO
Single Event Yes Yes Yes Yes Yes Yes Temporal
scale Continuous Simulation
No No Yes Possible Yes Yes
Lot-level Yes Yesb Yes Yes No No
Neighborhood Yes Yes Yes Yes Possible Possible Spatial scale
Regional Yes Yesc Yes No Yes Yes Peak Discharge
Yes Yes Yes No Yes Yes
Runoff Volume
Yes Yes Yes Yes Yes Yes
Hydrograph Yesa Yes Yes No Yes Yes
Outputs
Water Quality No No Yes Possible Yes Yes a Modified Rational Method b No less than 1 acre. c No more than 25 square miles (up to 10 subareas).
From the viewpoint of modeling both lot-level and neighborhood scale projects, the Rational Method, NRCS TR-55, SWMM, and Direct Determination approaches were selected for use in scenario analyses. Strength and weakness of these methods are presented below: Table 5. Comparison of approaches for determining runoff volume.
Method Strengths Weaknesses
Direct Determination
Methodology for runoff determination is same as SWMM
Models basic hydrologic processes directly (explicit)
Simple spreadsheet can be used
Direct application of Horton’s method may estimate higher infiltration loss, especially at the beginning of a storm
Does not consider flow routing
Rational Method
Method is widely used Simple to use and understand
Cannot directly model storage-oriented onsite control measures
TR-55 Method is widely used Simple to use and understand
May not be appropriate for estimating runoff from small storm events because depression storage is not well accounted for
SWMM
Method is widely used Can provide complete hydrologic and
water quality process dynamics in stormwater analysis
Needs a number of site-specific modeling parameters
Generally requires more extensive experience and modeling skills
Each method requires specific parameters for estimating runoff from a site. Runoff coefficients for the Rational Method are assumed to be 0.9 for rooftop and pavement areas, and 0.1 and 0.135 for Group B and C soil pervious areas, respectively (Caltrans, 2003). The slope of the pervious area was assumed to be an average of 2%. Applying these runoff coefficients for each surface, the overall area-weighted runoff coefficient can be determined.

Section 438 Technical Guidance December 2009
37
When applying the NRCS TR-55 method, Curve Numbers (CNs) should be determined for each drainage area. For rooftop and pavement areas the CN was assumed to be 98, and pervious area CN was determined on the basis of the hydrologic soil group and the status of grass cover condition. Curve numbers for pervious areas were assumed to be 61 and 74 for Group B and C soils, respectively, with an assumption of over 75% grass cover. The overall CN can be estimated by using an area-weighted calculation (USDA-SCS, 1986). In SWMM modeling, infiltration was modeled using Horton’s equation. The same infiltration parameters and depression storage values used in the direct determination method of runoff treatment volume described earlier were applied to the SWMM analyses. The average slope of the pervious area was again assumed to be 2%. The same uniform rainfall distribution and time step was applied for the SWMM model runs. Runoff Methodology Results Stormwater management practice sizes (and depth) were determined using the Direct Determination approach to capture the volume of runoff generated in a 95th percentile rainfall event at each location. Total acreage, impervious area, the 95th percentile rainfall event, the current expected runoff for the 95th percentile rainfall event, and the future runoff with stormwater management controls were reported for each site. Results were summarized for the two soil types (three soil types for scenarios #3 and #8 in Cincinnati). The spatial location of onsite control measures was also illustrated in the site aerial photo figures. Note that site practices were placed only on undeveloped or landscaped areas without regard for true flow paths or technical feasibility. It may be preferred to place practices in existing impervious areas, if possible. For the purposes of this modeling exercise, the least cost and most practical solutions were used, i.e., locating bioretention systems on undeveloped or landscaped areas. On an actual site, flow paths would be determined and berms and swales might be used to route runoff to areas that are most suitable for infiltration. In other cases, areas that are currently impervious could be modified to accept runoff, e.g., impermeable pavements removed and replaced by permeable, sidewalks could be redesigned to include sidewalk bioretention cells and streets could be designed with flow through or infiltration curb bumpouts/raingardens. To compare other approaches of runoff estimation, alternate methodologies were also employed for three scenarios. TR-55 was used for Scenario #1 (Atlanta), the Rational Method was applied to Scenario #2 (Denver), and the SWMM was run for Scenario #7 (Charleston). Although flood control is not the focus of this guidance, most localities have flood control requirements that will need to be considered in designing control measures to comply with Section 438. For flood control purposes, TR-55 was used to model the 10 year frequency design storm for each site under the assumption that all stormwater management practices were in place. The 10-year design storms were selected from the NRCS TR-55 Manual (USDA, 1986) for both the Eastern U.S. and the Western U.S. Precipitation Frequency Maps (www.wrcc.dri.edu/pcpnfreq.html). The 10-year frequency design storm was selected because it represents a common design standard used by state and local governments in order to manage peak rates of runoff and prevent flooding.

Section 438 Technical Guidance December 2009
38
COST ESTIMATES FOR SELECTED SCENARIOS Scenarios #2 and 7 include cost estimates comparing the capital costs for a design to comply with Section 438 (retention of the 95th percentile rainfall event) and capital costs for a traditional stormwater management design (e.g., typical curb and gutter, off-site pond for stormwater management). These costs are based on average unit costs to construct both traditional and GI/LID controls.

Section 438 Technical Guidance December 2009
39
Scenario #1 - Charleston, WV A 0.7-acre site with 73% impervious area was selected from Charleston, West Virginia (Figure 12). If the 95th percentile rainfall event (1.23 inches) occurred on the existing site (i.e., with no control measures), 0.82 inches of runoff using the Direct Determination method would be generated and require management. The runoff from the 95th percentile rainfall event could be retained by the installation of bioretention systems totaling 0.03 acres if hydrologic soil group B is present, or 0.06 acres if hydrologic soil group C (Table 6) is the predominant soil type on the site. Assuming that bioretention practices are placed in areas that are currently pervious or landscaped, a total of 0.2 acres of pervious area would be available for the placement of bioretention systems. The effective design storage depth within the designated bioretention area was 8 inches.
Figure 12. Actual Site and Onsite Control Measures (Charleston, WV) Table 6. Estimated Sizes of Onsite Control Measures for Scenario #1 (Charleston, WV)
Total Area (acres) 0.7 Estimated Imperviousness (%) 73% 95th Percentile Rainfall Event (inches) 1.23 Expected Runoff for the 95th Percentile Rainfall Event (inches) 0.82 Stormwater Management Area Required Hydrologic Soil Group B C
Bioretention estimated by Direct Determination method (acres) 0.03 0.06 Bioretention estimated by SWMM (acres) 0.03 0.05
With onsite controls 0.10 0.12 Off-site storage necessary to control the 10-yr event of 3.9 inches (acre-ft) Without onsite controls 0.16 0.17
Note: The two hydrologic methods used (direct determination and SWMM) estimated similar bioretention sizes.

Section 438 Technical Guidance December 2009
40
Scenario #2 - Denver, CO A 4.5-acre site with 55% impervious area was selected from Denver, Colorado (Figure 13). If the 95th percentile rainfall event (1.07 inches) occurred on the existing site (i.e., with no control measures), 0.53 inches of runoff from the site would be generated and require management. The runoff from the 95th percentile rainfall event could be retained by the installation of bioretention systems totaling 0.16 acres if the hydrologic soil group B is present or 0.3 acres if hydrologic soil group C (Table 7) is the predominant soil type on the site. Assuming that bioretention practices are only placed in areas that are currently pervious or landscaped, a total of 2 acres of pervious area is available for the placement of bioretention systems. The design storage depth of media within the designated bioretention area was 6 inches.
Figure 13. Actual Site and Onsite Control Measures (Denver, CO)
Table 7. Estimated Sizes of Onsite Control Measures for Scenario #2 (Denver, CO)
Total Area (acres) 4.5 Estimated Imperviousness (%) 55% 95th Percentile Rainfall Event (inches) 1.07 Expected Runoff for the 95th Percentile Rainfall Event (inches) 0.53 Stormwater Management Area Required Hydrologic Soil Group B C
Bioretention estimated by the Direct Determination method (acres) 0.16 0.3 Bioretention estimated by Rational Method (acres) 0.16 0.28
With onsite controls 0.35 0.52 Off-site storage necessary to control the 10-yr event of 3.2 inches (acre-ft) Without onsite controls 0.64 0.64

Section 438 Technical Guidance December 2009
41
Cost estimates were also developed for this scenario (Table 8) to compare the costs of installing onsite control measures to retain the 95th percentile rainfall event versus the costs to install traditional stormwater management controls (e.g., curbs and gutters combined with off-site retention such as extended detention wet ponds). In a GI/LID scenario, the bioretention cell would occupy a specified area. This same area in a traditional design would be covered in turf since the pond would typically be offsite and not occupy the area planted in turf. Table 8 includes this cost under the traditional column. Note: typical land development practices involve mass clearing and grading so little or no pre-existing vegetation is typically retained. It is also assumed that the use of GI/LID practices would require less underground infrastructure because the traditional design typically routes stormwater underground to an off-site pond via pipes or culverts while GI/LID practices are designed to manage runoff onsite and as close to its source as possible. They are also dispersed across the site and routing occurs through surface drainage via bioswales and overland flow. As a result GI/LID practices do not require as much or any hard or grey infrastructure. The cost estimates were developed for Hydrologic Soil Group B. Table 8. Estimated Costs for Scenario #2 (Denver, CO) Sizes of Onsite Control Practices Controls for 95th Percentile Event Traditional Stormwater Controls Rainfall depth (in) 1.07 Bioretention (acres) 0.1 Paver blocks (acres) 0 Green roof (acres) 0
WQV (ac-ft) - 0.18 Off-site Pond 10-Yr Fld Cntr (ac-ft) 0.15 0.14
Total Off-Site Requirement (ac-ft) 0.15 0.32 Land Area (assumes avg 3 ft depth) 0.05 0.11 % of the site 2.8% Costs of Onsite Control Practices Biorention/alternative $32,495 $4,187
WQV (ac-ft) $14,833 Off-site Pond 10-Yr Fld Cntr (ac-ft) $10,073 $9,527 Pipe $8.990 $16,982 Infrastructure Inlet $9.920 $14,880
Land Area (assumes $300K/acre) $14,500 $31,500 Sum $75,978 $91,909 % difference from Traditional -17.3%

Section 438 Technical Guidance December 2009
42
Scenario #3 - Cincinnati, OH A 19-acre site with 51% impervious area was selected in Cincinnati, Ohio (Figure 14). If the 95th percentile rainfall event (1.45 inches) occurred on the existing site (i.e., no control measures were in place), 0.68 inches of runoff from the site would be generated and require management. The runoff from the 95th percentile rainfall event could be retained by the installation of bioretention systems totaling 0.8 acres if the hydrologic soil group B is present or 1.3 acres if hydrologic soil group C (Table 9) is the predominant soil type on the site. Assuming that bioretention practices are only placed in areas that are currently pervious or landscaped, a total of 9.4 acres of pervious area is available for the placement of bioretention systems. The design storage depth of media within the designated bioretention area was 8 inches.
Figure 14. Actual Site and Onsite Control Measures (Cincinnati, OH)
Table 9. Estimated Sizes of Onsite Control Measures for Scenario #3 (Cincinnati, OH)
Total Area (acres) 19 Estimated Imperviousness (%) 51% 95th Percentile Rainfall Event (inches) 1.45 Expected Runoff for the 95th Percentile Rainfall Event (inches) 0.68 Stormwater Management Area Required Hydrologic Soil Group B C
Bioretention estimated by the Direct Determination (acres) 0.8 1.3 With onsite controls 2.42 3.24 Off-site storage necessary to control the 10-yr
event of 4.2 inches (acre-ft) Without onsite controls 3.29 3.73
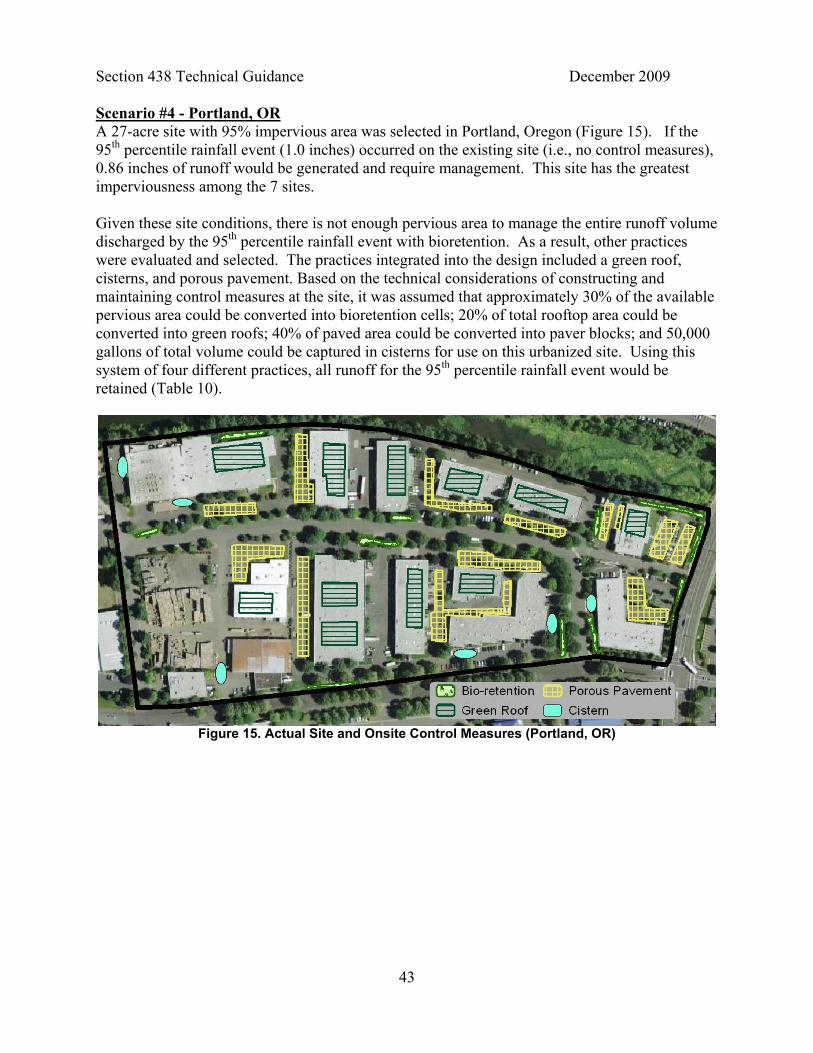
Section 438 Technical Guidance December 2009
43
Scenario #4 - Portland, OR A 27-acre site with 95% impervious area was selected in Portland, Oregon (Figure 15). If the 95th percentile rainfall event (1.0 inches) occurred on the existing site (i.e., no control measures), 0.86 inches of runoff would be generated and require management. This site has the greatest imperviousness among the 7 sites. Given these site conditions, there is not enough pervious area to manage the entire runoff volume discharged by the 95th percentile rainfall event with bioretention. As a result, other practices were evaluated and selected. The practices integrated into the design included a green roof, cisterns, and porous pavement. Based on the technical considerations of constructing and maintaining control measures at the site, it was assumed that approximately 30% of the available pervious area could be converted into bioretention cells; 20% of total rooftop area could be converted into green roofs; 40% of paved area could be converted into paver blocks; and 50,000 gallons of total volume could be captured in cisterns for use on this urbanized site. Using this system of four different practices, all runoff for the 95th percentile rainfall event would be retained (Table 10).
Figure 15. Actual Site and Onsite Control Measures (Portland, OR)

Section 438 Technical Guidance December 2009
44
Table 10. Estimated Sizes of Onsite Control Measures for Scenario #4 (Portland, OR) Total Area (acres) 27 Estimated Imperviousness (%) 95% 95th percentile Rainfall Event (inches) 1.00 Expected Runoff for the 95th Percentile Rainfall Event (inches) 0.86 Stormwater Management Area Required Hydrologic Soil Group B C
Paver block area estimated by Direct Determination (acres) 1.4 3.5* Bioretention estimated by Direct Determination (acres) 0.4 Green Roof estimated by Direct Determination (acres) 1.7
Cistern volume estimated by Direct Determination (gallons) 50,000 With onsite controls 5.37 5.62 Off-site storage necessary to control the 10-yr
event of 3.7 inches (acre-ft) Without onsite controls 7.70 7.71 *The size of porous pavement area was increased because the other control options were maximized based on the site-specific design assumptions.
A total of 1.3 acres of the site is pervious area or landscaped of which, 0.4 acres (30% of the pervious area) could be converted to bioretention cells that have a storage depth of 10 inches. Of the 8.8 acres of current rooftop area, 1.7 acres (20% of the rooftop area) could be retrofitted into green roof areas. Of the 16.9 acres of paved area, 1.4 acres (8% of the paved area) for hydrologic soil group B, or 3.5 acres (20% of the paved area) for hydrologic soil group C, of paver block systems could be implemented. One or more cisterns (as indicated in Figure 15) could be used to capture up to 50,000 gallons of runoff from rooftop areas. Note: The high percentage of imperviousness of the site (95%) requires that all infiltration designs be based on resident soil type and design volumes, or with adequate sub-bases or amended soils.

Section 438 Technical Guidance December 2009
45
Scenario #5 – Near Phoenix, AZ A 2-acre site with 47% impervious area was selected near Phoenix, Arizona (Figure 16). If the 95th percentile rainfall event (1.0 inches) occurred on the existing site (i.e., with no control measures), 0.42 inches of runoff would be generated and require management. The runoff from the 95th percentile rainfall event could be retained by installing bioretention systems totaling 0.06 acres if the hydrologic soil group B is present or 0.1 acres if hydrologic soil group C (Table 11) is the predominant soil type on the site. Assuming that bioretention practices are only placed in areas that are currently pervious or landscaped, a total of 1.1 acres of pervious area is available for the placement of these practices. The design storage depth of media within the designated bioretention area was 6 inches. Note: If the design storage depth were increased to 10 inches, the off-site storage necessary for the 10-year event could be reduced to 0.03 acre-ft for type B soils and 0.08 acre-ft for type C soils.
Figure 16. Actual Site and Onsite Control Measures (Phoenix, AZ)
Table 11. Estimated Sizes of Onsite Control Measures for Scenario #5 (Phoenix, AZ)
Total Area (acres) 2 Estimated Imperviousness (%) 47% 95th Percentile Rainfall Event (inches) 1.00 Expected Runoff for the 95th Percentile Rainfall Event (inches) 0.42 Stormwater Management Area Required Hydrologic Soil Group B C
Bioretention estimated by the Direct Determination (acres) 0.06 0.1 With onsite controls 0.05 0.12 Off-site storage necessary to control
the 10-yr event of 2.4 inches (acre-ft) Without onsite controls 0.18 0.18
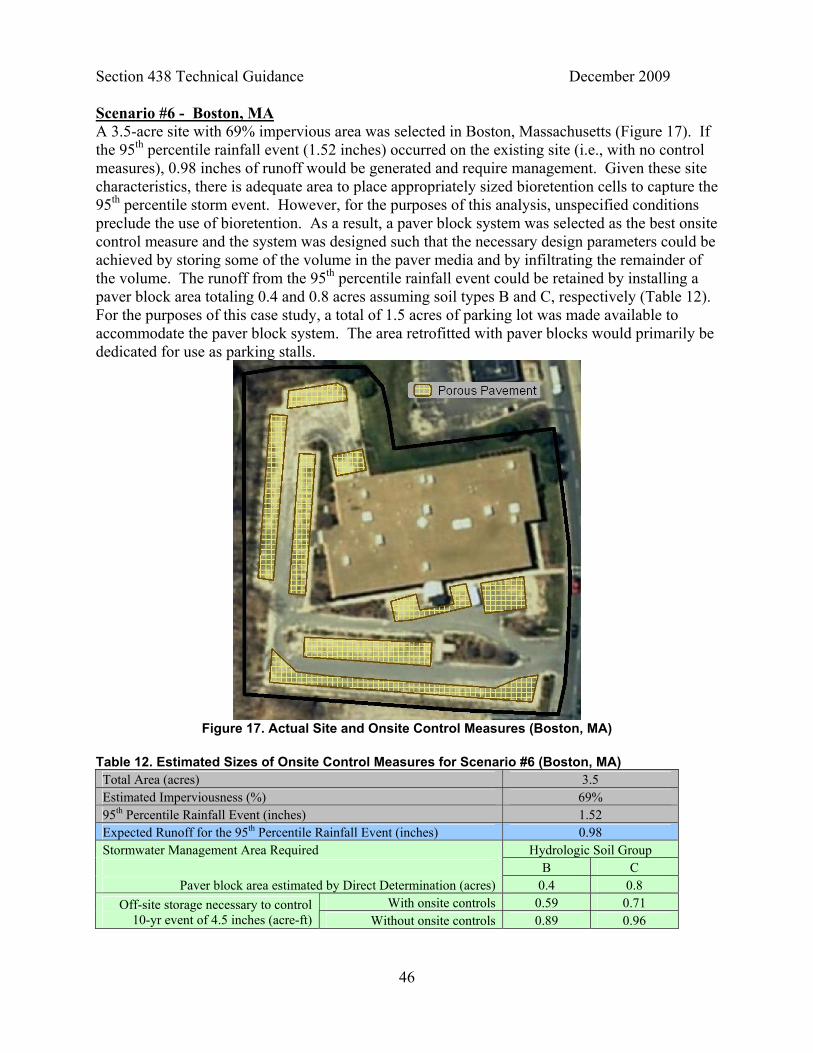
Section 438 Technical Guidance December 2009
46
Scenario #6 - Boston, MA A 3.5-acre site with 69% impervious area was selected in Boston, Massachusetts (Figure 17). If the 95th percentile rainfall event (1.52 inches) occurred on the existing site (i.e., with no control measures), 0.98 inches of runoff would be generated and require management. Given these site characteristics, there is adequate area to place appropriately sized bioretention cells to capture the 95th percentile storm event. However, for the purposes of this analysis, unspecified conditions preclude the use of bioretention. As a result, a paver block system was selected as the best onsite control measure and the system was designed such that the necessary design parameters could be achieved by storing some of the volume in the paver media and by infiltrating the remainder of the volume. The runoff from the 95th percentile rainfall event could be retained by installing a paver block area totaling 0.4 and 0.8 acres assuming soil types B and C, respectively (Table 12). For the purposes of this case study, a total of 1.5 acres of parking lot was made available to accommodate the paver block system. The area retrofitted with paver blocks would primarily be dedicated for use as parking stalls.
Figure 17. Actual Site and Onsite Control Measures (Boston, MA)
Table 12. Estimated Sizes of Onsite Control Measures for Scenario #6 (Boston, MA)
Total Area (acres) 3.5 Estimated Imperviousness (%) 69% 95th Percentile Rainfall Event (inches) 1.52 Expected Runoff for the 95th Percentile Rainfall Event (inches) 0.98 Stormwater Management Area Required Hydrologic Soil Group B C
Paver block area estimated by Direct Determination (acres) 0.4 0.8 With onsite controls 0.59 0.71 Off-site storage necessary to control
10-yr event of 4.5 inches (acre-ft) Without onsite controls 0.89 0.96

Section 438 Technical Guidance December 2009
47
Scenario #7 - Atlanta, GA A 21-acre site with 70% impervious area was selected in Atlanta, Georgia (Figure 18). If the 95th percentile rainfall event (1.77 inches) occurred on the existing site (i.e., with no control measures), 1.17 inches of runoff would be generated and require management. The runoff from the 95th percentile rainfall event could not be adequately retained solely with bioretention systems. Based on the technical considerations of constructing and maintaining control measures at the site, it was assumed that up to 15% of the pervious area could be converted into bioretention cells and up to 40% of paved area could be converted into a paver block system. If the stormwater management techniques used on the site includes both bioretention and paver blocks as presented in Table 13, then all runoff for the 95th percentile rainfall event would be controlled.
Figure 18. Actual Site and Onsite Control Measures (Atlanta, GA)
Table 13. Estimated Sizes of Onsite Control Measures for Scenario #7 (Atlanta, GA)
Total Area (acres) 21 Estimated Imperviousness (%) 70% 95th Percentile Rainfall Event (inches) 1.77 Expected Runoff for the 95th Percentile Rainfall Event (inches) 1.17 Stormwater Management Area Required Hydrologic Soil Group B C
Bioretention estimated by the Direct Determination (acres) 0.9 Paver block area estimated by the Direct Determination (acres) 0.9 3.2*
Bioretention estimated by TR-55 0.8** 0.9 Paver block area estimated by TR-55 0** 1.84
With onsite controls 5.85 6.62 Off-site storage necessary to control 10-yr event of 6.0 inches (acre-ft) Without onsite controls 7.25 8.49
*The size of porous pavement was increased because the bioretention already reached its maximum size based on the site-specific design assumptions. **Because TR-55 estimated smaller runoff in this scenario, bioretention can retain all of the 95th percentile runoff if the site has soil group B.

Section 438 Technical Guidance December 2009
48
For the example site in Atlanta, GA, areas of 1.8 acres for hydrologic soil group B, and 4.1 acres for hydrologic soil group C, would be required to manage the runoff discharged from a 95th percentile rainfall event. Assuming that bioretention practices are only placed in areas that are currently pervious or landscaped, a total of 6.2 acres of pervious area is available for the placement of bioretention systems. The design storage depth of media within the designated bioretention area was 10 inches. Permeable pavement systems could be used to treat the remaining volume on the 10.8 acres of existing paved area. In applying the TR-55 model, the overall curve numbers for the site were 87 and 91 for Group B and C soils, respectively. TR-55 was used to estimate 0.73 inches of runoff for soil group B and 0.97 inches for soil group C, which are smaller numbers than the 1.17 inches of runoff estimated by the Direct Determination method. As a result, the sizes of the onsite control measures designed using the TR-55 model were smaller than those designed using the Direct Determination method. Note: It is recommended that caution be exercised when using TR-55 to model storms less than 0.5 inches per event. See application of TR-55 in Table 5. Cost estimates were also developed for this scenario (Table 14) to compare the costs to install onsite control measures to retain the 95th percentile rainfall event, and costs to install traditional stormwater management controls (e.g., primarily curb and gutter with off-site retention). The cost estimates were developed for Hydrologic Soil Group B. Table 14. Estimated Costs for Scenario #7 (Atlanta, GA) Sizes of Onsite Control Practices Controls for 95th Percentile Event Traditional Stormwater Controls Rainfall depth (in) 1.77 Bioretention (acres) 0.94 Paver blocks (acres) 0.86
WQV (ac-ft) - 1.75 Off-site Pond 10-Yr Fld Cntr (ac-ft) 0.84 0.0
Total Off-Site Requirement (ac-ft) 0.84 1.75 Land Area (assumes avg 3 ft depth) 0.28 0.58 % of the site 8.5% Costs of Onsite Control Practices Biorention/alternative $232,923 $30,617 Paver block/alternative $236,878 $88,409
WQV (ac-ft) $0 $72,888 Off-site Pond 10-Yr Fld Cntr (ac-ft) $39,648 $0 Pipe $54,827 $191,095 Infrastructure Inlet $52,080 $79,360
Land Area (assumes $300K/acre) $84,000 $175,000 Sum $700,356 $637,368 % difference from Traditional 9.9%

Section 438 Technical Guidance December 2009
49
Scenario #8 - Cincinnati, OH A 19-acre site with 51% impervious area was selected in Cincinnati, Ohio (Figure 19). If the 95th percentile rainfall event (1.45 inches) occurred on the existing site (i.e., with no control measures), 0.68 inches of runoff would be generated and require management. The runoff from the 95th percentile rainfall event could be retained by the installation of bioretention systems totaling 0.8 acres if the hydrologic soil group B is present or 1.3 acres if hydrologic soil group C (Table 9) is the predominant soil type on the site. Assuming that bioretention practices are only placed in areas that are currently pervious or landscaped, a total of 9.4 acres of pervious area is available for the placement of bioretention systems. The design storage depth of media within the designated bioretention area was 8 inches. Scenario #8 represents an alternative to the Cincinnati, scenario in #3 (Figure 14). In this case, hydrologic soil group D was selected to represent the soil characteristics present for the entire site. Alternatively, simulations could have been run under the assumption that the use of infiltration practices were precluded by contaminated soils or high ground water tables. Under these site conditions, bioretention options are severely limited and cannot be used to adequately capture the entire 95th percentile storm event. As a result, options such as cisterns and green roofs were considered. In the absence of management practices, the 95th percentile rainfall event discharges 1.45 inches of stormwater and 0.53 inches of this runoff is captured by onsite depression storage. The difference, 0.92 inches of runoff, would then require capture and management. Based on the technical considerations of constructing and maintaining controls at the site, it was assumed that up to 20% of pervious area can be converted into bioretention areas; up to 30% of paved area can be converted into porous pavement; and up to 30% of the rooftop area can be converted into green roofs. Cisterns can be added to the system if additional storage volume is required. It should be noted that green roofs were selected lowest in the hierarchy of practices evaluated because of cost and potential structural issues associated with design and placement on existing buildings. By using the four onsite control options as presented in Table 15, all runoff for the 95th percentile rainfall event would be retained. From a management perspective, it was assumed that the design storage depth within the designated bioretention area was 6 inches because of the low infiltration rates adopted for this scenario.

Section 438 Technical Guidance December 2009
50
Figure 19. Actual Site and Onsite Control Measures (Cincinnati, OH)
Table 15. Estimated Sizes of Onsite Control Measures for Scenario #8 (Cincinnati, OH)
Total Area (acres) 19 Estimated Imperviousness (%) 51% 95th Percentile Rainfall Event (inches) 1.45 Expected Runoff for the 95th Percentile Rainfall Event (inches) 0.92 Stormwater Management Applied Hydrologic Soil Group D
Bioretention estimated by Direct Determination (acres) 1.9 Paver block area estimated by Direct Determination (acres) 2.4
Green Roof estimated by Direct Determination (acres) 0.5 Cisterns estimated by Direct Determination (gallons) 13,000
This site contains a total of 9.4 acres of pervious area, 8.0 acres of paved area, and 1.6 acres of rooftop area. If 1.9 acres (20%) of the pervious area were converted to bioretention cells; 2.4 acres (30%) of parking lot converted to paver blocks; and 0.5 acres (30%) of rooftop area were retrofitted to green roof areas for this site, then 97% of stormwater runoff from the 95th percentile storm would be captured on site. By also adding one or more cisterns (as indicated in Figure 19), an additional 13,000 gallons could be captured, thus illustrating that 100% of the rainfall from the 95th percentile event can be managed onsite with GI/LID practices.

Section 438 Technical Guidance December 2009
51
Scenario #9 – Norfolk, VA A 1.6 acre site with 91% impervious area was selected from Norfolk, Virginia. Table 16 contains the land use categories for the site. Figure 20 depicts the site and associated facilities. Site specific factors based on an METF analysis allow management of 75 % of the 95th percentile storm onsite (1.27 inches). The remaining portion of the 95th percentile rainfall event (0.41 inches would be discharged off of the site.
Table 16. Land Use Determination After Redevelopment
Land Use Acres Site Coverage Percent
Building 0.90 56.3
Parking 0.35 21.9
Streets/Sidewalks 0.20 12.5
Undeveloped 0.15 9.3
Total 1.60 100%
Figure 20. Proposed Redevelopment Scenario

Section 438 Technical Guidance December 2009
52
Figure 21. Location of Facility (Norfolk, VA) Site conditions and intended uses limited the number of practices that were technically feasible to use onsite to manage runoff. For example, the use of a green roof was not feasible because the project includes the construction of an airplane hanger which lacks the structural strength to support a green roof. Cisterns were also not included in the set of suitable practices based on the analysis, which considered the number of people and amount of daily water use at the site, i.e., 40 people x 3.5 toilet flushes per day would use only 280 gallons of runoff per day or 2,000 gallons per week. Stormwater use for HVAC make-up would also be negligible based on the typical cooling system design. To put things in perspective, if the hanger rooftop covers the entire building footprint, 41,000 gallons of runoff would be generated from a 1.68 inch rainfall. Assuming a drawdown of 2,000 gallons per week based on toilet flushing, the users would only use 5% of the 95th percentile event. Because of the relatively large volume of water that would need to be collected and used, cisterns were not considered a feasible option to manage a significant volume of runoff at the site. However, site conditions did allow for the use of both permeable pavement and bioretention practices. Approximately 0.15 acres (6,500 sf) of the proposed site is undeveloped and available for bioretention. Based on Department of Defense facility requirements, ten percent of the parking area is designed with landscaping, usually around the perimeter and in landscaped islands. If this ten percent were designed as bioretention cells, then 0.035 acres of bioretention would be achieved. If bioretention cells were also placed in about 30% of the undeveloped area of the project, then an additional 0.045 acres of bioretention could be implemented. Note: not all undeveloped land was assumed to be available for bioretention because of conflicts with site
Redevelopment Site

Section 438 Technical Guidance December 2009
53
utilities, security and anti-terrorism requirements and slopes that limited the use of infiltration practices directly adjacent to the hanger.
Figure 22. Actual Site and Onsite Control Measures (Norfolk, VA)
Table 17. Estimated Sizes of Onsite Control Measures for Scenario #9 (Norfolk, VA)
Total Area (acres) 1.6 Estimated Imperviousness (%) 91% 95th Percentile Rainfall Event (inches) 1.68 Expected Runoff for the 95th Percentile Rainfall Event (inches) 1.50 Stormwater Management Area Required Hydrologic Soil Group D
Porous Pavement estimated by Direct Determination method (acres) 0.21 Bioretention estimated by Direct Determination method (acres) 0.08
The bioretention cells were designed with an effective storage depth of 10 inches, which included a depth from media surface to outlet of 10 inches. In this case study, state regulations precluded the project from taking credit for the storage potential provided by the void space within the bioretention cell media. Similarly, approximately 0.55 acres of the proposed site is impervious due to parking lots, streets, and sidewalks. Due to manufacturer’s recommendations that permeable pavement materials not be used in applications subject to heavy loads and potential pollutant exposure the access roads and parking lot access isles were assumed to be constructed from conventional impervious concrete or asphalt. Thus 60% of the parking area (primarily parking stalls and sidewalks), which is about 38% of the entire paved area, is assumed to be suitable for paver blocks. A high water table at the site limited the modeled net storage depth under paver blocks placed in the parking areas and sidewalks to four inches. This storage was calculated using the assumption that the pavement sub-base of 12 inches would have a minimum void space of approximately 30%.

Section 438 Technical Guidance December 2009
54
COMPARISON OF THE RUNOFF ESTIMATION METHODS As illustrated in each of the case studies above, runoff of the 95th percentile storm was estimated in order to size onsite control measures. These estimates were produced by applying four different methods: the Direct Determination method, the Rational Method, the NRCS TR-55, and the EPA SWMM. The results comparing each of these methods for scenarios 1-7 are presented in Table 18. Table 18. Comparison of the estimated runoff (unit: inches)
Method Direct
Determination Rational Method TR-55 SWMM Soil Groups B C B C B C B C
1 Charleston, WV 0.82 0.82 0.83 0.84 0.36 0.53 0.82 0.83 2 Denver, CO 0.53 0.53 0.57 0.59 0.12 0.26 0.53 0.53 3 Cincinnati, OH 0.68 0.68 0.73 0.76 0.26 0.46 4 Portland, OR 0.86 0.86 0.86 0.86 0.63 0.71 5 Phoenix, AZ 0.42 0.42 0.46 0.48 0.06 0.17 6 Boston, MA 0.98 0.98 0.99 1.00 0.51 0.70 7 Atlanta, GA 1.17 1.17 1.17 1.19 0.73 0.97 1.19 1.23
As shown in the above table, the estimated runoff results from direct determination, the Rational Method, and SWMM are relatively similar. Runoff volumes using TR-55 are lower than the other estimates. SWMM modeling results using NRCS 24-hour rainfall distributions were nearly identical to the results based on uniform distribution. Table 19. Applicability of the methods for analyzing onsite control measures
Purpose Direct
Determination Rational Method TR-55* SWMM Planning Tool Applicable Applicable Applicable Applicable Preliminary Design Applicable Applicable Applicable Applicable Detailed Design Not applicable Not applicable Not applicable Applicable Actual Assessment (Long-term) Not applicable Not applicable Not applicable Applicable Water Quality Not applicable Not applicable Not applicable Applicable
*Use with caution when applying this method for small storms CONCLUSIONS Although sites varied in terms of climate and soil conditions, in most of the scenarios selected, the 95th percentile storm event could be managed onsite with GI/LID systems. There are other infiltration, evapotranspiration and capture and use stormwater management options available than those used in these analyses. These options provide site managers additional flexibility to choose appropriate systems and practices to manage site runoff.

Section 438 Technical Guidance December 2009
55
REFERENCES Booth, Derek Direct Testimony. 2008. Pollution Control Hearings Board for the State of Washington, Puget Soundkeeper Alliance and People for Puget Sound; Pierce County Public Works and Utilities Department; City of Tacoma; The Port of Seattle; Snohomish County; Clark County; and Pacificorp and Puget Sound Energy, Appellants, vs. Department of Ecology, Respondent, and King County; City of Seattle; Port of Tacoma, and Washington State Department of Transportation, Intervenors, August 2008. California Department of Transportation (Caltrans). 2003. Caltrans Storm Water Quality Handbooks. California Department of Transportation. Casey Trees. 2007. The Case for Trees – Relief from Summer Heat, www.caseytrees.org/resources/casefortrees.html. Galli, John. 1991. Thermal Impacts Associated with Urbanization and Stormwater Best Management Practices in Maryland, Anacostia Restoration Team for the Maryland Department of the Environment, Washington, DC. Grant, Gary, Luke Engleback and Barry Nicholson. 2003. Green Roofs: Their Existing Status and Potential for Conserving Biodiversity in Urban Areas, Report Number 498, English Nature Research Reports. Hathaway, J., and W.F. Hunt. 2007. Stormwater BMP Costs. North Carolina Department of Environment and Natural Resources. www.bae.ncsu.edu/stormwater/PublicationFiles/DSWC.BMPcosts.2007.pdf. Hirschman, David and John Kosco. 2008. Managing Stormwater in Your Community: A Guide for Building an Effective Post-Construction Program, Center for Watershed Protection, www.cwp.org/postconstruction. Holz, Thomas Written Direct Testimony. 2008. Pollution Control Hearings Board for the State of Washington, Puget Soundkeeper Alliance and People for Puget Sound; Pierce County Public Works and Utilities Department; City of Tacoma; The Port of Seattle; Snohomish County; Clark County; and Pacificorp and Puget Sound Energy, Appellants, vs. Department of Ecology, Respondent, and King County; City of Seattle; Port of Tacoma, and Washington State Department of Transportation, Intervenors, August 2008. Horner, Richard Direct Testimony. 2008. Pollution Control Hearings Board for the State of Washington, Puget Soundkeeper Alliance and People for Puget Sound; Pierce County Public Works and Utilities Department; City of Tacoma; The Port of Seattle; Snohomish County; Clark County; and Pacificorp and Puget Sound Energy, Appellants, vs. Department of Ecology, Respondent, and King County; City of Seattle; Port of Tacoma, and Washington State Department of Transportation, Intervenors, August 2008.

Section 438 Technical Guidance December 2009
56
National Climatic Data Center (NCDC). 2007. NCDC precipitation data, CD-ROM, National Climatic Data Center. National Research Council. 2008. Urban Stormwater Management in the United States, The National Academies Press, Washington, DC. Shaver, E., R. Horner, J. Skupien, C. May, and G. Ridley. 2007. Fundamentals of Urban Runoff Management: Technical and Institutional Issues – 2nd Edition, North American Lake Management Society, Madison, WI. Schueler, T. and M. Helfrich. 1988. “Design of Wet Extended Detention Pond Systems,” Design of Urban Runoff Controls, L. Roesner and B. Urbonas eds., American Society of Civil Engineers, New York, NY. Schueler, T and H. Holland. 2000. The Practice of Watershed Protection: Techniques for Protecting our Nation’s Streams, Lakes, Rivers, and Estuaries. Center for Watershed Protection, Ellicott City, MD. U.S. Department of Agriculture, Natural Resources Conservation Service. 2007. National Engineering Handbook, title 210–VI. Part 630, chapter 7. Washington, DC. http://directives.sc.egov.usda.gov/. U.S. Department of Agriculture, Soil Conservation Service. 1986. Urban Hydrology for Small Watersheds. Technical Release No. 55. Second Edition. Washington, D.C. U.S. Environmental Protection Agency, Managing Wet Weather with Green Infrastructure, www.epa.gov/greeninfrastructure. Vingarzan and Taylor. 2003. Trend Analysis of Ground Level Ozone in the Greater Vancouver/ Fraser Valley Area of British Columbia, Environment Canada – Aquatic and Atmospheric Sciences Division.
Wisconsin DNR. 2008. Impact of Redevelopment on TSS Loads, Runoff Management, available at http://www.dnr.state.wi.us/runoff/pdf/rules/nr151/Impact_of_RedevTSSLoads_021308.pdf.

Section 438 Technical Guidance December 2009
57
APPENDIX A: Runoff Methodology Parameter Assumptions Runoff from each land cover was estimated by the following equation: Runoff = Rainfall – Depression Storage – Infiltration Loss (1) Depression Storage Reference depression storage (inches)
Reference Impervious Pervious 1 0.05 - 0.1 0.1 - 0.3 2 0.01 - 0.11 0.02 - 0.6 3 0.1 0.2
1. ASCE, (1992). Design & Construction of Urban Stormwater Management Systems. New York, NY. 2. Marsaleck, J., Jimenez-Cisreros, B., Karamouz, M., Malmquist, P-R., Goldenfum, J., and Chocat, B.
(2007). Urban Water Cycle Processes and Interactions. Urban Water Series, UNESCO-IHP, Tyler & Francis.
3. Walesh, S. G. (1989).Urban Surface Water Management. John Wiley & Sons, Inc. Based on the above reference data, depression storage (or initial abstraction, the rainfall required for the initiation of runoff) to the direct determination method was assumed as follows:
Rooftop: 0.1 inches Pavement: 0.1 inches Pervious area: 0.2 inches
Infiltration Infiltration loss occurs only in pervious areas. In this analysis, infiltration was estimated by Horton’s equation: Ft = fmin + (fmax – fmin) e
- k t (2) where, Ft = infiltration rate at time t (in/hr), fmin = minimum or saturated infiltration rate (in/hr), fmax = maximum or initial infiltration rate (in/hr), k = infiltration rate decay factor (/hr), and t = time (hr) measured from time runoff first discharged into infiltration area
Reference infiltration parameters Maximum infiltration rate (in.hr), fmax
Partially dried out with Dry soils with Infiltration (in/hr) No vegetation Dense vegetation No vegetation Dense vegetation Sandy 2.5 5 5 10 Loam 1.5 3 3 6
Clay 0.5 1 1 2 Reference: Huber, W. C. and Dickinson, R. (1988). Storm Water Management Model User’s Manual, Version 4. EPA/600/3-88/001a (NTIS PB88-236641/AS), U.S. Environmental Protection Agency, Athens, GA.

Section 438 Technical Guidance December 2009
58
Minimum infiltration rate (in/hr), fmin
Hydrologic Soil Group Infiltration (in/hr)
A 0.45 - 0.30 B 0.30 - 0.15 C 0.15 - 0.05 D 0.05 - 0
A: well drained sandy; D: poorly drained clay Reference: Huber, W. C. and Dickinson, R. (1988). Storm Water Management Model User’s Manual, Version 4. EPA/600/3-88/001a (NTIS PB88-236641/AS), U.S. Environmental Protection Agency, Athens, GA. Decay coefficient, k
Soils k (sec-1) k (hr-1) 0.00056 2 0.00083 3 0.00115 4
Sandy
Clay 0.00139 5 Reference: Huber, W. C. and Dickinson, R. (1988). Storm Water Management Model User’s Manual, Version 4. EPA/600/3-88/001a (NTIS PB88-236641/AS), U.S. Environmental Protection Agency, Athens, GA. Based on the above reference data, infiltration parameters to the direct determination method were assumed as follows:
Hydrologic Soil Group B Maximum infiltration rate: 5 in/hr Minimum infiltration rate: 0.3 in/hr Decay factor: 2 /hr
Hydrologic Soil Group C Maximum infiltration rate: 3 in/hr Minimum infiltration rate: 0.1 in/hr Decay factor: 3.5 /hr
Hydrologic Soil Group D Maximum infiltration rate: 1 in/hr Minimum infiltration rate: 0.02 in/hr Decay factor: 5 /hr
Infiltration loss for the 24-hr rainfall duration was estimated by the following equations with assumptions of a half hour ∆t:
Infiltration Loss at the nth time-step = (f ·∆t) = })2/){( 1 tff nn (3)
Integrated Infiltration Loss for 24 hours = ∑ (f ·∆t) (4)
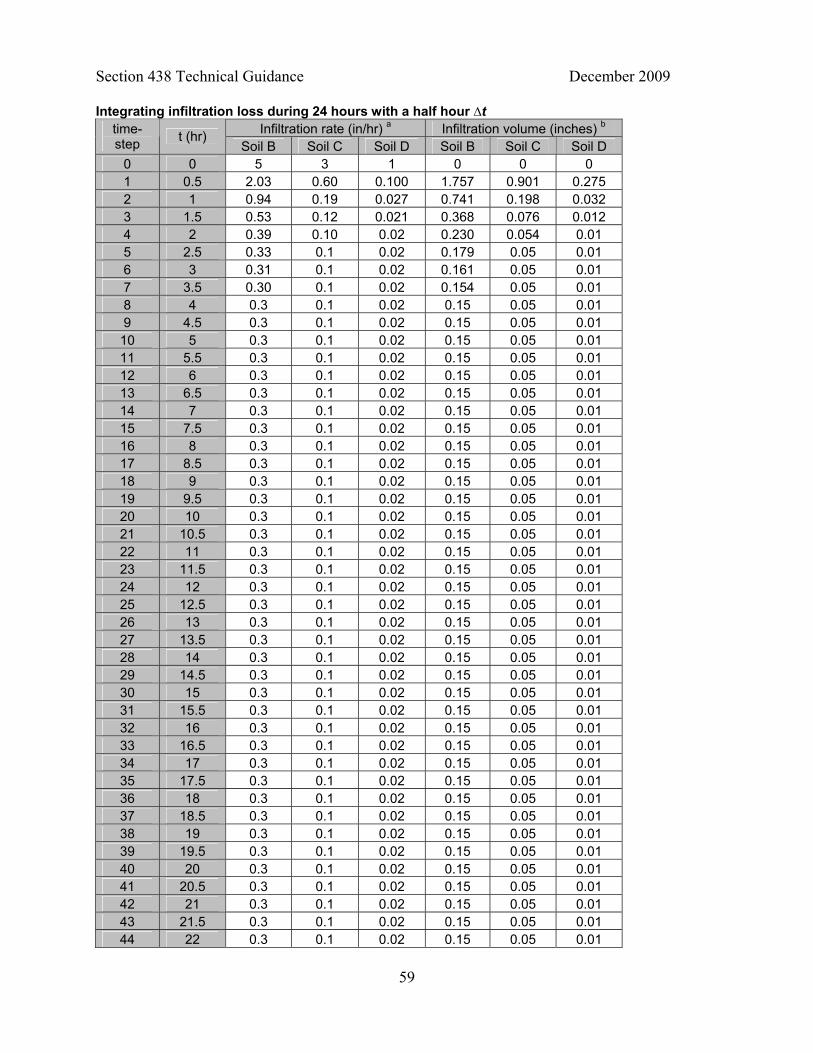
Section 438 Technical Guidance December 2009
59
Integrating infiltration loss during 24 hours with a half hour ∆t Infiltration rate (in/hr) a Infiltration volume (inches) b time-
step t (hr)
Soil B Soil C Soil D Soil B Soil C Soil D 0 0 5 3 1 0 0 0 1 0.5 2.03 0.60 0.100 1.757 0.901 0.275 2 1 0.94 0.19 0.027 0.741 0.198 0.032 3 1.5 0.53 0.12 0.021 0.368 0.076 0.012 4 2 0.39 0.10 0.02 0.230 0.054 0.01 5 2.5 0.33 0.1 0.02 0.179 0.05 0.01 6 3 0.31 0.1 0.02 0.161 0.05 0.01 7 3.5 0.30 0.1 0.02 0.154 0.05 0.01 8 4 0.3 0.1 0.02 0.15 0.05 0.01 9 4.5 0.3 0.1 0.02 0.15 0.05 0.01 10 5 0.3 0.1 0.02 0.15 0.05 0.01 11 5.5 0.3 0.1 0.02 0.15 0.05 0.01 12 6 0.3 0.1 0.02 0.15 0.05 0.01 13 6.5 0.3 0.1 0.02 0.15 0.05 0.01 14 7 0.3 0.1 0.02 0.15 0.05 0.01 15 7.5 0.3 0.1 0.02 0.15 0.05 0.01 16 8 0.3 0.1 0.02 0.15 0.05 0.01 17 8.5 0.3 0.1 0.02 0.15 0.05 0.01 18 9 0.3 0.1 0.02 0.15 0.05 0.01 19 9.5 0.3 0.1 0.02 0.15 0.05 0.01 20 10 0.3 0.1 0.02 0.15 0.05 0.01 21 10.5 0.3 0.1 0.02 0.15 0.05 0.01 22 11 0.3 0.1 0.02 0.15 0.05 0.01 23 11.5 0.3 0.1 0.02 0.15 0.05 0.01 24 12 0.3 0.1 0.02 0.15 0.05 0.01 25 12.5 0.3 0.1 0.02 0.15 0.05 0.01 26 13 0.3 0.1 0.02 0.15 0.05 0.01 27 13.5 0.3 0.1 0.02 0.15 0.05 0.01 28 14 0.3 0.1 0.02 0.15 0.05 0.01 29 14.5 0.3 0.1 0.02 0.15 0.05 0.01 30 15 0.3 0.1 0.02 0.15 0.05 0.01 31 15.5 0.3 0.1 0.02 0.15 0.05 0.01 32 16 0.3 0.1 0.02 0.15 0.05 0.01 33 16.5 0.3 0.1 0.02 0.15 0.05 0.01 34 17 0.3 0.1 0.02 0.15 0.05 0.01 35 17.5 0.3 0.1 0.02 0.15 0.05 0.01 36 18 0.3 0.1 0.02 0.15 0.05 0.01 37 18.5 0.3 0.1 0.02 0.15 0.05 0.01 38 19 0.3 0.1 0.02 0.15 0.05 0.01 39 19.5 0.3 0.1 0.02 0.15 0.05 0.01 40 20 0.3 0.1 0.02 0.15 0.05 0.01 41 20.5 0.3 0.1 0.02 0.15 0.05 0.01 42 21 0.3 0.1 0.02 0.15 0.05 0.01 43 21.5 0.3 0.1 0.02 0.15 0.05 0.01 44 22 0.3 0.1 0.02 0.15 0.05 0.01

Section 438 Technical Guidance December 2009
60
45 22.5 0.3 0.1 0.02 0.15 0.05 0.01 46 23 0.3 0.1 0.02 0.15 0.05 0.01 47 23.5 0.3 0.1 0.02 0.15 0.05 0.01 48 24 0.3 0.1 0.02 0.15 0.05 0.01
Sum: Infiltration loss during 24 hours c 9.743 3.430 0.769 a Calculated infiltration rate at each time by Equation (2) b Calculated infiltration volume from the previous time to the current time by Equation (3) c Integrated infiltration volume for 24 hours with a half hour ∆t by Equation (4) Based on the above calculation, 24-hr infiltration losses for pervious areas and bioretention areas were modeled as follows:
Soil Group B: 9.743 inches Soil Group C: 4.430 inches Soil Group D: 0.769 inches
Infiltrations of underlying soils at paver blocks were modeled conservatively by applying the minimum infiltration rate for each soil type (Infiltration loss = fmin · 24) because the soils under the paver blocks may require or be subjected to some compaction for engineering stability. The estimated infiltration losses for each soil are presented below:
Soil Group B: (0.3 in/hr) · (24 hrs) = 7.2 inches Soil Group C: (0.1 in/hr) · (24 hrs) = 2.4 inches Soil Group D: (0.02 in/hr) · (24 hrs) = 0.48 inches
Design Storage of Management Practices Bioretention
Reference Ponding (inches)1
Mulch (inches)
Soil media (ft)
Soil Media Porosity
Underdrain
1 up to 12 2 - 4
(optional) 1 - 1.5 about 40%
bioretention systems utilize infiltration rather than an underdrain
2 6 - 12 2 - 3 2.5 - 4 about 40% recommended, especially if initial testing infiltration rate < 0.52 in/hr
3 6 - 12 2 - 4 4 2 - 3 1.5 - 4 if necessary 5 up to 6 1.5 - 2 30 - 40% Optional
6 6 - 18 as
needed 2 - 4 if necessary
1. State of New Jersey. (2004). New Jersey Stormwater Best Management Practices Manual
www.nj.gov/dep/stormwater/tier_A/pdf/NJ_SWBMP_9.1 print.pdf. 2. Maryland Department of the Environment (MDE), (2000). 2000 Maryland Stormwater Design Manual,
Volumes I & II, prepared by the Center for Watershed Protection and the Maryland Department of the Environment, Water Management Administration, Baltimore, MD. www.mde.state.md.us/Programs/WaterPrograms/SedimentandStormwater/stormwater_design/index.asp.
1 Ponding is a measure of retention capacity

Section 438 Technical Guidance December 2009
61
3. Clar, M. L. and R. Green, (1993). Design Manual for Use of Bioretention in Storm Water Management, prepared for the Department of Environmental Resources, Watershed Protection Branch, Prince George's County, MD, prepared by Engineering Technologies Associates, Inc. Ellicott City, MD, and Biohabitats, Inc., Towson, MD.
4. U.S. Environmental Protection Agency. (1999). Storm Water Technology Fact Sheet: Bioretention. EPA 832-F-99-012. Office of Water. US Environmental Protection Agency. Washington, D.C. www.epa.gov/owm/mtb/biortn.pdf.
5. Prince George's County. Bioretention Design Specifications and Criteria. Prince George's County, Maryland. www.co.pg.md.us/Government/AgencyIndex/DER/ESG/Bioretention/pdf/bioretention_design_manual.pdf.
6. City of Indianapolis. (2008). Indianapolis Stormwater Design Manual. www.sustainindy.org/assets/uploads/4_05_Bioretention.pdf.
Paver Blocks Reference Media (inches) Void Space
1 12 or more 40% 2 9 or more 40% 3 12 - 36 40%
1. Univ. of California at Davis. (2008). Low Impact Development Techniques: Pervious Pavement.
http://extension.ucdavis.edu/unit/center_for_water_and_land_use/pervious_pavement.asp. 2. AMEC Earth and Environmental, Center for Watershed Protection, Debo and Associates, Jordan Jones
and Goulding, and Atlanta Regional Commission. (2001). Georgia Stormwater Management Manual Volume 2: Technical Handbook www.georgiastormwater.com/.
3. Subsurface Infiltration Bed. www.tredyffrin.org/pdf/publicworks/CH2 - BMP4 Infiltration Bed.pdf. Green Roofs Reference Media (inches)
1 3 - 4 2 1 - 6 3 2 - 6
1. Charlie Miller. (2008). Extensive Green Roofs. Whole Building Design Guide (WBDG).
www.wbdg.org/resources/greenroofs.php. 2. Great Lakes WATER Institute. Green Roof Project: Green Roof Installation.
www.glwi.uwm.edu/research/genomics/ecoli/greenroof/roofinstall.php. 3. Paladino & Company. (2004). Green Roof Feasibility Review. King County Office Project.
http://your.kingcounty.gov/solidwaste/greenbuilding/documents/KCGreenRoofStudy_Final.pdf. Based on the above reference data, design storages to the direct determination method were assumed as follows:
Bioretention: up to 10 inches (depending on practice used, site conditions, etc.) Green roof: 1 inch (2.5 inches deep media with 40% void space) Porous pavement: 4 inches (10 inches deep media with 40% void space)
Factors that influence total storage available include, ponding depth, available media void space, and supplemental storage if the system is designed with gravel or open pipes underneath the media.