Embed Size (px)
Citation preview
Technical Evaluation ReportTAACOS: Target Acquisition with the TA1 Mirror
Date: February 1, 2001Document Number: COS-11-0027Revision: Initial ReleaseContract No.: NAS5-98043CDRL No.: N/A
Prepared By:S. Penton, COS Software Scientist, CU/CASA Date
Reviewed By:I. Becker, COS Software Consultant, BATC Date
Reviewed By:K. Brownsberger, COS Sr. Software Scientist, CU/CASA Date
Approved By:T. Keyes, Scientist, STSCI Date
Approved By:D. Ebbets, COS Software Consultant, BATC Date
Approved By:Jim Green, COS Principal Investigator Date
Approved By:Erik Wilkinson, COS Scientist Date
Approved By:John Andrews, COS Experiment Manager Date
Center for Astrophysics & Space AstronomyUniversity of Colorado
Campus Box 593Boulder, Colorado 80309

REVISIONSLetter ECO No. Description Check Approved Date
- Initial Release
Original Release THE UNIVERSITY OF COLORADOName: Date At Boulder
Drawn: S. Penton 2/1/2001 The Center for Astrophysics and Space AstronomyReviewed: Technical Evaluation ReportApproved: “TAACOS: Target Acquisition with the TA1 Mirror”
Size Code Indent No. Document No. Rev
A COS-11-0027 -Scale:N/A
COS-11-0027February 1, 2001
Center for Astrophysics & Space Astronomy Initial Release
Technical Evaluation Report“TAACOS: Target Acquisition with the TA1 Mirror”
University of Colorado at Boulder Page i
TABLE OF CONTENTS
1. SCOPE.................................................................................................................... 21.1 BACKGROUND................................................................................................. 21.2 DOCUMENT OVERVIEW................................................................................. 3
2. APPLICABLE DOCUMENTS ............................................................................... 33. LIST OF ACRONYMS AND ABBREVIATIONS.................................................. 44. NUV DETECTOR OVERVIEW AND PERFORMANCE ANALYSIS .................. 5
4.1 BACKGROUND AND THE NUV DETECTOR COORDINATE SYSTEM ...... 54.2 THE HST POINT SPREAD FUNCTION AND COS SCIENCE APERTURES.. 64.3 TAACOS: INPUT SPECTRUM.......................................................................... 74.4 COS EFFICIENCES AND DETECTOR NOISE................................................. 74.5 DETECTOR BLURRING ................................................................................... 84.6 MECHANISM WOBBLES AND EXTRACTION SUBARRAYS ...................... 9
5. LTAIMCAL.......................................................................................................... 115.1 INTRODUCTION............................................................................................. 115.2 ANALYSIS....................................................................................................... 115.3 OSM1 MECHANISM ADJUSTMENT............................................................. 14
6. LTAIMAGE: TARGET ACQUISITION USING THE TA1 MIRROR ................. 146.1 INTRODUCTION............................................................................................. 146.2 ANALYSIS....................................................................................................... 156.3 LTAIMAGE EXPOSURE TIMES .................................................................... 206.4 LTAIMAGE TIMING....................................................................................... 23
7. SUMMARY.......................................................................................................... 23
TABLE OF FIGURES
FIGURE 1: NUV DETECTOR COORDINATE SYSTEM.. ........................................... 5FIGURE 2: THE HST PSF AS COMPARED TO THE COS PSA. ................................. 6FIGURE 3: HST+COS NUV TA1 EFFECTIVE AREAS. .............................................. 8FIGURE 4: TA1 EXTRACTION SUBARRAY SUMMARY. ...................................... 10FIGURE 5: TA1 CALIBRATION LAMP IMAGE. ...................................................... 12FIGURE 6: PREDICTED MAXIMUM LTAIMCAL CENTROID CALCULATION
ERRORS............................................................................................................... 13FIGURE 7: DISPERSION DIRECTION POINTING ACCURACY COMPARISON. .. 17FIGURE 8: CROSS DISPERSION POINTING ACCURACY COMPARISON ........... 18FIGURE 9: TA1 IMAGE OF TWO POINT SOURCES................................................ 19FIGURE 10 : COUNT RATE OF BRIGHTEST PIXEL VS. MEAN QSO TARGET
FLUX FOR TA1 IMAGES. .................................................................................. 21FIGURE 11: LTAIMAGE EXPOSURE TIMES REQUIRED TO REACH S/N = 10.... 22

COS-11-0027February 1, 2001
Center for Astrophysics & Space Astronomy Initial Release
Technical Evaluation Report“TAACOS: Target Acquisition with the TA1 Mirror”
University of Colorado at Boulder Page 2
1. SCOPE
The purpose of the Target Acquisition Analysis for the Cosmic OriginsSpectrograph (TAACOS, see COS-08-0011) is to ensure that the algorithms andprocedures defined in COS OP-01, IN0090-619, IN0090-623 and COS-FSW-001 aresufficient to accurately place a science target of interest at a proper location in theaperture in a timely and efficient fashion. This document focuses solely upon ourTAACOS simulations of target acquisitions (TA) with the TA1 mirror and the COS NUVchannel. This topic was first addressed in COS-11-0024 (TAACOS: NUV Phase IReport). The TA1 discussion in COS-11-0024 has been expanded in this document.Further investigation into this topic has revealed additional operational complexities thathave required us to modify our initial conceptualization of this TA mode. This documentwill outline our modifications for the LTAIMAGE TA mode, and introduce a new TAcalibration lamp image mode (LTAIMCAL) which must be performed before eachscience target TA1 mirror TA (LTAIMAGE).
The COS TA requirement is that the science target should be aligned to within 45km/s (~±0.24” for the NUV channel, ~±0.3” for the FUV channel, medium resolution) inthe dispersion direction (DD) in the 3σ case for the medium resolution gratings. TheNUV cross dispersion (XD) requirement is only that the target spectra should be fullycontained in the predicted detector subarray used in spectral extraction. In the XD, targetaccuracies of ±0.5” (22 XD pixels) will ensure that no target flux is vignetted by theaperture. There exists an additional science requirement of allowing for TAs with DDaccuracies of ±15 km/s (±0.08” for the NUV channel, ~±0.10” for the FUV channel,medium resolution) in the dispersion direction in the 3σ case for special observations.This equates to a DD centering accuracy of ~±3.5p.
Changes to our recommendations for the TA flight software (FSW), based uponthis document, will be given in a revision (Rev A) of COS-11-0014. For further details ofthe TAACOS project, see COS-08-0011 or http://cos-arl.colorado.edu/TAACOS.
1.1 BACKGROUND
Although most HST/COS TAs are planned to be performed spectroscopicallywithout the aid of sky images, there exists a COS mode which can produce broadbandimages suitable for TA. A flat mirror, TA1, can be rotated into the NUV optical pathusing the second (NUV) optical selection mechanism (OSM2). In this mode an image ofthe sky will be projected onto the NUV MAMA detector after reflection off the NCM3bmirror. This document details the proposed algorithms for this mode of TA.
The simulator and the analysis are performed using ray-tracing and other softwaredeveloped using the Interactive Data Language (IDL) at CU/CASA. This effort relies

COS-11-0027February 1, 2001
Center for Astrophysics & Space Astronomy Initial Release
Technical Evaluation Report“TAACOS: Target Acquisition with the TA1 Mirror”
University of Colorado at Boulder Page 3
heavily on ground-based estimations of the COS in-orbit performance. Final TA FSWalgorithms will be tested during the integration and testing (I&T) phase of the COSdevelopment.
1.2 DOCUMENT OVERVIEW
In §2, we list the applicable COS documentation related to this report. In §3, welist the abbreviations and acronyms used in this document. In §4, we will briefly reviewthe NUV MAMA detector, the coordinate systems used, the HST point spread function(PSF) at the COS science apertures, the input QSO spectrum, current estimates of theCOS NUV effective areas and noise characteristics, intrinsic detector blurring, estimatesof mechanism wobble and mis-alignment, and recommend LTAIMCAL and LTIMAGETA extraction subarrays. Seasoned TAACOS veterans may wish to skip directly to §4.6(MECHANISM WOBBLES AND EXTRACTION SUBARRAYS). In §5 and §6, we useour TAACOS NUV simulator to test the two imaging target acquisition (TA) phases,LTAIMCAL and LTAIMAGE. In §7, we briefly summarize our NUV imaging TAfindings.
2. APPLICABLE DOCUMENTS
The following documentation describes the algorithms and procedures proposedfor HST/COS target acquisition. The referenced documents are of the revision in effecton the date of the release of this documentCOS-08-0011 TAACOS: Target Acquisition Analysis for the COS (CASA)COS-11-0014 Recommended Flight Software and Operations Changes based (Rev A) on the TAACOS Phase I Reports for the FUV and NUV ChannelsCOS-11-0016 TAACOS: FUV Phase I ReportCOS-11-0017 TAACOS: Detector TA Summary FUV and NUV ImagesCOS-11-0024 TAACOS: NUV Phase I ReportCOS-11-0028 TAACOS: OSM1 Positional Verification FSWCOS-FSW-001 Target Acquisition Concepts for COS (BATC)COS-NUV-001 NUV MAMA Subsystem PerformanceCOS-SYS-022 Current Estimates of COS SensitivityCOS-OP-01 COS Science Operations Requirement Document (CASA)IN0090-619 Control Section Flight Software Requirements Document
for the COS (BATC)IN0090-623 Software Design Document for the Control Section FlightST-ICD-02E Axial Scientific Instruments to Optical Telescope Assembly and Support Systems Module (STSCI)

COS-11-0027February 1, 2001
Center for Astrophysics & Space Astronomy Initial Release
Technical Evaluation Report“TAACOS: Target Acquisition with the TA1 Mirror”
University of Colorado at Boulder Page 4
3. LIST OF ACRONYMS AND ABBREVIATIONS
ACS Aperture Coordinate SystemBOA Bright Object ApertureBOP Bright Object ProtectionBR detector Background count RateCASA Center for Astrophysics and Space AstronomyCOS Cosmic Origins SpectrographCU University of Colorado @ BoulderDD Dispersion Direction (ACS X, IC Y)DCS Detector Coordinate SystemFOS Faint Object SpectrographFSW Flight SoftWareFUV Far UltraVioletFWHM Full Width at Half MaximumGSC2 Guide Star Catalog IIHST Hubble Space TelescopeIC Image Coordinate systemIDL Interactive Data LanguageI&T Integration and TestingLTAIMCAL TA subroutine for IMaging the CALibration lampLTAIMAGE TA subroutine for target Locating with the TA1 mirrorLTASRCH TA subroutine to Locate the target via a spiral SeaRCHMAMA Multi-Anode Microchannel ArrayMBPFC Moving Box Plus Flux-Centroid (STIS) algorithmNUV Near UltraVioletOSM Optical Select Mechanismp PixelPSF Point Spread Function (of HST)PtNe Platinum-Neon (Wavelength Calibration Lamp)PSA Primary Science ApertureQSO Quasi-Stellar ObjectRVMM Rear View Mirror Mode (TA1)s secondSTIS Space Telescope Imaging SpectrographSR Source (target) count RateTA Target AcquisitionTA1 Target Acquisition 1 (one) mirrorTAACOS TA Analysis for COSTS (Spiral) Target SearchXD Cross-Dispersion (ACS Y, IC X) direction

COS-11-0027February 1, 2001
Center for Astrophysics & Space Astronomy Initial Release
Technical Evaluation Report“TAACOS: Target Acquisition with the TA1 Mirror”
University of Colorado at Boulder Page 5
4. NUV DETECTOR OVERVIEW AND PERFORMANCE ANALYSIS
4.1 BACKGROUND AND THE NUV DETECTOR COORDINATE SYSTEM
The COS NUV detector is the STIS flight spare band 2 MAMA. The detector isilluminated by three independent camera mirrors, which are part of the NUV optical path(see COS-11-0001). Each of the three mirrors produces a spectral stripe on the detector.Each of the MAMAs 1024x1024 pixels are 25µm on a side. Figure 1 displays the COSMAMA detector coordinate system (DCS), and shows the location of the three scienceand wavelength calibration stripes. Unlike the FUV DCS, the NUV dispersion direction(DD) is identified as Y and the cross-dispersion (XD) direction is X.
MAMA Image Format
(looking in the +Z direction,
into the MAMA)
MAMA
Active
Area
25.6mm
Square
1.45mm
4.25mm
7.05mm
2.8mm
2.8mm
2.8mm
2.8mm
5.75mm
Center of
spectral stripeCenter of Cal
stripe
NOTES:
1. Spectral stripe width = ~ 2.8 mm for
diffuse source that fills the PSA;
Cal stripe width = ~ 0.1 mm.
2. Integer numbers indicate the Code V
zoom positions.
3. Dimensions are from center of spectral
or cal stripes except for MAMA format
size. 1pixel = 25 microns = 0.025 mm.
5.05mm
4.95mm
1
2
3
4
5
6
7
8
9
Light from
NCM3aLight from
NCM3b
Light from
NCM3c
~
Edge of PSA Imag
e
Center-line
Y (DD)
X (XD)
IncreasingWavelength
IncreasingWavelength
Figure 1: NUV Detector Coordinate System. This figure details the physical locations ofthe three science and wavelength calibration NUV spectral stripes. This figure was takenfrom COS-11-0001.

COS-11-0027February 1, 2001
Center for Astrophysics & Space Astronomy Initial Release
Technical Evaluation Report“TAACOS: Target Acquisition with the TA1 Mirror”
University of Colorado at Boulder Page 6
4.2 THE HST POINT SPREAD FUNCTION AND COS SCIENCE APERTURES
As pointed out in the COS-11-0016, a primary driver to the COS TA algorithms isthe relationship between the size of the point spread function (PSF) of HST and the COSaperture at the aperture location. The on-axis unfocused HST PSF is approximatelysymmetric with a radius of ~0.204mm (0.75”). Figure 2 displays the HST PSF of a pointsource at the COS primary science aperture (PSA) in coordinates of millimeters andarcseconds on the sky. The 2.5” diameter aperture is shown in red, simulated photonsfrom an isolated point source are shown in green. The hashed area indicates the aperturemechanism, which blocks photons not in the aperture. The PSA and the bright objectaperture (BOA) are both 0.340mm (1.250”) in radius. Therefore, the COS scienceapertures capture 100% of the HST PSF, plus an additional ~0.136mm (0.5”) annulus(indicated by ∆r in Figure 2). We define the aperture coordinate system (ACS) as havingX in the horizontal direction and Y in the vertical of Figure 2. In our ACS, the origin is atthe center of the aperture with X increasing to the right and Y increasing upward whenlooking forward in HST bay 4. In our analysis we will be comparing initial HSTpointings in the dispersion direction (DD, X0) and in the cross-dispersion direction (XD,Y0) to the final telescope pointings (Xf and Yf). We will commonly compare the mean ofthe absolute value of the pointing errors. We designate this as ‹|Xf-X0|› in the DD and‹|Yf-Y0|› in the XD. Owing the rotation of the detector coordinate system (DCS) to theACS, ACS X and DCS Y are in the DD, while ACS Y and DCS X are in the XD. In thisdocument, X0, Y0, Xf, and Yf will always refer to ACS coordinates.
Figure 2: The HST PSF as compared to the COS PSA. The aberrated, out of focus, HST PSF isapproximately circular with a radius of ~0.2 mm at the COS aperture mechanism. The COS PSA is circularwith a radius of 0.34mm, which corresponds to 1.25” on the sky. The HST PSF is smaller in radius than theCOS PSA aperture by 0.136mm or ~0.5”.

COS-11-0027February 1, 2001
Center for Astrophysics & Space Astronomy Initial Release
Technical Evaluation Report“TAACOS: Target Acquisition with the TA1 Mirror”
University of Colorado at Boulder Page 7
4.3 TAACOS: INPUT SPECTRUM
As with previous TAACOS simulations, our input spectrum is based upon thefaint object spectrograph (FOS) QSO composite spectrum (Zheng, et al. 1998, ApJ, 492,855). The TAACOS NUV input spectrum used in this analysis differs from the FOS QSOcomposite spectrum in the following ways:
1) It has been scaled to an average flux level of Fλ = 10-14 ergs/cm2/s/Å.This is 10times brighter than the TAACOS FUV target.
2) It has been adjusted to correspond to a target with z=0.125.
3) OI λ2471 Geocoronal emission has been added. TAACOS analysis, based uponSTIS in-orbit measurements of the strength of the OI λ2471, indicate that thisweak emission line should not affect NUV TA. Therefore, unlike the FUVchannel, no special TA subarrays are necessary to mask out this Geocoronalfeature during NUV TA.
4) Simulated non-physical absorption features are inserted into the spectrum atregular intervals ranging from equivalent widths of 2 Å to 2 mÅ. These spectralfeatures are a convenient method for determining the sensitivity limits of COSobservations.
Figures 4-6 of COS-11-0016 display the input spectra for the FUV detectors,without Geocoronal lines. The TAACOS NUV spectra are similar, but at higherwavelengths.
4.4 COS EFFICIENCES AND DETECTOR NOISE
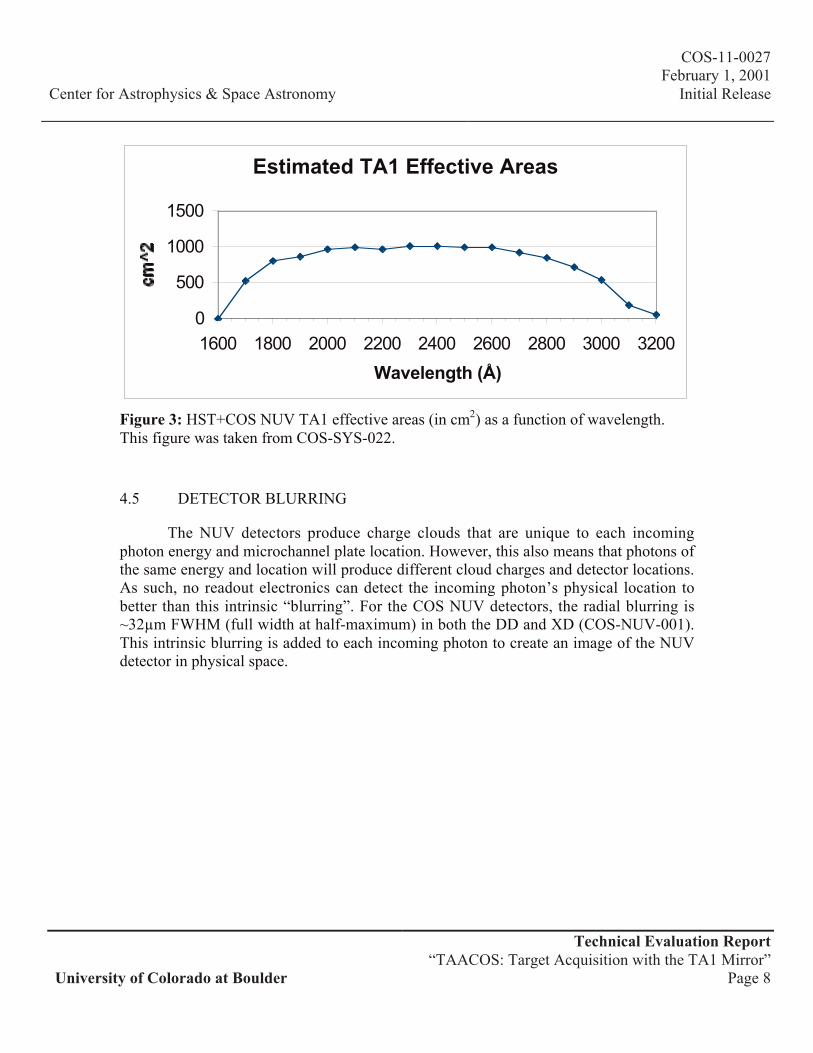
The COS instrument (optics + detectors) efficiencies used for the NUV TA withtheTA1 mirror analysis are taken from (COS-SYS-022) and are current as of January 27,2000. For convenience, these efficiency results are presented in Figure 3. For purposes ofTA, we assume that the detectors will have a constant background rate of 34 counts s-1
cm-2. This rate is based upon the in-flight count rate currently being detected by the STISflight MAMA, corrected for background count rate differences between the nearlyidentical MAMAs. This count rate equates to 223 counts s-1 over the entire detector orabout one count per pixel every 78 minutes. This background rate is a factor of 70 higherthan the FUV background rate and has important implications regarding NUV TA.
COS-11-0027February 1, 2001
Center for Astrophysics & Space Astronomy Initial Release
Technical Evaluation Report“TAACOS: Target Acquisition with the TA1 Mirror”
University of Colorado at Boulder Page 8
Estimated TA1 Effective Areas
0
500
1000
1500
1600 1800 2000 2200 2400 2600 2800 3000 3200
Wavelength (Å)
cm^2
Figure 3: HST+COS NUV TA1 effective areas (in cm2) as a function of wavelength.This figure was taken from COS-SYS-022.
4.5 DETECTOR BLURRING
The NUV detectors produce charge clouds that are unique to each incomingphoton energy and microchannel plate location. However, this also means that photons ofthe same energy and location will produce different cloud charges and detector locations.As such, no readout electronics can detect the incoming photon’s physical location tobetter than this intrinsic “blurring”. For the COS NUV detectors, the radial blurring is~32µm FWHM (full width at half-maximum) in both the DD and XD (COS-NUV-001).This intrinsic blurring is added to each incoming photon to create an image of the NUVdetector in physical space.

COS-11-0027February 1, 2001
Center for Astrophysics & Space Astronomy Initial Release
Technical Evaluation Report“TAACOS: Target Acquisition with the TA1 Mirror”
University of Colorado at Boulder Page 9
4.6 MECHANISM WOBBLES AND EXTRACTION SUBARRAYS
The OSM mechanisms have known mechanical imperfections that cause slightmis-alignments in both the dispersion (DD, IC Y) and cross-dispersion (XD, IC X)directions. Since the imaging modes described in this document use undispersed light,will we primarily refer to the IC X and Y coordinates. These errors can be divided intotwo categories, wobble and step errors. Step errors refer to situations where the OSMmechanisms do not achieve the desired rotational positions. These errors cause Y offsetsonly. A 1 step OSM1 error equates to an image offset of ~±240 pixels (p), while anOSM2 1 step error equates to a ~±50p offset. Wobble refers to motion isolated to thegrating or mirrors being employed. Wobble occurs in both the X and Y direction.Simulations indicate that the maximum wobble introduced by OSM1 and OSM2 at theMAMA is expected to be ~±30p in Y and ~±80p in X. In addition, the calibration imagehas a certain intrinsic spatial extent, which must be accounted for. We estimate thatallowing an additional ±20p should be sufficient for the calibration lamp image.Therefore, to be reasonably certain that we have allowed for mechanism ‘slop’ we needto allow for the following possible alignments errors:
Y allowance = ± (240+50+30+20)p = ±340pX allowance = ± (80+20)p = ±100p
TAACOS simulations indicate that in the absence of mechanism mis-alignments,the center of the calibration image (the calibration lamp imaged with OSM2 set to theTA1 mirror) should fall at IC (X, Y) coordinates of ~(286,471). Therefore, to ensure thatthe calibration lamp image is recovered, the extraction subarray should be from ICcoordinates (186,131) (lower right) to (386,811) upper left. When considering targetacquisition, one must allow for target misalignments within the aperture. The largestinitial pointing error which will still produce target counts is the aperture radius plus thePSF radius, or ~2’’ (arcseconds). Since this is the maximum possible extent, no spatialdimension allowance is necessary for point sources TAs. TAACOS simulations (COS-11-0024) indicate that when the TA1 mirror is in the optical path, the detector plate scalesare:
-42.554 ± 0.004 p/” (IC X vs. Aperture Y")-42.469 ± 0.003 p/” (IC Y vs. Aperture X").
This equates to an additional ±2” allowance of ~± 85p for astronomical targets.TAACOS simulations indicate that a perfectly centered target, with no mechanismmisalignments, falls at IC coordinates of ~(678,531). Therefore, to ensure that the targetimage is recovered, the extraction subarray should be from IC coordinates (513,126)(lower right) to (843,936) upper left. These subarrays are displayed in Figure 4. Thesesubarrays are only initial estimates for the current TA1 mirror alignment. Plans areunderway to slightly tilt the TA1 mirror to move the central target and calibration images

COS-11-0027February 1, 2001
Center for Astrophysics & Space Astronomy Initial Release
Technical Evaluation Report“TAACOS: Target Acquisition with the TA1 Mirror”
University of Colorado at Boulder Page 10
off of spectral stripe ‘B’ (between stripes ‘B’ and ‘C’). In addition, when using the ‘rearview mirror mode’ (RVMM), it is planned to center the target and calibration imagesbetween stripes ‘A’ and ‘B’. Also shown in Figure 4 are simulated target and calibrationimages, along with background estimates.
Figure 4: TA1 extraction subarray summary. The LTAIMCAL and LTAIMAGEextraction subarrays are compared in IC to simulated images and the COS scienceaperture. Expected MAMA background rates are also given.

COS-11-0027February 1, 2001
Center for Astrophysics & Space Astronomy Initial Release
Technical Evaluation Report“TAACOS: Target Acquisition with the TA1 Mirror”
University of Colorado at Boulder Page 11
5. LTAIMCAL
5.1 INTRODUCTION
Due to possible mechanical mis-alignments, it is necessary to flash the calibrationlamp, with OSM2 rotated to the TA1 mirror, to determine the position on the detectorcorresponding to the center of the calibration, and thus the science, aperture(s). This(new) TA phase is referred to LTAIMCAL. The extraction subarray for this TA phasewas given in the previous section. In this section, we examine various options fordetermining the center of the rectangular calibration aperture. Once this location isdetermined, a known offset is applied (via patchable constants) to calculate the detectorlocation corresponding to the center of the science aperture.
5.2 ANALYSIS
We considered the following four algorithms for determining the center of thecalibration aperture from a calibration lamp ACCUM or TIME-TAG image:
1) Use the mean X and Y TIME-TAG event location to determine the X and Ycentroids of the calibration lamp image.
2) Use the median X and Y TIME-TAG event location to determine the X and Ycentroids of the calibration lamp image.
3) Construct 2–1D histograms of the TIME-TAG event locations (1 histogram eachfor the X and Y event locations). Use the histogram bin with the maximum countsto determine the X and Y centroids of the calibration lamp image. If multiple binshave the same counts, use the first bin encountered.
4) Obtain an ACCUM image of the calibration lamp. Following the algorithm usedwith HST+STIS, move an 11x11p box across all possible box locations todetermine the 11x11p region of the image (histogram) that contains the mostevents. Use a flux-centroid algorithm on this 11x11p box to determine the X andY centroids of the calibration lamp image.
The spatial extent of the calibration image is shown in Figure 4. Figure 5 displaysa TAACOS simulation of the undispersed wavelength calibration lamp in IC.Background noise has not been included in this simulation since the actual exposure timeof the LTAIMCAL exposure has not been determined at this point. The exposure time,and hence the detector background rate, is the most important determining factor inchoosing an LTAIMCAL centroid algorithm. The X asymmetry of the calibration imageis of marginal concern since this is the cross-dispersion (XD) direction. In Figure 6 wecompare simulated centroiding accuracies for the four algorithms tested. The maximumwobble plus mechanism rotation error (1 step) was assumed. We find that as long as the

COS-11-0027February 1, 2001
Center for Astrophysics & Space Astronomy Initial Release
Technical Evaluation Report“TAACOS: Target Acquisition with the TA1 Mirror”
University of Colorado at Boulder Page 12
LTAIMCAL exposure time is less than 10 second (which is extremely probable), themedian algorithm is more than sufficient for X and Y centroiding. Errors in LTAIMCALcentroiding should introduce less than or approximately equal to a ±0.01” error inpredicting the location of the science aperture center in both X and Y. Following thetiming assumptions of COS-11-0024, this phase should take approximately 30 seconds(allotting 10 seconds each for BOP check, lamp exposure, and software overhead.
Figure 5: TAACOS-simulated NUV TA1 calibration lamp image shown in instrumentcoordinates (IC). X and Y IC are 25x25µm pixels. The Z-axis is in units of counts.

COS-11-0027February 1, 2001
Center for Astrophysics & Space Astronomy Initial Release
Technical Evaluation Report“TAACOS: Target Acquisition with the TA1 Mirror”
University of Colorado at Boulder Page 13
Figure 6: Predicted maximum LTAIMCAL centroid calculation errors (in arcseconds) asa function of exposure time and LTAIMCAL centroiding algorithm.

COS-11-0027February 1, 2001
Center for Astrophysics & Space Astronomy Initial Release
Technical Evaluation Report“TAACOS: Target Acquisition with the TA1 Mirror”
University of Colorado at Boulder Page 14
5.3 OSM1 MECHANISM ADJUSTMENT
There exists a science requirement (COS-OP-01) that the central wavelength of ascience acquisition places a pre-selected wavelength at the center of a spectral stripe towithin ± 50 spectral resolution elements in the dispersion direction (DD, Y). For theNUV channel, this corresponds to placing the target image during LTAIMAGE to within~ ± 150 pixels in the Y direction of the perfectly aligned location. In instrumentscoordinates (IC), TAACOS simulations indicate that this location is (678.4,530.8) [X, Y;pixels]. However, as pointed out in §4.6, the various mechanism foibles can contribute toY (DD) mechanism alignment. Specifically, the predicted mechanism induced Y (DD)coordinate mis-alignment contributors are:
• OSM1 + OSM2 ‘wobble’ = ± 30p• 1-step OSM1 rotation error = ± 240p• 1-step OSM2 rotation error = ± 50p
Clearly, the major contributor is the 1-step OSM1 rotation error. The LTAIMCALprocedure can be used to help eliminate this error. This is discussed in COS-11-0028.TAACOS simulations indicate that, in IC, the position of the properly aligned calibrationimage is at (286.5,471.2) [X, Y; pixels].
The specific LTAIMCAL steps are outlined in COS-11-0014 (Rev A).
6. LTAIMAGE: TARGET ACQUISITION USING THE TA1 MIRROR
6.1 INTRODUCTION
TA using an image of the sky is possible with COS using the TA1 mirror onOSM2 to image the sky on the MAMA. We call this operation LTAIMAGE. Thisoperation is theoretically limited to sources within a 2” radius (85p) of the center of theaperture. This maximum distance, 2”, is the distance from the center of the aperturewhere photons reach the detector (1.25” radius aperture + 0.75” radius PSF).Operationally, LTAIMAGE works well out to initial radial offsets of up to 1.7”. Aspreviously pointed out, wobble and rotation errors in the OSMs cause the detectorlocation of a target centered in a science aperture to vary with exposure.
The use of this procedure requires that the initial HST slew places the objectwithin 1.7” of the center of the aperture. This should be possible for many targets whenthe GSC II is available. Target with additional positional uncertainties may require aspiral search (LTASRCH) be performed before LTAIMCAL+LTAIMAGE.

COS-11-0027February 1, 2001
Center for Astrophysics & Space Astronomy Initial Release
Technical Evaluation Report“TAACOS: Target Acquisition with the TA1 Mirror”
University of Colorado at Boulder Page 15
To determine the detector location of a target centered in the aperture, two piecesof information are required. These are:
1) The X and Y centroids of the TA1 mirror calibration lamp image with the OSMsin the science exposure positions. This information is provided by theLTAIMCAL TA phase.
2 ) The offset between the centroid of the calibration aperture and the scienceaperture. This information will be determined on the ground and used byLTAIMAGE to calculate the detector location of a point source centered in theaperture.
In addition to the X and Y detector coordinates of a centered external pointsource, two additional pieces of information are required. These are:
1) The plate scales, the relationships between arcseconds (“) on the sky and X/Ypixels (p) on the detector. These have been simulated by TAACOS and will betested on the ground, and possibly verified in flight.
2) The X and Y centroids of an image of the sky containing the target source takenwith OSM2 rotated to the TA1 mirror.
Once this information is known, the centering of the target in the apertureinvolves the simple calculation, and implementation, of the desired HST slew. In thissection, we examine different methods for determining the X and Y centroids of thetarget image. Recall that the actual location of the target image can cover a large regionof the detector. The background count rate over this large extraction subarray (derived in§4.6) is predicted to be ~60 counts/second.
6.2 ANALYSIS
We tested 6 methods for calculating the X and Y centroids of the LTAIMAGE.These methods are divided into two classes. The first class uses the entire extractionsubarray derived in §4.6, while the second class uses the calculated detector coordinatesof the LTAIMCAL phase and a smaller extraction box which represents the extent of theaperture on the sky (±2”, 170x170p). The latter methods are referred to as “small box”methods. The small box methods substantially decrease the predicted backgroundcontamination and serve as mild protection against detector “hot spots” which have notbeen included in these simulations nor excluded by the tested algorithms. TheLTAIMAGE centroiding methods considered were:
1) Use the mean X and Y TIME-TAG event locations over the extraction subarray todetermine the X and Y centroids of the target point source image.
2) Use the median X and Y TIME-TAG event locations over the extraction subarrayto determine the X and Y centroids of the target image.

COS-11-0027February 1, 2001
Center for Astrophysics & Space Astronomy Initial Release
Technical Evaluation Report“TAACOS: Target Acquisition with the TA1 Mirror”
University of Colorado at Boulder Page 16
3) Same as 2), but using the small extraction box (conceptually, this algorithm+LTAIMCAL is the exact 2D analogy of the 1D LTACAL+LTAPKXDspectroscopic algorithm).
4) Construct 2 –1D histograms of the TIME-TAG event locations (1 histogram forthe X event locations, 1 histogram for the Y event locations) over the entireextraction subarray. Use the histogram bin with the maximum counts to define theX and Y centroids of the target image. If two bins have the same counts, use thefirst bin encountered.
5) Same as 4), but using the small extraction box.
6) Obtain an ACCUM image of the calibration lamp, or construct 1–2D histogram ofthe TIME-TAG event locations. Following the algorithm used with HST+STIS,move a 9x9p box across all possible box locations to determine the 9x9p region ofthe image (histogram) that contains the most events. Use a flux-centroid algorithmon this 9x9p box to determine the X and Y centroids of the target image. (A STIS-like “small box” method was not considered since it was assumed that this wouldnot affect the determination of the maximum count box.) It should be noted that aflux-centroid image algorithm is mathematically equivalent to a mean TIME-TAG event list centroid. We will refer to this mode as the STIS or Moving BoxPlus Flux Centroid (MBPFC) method.
Figure 7 displays our TAACOS simulated Y (DD) centroiding error as a functionof mean QSO target flux over the range of 10-18 ergs/cm2/s/Å < Fλ< 10-13 ergs/cm2/s/Å.Each exposure was performed for an exposure time that achieved ~500 total target counts(1 second for a Fλ=10-14 ergs/cm2/s/Å source). For these simulations, the target wasdisplaced from the aperture center by 1” in both ACS X and Y. In addition, themaximum wobble plus mechanism rotation error (1 step) was assumed. A pointing errorof +0.01” based upon the LTAIMCAL simulations is included in the reported pointingaccuracies. Figure 8 displays the predicted X (XD) centroiding errors. As expected, in allcases the “small box” methods achieved better centroiding accuracies to lower target fluxvalues. Three methods, the full and small box, 2-1D histogram-maximum methods andthe STIS-like box methods achieved our DD desired accuracies of < 0.08” in the DD (Y)down to a mean target flux Fλ=10-17 ergs/cm2/s/Å. Below Fλ=10-17 ergs/cm2/s/Å, only theSTIS-like and small box histogram-maximum methods achieved the desired centeringaccuracies. These three methods also achieved our XD required accuracies.
Figure 9 displays a 1 second TA1 image for two Fλ=10-14 ergs/cm2/s/Å QSOsources separated by 1” in both ACS X and Y. The stronger (rear) detection is perfectlycentered in the aperture. The weaker feature is partially vignetted by the aperture, yetretains a narrow, circular, profile. This reassures us that our centroiding accuracy isindependent of initial target position within the central 1” radius of the aperture center.

COS-11-0027February 1, 2001
Center for Astrophysics & Space Astronomy Initial Release
Technical Evaluation Report“TAACOS: Target Acquisition with the TA1 Mirror”
University of Colorado at Boulder Page 17
Figure 7: Dispersion Direction (DD, Y) pointing accuracy comparison of the testedLTIMAGE algorithms versus mean target flux for an extreme mis-alignment. The finalpointing error (in arcseconds) includes a +0.01” LTAIMCAL allowance. The dashedlines indicate the 15 km/s DD FUV and NUV desired accuracies.

COS-11-0027February 1, 2001
Center for Astrophysics & Space Astronomy Initial Release
Technical Evaluation Report“TAACOS: Target Acquisition with the TA1 Mirror”
University of Colorado at Boulder Page 18
Figure 8: Cross Dispersion direction (XD, Y) pointing accuracy comparison of the testedLTIMAGE algorithms versus mean target flux for an extreme mis-alignment. The finalpointing error (in arcseconds) includes a +0.01” LTAIMCAL allowance. For comparison,the dashed lines indicate the 15 km/s DD FUV and NUV desired accuracies.

COS-11-0027February 1, 2001
Center for Astrophysics & Space Astronomy Initial Release
Technical Evaluation Report“TAACOS: Target Acquisition with the TA1 Mirror”
University of Colorado at Boulder Page 19
Figure 9: TA1 image of two point sources. The stronger one is centered in the aperture,while the weaker one is offset 1" in both ACS X and Y, and is partially vignetted.

COS-11-0027February 1, 2001
Center for Astrophysics & Space Astronomy Initial Release
Technical Evaluation Report“TAACOS: Target Acquisition with the TA1 Mirror”
University of Colorado at Boulder Page 20
6.3 LTAIMAGE EXPOSURE TIMES
A major concern when using this non-dispersed mode is the overillumination ofthe NUV MAMA. There exist two count rate restrictions for the NUV. One is a globallimit of 106 counts/s over the entire detector. The other, local, limit is 200 counts/s/p. Thecentral pixel of a TA1 image of our sample QSO spectrum achieves this count rate at themean flux level of approximately Fλ=1.3x10⁻¹⁴ ergs/cm2/s/Å. Because of the uncertainflux and variability of astrophysical targets, the exposure times used for LTAIMAGEshould be conservative. As such, we adopt a stricter local limit 100 counts/s/p in ouranalysis; however, this count rate is probably still too large. For targets brighter thanFλ=1.3x10⁻¹⁴ ergs/cm2/s/Å, two methods of flux attenuation are possible. The first is toposition the target in the BOA This aperture has a neutral density filter that attenuatesflux by a factor of 100. Alternately, the RVMM of the TA1 mirror can be used (COS-OP-0001). This mode also attenuates flux by about a factor of 25. Because it does not involveroutine motion of the aperture mechanism, it is assumed that targets above a certain countrate will be attenuated with the RVMM, while targets brighter could be attenuated withboth the BOA and RVMM. Figure 10 displays estimated maximum count rates for thebrightest pixel in the TA1 image for mean fluxes in the range of Fλ=10-17-10-11
ergs/cm2/s/Å, assuming a maximum local count rate limit of 100 counts/s/p. The greenline indicates the maximum count rates for un-attenuated observations. Fluxes exceeding100 counts/s (dashed green line) are attenuated with the RVMM (display in red), whilefluxes that exceed the count rate limit by a factor of 25 are attenuated by the BOA (blue).Fluxes that exceed the count rate limit by a factor of 250 are attenuated by both the BOAand RVMM (displayed in magenta). Sources with mean Fλ > ~6 x 10-11 ergs/cm2/s/Åwould not be observable with the TA1 mirror.
The local count rate limit has serious consequences on the S/N of the TA1 image.The S/N of a NUV+TA1 image can be calculated by Equation 2 of COS-11-0024. Thebackground count rate (BR) for a 170px170p extraction should be ~7 counts/s, and 0.03counts/s for an 11x11 extraction box typical of the MBPFC method. In Figure 11, wedisplay the exposure times required to achieve a S/N of 10 in the brightest pixel for boththe small-box (170x170p) histogram-max and the moving-box (11x11p box)+flux-centroid LTAIMAGE methods for the obtainable flux range. A maximum local count rateof 100 counts/s/p is assumed. Exposure times in green are un-attenuated; those in red,blue, and magenta have been attenuated by the RVMM, BOA and BOA+RVMM,respectively.

COS-11-0027February 1, 2001
Center for Astrophysics & Space Astronomy Initial Release
Technical Evaluation Report“TAACOS: Target Acquisition with the TA1 Mirror”
University of Colorado at Boulder Page 21
Figure 10: Count rate of brightest pixel vs. mean QSO target flux for NUV TA1 images.The solid curves are for un-attenuated, the ‘rear view mirror mode’ (RVMM), the brightobject aperture (BOA) mode, and the combined BOA+RVMM.

COS-11-0027February 1, 2001
Center for Astrophysics & Space Astronomy Initial Release
Technical Evaluation Report“TAACOS: Target Acquisition with the TA1 Mirror”
University of Colorado at Boulder Page 22
Figure 11: LTAIMAGE exposure times required to reach S/N ratios of 10 in thebrightest pixel/histogram bin versus mean target flux. The histogram-max algorithmtimes are computed for a 170x170p box, while the MBPFC times assume an 11x11pmoving box.

COS-11-0027February 1, 2001
Center for Astrophysics & Space Astronomy Initial Release
Technical Evaluation Report“TAACOS: Target Acquisition with the TA1 Mirror”
University of Colorado at Boulder Page 23
6.4 LTAIMAGE TIMING
Assuming that the external shutter is open, and the NUV detector is in theHVNOM state, a LTAIMAGE should take:
BOP Check 10sLTAIMAGE Exposure 0.01-200sLTAIMAGE slew 40sOSM2 rotation 120sLTAIMAGE software execution 5-180s (depending on algorithm)
Total 175-550s (2-10m)
LTAIMAGE searches could take anywhere from 176s up to ~500s, depending onthe flux of the target, the S/N of the observation and the centering algorithm (histogram-max or flux-centroid). For most applications, the LTAIMAGE exposure time wouldaverage about < 100s. Using this exposure time, a typical LTAIMAGE exposure wouldtake <275s. Our estimate of 120s for an OSM2 rotation is the maximum allowable asdescribed in COS-SYS-012 Rev A (Optics Select Mechanism 2 Requirements). Ourestimate of 180s for the maximum software execution time pertains to the MBPFCmethod. If a post-TA image were desired this would require approximately 2 minutes.
7. SUMMARY
We find that the proposed two-stage LTAIMCAL+LTIMAGE procedures areadequate for performing imaging TA using the TA1 mirror on OSM 2 in conjunctionwith the NUV MAMA. For the LTAIMCAL mode, using a median algorithm on aTIME-TAG event list should provide knowledge of the detector location of the aperturecenter to within ±0.01”. Absolute knowledge of the relationship between the flat-fieldand science apertures was assumed. TAACOS simulations indicate that threeLTAIMAGE algorithms have been identified that provide adequate DD and XD pointingaccuracy down to point sources with a mean Fλ=10-17 ergs/cm2/s/Å. Furthermore, it hasbeen pointed out that an iterative application of the LTAIMCAL procedure can be used toremove 1-step OSM1 rotation errors. Without this iterative LTAIMCAL procedure, thereis no guarantee of meeting the ± 50 spectral resolution element alignment of the desiredand achieved central wavelength for NUV observations.
If MAMA hot spots are of concern, or an algorithm is desired that can accuratelycenter targets fainter than Fλ=10-17 ergs/cm2/s/Å, then we have identified twoLTAIMAGE methods that achieve the desired accuracies. These methods are the “smallbox” (170x170p) STIS-like moving box plus flux-centroid (MBPFC) method and the“small box” 2-1D histogram maximum method. The MBPFC method achieves higheraccuracy at the expense of increased computation time, and requires that the exposure be

COS-11-0027February 1, 2001
Center for Astrophysics & Space Astronomy Initial Release
Technical Evaluation Report“TAACOS: Target Acquisition with the TA1 Mirror”
University of Colorado at Boulder Page 24
performed in ACCUM mode or that the TIME-TAG event list be converted into a 2-Dhistogram (image). The MBPFC method has the advantages of being proven in orbit andknown to work on extended targets.
Caution must be exercised to not exceed the local count rate limit for the NUVMAMA. Accurate knowledge of the integrated flux from 1700-3200Å is essential for asafe and successful LTAIMAGE TA. Attenuation with the RVMM and BOA+RVMMmodes allow this procedure to be used for sources over a large range of fluxes, 10-17 < Fλ
< 10-11 ergs/cm2/s/Å.
Most LTACAL+LTAIMAGE TAs should take less than 6 minutes.
NOTE: During the COWG of 1/18/01, it was agreed that the ‘STIS-like’ MBPFCmethod, using an ACCUM image that will be retained for downlink, would berecommended for flight software use. See COS-11-0014 Rev A for further details.