Embed Size (px)
Citation preview
Technical Evaluation of the Utility ofIntake Approach Velocity as an Indicator ofPotential Adverse Environmental Impactunder Clean Water Act Section 316(b)
Technical Report

EPRI Project ManagerD. A. Dixon
EPRI • 3412 Hillview Avenue, Palo Alto, California 94304 • PO Box 10412, Palo Alto, California 94303 • USA800.313.3774 • 650.855.2121 • [email protected] • www.epri.com
Technical Evaluation of the Utility ofIntake Approach Velocity as anIndicator of Potential AdverseEnvironmental Impact under CleanWater Act Section 316(b)
1000731
Final Report, December 2000

DISCLAIMER OF WARRANTIES AND LIMITATION OF LIABILITIES
THIS DOCUMENT WAS PREPARED BY THE ORGANIZATION(S) NAMED BELOW AS ANACCOUNT OF WORK SPONSORED OR COSPONSORED BY THE ELECTRIC POWER RESEARCHINSTITUTE, INC. (EPRI). NEITHER EPRI, ANY MEMBER OF EPRI, ANY COSPONSOR, THEORGANIZATION(S) BELOW, NOR ANY PERSON ACTING ON BEHALF OF ANY OF THEM:
(A) MAKES ANY WARRANTY OR REPRESENTATION WHATSOEVER, EXPRESS OR IMPLIED, (I)WITH RESPECT TO THE USE OF ANY INFORMATION, APPARATUS, METHOD, PROCESS, ORSIMILAR ITEM DISCLOSED IN THIS DOCUMENT, INCLUDING MERCHANTABILITY AND FITNESSFOR A PARTICULAR PURPOSE, OR (II) THAT SUCH USE DOES NOT INFRINGE ON ORINTERFERE WITH PRIVATELY OWNED RIGHTS, INCLUDING ANY PARTY'S INTELLECTUALPROPERTY, OR (III) THAT THIS DOCUMENT IS SUITABLE TO ANY PARTICULAR USER'SCIRCUMSTANCE; OR
(B) ASSUMES RESPONSIBILITY FOR ANY DAMAGES OR OTHER LIABILITY WHATSOEVER(INCLUDING ANY CONSEQUENTIAL DAMAGES, EVEN IF EPRI OR ANY EPRI REPRESENTATIVEHAS BEEN ADVISED OF THE POSSIBILITY OF SUCH DAMAGES) RESULTING FROM YOURSELECTION OR USE OF THIS DOCUMENT OR ANY INFORMATION, APPARATUS, METHOD,PROCESS, OR SIMILAR ITEM DISCLOSED IN THIS DOCUMENT.
ORGANIZATION(S) THAT PREPARED THIS DOCUMENT
Oak Ridge National Laboratory
ORDERING INFORMATION
Requests for copies of this report should be directed to the EPRI Distribution Center, 207 CogginsDrive, P.O. Box 23205, Pleasant Hill, CA 94523, (800) 313-3774.
Electric Power Research Institute and EPRI are registered service marks of the Electric PowerResearch Institute, Inc. EPRI. POWERING PROGRESS is a service mark of the Electric PowerResearch Institute, Inc.
Copyright © 1999 Electric Power Research Institute, Inc. All rights reserved.

iii
CITATIONS
This report was prepared by
Environmental Sciences DivisionOak Ridge National LaboratoryP. O. Box 2008Oak Ridge, Tennessee 37831-6036
Principal InvestigatorsCharles CoutantMark S. BevelhimerGlenn F. Cada
This report describes research sponsored by EPRI.
The report is a corporate document that should be cited in the literature in the following manner:
Technical Evaluation of the Utility of Intake Approach Velocity as an Indicator of PotentialAdverse Environmental Impact under Clean Water Act Section 316(b), EPRI, Palo Alto, CA,2000. 1000731.


v
REPORT SUMMARY
This report addresses issues related to causes of fish impingement at cooling water intakestructures (CWIS), specifically the relationship of water velocity, site geometry, fish swimmingability, and environmental conditions. CWIS approach velocity is central to the ongoing U.S.EPA effort to regulate CWIS under Section 316(b) of the Clean Water Act. Energy producers,federal and state resource agencies and regulators, and the public will find this report a valuablereference on impingement issues and appropriate approaches to minimize potential impingementimpacts.
BackgroundUnder an October 1995 Consent Decree, the U.S. EPA is proposing rules for new and existingCWIS that address the requirements of Section 316(b) of the Clean Water Act. The regulationswill, in part, address the meaning of “adverse environmental impact” (AEI), approaches forassessing the potential for AEI, and measures for minimizing AEI. These measures may includerequirements affecting design, construction, location, and CWIS capacity that are determined toreflect the “best technology available” (BTA). Potentially impacted are all power plants andindustrial facilities withdrawing cooling water. To minimize potential impingement impacts,EPA is considering use of an approach velocity standard both as a screening tool for existingfacilities and as a design standard for new facilities. More specifically, EPA is proposing acriterion of 0.5 f/s. This approach velocity criterion has been an informal guideline since the1970s; however, no known detailed technical reviews or analyses have been performed tosupport it. This provided the reason for a synthesis, review, and analysis of existing data onapproach velocity and an assessment of its utility as a regulatory parameter for precludingimpingement impacts at CWIS.
ObjectiveTo perform a technical literature review and requisite data analysis to determine and discuss theappropriateness of 0.5 f/s (15.25 cm/s), or an alternative criterion, as a de minimis value thatwould essentially preclude impingement impacts.
ApproachThe project team analyzed the effects of CWIS intake velocity on impingement rates of juvenileand adult fish using available scientific literature, government agency reports, and reports byenergy companies and their consultants. Analyses included (1) a review of the historicalevolution and technical support for the criterion of 0.5 f/s, including approach velocitiesrecommended by other federal and state agencies, (2) a review of methods for appropriatelymeasuring and reporting relevant CWIS velocities, (3) a comprehensive literature review of theswimming capabilities of freshwater, estuarine, and marine fish, and (4) integration of the data

vi
gathering and analyses to specifically address the project's objectives. The project team formedtheir research around these core questions:
• Is approach velocity an appropriate parameter for determining the potential for impingementimpact?
• Assuming approach velocity is technically supportable, what are the approaches and methodsthat can be universally applied to CWIS for its proper measurement?
• Is a single value appropriate and, if so, is 0.5 f/s a technically supportable criterion, or is analternative criterion more appropriate?
ResultsEvaluation of the geometry of water (and fish) approaching intake screens indicates that there areseveral relevant velocity components: approach velocity at a distance from the screen, approachvelocity near the screen, through-screen velocities, sweeping velocities and other vectors at anangled screen, and heterogeneity of all velocities in a complex hydraulic environment of anintake structure. Component interaction, swimming abilities of specific fish, and environmentalfactors all contribute to determining susceptibility to impingement. The research concluded that(1) approach velocity is an appropriate regulatory parameter, (2) it should be measured withdetailed attention to the intake's geometry (preferably as a vector parallel to the main water flowat a distance from the screen), (3) a single regulatory value probably should not be appliedconsidering the variety of organisms and sizes at a site (a site-specific analysis using sitegeometry and data on swimming speeds of local fish is recommended), and (4) a screeningcriteria value of 0.5 f/s would be useful to delineate CWIS where significant impingement isunlikely except under unusual environmental circumstances (for example, unusual cold snaps).
EPRI PerspectiveThis report will be a valuable resource for steam and hydroelectric energy producers, otherCWIS owners, and resource agency and regulatory personnel as approaches are designed toaddress CWIS impingement issues. It will be particularly valuable to the U.S. EPA as it attemptsto draft regulations that address the requirements of Section 316(b) of the Clean Water Act.
KeywordsSection 316(b)ImpingementApproach velocityCooling water intake structures (CWIS)
vii
ABSTRACT
This study addressed issues related to using water velocity as a criterion for regulating coolingwater intakes at steam electric power stations. In principle, a low intake velocity would minimizethe entrapment, impingement, and likely mortality of organisms on intake screens because thefish could simply swim away from the screens. However, maintaining a low intake velocity canbe technically difficult as well as costly, so it is important to justify the biological benefits. Athrough-screen velocity of 0.5 foot per second (f/s; = 15.25 cm/s) has been proposed by the U.S.Environmental Protection Agency (EPA) as one element of “best technology available” (BTA)performance standards for cooling water intake structures (CWIS). EPA has proposed a tieredanalysis for judging adverse environmental impact in which velocity would be used as ascreening criterion for the first tier of evaluation (plants with velocities as low as this would notbe required to conduct detailed analyses). Velocity would also be used as a potential evaluationcriterion for more detailed analyses. We evaluated the geometry of intakes, criteria used by otheragencies, and swimming speed data from the scientific literature to answer whether velocity is anappropriate regulatory parameter, how it should be measured (if it is appropriate), whether asingle value is useful, and whether a value of 0.5 f/s is the best one. Our evaluation of thegeometry of water (and fish) approaching intake screens indicates that there are severalpotentially relevant velocity components: approach velocity at a distance from the screen,approach velocity near the screen, through-screen velocities, sweeping velocities and othervectors at an angled screen, and heterogeneity of all velocities in a complex hydraulicenvironment of an intake structure.
Velocity criteria developed by the National Marine Fisheries Service and the state of Washingtonprimarily for screens at irrigation diversions included values near 0.5 f/s that apply to the mostsensitive organisms (salmon fry) under certain circumstances. However, these values are appliedwithin a framework that considers the geometry of the intake (including criteria for sweepingvelocities) and allows for application of less stringent values when less sensitive organisms (e.g.,adult salmonids) are the only ones present. Because of how the EPA criterion for CWIS wouldbe imposed, it is more restrictive than the NMFS criteria.
The scientific literature has a large amount of information on the swimming capabilities of fish.There are several types of swimming: cruising (normal activity), prolonged (or critical, thevelocity that can be maintained under forced swimming), burst (short-duration darts) and “fast-start” (the initial thrust of a burst). We tabulated information on prolonged swimming speeds byhealthy fish according to species, and we analyzed it in several ways. Swimming speed variesprimarily by fish size and water temperature, with small fish and those at cold temperaturesperforming most poorly. Fish in different taxonomic families and with different body shapeshave different swimming capabilities (e.g., eels and eel-like fish are poor swimmers, fish of theherring family are especially vulnerable, salmonids are good swimmers). All fish assemblages(estuarine, riverine, etc.) have a range of good to poor swimmers. The lowest average values are

viii
near 0.5 f/s. However, there is a large amount of individual variability, and impingement likelyreflects the poorest individual performers among a school of the same species. Prolongedswimming speeds are markedly affected by environmental variables and reduced by stressors,and we summarize these in the text.
We conclude that (1) approach velocity is an appropriate regulatory parameter, (2) it should bemeasured with detailed attention to the geometry of the intake (preferably as a vector parallel tothe main water flow at a distance from the screen), (3) a single regulatory value probably shouldnot be applied considering the variety of organisms and sizes at a site (a site-specific analysisusing the site geometry and data on swimming speeds of local fish is better), and (4) a screeningcriterion value of 0.5 f/s (about 15 cm/s) in front of an intake, based on critical swimming speeddata, would be useful to delineate power station intakes where significant impingement isunlikely except under unusual environmental circumstances (e.g., unusual cold snaps) or whereparticularly weakly swimming species (e.g., delta smelt, splittail) occur. Approximately thisvalue would likely have been concluded regardless of its prior proposal by EPA. However,laboratory critical swimming speed data are but one line of evidence for predicting impingement.Weakly swimming early life stages would likely be entrained.

ix
ACKNOWLEDGMENTS
This work was sponsored by EPRI, Palo Alto, California, under Contract No. ERD-00-1840 (EP-P1137/C426) with Oak Ridge National Laboratory. It is Environmental Sciences DivisionPublication No. 5060. We thank Dr. Douglas A. Dixon, EPRI, for support throughout theplanning and execution of the project. We also thank the Environmental Sciences Divisionlibrarian, Ms. Larkee Moore, for her sustained efforts to obtain needed literature. Kenneth Batesand Edward Radle provided information on intake velocity criteria for Washington and NewYork states, respectively. We appreciate thoughtful reviews of a draft by David Bailey, KennethBates, Kristy Bulleit, Dr. Joseph J. Cech, Jr., Dr. Alexander J. Haro, Jules Loos, David Michaud,Dr. Christina Swanson, Edward P. Taft, and Dr. Paciencia S. Young,

xi
CONTENTS
1 INTRODUCTION ..................................................................................................................1-1
1.1 Background...................................................................................................................1-1
1.2 Approach.......................................................................................................................1-2
2 COOLING-WATER INTAKES ..............................................................................................2-1
2.1 Types of CWIS ..............................................................................................................2-1
2.2 Flow Fields....................................................................................................................2-2
2.3 Fish Effects ...................................................................................................................2-4
2.4 Intake Velocities and Hydraulics....................................................................................2-5
3 HISTORICAL EVOLUTION OF VELOCITY CRITERIA ........................................................3-1
3.1 Criterion of 0.5 f/s for CWIS...........................................................................................3-1
3.2 State and Federal Approach Velocity Criteria ................................................................3-4
3.2.1 NMFS Northwest Criteria .......................................................................................3-5
3.2.2 Comparison to Proposed EPA Criteria...................................................................3-6
4 EVALUATION OF SWIMMING SPEED INFORMATION AS A PREDICTIVE TOOL............4-1
4.1 Types of Swimming.......................................................................................................4-1
4.1.1 Sustained, Prolonged and Burst Swimming ...........................................................4-2
4.1.2 Swimming Behavior of Bottom Fish .......................................................................4-6
4.1.3 Threshold Swimming Speed ..................................................................................4-7
4.2 Prolonged (Critical) Swimming Speed ...........................................................................4-8
4.3 Fatigue Times or Endurance .......................................................................................4-12
4.4 Factors That Affect Swimming Capability ....................................................................4-14
4.4.1 Individual Variability .............................................................................................4-14
4.4.2 Exercise Conditioning ..........................................................................................4-16
4.4.3 Fish Length..........................................................................................................4-16
4.4.4 Body Shape.........................................................................................................4-17
xii
4.4.5 Growth Rate ........................................................................................................4-18
4.4.6 Dissolved Oxygen................................................................................................4-19
4.4.7 Supersaturated Dissolved Gas ............................................................................4-20
4.4.8 Temperature ........................................................................................................4-20
4.4.9 Seasonality Not Related to Temperature .............................................................4-24
4.4.10 Light...................................................................................................................4-25
4.4.11 Photoperiod .......................................................................................................4-27
4.4.12 Schooling...........................................................................................................4-27
4.4.13 Turbulence.........................................................................................................4-27
4.4.14 Disease .............................................................................................................4-29
4.4.15 Toxicants ...........................................................................................................4-30
4.4.16 Acidity................................................................................................................4-31
4.5 Analysis of Tabulated Data on Critical Swimming Speeds...........................................4-32
4.6 Burst Swimming Speeds and Fast Starts ....................................................................4-37
5 ADDITIONAL CONSIDERATIONS.......................................................................................5-1
5.1 Measures to Minimize Impingement and Related Injury and Mortality ...........................5-1
5.2 High Velocity Technologies ...........................................................................................5-2
5.2.1 Laboratory Studies.................................................................................................5-3
5.2.2 Field Studies..........................................................................................................5-3
6 ALTERNATIVE MEASURES FOR PREDICTING IMPINGEMENT RATES..........................6-1
7 CONCLUSIONS AND RECOMMENDATIONS.....................................................................7-1
7.1 Is approach velocity an appropriate parameter for determining the potential forimpingement impact? ..........................................................................................................7-1
7.2 Assuming approach velocity is technically supportable, what are the approachesand methods that can be universally applied to CWIS for its proper measurement? ...........7-2
7.3 Is a single value appropriate and, if so, is 0.5 f/s a technically supportable criterionor is another criterion technically supportable?....................................................................7-3
8 REFERENCES .....................................................................................................................8-1
A TABLE OF CRITICAL SWIMMING SPEEDS FOR FISH .................................................... A-1
B FISH ENDURANCE (FATIGUE TIMES AT CONSTANT VELOCITIES) ............................. B-1
xiii
LIST OF FIGURES
Figure 2-1 Hypothetical velocity fields at a variety of intake designs: (a) velocity vectorsat offshore intake, (b) velocity isopleths at offshore intake, (c) velocity isopleths atirregularly shaped intake canal, (d) velocity isopleths at uniform width intake canal. ........2-3
Figure 2-2 Effects of water velocity on fish when near or impinged on water intakescreens: (a) standard straight-on approach velocity, (b) angular velocitycomponents, (c) forces experienced when impinged, (d) alternate directions ofescape from impingement, (e) forces experienced when positioned perpendicular toscreen face. .....................................................................................................................2-6
Figure 3-1 Environmental Impact Statements by the Atomic Energy Commission in theearly 1970s used this figure of fish counts on intake screens at the Indian PointPlant on the Hudson River to illustrate increased impingement above about 1 f/s(30.48 cm/s). From USAEC (1975)...................................................................................3-1
Figure 3-2 There is minimal oxygen consumption per kilogram of fish per distance swumwithin a certain range of velocities. This optimal range has been suggested byHanson and Li ( 1978) as one measure suitable for setting intake velocity criteria toprotect fish form impingement. It is less than the critical swimming speed, andcloser to the natural cruising speed. .................................................................................3-3
Figure 3-3 Comparison of NMFS approach velocity criteria and proposed EPA criteria forthree different measures of approach velocity, (from left to right) through-screenvelocity, perpendicular velocity component, and standard approach velocity. ..................3-8
Figure 4-1 Three principal types of swimming by fish are illustrated in terms of time tofatigue. Sustained swimming (cruising; top part of curve) does not fatigue;prolonged swimming (middle slope) can occur without fatigue for lengths of timethat depend on the velocity; burst swimming (lower part of curve) occurs at highvelocities but for very short time periods. From Beamish (1980). .....................................4-3
Figure 4-2 Three types of swimming are illustrated in a hypothetical cooling-water intake.Cruising speed is voluntary in the source water body. Prolonged or criticalswimming speed is forced swimming for a long duration either in place until fatigueor until escape. Burst swimming is the energetic, rapid, darting action to escape thatcan be continued for only seconds. Critical swimming speeds have been the moststudied. ............................................................................................................................4-4
Figure 4-3 Fish swimming in schools make use of vortices from adjacent fish to reduceswimming effort. Figure shows part of a horizontal layer of fish within a school andthe discrete vortex wakes shed. Fish tend to swim in antiphase in a characteristicdiamond pattern. From Weihs 1975. ................................................................................4-5
Figure 4-4 Laboratory determinations of critical swim speeds are usually conducted inswim tunnels in which a single fish swims at designated stepped velocities and timeincrements of exposure in relatively laminar flow until fatigue forces it against theend plate or screen. Electrodes have traditionally given mild shocks to stimulate

xiv
swimming. Such chambers are usually recirculating loops. A common variant is touse an open channel or flume. From Beamish (1966). .....................................................4-9
Figure 4-5 Intake velocities can exceed critical swimming speeds (CSS) of fish. This isshown for the Fawley Power Station, England, over an annual cycle. FromTurnpenny and Bamber (1983). .......................................................................................4-9
Figure 4-6 Critical swimming velocities determined in stepped-velocity tests aresomewhat affected by experimental conditions (velocity increment and timeincrement). The relationships were established for largemouth bass juveniles byFarlinger and Beamish (1977). For this reason, both time and velocity incrementsare given for data in Table X. .........................................................................................4-10
Figure 4-7 Maximum sustained swimming speeds of largemouth bass in relation to totallength and weight at different temperatures. From Beamish (1970). ..............................4-11
Figure 4-8 Relationship between endurance time and swimming speed (expressed incm/s) for the pallid sturgeon (top) compared to other fish species. From Adams etal. (1999)........................................................................................................................4-13
Figure 4-9 There is high individual variability in critical swimming speeds of fish, asshown in graphs comparing critical swimming speeds to body mass (upper; allindividual data points are shown) and fork length (lower; maximum and minimumdata points are shown). From Nelson (1989; upper) and Glova and McInerney(1977; lower). .................................................................................................................4-15
Figure 4-10 Swimming performance of individual fish is fairly repeatable. Experiments byKolok et al. (1998) determined critical swimming speeds of 10 fathead minnows intwo swim tests 10 to 14 days apart (same fish are connected by lines). These fishwere controls for sediment toxicity exposures. ...............................................................4-16
Figure 4-11 Species differences in critical swimming speeds are strongly influenced bybody shape and method of propulsion. Fish propulsion is classified into severalcategories (left) that correspond to characteristic body shapes. The propulsive partsof each body type is darkened. Most fish near power stations are carangiform orsubcarangiform. From Lindsey (1978)............................................................................4-18
Figure 4-12 Low dissolved oxygen concentration reduces critical swimming speeds atdifferent concentrations for each species. Summary curves are shown for threespecies (left) and data points and summary line for Atlantic salmon. From Kutty andSaunders (1973). ...........................................................................................................4-19
Figure 4-13 Critical swimming speeds of different species vary in relation to temperature,even within a taxonomic Family such as the Salmonidae. From Beamish (1980). ..........4-21
Figure 4-14 Critical swimming speeds are typically lower at low and high temperatures,regardless of temperature of acclimation (prior holding temperature). Combinationsof acclimation and test temperatures for coho salmon yield isopleths of equalswimming speeds , which can be compared to the zone of thermal tolerance(temperature polygon) as defined by for this species by Brett (1952). Swimmingspeeds are shown in body lengths per second. From Griffiths and Alderdice (1972)......4-22
Figure 4-15 Abrupt temperature change can change critical swimming speed. Especially,a drop in temperature induces a marked temporary reduction (undershoot in topcurve). From Otto and O’Hara Rice 1974. ......................................................................4-24
Figure 4-16 Low light intensity can reduce the critical swimming speed of fish. Data areshown for several size classes of Caspian roach (top, as lines without data points)
xv
and European perch (open circles, bottom), and rudd (solid circles, bottom). FromPavlov et al. (1972). .......................................................................................................4-26
Figure 4-17 Velocities into intakes are not uniform. Figure shows velocity contours takenin front of four operating traveling screens of the Contra Costa Steam Plant,California (Kerr 1953). ....................................................................................................4-28
Figure 4-18 Turbulence in water reduces critical swimming speeds, as shown for twolength categories of gudgeon. The index of turbulence is turbulence intensity, whichis proportional to the standard deviation of instantaneous unidirectional velocities.From Pavlov et al. (1983). ..............................................................................................4-29
Figure 4-19 Low pH (high acidity) lowers critical swimming speeds, regardless of waterhardness, as shown for juvenile rainbow trout. From Graham and Wood 1981. .............4-31
Figure 4-20 Critical swimming velocities are strongly related to fish length, as shown inthis illustration of all critical swimming speed data in Table A-1. Dashed line is 15.25cm/s (0.5 f/s), and other lines represent proposed EPA standard (dotted line) andNMFS criteria (solid line), both converted to straight-on velocities in front of screenas in Table 3-3. ..............................................................................................................4-32
Figure 4-21 The pattern of lower critical swimming speeds in smaller fish is similarregardless of taxonomic Family (Cyprinidae, Percichthyidae, Clupeidae,Salmonidae, Centrarchidae). Dashed line is 15.25 cm/s (0.5 f/s), and other linesrepresent proposed EPA standard (dotted line) and NMFS criteria (solid line), bothconverted to straight-on velocities in front of screen as in Table 3-3. Data fromTable A-1. ......................................................................................................................4-33
Figure 4-22 The pattern of lower critical swimming speeds in smaller fish is similarregardless of fish assemblage ( a- Atlantic coast; b-Pacific coast; c- lakes; d-rivers). Dashed line is 15.25 cm/s (0.5 f/s), and other lines represent proposed EPAstandard (dotted line) and NMFS criteria (solid line), both converted to straight-onvelocities in front of screen as in Table 3-3. Data from Table A-1...................................4-34
Figure 4-23 Escape trajectory in a fast-start response varies according to the angle ofthe stimulus (dots represent the location of the stimulus; lines represent thedirection of escape). From Eaton and Emberley (1991)..................................................4-38
Figure B-1 Relationship between swimming endurance time and swimming speed ofAnguilla anguilla (European eel), with original figure legend. From McCleave(1980). ............................................................................................................................ B-2
Figure B-2 Relationship between swimming endurance time and length of Clupeaharengus (Atlantic herring), for a range of velocities, with original figure legend.From Boyar (1961). ......................................................................................................... B-3
Figure B-3 Relationships between swimming endurance times and swimming speed(body lengths per second) for Coregonus artedii (cisco) and Coregonusclupeaformis (lake whitefish), compared to two other species studied by others, withoriginal figure legend. From Bernatchez and Dodson (1985)........................................... B-4
Figure B-4 Relationships between swimming endurance times and swimming speeds(body lengths per second) for Oncorhynchus nerka (sockeye salmon), with originalfigure legend. From Brett (1967). .................................................................................... B-5
xvi
Figure B-5 Distance swam in relation to speed, body weight, and temperature forPetromyzon marinus (sea lamprey), with original figure legend. From Beamish(1974). ............................................................................................................................ B-6
Figure B-6 Relationship between swimming endurance times and swimming speed forSalmo salar (Atlantic salmon), with original figure legend. From Booth et al. (1997)........ B-7
Figure B-7 Relationship between swimming endurance times and swimming speed foranadromous and land-locked Salmo salar (Atlantic salmon), with original figurelegend. From Peake et al. (1997). ................................................................................... B-8
Figure B-8 Relationships between swimming endurance and swimming speeds forseveral species of North Atlantic coastal marine fish, with original figure legend.From Beamish (1966). .................................................................................................... B-9
Figure B-9 Relationships between swimming endurance and swimming speed for fivespecies of southern California coastal marine fish, with original figure legend. FromDorn et al. (1979). ......................................................................................................... B-10
Figure B-10 Relationships between swimming endurance and swimming speed for fourspecies of southern California coastal marine fish, with original figure legend. FromDorn et al. (1979). ......................................................................................................... B-11

xvii
LIST OF TABLES
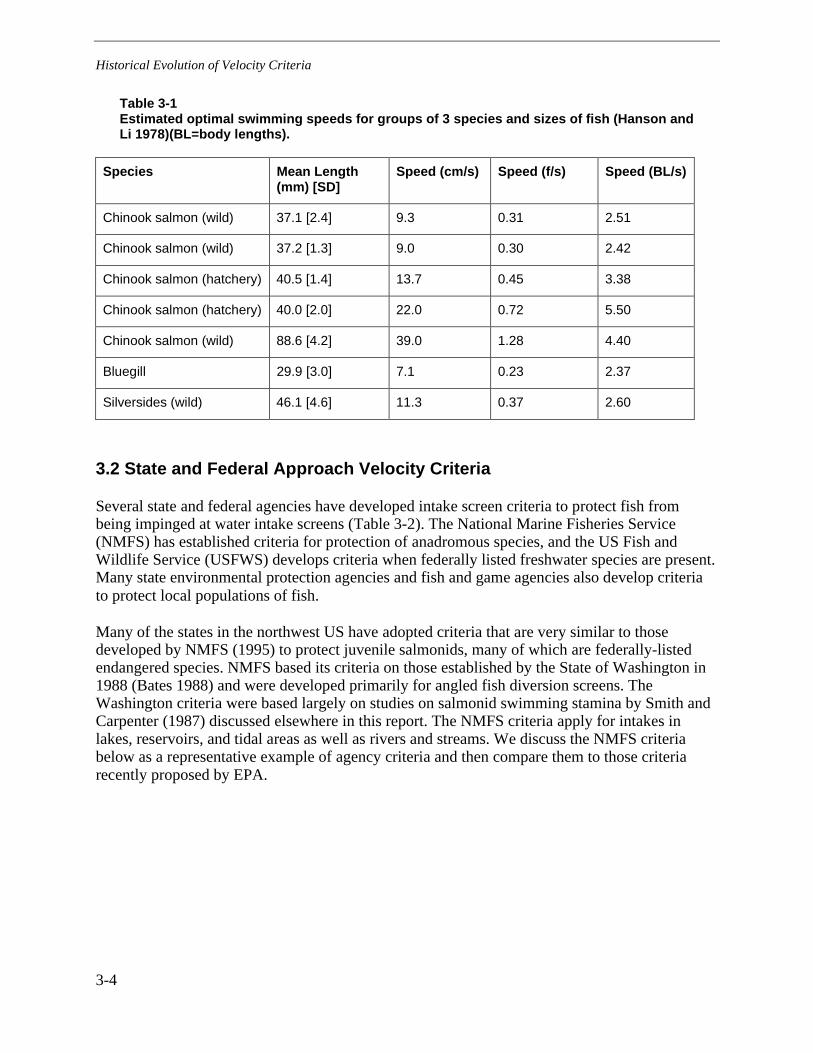
Table 3-1 Estimated optimal swimming speeds for groups of 3 species and sizes of fish(Hanson and Li 1978)(BL=body lengths). .........................................................................3-4
Table 3-2 Partial listing of various State and Federal agency velocity criteria for waterintake screens (Pearce and Lee 1991; NMFS 1995; NMFS 1997). ..................................3-5
Table 3-3 Comparison of approach velocity criteria developed by NMFS and proposedby EPA.............................................................................................................................3-8
Table 4-1 Species occurrences at power plants for which impingement numbers werereported in EPRI's 1995 Intake Structure Database (ISDB) (five or moreoccurrences only) compared to the number of swimming speed studies in theliterature. ........................................................................................................................4-36
Table A-1 Summary of experiments on the critical swimming speeds of a various fishes....... A-2


1-1
1 INTRODUCTION
1.1 Background
Under an October 1995 Consent Decree, the U.S. Environmental Protection Agency (EPA)currently is engaged in a rulemaking process for implementing Clean Water Act Section 316(b),which applies to cooling water intake structures (CWIS). As part of that effort, EPA isdeveloping a set of proposed regulations. The proposed regulations will, in part, address themeaning of “adverse environmental impact” (AEI), approaches for assessing the potential forAEI, and measures for minimizing AEI. These measures may include requirements affecting thedesign, construction, location, and capacity of CWIS that are determined to reflect the “besttechnology available” (BTA). Potentially impacted are all power plants and industrial facilitieswithdrawing cooling water. EPA has issued a draft set of rules for new power station CWIS (65FR 49060; August 10, 2000) and currently is collecting data that it will use to formalize the new-plant rule and to develop its proposed rule for existing power stations.
A draft framework for the proposed EPA rule was presented and discussed at EPRI’s April 1999Conference on Power Generation Impacts on Aquatic Resources (Nagle and Morgan 2000).Although now outdated, that framework stimulated this review of the relevant scientificliterature. At that time, the draft framework contemplated a three-tiered analysis designed toevaluate the extent of adverse environmental impact (AEI) from operation of a facility’s coolingwater intake structure and to determine the best available technology (BTA) to minimize theadverse impacts when they were indicated. The intent of Tier 1 was to establish operationalstandards for the performance of the cooling water intake technologies that would be mosteffective in minimizing impingement and entrainment. If a facility could not demonstratecompliance with those standards, a site-specific evaluation in subsequent tiers would benecessary.
The proposed EPA Tier 1 screening process was designed to provide the first estimate of thepotential for an intake to cause adverse impact from impingement and entrainment. Within thistier, selected performance characteristics, along with limited site environmental characteristics,would be evaluated. Characteristics to be evaluated would include: (1) CWIS approach velocity;(2) total intake flow; (3) intake flow as a percentage of source water body flow or volume; (4)site environmental characteristics (e.g., presence of threatened and endangered species); and (5)other operational or site characteristics as determined by state permitting authorities. The EPA’sproposed criterion for the CWIS velocity was 0.5 feet-per-second (f/s; 15.25 cm/s; 65 FR 49060;August 10, 2000). Criteria have also been proposed for total intake flow as a percentage ofsource water body flow or volume. [Note: Except when referring to the proposed EPA criterionof 0.5 f/s or other regulatory criteria, we will use metric measures in this report. To convert

Introduction
1-2
between feet per second and centimeters per second, multiply f/s by 30.48 to get cm/s; multiplycm/s by 0.03281 to get f/s.]
The suggested criterion of about 0.5 f/s (15.25 cm/s) as a velocity that would precludeimpingement impacts at CWIS has been an informal guideline since the 1970s. It has been usedin National Environmental Policy Act Environmental Impact Statements and numerous licensingproceedings. However, no detailed technical reviews, analyses, or discussions are known to havebeen performed to support the criterion for power station cooling-water intakes. Similar criteriahave, however, been used for other types of intakes, such as for hydropower and irrigation. Thepurpose of this project was to perform the technical literature review and requisite data analysisto determine and discuss the appropriateness of 0.5 f/s or an alternative criterion, as a value lowenough that it would essentially preclude impingement impacts and allow for rapid CWISreview. Specific questions this report addresses include the following, as presented by EPRI staffand its Water Technical Committee:
• Is approach velocity an appropriate parameter for determining the potential for impingement?
• Assuming approach velocity is technically supportable, what are the approaches and methodsthat can be universally applied to CWIS for its proper measurement?
• Is a single value appropriate and, if so, is 0.5 f/s a technically supportable criterion or isanother criterion technically supportable?
1.2 Approach
The effects of CWIS intake velocity on impingement rates of juvenile and adult fish wereanalyzed using available scientific literature, government agency reports, and reports by utilitiesand their consultants. We performed the following analyses:
a. Reviewed the historical evolution and technical support for the criterion of 0.5 f/s. Wereviewed the technical basis for this criterion at power station CWIS. We reviewed other velocitycriteria (e.g., National Marine Fisheries Service and State of Washington criteria for hydropowerand irrigation diversion intakes) and provided technical documentation for these alternativecriteria should the criterion of 0.5 f/s not be supportable.
b. Reviewed methods for appropriately measuring and reporting relevant CWIS velocities (e.g.,average and/or maximum through-screen velocities, approach velocities at an appropriatedistance in front of screen, sweeping velocities, etc.). We evaluated the “landscape” of intakesand their approaches (canals, etc.) and the suggestion that CWIS may have a “point of noreturn,” beyond which an individual fish is incapable of avoiding impingement either by randomor directed swimming. We reviewed how the physical layout of intakes might be employed in thedesign and operation of CWIS to reduce fish impingement. We initiated the process of relatingcritical swimming speeds of fish to hydraulic flow field characteristics of different intakedesigns, with an eye toward site-specific evaluations and remedial measures.
c. Conducted a comprehensive literature review of the swimming capabilities of freshwater,estuarine, and marine fish. Data on the swimming capabilities of healthy fish were tabulated andthe factors that tend to reduce swimming capabilities (and thus make fish more susceptible to

Introduction
1-3
impingement) were discussed in a narrative text illustrated with examples. Swim speed data weresubdivided in ways that focus fish assemblages characteristic of specific ecological types, suchas streams, rivers, lakes, estuaries, coastal waters. We recognized a level of uncertainty in thecorrespondence between these laboratory studies and performance of fish in the field. Keepingwild fish in the laboratory can be stressful, for example. Conversely, a fish in the laboratory issomewhat pampered and may perform better than it would in the wild. Nonetheless, we believethe laboratory results to be indicative and useful for predictive assessments when used inconjunction with retrospective assessments of actual impingement rates. This juxtaposition ofpredictive and retrospective elements is a key feature of current EPA risk assessment guidelines(EPA 1998).
d. Finally, we addressed the questions posed specifically by EPRI, based on the results of ourliterature searches and analyses.
e. In addition, we recognized that EPRI has commissioned Alden Research Laboratory, Inc. todocument the relationship between CWIS approach velocity and rate of impingement atoperating power stations (the retrospective part of the evaluation). Relevant factors to beevaluated in that review were to include:
—water body type (lakes and reservoirs, rivers, estuaries and oceans)
—fish species, size, and age
—swimming speeds of fish
—the influence of fish behavior on the likelihood of impingement
—internal factors that may influence the rate of impingement (e.g., disease, condition)
—CWIS design and orientation (intake type, hydraulics)
—Other environmental factors relevant to impingement; i.e., pressure, turbulence, other flowfield characteristics, temperature, and dissolved gas concentrations


2-1
2 COOLING-WATER INTAKES
2.1 Types of CWIS
Operation of power plant condenser cooling systems requires large amounts of water that arewithdrawn directly from surface waters. These surface waters contain aquatic organisms thatmay be injured or killed through their interactions with the power plant. Fish and other aquaticorganisms that are drawn into the intake structure and are too large to pass through the intakedebris screens may be impinged against the screens. Mortality of impinged fish is high at manyplants because impinged organisms are eventually suffocated by being held against the screenmesh or are abraded, which can result in fatal infection.
Steam electric power plants use a wide variety of intake structure designs, ranging from intaketunnels a mile or more offshore, to shoreline intakes, to intakes that are recessed from theshoreline by canals. Similarly, there are numerous designs for debris and fish protection screensthat are contained in the intake structure. Cannon et al. (1979) reviewed intake structures andconcluded that the design features that contributed to high rates of impingement are (1)undesirable location in biologically productive areas; (2) relatively large intake system flow; (3)high screenwell velocities; (4) intake conveyance channels; (5) intrusion of the intake structureinto the main streamflow; (6) non-uniform velocities across the screen face that may reduce theeffective screen area; and (7) screenwell entrapment areas. They recognized that it is oftendifficult and impractical to ascertain quantitatively the effectiveness of intake structuremodifications when one or all of the above design features are eliminated.
Irrespective of the intake location, system flow rate, and particular design configurations, theprimary approach toward minimizing intake-related impacts has been to design the intake so thatits velocities avoid disturbance of the fish schooling and swimming patterns and permit ease ofegress for those fish that swim into the sphere of influence of the intake flow. However, giventhe variability in design type, one should recognize that the velocity at the screen face (if a screenexists) is not always the most critical when it comes to impingement effects. For example, thedesign and location of an unscreened offshore intake may be such that entrainment of organismsis virtually non-existent, thereby making the velocities at a screen face that could be locatedonshore meaningless with regards to impingement probabilities. The converse could also be true.If the initial intake opening of a canal or pipe is constricted creating high velocities that readilyentrained fish, it wouldn't matter how much velocities were moderated at the face of the screenfurther down the system if entrapped fish had no way to leave the canal or holding area.Therefore, for many facilities, the area of critical interest is the initial opening to the coolingsystem intake, particularly if no fish collection or bypass system further down the line is present.
Cooling-Water Intakes
2-2
2.2 Flow Fields
Nearly all intakes at water diversion facilities (whether for cooling water, hydroelectricgeneration, municipal supply, or irrigation) have a local effect on the velocity and flow directionof water near the intake. The extent of this effect depends largely on the quantity of waterdiverted relative to the size of the waterbody and the design features of the facility (e.g., thepositioning of the intake structure relative to the natural flow of the water body). These twocomponents, water velocity and direction of flow, define the flow field around the intakestructure and are two of the most important factors in fish impingement and entrainment. Fishthat happen into the flow field created by the intake system are at potential risk of impingementunless (1) they have the swimming capability to maintain position in the flow field and sufficientcues are available that they will avoid the screens (perhaps leaving the area entirely) or (2) theyare successfully transported out of the flow field and away from the intake.
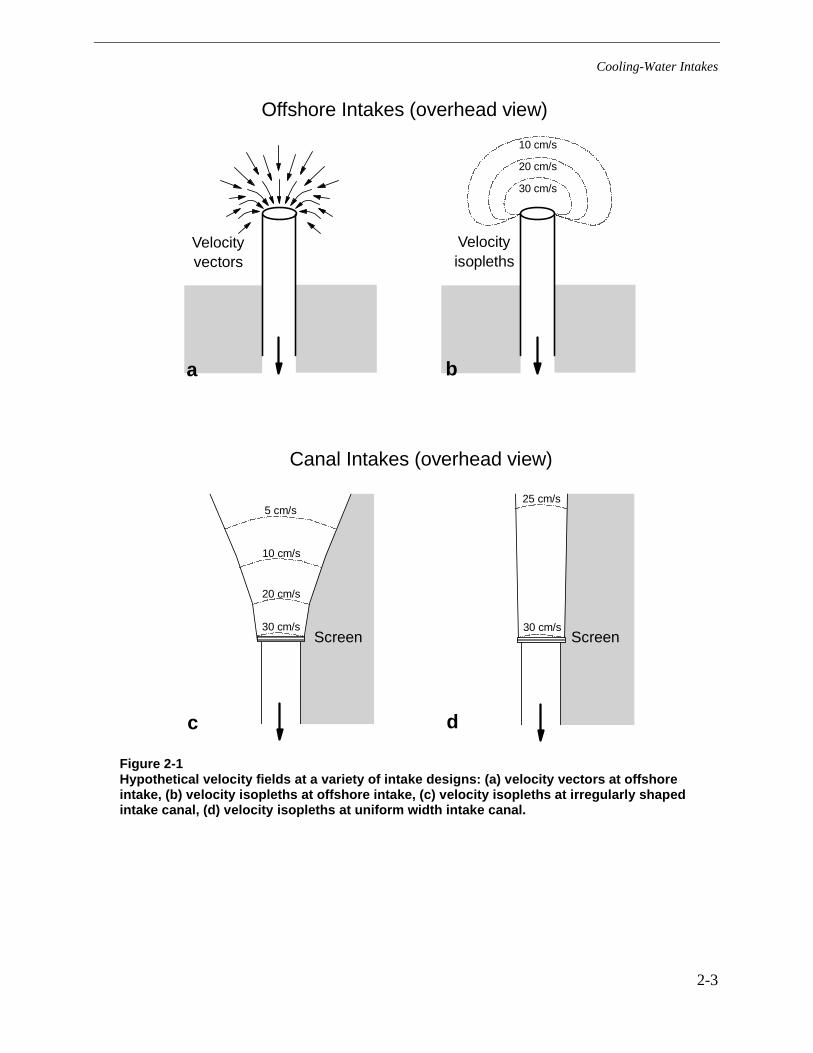
The flow field in front of an intake (or intake screen) is typically comprised of a range ofvelocities depending on proximity to the intake or screen and other structures that alter flow. Theflow field can be described graphically as a collection of vectors that indicate velocity anddirection of flow (Figure 2-1a). A graph of velocity isopleths is a useful tool for understandingthe potential effects of the flow field on fish (Figure 2-1b,c, and d). Although nearly every designis unique, the typical velocity field is characterized by increasing velocities as one approachesthe intake, though not necessarily at a level that fish cannot avoid impingement. For intakeslocated where little natural flow exists, the velocity field typically decreases with distance fromthe intake (Figures 2-1b and c). Where a long uniform canal leads to the intake, we would expectvelocities to be fairly uniform as well, right up to the screen, at which point the water acceleratesas it passes through the screen (Figure 2-1d). In reality, intake configurations and velocity fieldsare rarely as uniform as those shown in these illustrations. Irregularities in design and flow canresult in heterogeneous environments that often provide holding areas and escape routes for fishthat happen into the intake’s flow field. In rivers, tidal zones, and other areas where naturalcurrents exist, the flow field is a function of the combined effects of the natural water movementand the intake rate and design.
Cooling-Water Intakes
2-3
Canal Intakes (overhead view)
Offshore Intakes (overhead view)
a b
c d
30 cm/s
20 cm/s
10 cm/s
5 cm/s
30 cm/s
25 cm/s
30 cm/s
20 cm/s
10 cm/s
Velocityvectors
Velocityisopleths
Screen Screen
Figure 2-1Hypothetical velocity fields at a variety of intake designs: (a) velocity vectors at offshoreintake, (b) velocity isopleths at offshore intake, (c) velocity isopleths at irregularly shapedintake canal, (d) velocity isopleths at uniform width intake canal.

Cooling-Water Intakes
2-4
2.3 Fish Effects
A fish’s ability to avoid impingement depends on its swimming ability relative to the velocitiesin the flow field and the distance it needs to swim to reach a safe area. For each individual fishthere is a theoretical point (i.e., distance from the intake) beyond (or outside of) which a fish isable to swim away from the intake flows of the facility and move away from a potential adverseencounter with the intake. Inside of this fish-specific, theoretical point-of-no-return (i.e., nearerto the facility), the velocities and distance that must be overcome to escape the intake would bebeyond the swimming ability and stamina of that particular fish. Other fish of a different size,condition, or swimming ability might have a different point of no return and would notnecessarily be affected the same way. This is an important concept to understand in order toevaluate the importance of approach velocity in the rate of impingement at water intakes.
Even if a fish is able to initially avoid impingement upon first encountering a screen, it may notbe able to sustain swimming at a speed that would carry it beyond the influence of the facilityand it could eventually become fatigued and return to the face of the screen. This point-of-no-return varies among facilities and species and also is dependent on other factors such as fish size,physiological condition, water temperature, and dissolved oxygen. For fish at a screen withrelatively slow approach velocities, there may be no “point-of-no-return”; in this case, a healthyfish should be able to swim away from the screen when the screen is approached.
Once at the screen, the ultimate fate of a fish that is beyond this theoretical point-of-no-returncan take several paths. At a screen with no bypass or fish collection capabilities, the fish maybecome impinged against the screen where it will die and eventually be removed from the screenwith other debris. Alternatively, some screens are designed to collect fish off the screen andreturn them to the water body beyond the influence of the intake facility. Although these fishcollection systems may return fish to the water alive, the stresses associated with impingement,collection, and transport will sometimes still result in premature mortality. The design of the fishreturn system and the location and environmental quality of the return location are also importantfactors in fish survival.
Some facility designs, particularly those located on streams and rivers, provide bypass systemsthat transport the fish around fish screens in a manner that usually requires less physical contactthan other fish collection devices. These systems typically depend on fish coming in contact (ornear contact) with the screen. Designs that minimize contact with the screen and minimize theabrasive nature of the screen material can reduce the amount of descaling and skin abrasionsexperienced by fish that come in contact with the screen thereby increasing the survival of fishthat are directed in one way or another away from the screen.
The success of any of these systems in preventing impingement and transporting a healthy fish toa safe area is largely dependent on the design of the facility, the approach velocities near thescreen, and characteristics of the fish (e.g., species, size, and behavioral response to differentintake designs). Although prevailing thought may be that slower approach velocities are alwaysmore protective, some fish collection and bypass systems are more effective at higher velocities.For example, some fish collection systems depend on fish getting impinged before removal (butsee Fletcher (1990 and 1994) for a discussion of the difficulties in achieving this goal). Thequicker they become impinged the less fatigued they are and the greater the likelihood of a

Cooling-Water Intakes
2-5
healthy recovery. Some bypass systems are designed to direct the fish along the screen to thebypass, and therefore, higher flows mean less time that the fish is in contact with the screen andthe quicker it is bypassed. For example, in a laboratory study conducted at different velocitieswith angled screens, Wert et al. (1987) found that fish were impinged at a higher rate at 3–4 f/sthan at 6–10 f/s.
2.4 Intake Velocities and Hydraulics
In order to clearly discuss the intake velocity regulations and effects, basic terminology mustfirst be established.
Stream velocity—The velocity of flow in the water body. In rivers it is the velocity of the riverflow passing the intake location. In estuaries and bays, it is the velocity of tidal currents, whichare likely to change both magnitude and direction daily. In large lakes, prevailing winds canestablish currents that can modify the effect of intake velocities.
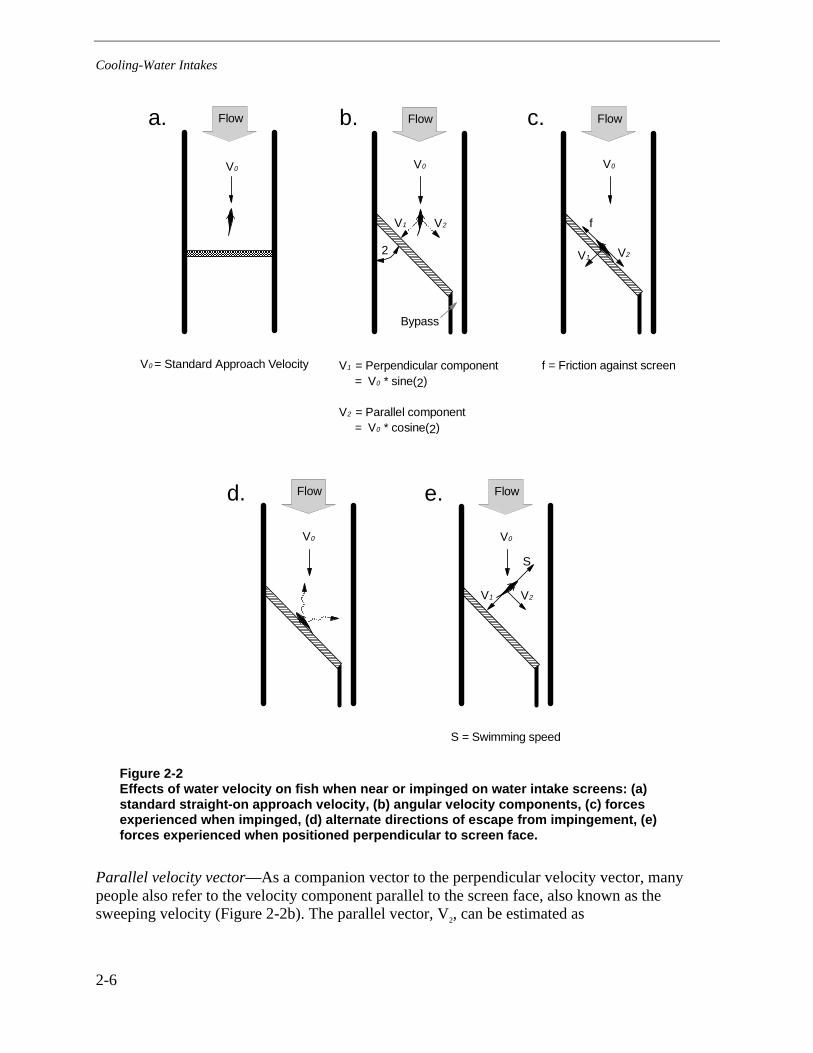
Standard approach velocity—The term “approach velocity” has taken on a variety of meanings,which can lead to some confusion (R2 Resource Consultants 1997c). For the purpose of thisreview, we are defining the standard approach velocity, V0, as the average water velocitymeasured a few inches in front of the screen taken in the same direction as the general flow. Thedirectionality of this flow is not necessarily perpendicular to the screen, but may be. Thisdefinition of approach velocity describes the velocity experienced by the fish as it swims freelynear the front of the intake screen (Figure 2-2a). Approach velocity can be calculated as:
[1] V 0 = (intake flow)/(intake cross-sectional area)
Perpendicular velocity vector - Many people have taken to defining approach velocity as thevelocity component perpendicular to the screen face regardless of the angle of the screen relativeto the normal direction of flow (Figure 2-2b; NMFS 1995). In this review we refer to this flowcomponent as the “perpendicular velocity vector” to differentiate it from the previously definedapproach velocity. The perpendicular vector, V1, is calculated as
[2] V 1 = V0*sine(θ),
where V is the normal approach velocity a few inches in front of the screen and θ is the angle ofthe screen relative to the normal flow direction (e.g., θ for a screen parallel to the flow is 0degrees, and θ for a screen perpendicular to the flow is 90 degrees). This velocity component canalso be estimated by dividing the flow (cfs) at the screen by the total area of the screen. Althoughthis definition of approach velocity is widely used, it is nothing more than a mathematicalcomponent, and does not represent an actual direction of flow through the screen (Fletcher 1985,R2 Resource Consultants 1997c). The perpendicular velocity vector by definition will always beless than the standard approach velocity as long as the screen is angled relative to the flow.
Cooling-Water Intakes
2-6
Flow Flow
V0
V1 V2
V0
Flow
V0
V1 V2
f
Bypass
V0 = Standard Approach Velocity V1 = Perpendicular component = V0 * sine(2)
V2 = Parallel component = V0 * cosine(2)
f = Friction against screen
2
Flow
V0
V1 V2
Flow
V0
S
S = Swimming speed
d. e.
a. b. c.
Figure 2-2Effects of water velocity on fish when near or impinged on water intake screens: (a)standard straight-on approach velocity, (b) angular velocity components, (c) forcesexperienced when impinged, (d) alternate directions of escape from impingement, (e)forces experienced when positioned perpendicular to screen face.
Parallel velocity vector—As a companion vector to the perpendicular velocity vector, manypeople also refer to the velocity component parallel to the screen face, also known as thesweeping velocity (Figure 2-2b). The parallel vector, V2, can be estimated as
Cooling-Water Intakes
2-7
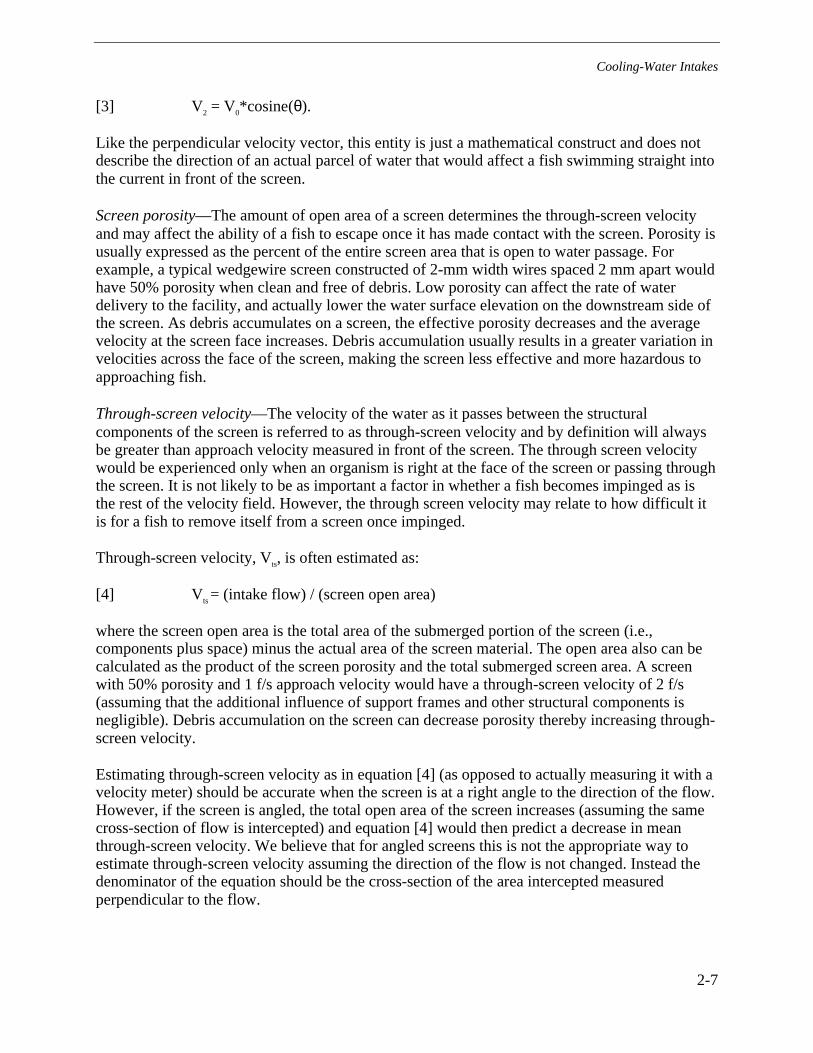
[3] V 2 = V0*cosine(θ).
Like the perpendicular velocity vector, this entity is just a mathematical construct and does notdescribe the direction of an actual parcel of water that would affect a fish swimming straight intothe current in front of the screen.
Screen porosity—The amount of open area of a screen determines the through-screen velocityand may affect the ability of a fish to escape once it has made contact with the screen. Porosity isusually expressed as the percent of the entire screen area that is open to water passage. Forexample, a typical wedgewire screen constructed of 2-mm width wires spaced 2 mm apart wouldhave 50% porosity when clean and free of debris. Low porosity can affect the rate of waterdelivery to the facility, and actually lower the water surface elevation on the downstream side ofthe screen. As debris accumulates on a screen, the effective porosity decreases and the averagevelocity at the screen face increases. Debris accumulation usually results in a greater variation invelocities across the face of the screen, making the screen less effective and more hazardous toapproaching fish.
Through-screen velocity—The velocity of the water as it passes between the structuralcomponents of the screen is referred to as through-screen velocity and by definition will alwaysbe greater than approach velocity measured in front of the screen. The through screen velocitywould be experienced only when an organism is right at the face of the screen or passing throughthe screen. It is not likely to be as important a factor in whether a fish becomes impinged as isthe rest of the velocity field. However, the through screen velocity may relate to how difficult itis for a fish to remove itself from a screen once impinged.
Through-screen velocity, Vts, is often estimated as:
[4] V ts = (intake flow) / (screen open area)
where the screen open area is the total area of the submerged portion of the screen (i.e.,components plus space) minus the actual area of the screen material. The open area also can becalculated as the product of the screen porosity and the total submerged screen area. A screenwith 50% porosity and 1 f/s approach velocity would have a through-screen velocity of 2 f/s(assuming that the additional influence of support frames and other structural components isnegligible). Debris accumulation on the screen can decrease porosity thereby increasing through-screen velocity.
Estimating through-screen velocity as in equation [4] (as opposed to actually measuring it with avelocity meter) should be accurate when the screen is at a right angle to the direction of the flow.However, if the screen is angled, the total open area of the screen increases (assuming the samecross-section of flow is intercepted) and equation [4] would then predict a decrease in meanthrough-screen velocity. We believe that for angled screens this is not the appropriate way toestimate through-screen velocity assuming the direction of the flow is not changed. Instead thedenominator of the equation should be the cross-section of the area intercepted measuredperpendicular to the flow.


3-1
3 HISTORICAL EVOLUTION OF VELOCITY CRITERIA
3.1 Criterion of 0.5 f/s for CWIS
The origin of a 0.5 f/s criterion for intake velocities at steam electric power stations is lost in amurky history. Review of the Atomic Energy Commission’s Environmental Impact Statementsfor nuclear power plant construction and operation from the early 1970s revealed an oft-usedillustration derived from impingement studies at the Indian Point Plant on the Hudson River(Figure 3-1). This figure illustrates the number of fish counted in screen washings when theintake water was flowing at several velocities. There is a strong rise in impingement when theintake velocity exceeded about 1 f/s. Although 1 f/s is generally discussed, the curve may haveled to selection of 0.5 f/s as a conservative figure.
Figure 3-1Environmental Impact Statements by the Atomic Energy Commission in the early 1970sused this figure of fish counts on intake screens at the Indian Point Plant on the HudsonRiver to illustrate increased impingement above about 1 f/s (30.48 cm/s). From USAEC(1975).
Studies of water diversion intakes in California in the 1950s produced swim speed data inrelation to impingement rates, and yielded a recommended limit of 1.5 f/s for the assemblage ofspecies including striped bass and chinook salmon (Kerr 1953). However, Dorn et al. (1979),after comparing the swimming speeds of southern California coastal marine species to species
Historical Evolution of Velocity Criteria
3-2
actually trapped in the Redondo Beach Generating Station concluded that “intake velocity shouldnot be a major consideration in evaluating the causative factors of fish entrainment. Swimmingperformance tests would not appear to be useful for such future analytical efforts.” Only two ofthe nine common species tested by Dorn et al. were actually entrapped in large numbers in thewater intakes.
Emphasizing the role of temperature in swim speed capabilities of estuarine species such aswhite perch, King (1971) recommended different maximum intake velocities for cold and warmmonths. He recommended 24.4 cm/s (0.8 f/s) in winter when water temperatures are often near 2C in the mid-Atlantic states, and 30.5 cm/s (1 f/s) when temperatures are above 7 C.
As the power station impact assessment strategies developed in the 1970s with advent of CWAsection 316(b), evaluation of CWIS began to focus on population modeling and estimates ofpopulation effects of entrainment and impingement losses, largely because of the intenseattention to power plants on the Hudson River (Barnthouse et al. 1998). Velocity criteria andother criteria for minimizing numbers of fish impinged were considered on a more site-specificbasis rather than as national criteria.
Because impingement on power station intake screens seemed to occur at approach velocitiesless than the average critical swimming speed of fish species (the most commonly used measureof swimming capability; see definitions in section 4.1), Hanson and Li (1978) proposed differentpredictors and design criteria. They proposed use of the “energetically optimal swim speed” andthe “behaviorally selected swim speed”, which they found to be similar for a species at commontemperatures and fish sizes. The energetically optimal swim speed is the speed that can besustained in an oxygen-uptake respirometer using the lowest oxygen uptake rate (Figure 3-2).The behaviorally selected swim speed is that speed at which a fish species of a certain size, andat a specific water temperature, cruises in absence of water velocity or that it selects in a gradientof velocities.

Historical Evolution of Velocity Criteria
3-3
Figure 3-2There is minimal oxygen consumption per kilogram of fish per distance swum within acertain range of velocities. This optimal range has been suggested by Hanson and Li (1978) as one measure suitable for setting intake velocity criteria to protect fish formimpingement. It is less than the critical swimming speed, and closer to the natural cruisingspeed.
Hanson and Li (1978) proposed criteria for maximum intake velocities that would not exceedthese speeds. After conducting experiments with juvenile chinook salmon, bluegill, andMississippi silversides, these authors found a correlation of 0.92 between the energeticallyoptimum swim speed and the behaviorally selected swim speed, a reasonably close relationship.Thus, they suggested an interchangeability, with the energetically optimal speed as the preferredindex, because it could be determined in a simple respirometer device. The estimated optimalswimming speeds ranged from 0.23 f/s (7.1 cm/s) for 30-mm bluegill to 1.28 f/s (39 cm/s) for89-mm wild, juvenile chinook salmon, with most results less than 0.5 f/s (15.25 cm/s; Table 3-1).The variation was anticipated, and the authors noted that key species and life stages would haveto be selected for protection at a site. In Europe, by contrast, Stahlberg and Peckmann (1987)concluded from studies of swimming speeds of four small stream fish that a velocity of 40 cm/sshould not be exceeded in stream improvements. Thus, with the origin of a general criterion of0.5 f/s unclear, and several alternatives available in the literature, we looked elsewhere forjustification of this or similar intake-velocity criteria.
Historical Evolution of Velocity Criteria
3-4
Table 3-1Estimated optimal swimming speeds for groups of 3 species and sizes of fish (Hanson andLi 1978)(BL=body lengths).
Species Mean Length(mm) [SD]
Speed (cm/s) Speed (f/s) Speed (BL/s)
Chinook salmon (wild) 37.1 [2.4] 9.3 0.31 2.51
Chinook salmon (wild) 37.2 [1.3] 9.0 0.30 2.42
Chinook salmon (hatchery) 40.5 [1.4] 13.7 0.45 3.38
Chinook salmon (hatchery) 40.0 [2.0] 22.0 0.72 5.50
Chinook salmon (wild) 88.6 [4.2] 39.0 1.28 4.40
Bluegill 29.9 [3.0] 7.1 0.23 2.37
Silversides (wild) 46.1 [4.6] 11.3 0.37 2.60
3.2 State and Federal Approach Velocity Criteria
Several state and federal agencies have developed intake screen criteria to protect fish frombeing impinged at water intake screens (Table 3-2). The National Marine Fisheries Service(NMFS) has established criteria for protection of anadromous species, and the US Fish andWildlife Service (USFWS) develops criteria when federally listed freshwater species are present.Many state environmental protection agencies and fish and game agencies also develop criteriato protect local populations of fish.
Many of the states in the northwest US have adopted criteria that are very similar to thosedeveloped by NMFS (1995) to protect juvenile salmonids, many of which are federally-listedendangered species. NMFS based its criteria on those established by the State of Washington in1988 (Bates 1988) and were developed primarily for angled fish diversion screens. TheWashington criteria were based largely on studies on salmonid swimming stamina by Smith andCarpenter (1987) discussed elsewhere in this report. The NMFS criteria apply for intakes inlakes, reservoirs, and tidal areas as well as rivers and streams. We discuss the NMFS criteriabelow as a representative example of agency criteria and then compare them to those criteriarecently proposed by EPA.

Historical Evolution of Velocity Criteria
3-5
Table 3-2Partial listing of various State and Federal agency velocity criteria for water intake screens(Pearce and Lee 1991; NMFS 1995; NMFS 1997).
Agency Perpendicular approach velocity 1 (f/s)Sweeping velocity 2
(Parallel velocity vector)
Fry (< 60 mm) Juv. (>60 mm)
NMFS-NorthwestRegion
0.4 0.8 > approach velocity
NMFS-SouthwestRegion
0.33-0.4 0.8 > approach velocity
California DFG/USFWS 0.23 Same as fry At least 2X approach velocity
Oregon DFW 0.5 1.0 > approach velocity
Washington DFW 0.4 -- > approach velocity
Alaska DFG 0.5 Same as fry No criterion
Idaho DFG 0.5 Same as fry Sufficient to avoid physicalinjury to fish
Montana DFWP 0.5 1.0 No criterion
New York 0.5, 1.04 Same as fry No criterion
Virginia 0.25 Same as fry No criterion
1 Velocity component perpendicular to screen face calculated as (sine [screen angle]*approach velocity).2 Velocity component parallel to screen face calculated as (cosine [screen angle]*approach velocity).3 Specific criteria where Delta smelt are present4 New York has no official written criteria, but the general guidance is 0.5 f/s at fixed screens and 1.0 f/s attraveling screens (personal communication with Ed Radle of New York State Department ofEnvironmental Conservation).
3.2.1 NMFS Northwest Criteria
Approach Velocity—The approach velocity criteria established by the Northwest Region ofNMFS refers to the perpendicular velocity component, V1, described earlier, measured (orestimated) at three inches in front of the screen. The criterion for fry (<60 mm length) is 0.4 f/sand for fingerling (>60 mm length) 0.8 f/s. Some state criteria vary slightly from the NMFScriteria, ranging from 0.25 to 1.0 f/s. The lowest criterion (0.2 f/s) is found in California and onlyapplies when the endangered Delta smelt is present (NMFS 1997).

Historical Evolution of Velocity Criteria
3-6
Sweeping Velocity—NMFS requires that the sweeping velocity (i.e., V2, the water velocityvector parallel and adjacent to the screen face) be greater than the perpendicular velocity vector.This is accomplished by angling the screen at an angle less than 45 degrees relative to the normaldirection of the flow. Most western states also have adopted this criterion for water bodies wheresalmon are present. California requires that sweeping velocity be at least twice as much as theperpendicular velocity component, which would require a screen angle of 26 degrees or less.
Screen openings and porosity—NMFS provides screen opening criteria for both fry andfingerling salmonids for different types of screen material (i.e., perforated plate, profile barscreen, and woven wire screen) to prevent fish from passing through the screen. Regardless ofthe material, the screen must provide a minimum of 27% porosity if fry are present and 40%porosity if fingerling are present. It is not clear why a minimum porosity would be required andnot a maximum since an unlimited maximum would allow more fish to pass through the screenand become entrained.
Bypass layout—NMFS requires that the screen and bypass work in tandem to move out-migrating fish to the bypass outfall with a minimum of injury or delay. Screens placed in thediversions shall be constructed with the downstream end of the angled screen terminating at abypass entrance. Multiple bypass entrances (intermediate bypasses) shall be employed if thesweeping velocity will not move fish to the bypass within 60 seconds, assuming fish would bepassively transported at a rate equivalent to the sweeping velocity.
The NMFS criteria were designed under the assumption that fry-sized salmonids and low watertemperatures are present at all sites. However, NMFS does state that “Since these guidelines andcriteria are general in nature, there may be cases where site constraints or extenuatingcircumstances dictate that certain criteria be waived or modified.” For example, if fieldobservations show specifically when particular sizes of salmonids are in the vicinity of theintake, criteria could conceivably be adjusted such that the protection is aimed at that size class.[Note: Washington DFW standards also include this flexibility, and we suspect others do aswell.]
3.2.2 Comparison to Proposed EPA Criteria
The intake velocity performance standard proposed by EPA for CWIS at new facilities is 0.5 f/s(65 FR 49060; August 10, 2000). This standard is specifically referred to as the “design intakevelocity” since it would be used to evaluate proposed facility designs prior to construction. EPAdefines the design intake velocity as “the average speed at which intake water passes through theopen area of the intake screen or other device against which organisms might be impinged.” Thisis comparable to the through-screen velocity defined above. The proposed rules do not mentionany regulations on screen spacing or angles, but do propose limits on the amount of water thatcan be diverted as a function of the total volume of the affected water body.
In order to compare the NMFS criteria and the performance standard proposed by EPA, thevalues need to be converted to common terms. We will make two comparisons, first convertingEPA's proposed standard to NMFS conditions (i.e., the perpendicular velocity vector 2-3 inchesin front of the screen) and then converting NMFS criteria to EPA requirements (through-screenvelocity irrespective of angle).
Historical Evolution of Velocity Criteria
3-7
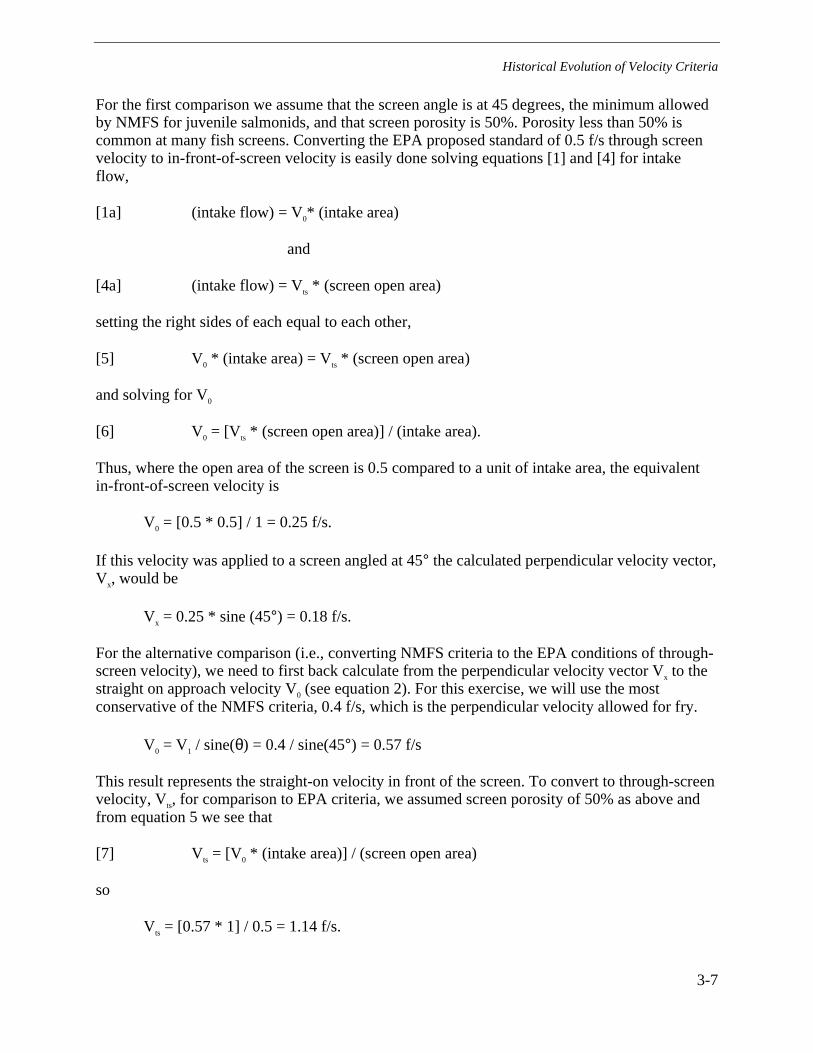
For the first comparison we assume that the screen angle is at 45 degrees, the minimum allowedby NMFS for juvenile salmonids, and that screen porosity is 50%. Porosity less than 50% iscommon at many fish screens. Converting the EPA proposed standard of 0.5 f/s through screenvelocity to in-front-of-screen velocity is easily done solving equations [1] and [4] for intakeflow,
[1a] (intake flow) = V0* (intake area)
and
[4a] (intake flow) = Vts * (screen open area)
setting the right sides of each equal to each other,
[5] V 0 * (intake area) = Vts * (screen open area)
and solving for V0
[6] V 0 = [Vts * (screen open area)] / (intake area).
Thus, where the open area of the screen is 0.5 compared to a unit of intake area, the equivalentin-front-of-screen velocity is
V0 = [0.5 * 0.5] / 1 = 0.25 f/s.
If this velocity was applied to a screen angled at 45° the calculated perpendicular velocity vector,Vx, would be
Vx = 0.25 * sine (45°) = 0.18 f/s.
For the alternative comparison (i.e., converting NMFS criteria to the EPA conditions of through-screen velocity), we need to first back calculate from the perpendicular velocity vector Vx to thestraight on approach velocity V0 (see equation 2). For this exercise, we will use the mostconservative of the NMFS criteria, 0.4 f/s, which is the perpendicular velocity allowed for fry.
V0 = V1 / sine(θ) = 0.4 / sine(45°) = 0.57 f/s
This result represents the straight-on velocity in front of the screen. To convert to through-screenvelocity, Vts, for comparison to EPA criteria, we assumed screen porosity of 50% as above andfrom equation 5 we see that
[7] V ts = [V0 * (intake area)] / (screen open area)
so
Vts = [0.57 * 1] / 0.5 = 1.14 f/s.

Historical Evolution of Velocity Criteria
3-8
The above analysis is summarized in Figure 3-3 and Table 3-3.
NMFS
Flow
0.4 fps0.57 fps
EPA
Flow
0.18 fps
0.25 fps0.5 fps1.14 fps
Figure 3-3Comparison of NMFS approach velocity criteria and proposed EPA criteria for threedifferent measures of approach velocity, (from left to right) through-screen velocity,perpendicular velocity component, and standard approach velocity.
Table 3-3Comparison of approach velocity criteria developed by NMFS and proposed by EPA.
Perpendicular velocityvector, V 1, in front of 45 °°
angled screenStraight-on approach
velocity, V 0
Through screenvelocity, V ts, with 50%
screen porosity
NMFScriteria
0.4 f/s 0.57 f/s 1.14 f/s
EPAproposedcriteria
0.18 f/s 0.25 f/s 0.5 f/s

Historical Evolution of Velocity Criteria
3-9
Although EPA states that it “. . . is not proposing the more stringent criteria of 0.33 ft/s and 0.40ft/s, developed by NMFS and the State of California, respectively, because they would beoverprotective . . .” (65 FR 49060; AUGUST 10, 2000), we have shown here that when thecriteria are presented in equivalent measures, the proposed criteria are actually more stringentthan those of NMFS.
An additional source of difference among the different criteria/standards is whether they apply toa maximum or average value of those measured across the screen. The EPA standard applies tothe average estimated velocity based on the design criteria, which would therefore not take intoaccount the effect of partial clogging of the screen by debris. The NMFS standards only state thatthe criteria can not be exceeded, but don't clarify whether this is at any single point ofmeasurement or on average. The NMFS criteria do require that uniform flow distribution bemaintained over the screen surface. Those establishing standards for operational screens need toconsider the implications of applying the standard to an average or maximum value in relation tothe effect of debris accumulation.


4-1
4 EVALUATION OF SWIMMING SPEED INFORMATIONAS A PREDICTIVE TOOL
4.1 Types of Swimming
How fish swim is relevant to the risk of their being impinged on intake screens of a powerstation. Performance of fish in certain swimming modes has been used to estimate acceptableapproach velocities for power station intakes, as discussed in section 3 (e.g., Kerr 1953; King1971; Hanson and Li 1978). This review has re-evaluated the scientific literature on swimmingto further assess and develop this predictive capability.
There is extensive literature on the mechanisms of fish swimming (for example, Webb 1994) thathas been summarized for the popular literature (Webb 1984) and has recently been applied to theoperation of man-made propulsion systems in the aquatic environment (Sfakiotakis et al. 1999).Most of this literature focuses on establishing the principles of propulsion kinetics rather thanquantifying swimming performance for applications such as evaluating CWISs.
The most recent tabulation of fish swimming capabilities from the scientific literature waspublished in 1978 by Beamish. However, Hammer (1995) provided a recent critical review offatigue and exercise tests with fish, including a summary of the terminology and classification ofswimming speeds. The physiological basis for the classification was explained with regard toburst, prolonged, and cruising speeds and the velocities that are critical to fish. The protocols forvelocity tests, both fixed (fatigue) and increased (incremental) were reviewed. The experimentscarried out by different authors were compared with respect to methodologies, which differedprimarily in the different time intervals and velocity increments employed. The dependency ofthe critical swimming speed (CSS or Ucrit; see definitions below) on factors such as speciesspecificity, race and population, size, season, time of day, temperature, sex, pollutants, light,food, training, and ambient gas content was outlined. Most such relationships were judged to beincompletely defined. Hammer concluded that the utility of critical swimming speed studies as asimple and sensitive measure of environmental or physiological factors is compromised byindividual variability, which is not often quantified. He did not tabulate the critical swimmingspeeds.
We approached this review with the assumption that the accumulated knowledge would beuseful for critiquing or developing intake velocity and design criteria. The knowledge largelywould take two forms, one being a current tabulation of critical swim speed data and the otherbeing a summary of the factors that cause a decline in critical swimming speeds that could affectfish impingement or entrainment at power station intakes (and the experimental evidence forthem).

Evaluation of Swimming Speed Information as a Predictive Tool
4-2
4.1.1 Sustained, Prolonged and Burst Swimming
Most fish generate thrust by bending their bodies into a backward-moving propulsive wave thatextends to the caudal fin, a type of swimming classified under body and/or caudal fin (BCF)locomotion (Breder 1926). There are two basic types of such swimming (Weihs and Webb1983):
1. Continuous, periodic propulsive (or steady, sustained) swimming, characterized by a cyclicrepetition of the propulsive movements, used for covering relatively long distances at a moreor less constant speed, and
2. Transient, discontinuous (or unsteady) movements that include rapid (fast) starts, burst orsprint swimming, acceleration, and turns lasting a short time and typically used for catchingprey, avoiding predators, or responding to disturbances.
Most authors recognize two types of continuous periodic swimming, sustained and prolonged(Beamish 1978). Sustained swimming can be maintained indefinitely and is often called thecruising speed. Prolonged swim speed is maintainable for only a certain length of time before theanimal fatigues. Also, discontinuous swimming can occur (without bursts) at low velocity andnot for catching prey, avoiding predators, or responding to disturbances, but simply as thepreferred mode.
The three types of swimming capability (sustained continuous, prolonged continuous, andtransient) can be distinguished in experiments that relate time to fatigue at speeds given relativeto body length (Figure 4-1; Beamish 1980). Burst swimming results in rapid fatigue; prolongedswimming can be sustained for longer times before fatigue occurs; sustained swimming can goon essentially endlessly. The three types can be shown by broken-stick graphs such as Figure4-1. The types of swimming use different aerobic and anaerobic energy supply systems (ordifferent combinations of them), a level of physiological detail that is available in the literaturebut will not be further explored here.
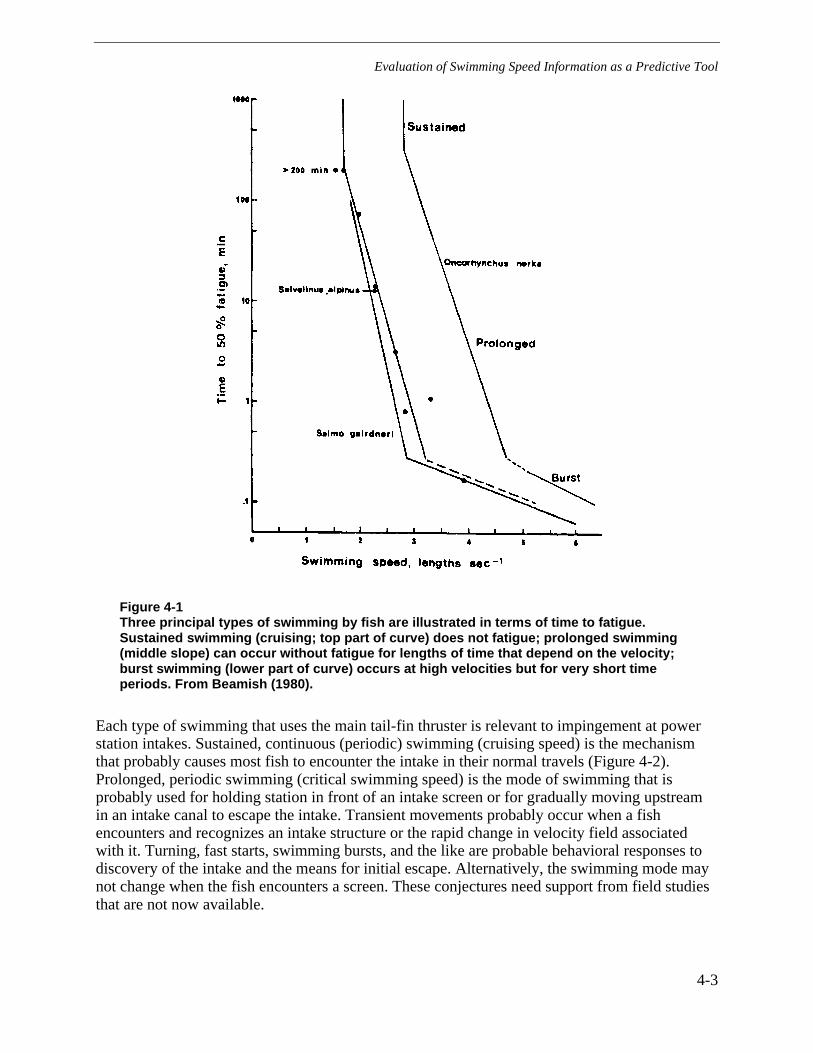
Evaluation of Swimming Speed Information as a Predictive Tool
4-3
Figure 4-1Three principal types of swimming by fish are illustrated in terms of time to fatigue.Sustained swimming (cruising; top part of curve) does not fatigue; prolonged swimming(middle slope) can occur without fatigue for lengths of time that depend on the velocity;burst swimming (lower part of curve) occurs at high velocities but for very short timeperiods. From Beamish (1980).
Each type of swimming that uses the main tail-fin thruster is relevant to impingement at powerstation intakes. Sustained, continuous (periodic) swimming (cruising speed) is the mechanismthat probably causes most fish to encounter the intake in their normal travels (Figure 4-2).Prolonged, periodic swimming (critical swimming speed) is the mode of swimming that isprobably used for holding station in front of an intake screen or for gradually moving upstreamin an intake canal to escape the intake. Transient movements probably occur when a fishencounters and recognizes an intake structure or the rapid change in velocity field associatedwith it. Turning, fast starts, swimming bursts, and the like are probable behavioral responses todiscovery of the intake and the means for initial escape. Alternatively, the swimming mode maynot change when the fish encounters a screen. These conjectures need support from field studiesthat are not now available.
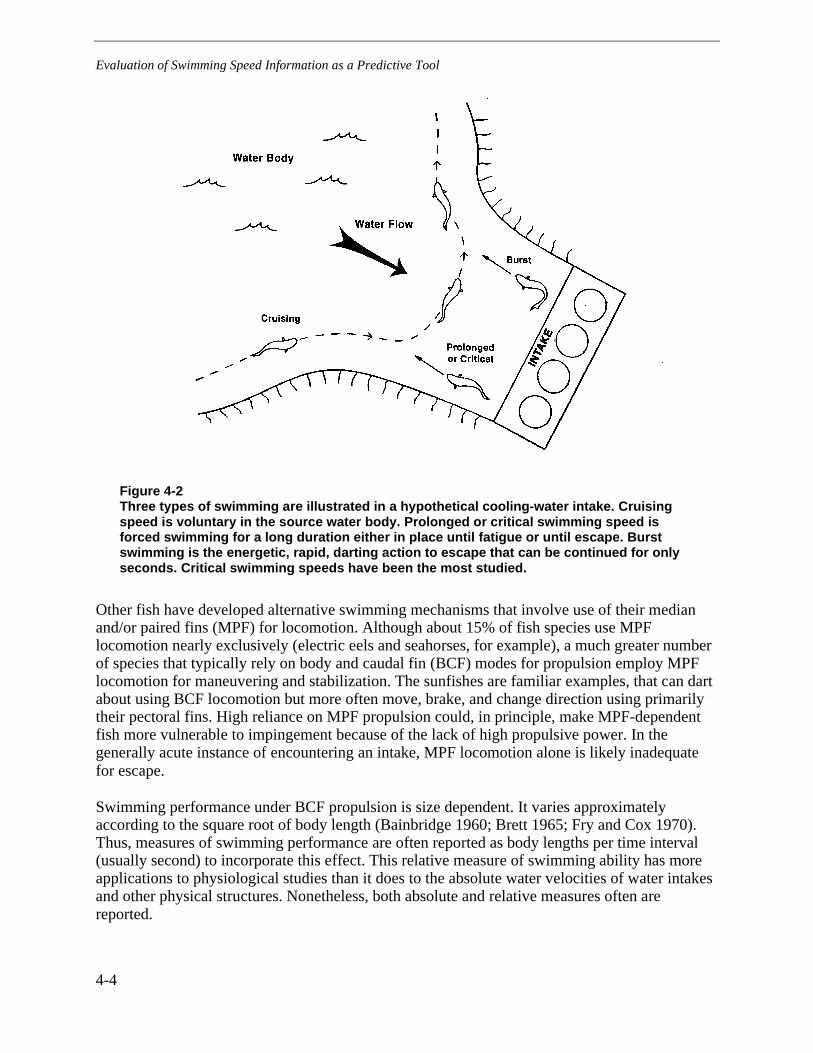
Evaluation of Swimming Speed Information as a Predictive Tool
4-4
Figure 4-2Three types of swimming are illustrated in a hypothetical cooling-water intake. Cruisingspeed is voluntary in the source water body. Prolonged or critical swimming speed isforced swimming for a long duration either in place until fatigue or until escape. Burstswimming is the energetic, rapid, darting action to escape that can be continued for onlyseconds. Critical swimming speeds have been the most studied.
Other fish have developed alternative swimming mechanisms that involve use of their medianand/or paired fins (MPF) for locomotion. Although about 15% of fish species use MPFlocomotion nearly exclusively (electric eels and seahorses, for example), a much greater numberof species that typically rely on body and caudal fin (BCF) modes for propulsion employ MPFlocomotion for maneuvering and stabilization. The sunfishes are familiar examples, that can dartabout using BCF locomotion but more often move, brake, and change direction using primarilytheir pectoral fins. High reliance on MPF propulsion could, in principle, make MPF-dependentfish more vulnerable to impingement because of the lack of high propulsive power. In thegenerally acute instance of encountering an intake, MPF locomotion alone is likely inadequatefor escape.
Swimming performance under BCF propulsion is size dependent. It varies approximatelyaccording to the square root of body length (Bainbridge 1960; Brett 1965; Fry and Cox 1970).Thus, measures of swimming performance are often reported as body lengths per time interval(usually second) to incorporate this effect. This relative measure of swimming ability has moreapplications to physiological studies than it does to the absolute water velocities of water intakesand other physical structures. Nonetheless, both absolute and relative measures often arereported.
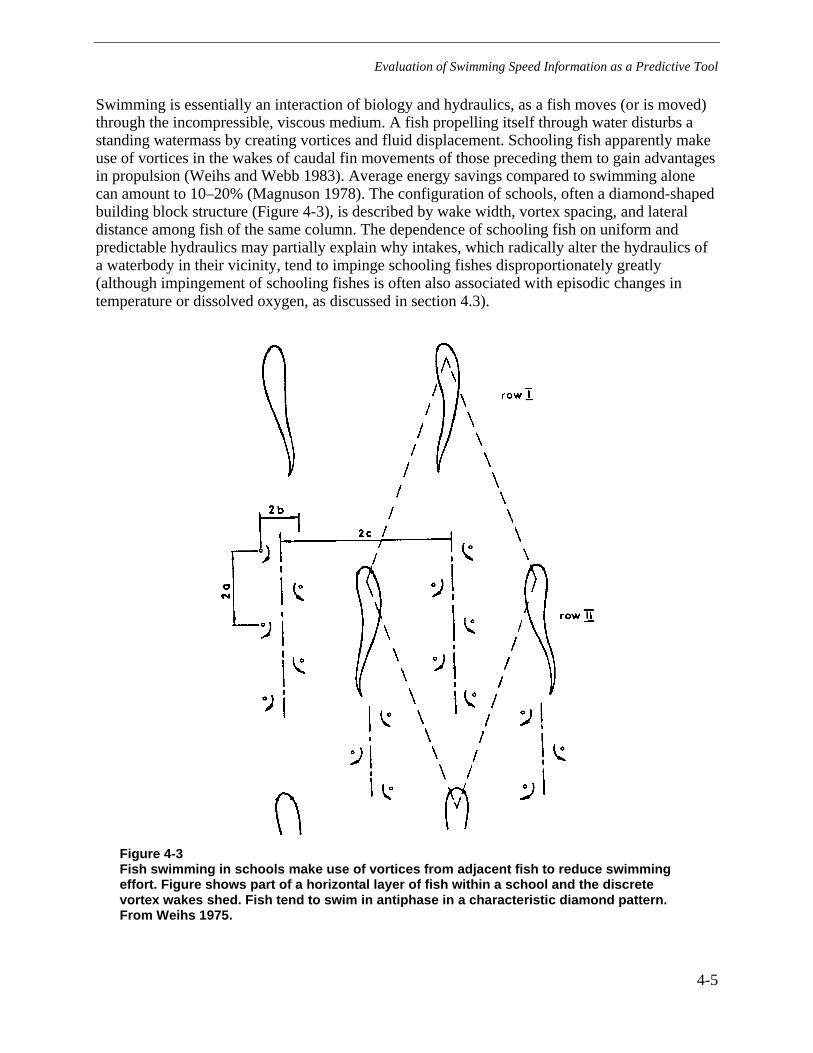
Evaluation of Swimming Speed Information as a Predictive Tool
4-5
Swimming is essentially an interaction of biology and hydraulics, as a fish moves (or is moved)through the incompressible, viscous medium. A fish propelling itself through water disturbs astanding watermass by creating vortices and fluid displacement. Schooling fish apparently makeuse of vortices in the wakes of caudal fin movements of those preceding them to gain advantagesin propulsion (Weihs and Webb 1983). Average energy savings compared to swimming alonecan amount to 10–20% (Magnuson 1978). The configuration of schools, often a diamond-shapedbuilding block structure (Figure 4-3), is described by wake width, vortex spacing, and lateraldistance among fish of the same column. The dependence of schooling fish on uniform andpredictable hydraulics may partially explain why intakes, which radically alter the hydraulics ofa waterbody in their vicinity, tend to impinge schooling fishes disproportionately greatly(although impingement of schooling fishes is often also associated with episodic changes intemperature or dissolved oxygen, as discussed in section 4.3).
Figure 4-3Fish swimming in schools make use of vortices from adjacent fish to reduce swimmingeffort. Figure shows part of a horizontal layer of fish within a school and the discretevortex wakes shed. Fish tend to swim in antiphase in a characteristic diamond pattern.From Weihs 1975.
Evaluation of Swimming Speed Information as a Predictive Tool
4-6
Burst swimming and the fast-start swimming that initiates it is associated with natural activitiessuch as feeding and avoiding predators. It also is relevant to the initial stages of moving awayfrom an intake screen once the screen has been touched or otherwise recognized as something tobe avoided. All fish show basically similar fast-start body movements (Eaton et al. 1977). Thereare typically three stages of movements originally described by Weihs (1973).
The overall swimming performance of a fish is a combination of capability and motivation toswim at a maximum rate of speed (MacPhee and Watts 1975). Swimming capability refers to thephysical ability of a fish to swim, which our literature review has shown to be dependent largelyon size and shape of the fish and its body temperature (and at a physiological level, on itsred:white muscle ratio). In contrast, the voluntary response or motivation of a fish to swim at amaximum rate of speed is governed by the psychological and physiological state of the fish,which can be influenced by many factors. Although physical factors such as temperature areimportant, more internal (innate) factors are also relevant, such as state of reproductivematuration or activity. These, in turn, are affected by hormonal cycles and photoperiodism. Forexample, Arctic grayling studied by MacPhee and Watts (1975) had to be in their upstreammigration mode for spawning to show an inclination to enter and swim through their testculverts. Delta smelt Hypomesus transpacificus studied by Swanson et al. (1998) employed threevelocity-dependent swimming gaits with a volitional switch between them: a discontinuous“stroke and glide” below about 10 cm/s, continuous swimming above 15 cm/s, and adiscontinuous “burst and glide” swimming above the critical swimming speed of about 28 cm/s.There was often a swimming failure between 10 and 20 cm/s during volitional transitionsbetween gaits that caused a fish to fall back against the screen of the text chamber.
Motivation to swim in the field implies some recognition by the fish of a need to swim. Further,the fish needs to know which type of swimming is most appropriate for the stimulus. Theparticular velocity, change in velocity, or other cues that serve to initiate swimming behavior ispoorly known. These motivational cues are probably as important (perhaps more so) as thephysiologically maximum swimming capability. Knowledge of normal migratory or othermovement behavior becomes important for interpretation of the swimming performance of fish,whether voluntary or forced. This behavioral aspect was reviewed for hydropower intakes byCoutant and Whitney (2000), but deserves further review and synthesis with respect to location,design and operation of cooling-water intakes.
4.1.2 Swimming Behavior of Bottom Fish
Bottom-dwelling fish are a special case. They often are not strong swimmers, but have evolved aswimming behavior that conserves energy even at relatively high water velocities. For example,largescale suckers Catostomus macrocheilus studied by Kolok et al. (1993) exhibited a 3-phaseresponse to increasing water velocity in an experimental apparatus designed to determine criticalswimming speed. In the first phase, 40-cm-long fish held position against the bottom in watervelocities up to 30–40 cm/s (0.75–1 BL/s), depending on temperature. Holding station did notinvolve any obvious changes in fin position or posture, nor did it involve the use of themouthparts to suck onto the bottom of the chamber. When fish were no longer able to holdstation, they first adopted a burst-and-glide method of swimming (phase 2). During this period(roughly 35–45 cm/s or 0.9–1.1 BL/s, depending on temperature) fish slowly slid to the back ofthe chamber, touched the downstream restraining screen, then swam to the front of the chamber
Evaluation of Swimming Speed Information as a Predictive Tool
4-7
to repeat the cycle. This phase continued until the velocity (generally >45 cm/s) requiredcontinuous swimming (phase 3). At the lowest temperature tested (5°C) swimming was impairedsuch that fish did not swim (other than a few abortive bursts) when subjected to water velocity inwhich they could not hold station.
Mottled sculpin Cottus bairdi, another benthic fish, used the first two phases (bottom holding,burst-and-hold) to maintain position rather than any continuous swimming (Facey and Grossman1990). In studies of this species by Webb et al. (1996), behavioral modifications of the forcesacting on the body appeared more important for bottom holding than passive physical properties.Longnose dace Rhinichthys cataractae (Facey and Grossman 1990) and Sacramento suckerCatostomus occidentalis (Myrick and Cech 2000) used all three phases. Stone loachNoemacheilus barbatulus used pectoral fins as depressors to hold to the bottom at high velocities(Stahlberg and Peckmann 1987). Swimming velocity increased steadily until 47 cm/s, afterwhich swimming velocity decreased and holding increased.
Sturgeons, both adult shovelnose Scaphirhynchus platyrhynchus (Adams et al. 1997) and pallidScaphirhynchus albus (Adams et al. 1999) use large pectoral fins to grasp the bottom, usingflowing water to exert a downward force pressing the fish to the bottom, called substrateappression. They also exhibited pelagic swimming (free swimming) and substrate skimming(body touching the bottom, but propulsion with body and caudal fin undulation).
The maximum speed at which bottom fish are able to hold station without active swimming hasbeen called the “critical current speed” by Matthews (1985) and the “critical holding velocity” byRimmer et al. (1985). Matthews tested two darter species from streams and found critical currentspeeds of 16.2 cm/s (SD 3.19) for juvenile fantail darter Etheostoma flabellare, 24.0 cm/s (SD5.65) for adult fantail darter, and 30.2 cm/s (SD 5.32) for adult Roanoke darter Percina roanoka.Rimmer et al. (1985) studied this behavior in juvenile Atlantic salmon Salmo salar in a streamenvironment.
Some bottom fish will not actively swim at all. The riffle sculpin Cottus gulosus would notperform in a respirometer-type swim speed apparatus (Baltz et al. 1982). They clung to thebottom with their pelvic fins and showed no swimming response to increased current velocities.
Bottom substrate makes a difference in apparent critical swimming speeds. Gudgeon Gobiogobio showed an increase in critical swimming speed from 55 cm/s to 61.7 cm/s when thebottom substrate in the test tunnel was changed from smooth to gravel (Stahlberg and Peckmann1987). This difference is most likely due to a bottom boundary layer that reduces actualvelocities experienced by the fish.
4.1.3 Threshold Swimming Speed
Many fish exhibit a minimum speed for orientation into a current or rheotaxis, called the“threshold swimming speed” (King 1971). At this speed, the somewhat random and exploratorymovements, often powered by the pectoral fins (MPF swimming), are replaced by steady,sinusoidal movements of the body and use of the caudal fin with pectoral fins folded against thebody. This threshold has not been measured customarily, but King (1971) reports that the
Evaluation of Swimming Speed Information as a Predictive Tool
4-8
threshold increases with size in white perch (from an average of 15 cm/s for fish 85-117 mm to42 cm/s for 150-mm fish). King noted that some species (black crappie and pumpkinseedsunfish) did not make the change to rheotactic behavior in his tests, which he attributed to theirnormal still-water habitats. Such a lack of directed swimming behavior could make these speciesmore susceptible to impingement.
4.2 Prolonged (Critical) Swimming Speed
Critical swimming speed is a special category of prolonged swimming speed that was initiallyidentified by Brett (1964). Intuitively, we believe that fish can sustain a maximum swimmingspeed for only so long before they tire and must slow down or cease swimming. This isswimming capability, which assumes some motivation for swimming. A standardized measure ofthis phenomenon was developed by Brett (1967) for physiological performance studies and iscalled the “critical swimming speed” or “Ucrit”. It is obtained by applying increments ofincreased velocity at specified time intervals in a standardized apparatus (after a period ofacclimation of the test fish to the test chamber) until fatigue occurs and the fish drifts backwardinto a downstream endpoint (often a screen). The most common apparatus is a closed tube ortunnel often also used as a respirometer (Blazka-type; Blazka et al.1960; Brett 1964; Figure 4-4),which is functionally analogous to a fish holding station in front of an intake screen. Similarresults have been obtained from open flumes and circular or oval troughs (MacLeod 1967). Thisstepwise testing appears to give good approximations to maximum prolonged swimming speedsderived by fixed velocity testing methods, at least for salmonids (Griffiths and Alderdice 1972).However, Swanson et al. (1998) found that delta smelt, a relatively weak, compared withsalmonids, swimming osmerid, showed many ‘prefatigue failures’ in such a swimming tunnel,attributed to swimming mode changes (between discontinuous swimming and continuous) withincreased velocities. Rigorous comparisons of laboratory results with prolonged swimmingspeeds observed in the field or in volitional swimming experiments are not available. There issome suggestion, however, that tunnel respirometry experiments used for determining criticalswimming speeds yield somewhat lower swimming speeds than field data (A. Hoar, USGSConte Laboratory, personal communication). Intake velocities can exceed critical swimmingspeeds, as shown by Turnpenny and Bamber (1983; Figure 4-5). Numerous studies using manyspecies and sizes have quantified the critical swimming speeds of fish or their close equivalents(Table A-1).

Evaluation of Swimming Speed Information as a Predictive Tool
4-9
Figure 4-4Laboratory determinations of critical swim speeds are usually conducted in swim tunnelsin which a single fish swims at designated stepped velocities and time increments ofexposure in relatively laminar flow until fatigue forces it against the end plate or screen.Electrodes have traditionally given mild shocks to stimulate swimming. Such chambersare usually recirculating loops. A common variant is to use an open channel or flume.From Beamish (1966).
Figure 4-5Intake velocities can exceed critical swimming speeds (CSS) of fish. This is shown for theFawley Power Station, England, over an annual cycle. From Turnpenny and Bamber (1983).
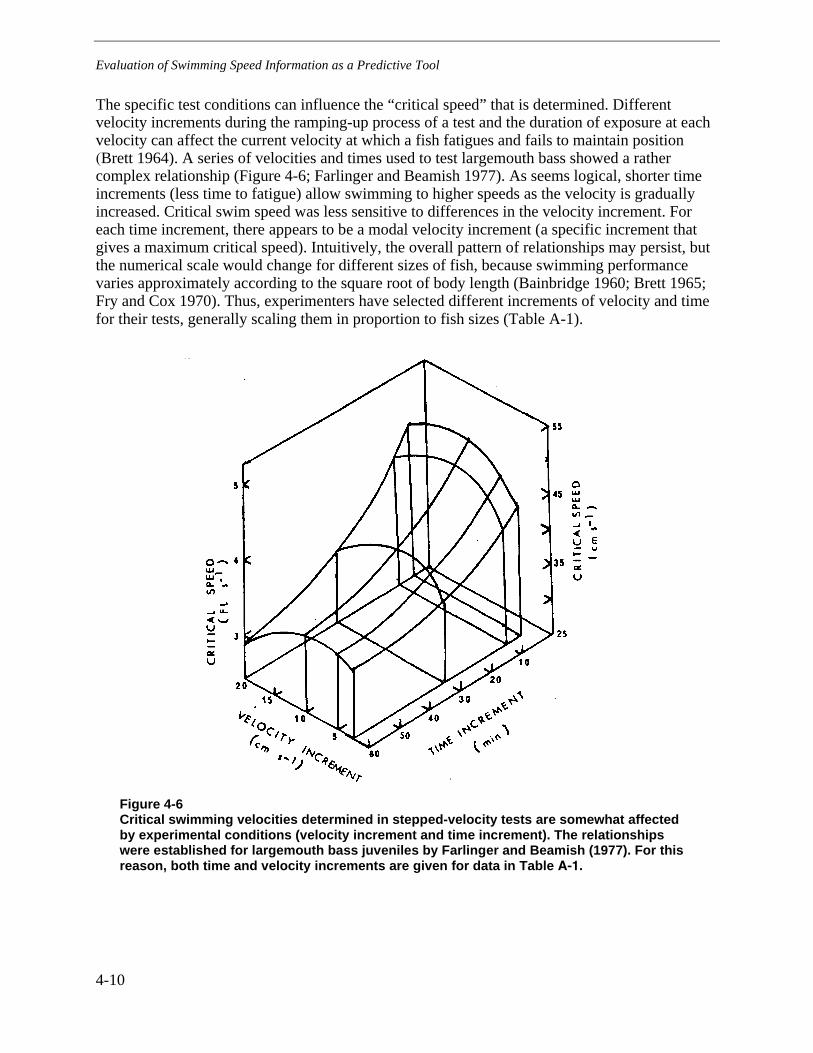
Evaluation of Swimming Speed Information as a Predictive Tool
4-10
The specific test conditions can influence the “critical speed” that is determined. Differentvelocity increments during the ramping-up process of a test and the duration of exposure at eachvelocity can affect the current velocity at which a fish fatigues and fails to maintain position(Brett 1964). A series of velocities and times used to test largemouth bass showed a rathercomplex relationship (Figure 4-6; Farlinger and Beamish 1977). As seems logical, shorter timeincrements (less time to fatigue) allow swimming to higher speeds as the velocity is graduallyincreased. Critical swim speed was less sensitive to differences in the velocity increment. Foreach time increment, there appears to be a modal velocity increment (a specific increment thatgives a maximum critical speed). Intuitively, the overall pattern of relationships may persist, butthe numerical scale would change for different sizes of fish, because swimming performancevaries approximately according to the square root of body length (Bainbridge 1960; Brett 1965;Fry and Cox 1970). Thus, experimenters have selected different increments of velocity and timefor their tests, generally scaling them in proportion to fish sizes (Table A-1).
Figure 4-6Critical swimming velocities determined in stepped-velocity tests are somewhat affectedby experimental conditions (velocity increment and time increment). The relationshipswere established for largemouth bass juveniles by Farlinger and Beamish (1977). For thisreason , both time and velocit y inc rements are give n for data i n Table A-1.
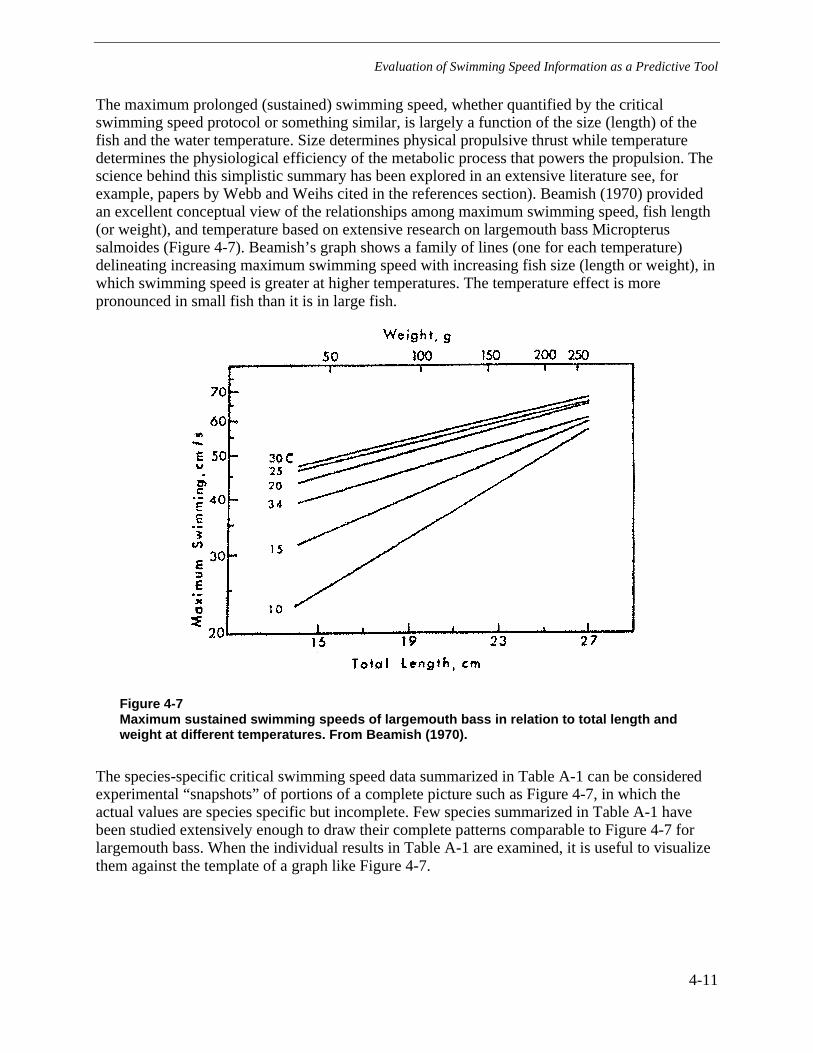
Evaluation of Swimming Speed Information as a Predictive Tool
4-11
The maximum prolonged (sustained) swimming speed, whether quantified by the criticalswimming speed protocol or something similar, is largely a function of the size (length) of thefish and the water temperature. Size determines physical propulsive thrust while temperaturedetermines the physiological efficiency of the metabolic process that powers the propulsion. Thescience behind this simplistic summary has been explored in an extensive literature see, forexample, papers by Webb and Weihs cited in the references section). Beamish (1970) providedan excellent conceptual view of the relationships among maximum swimming speed, fish length(or weight), and temperature based on extensive research on largemouth bass Micropterussalmoides (Figure 4-7). Beamish’s graph shows a family of lines (one for each temperature)delineating increasing maximum swimming speed with increasing fish size (length or weight), inwhich swimming speed is greater at higher temperatures. The temperature effect is morepronounced in small fish than it is in large fish.
Figure 4-7Maximum sustained swimming speeds of largemouth bass in relation to total length andweight at different temperatures. From Beamish (1970).
The species-specific critical swimming speed data summarized in Table A-1 can be consideredexperimental “snapshots” of portions of a complete picture such as Figure 4-7, in which theactual values are species specific but incomplete. Few species summarized in Table A-1 havebeen studied extensively enough to draw their complete patterns comparable to Figure 4-7 forlargemouth bass. When the individual results in Table A-1 are examined, it is useful to visualizethem against the template of a graph like Figure 4-7.
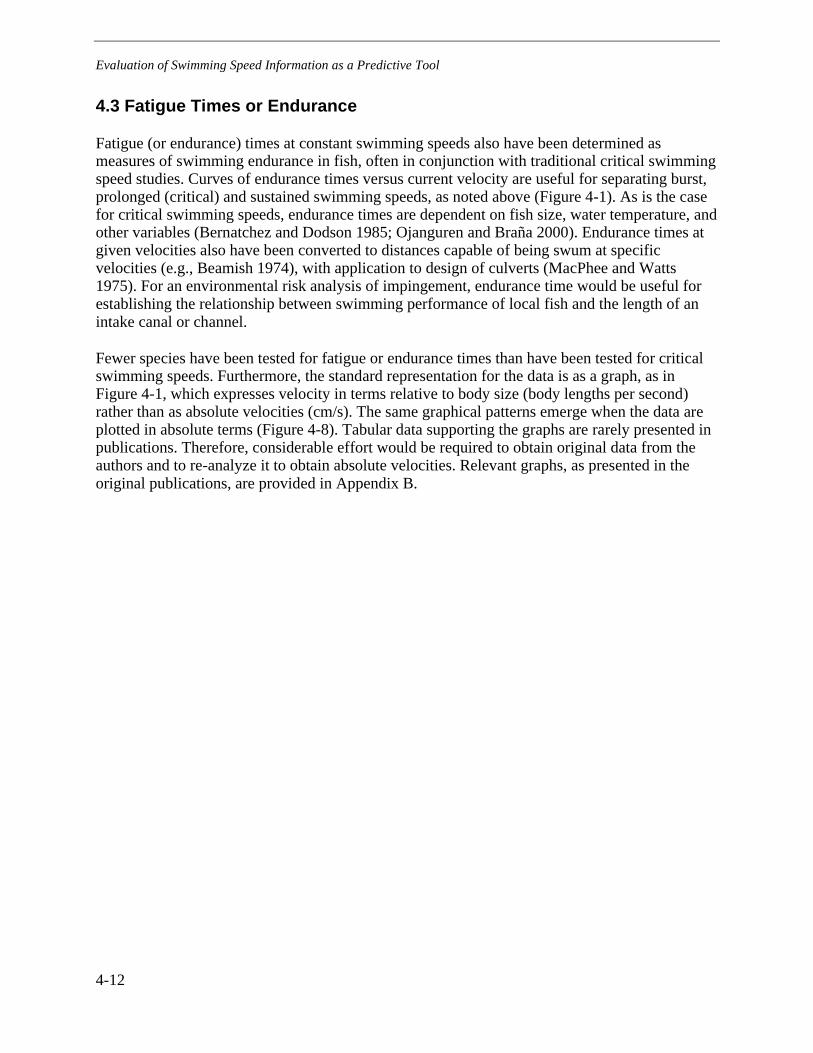
Evaluation of Swimming Speed Information as a Predictive Tool
4-12
4.3 Fatigue Times or Endurance
Fatigue (or endurance) times at constant swimming speeds also have been determined asmeasures of swimming endurance in fish, often in conjunction with traditional critical swimmingspeed studies. Curves of endurance times versus current velocity are useful for separating burst,prolonged (critical) and sustained swimming speeds, as noted above (Figure 4-1). As is the casefor critical swimming speeds, endurance times are dependent on fish size, water temperature, andother variables (Bernatchez and Dodson 1985; Ojanguren and Braña 2000). Endurance times atgiven velocities also have been converted to distances capable of being swum at specificvelocities (e.g., Beamish 1974), with application to design of culverts (MacPhee and Watts1975). For an environmental risk analysis of impingement, endurance time would be useful forestablishing the relationship between swimming performance of local fish and the length of anintake canal or channel.
Fewer species have been tested for fatigue or endurance times than have been tested for criticalswimming speeds. Furthermore, the standard representation for the data is as a graph, as inFigure 4-1, which expresses velocity in terms relative to body size (body lengths per second)rather than as absolute velocities (cm/s). The same graphical patterns emerge when the data areplotted in absolute terms (Figure 4-8). Tabular data supporting the graphs are rarely presented inpublications. Therefore, considerable effort would be required to obtain original data from theauthors and to re-analyze it to obtain absolute velocities. Relevant graphs, as presented in theoriginal publications, are provided in Appendix B.
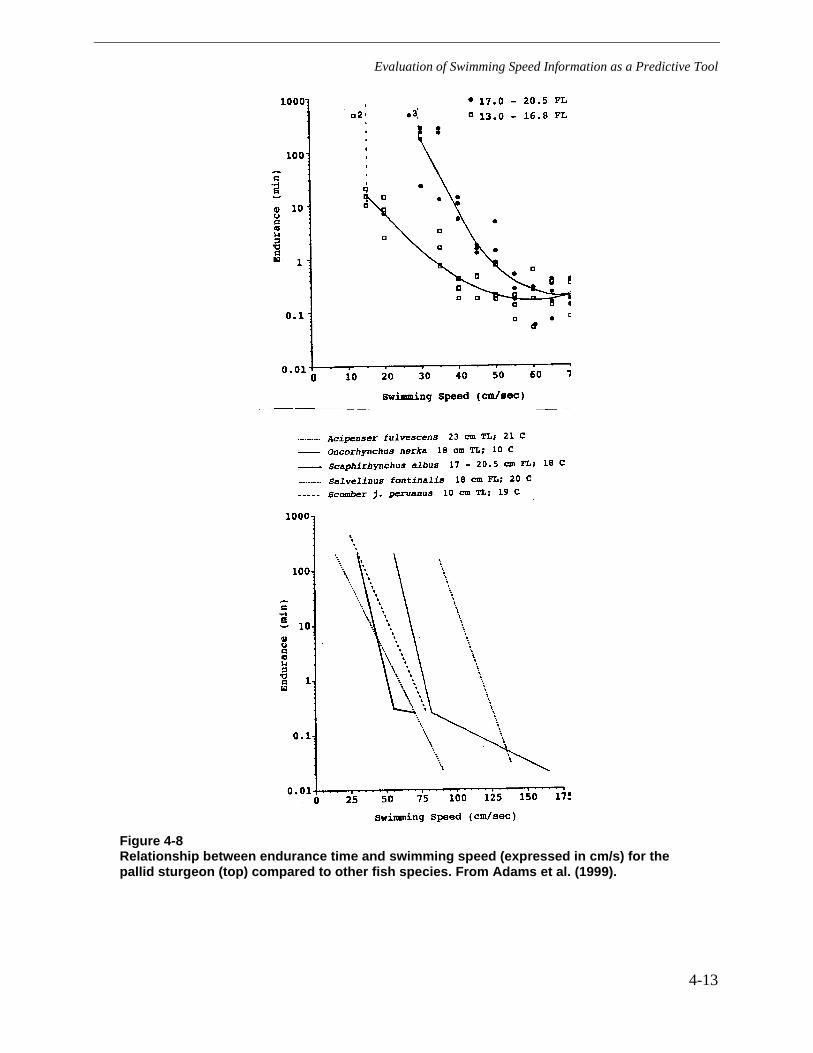
Evaluation of Swimming Speed Information as a Predictive Tool
4-13
Figure 4-8Relationship between endurance time and swimming speed (expressed in cm/s) for thepallid sturgeon (top) compared to other fish species. From Adams et al. (1999).
Evaluation of Swimming Speed Information as a Predictive Tool
4-14
4.4 Factors That Affect Swimming Capability
4.4.1 Individual Variability
Individual fish vary considerably in their swimming abilities, even when other variables such asfish length are constant. This variability is reflected in a range of critical swimming velocitieswhen numerous individual fish are tested (Figure 4-9). For example, critical velocities for cohosalmon studied by Glova and McInerney (1977) varied about 20 cm/s among individual earlyfry, advanced fry, pre-smolts, and smolts (Figure 4-8). In most studies, the median or averagecritical swimming speed is reported and the variation is treated as statistical noise (Hammer1995; Kolok 1999); usually a standard error of the mean or standard deviation is reported. AsKolok (1992) pointed out, this approach overlooks a significant source of performance variation.For impingement at power station intakes, it is probably the weaker individuals that areimpinged, and thus the initial individual’s failure in critical swimming performance tests is ofinterest (and tabulated in Table A-1 when available). Fortunately, both the central value and thevariation seem to be repeatable in at least seven studies involving five fish species (Kolok 1999;Figure 4-10). Some of this individual variability may be attributed to growth rates, for Kolok andOris (1995) found the fastest-growing fathead minnows Pimphales promelas to be the poorestswimmers. Individual variability seems to be accentuated when fish have been exposed tosublethal toxicants, for only some of the fish will show marked declines in swimmingperformance while others’ performance can remain little changed (Kolok et al. 1998). Hatchery-reared fish tend to have a poorer swimming capability than wild fish of the same species (e.g.,Duthie 1987). Plaut and Gordon (1994) showed that swimming performance variation had astrong genetic component in zebrafish Brachydanio rerio. Genetically cloned (identical)zebrafish showed essentially no variation in swimming performance. Again, it is those mostsusceptible that will be reflected in power plant impingement.
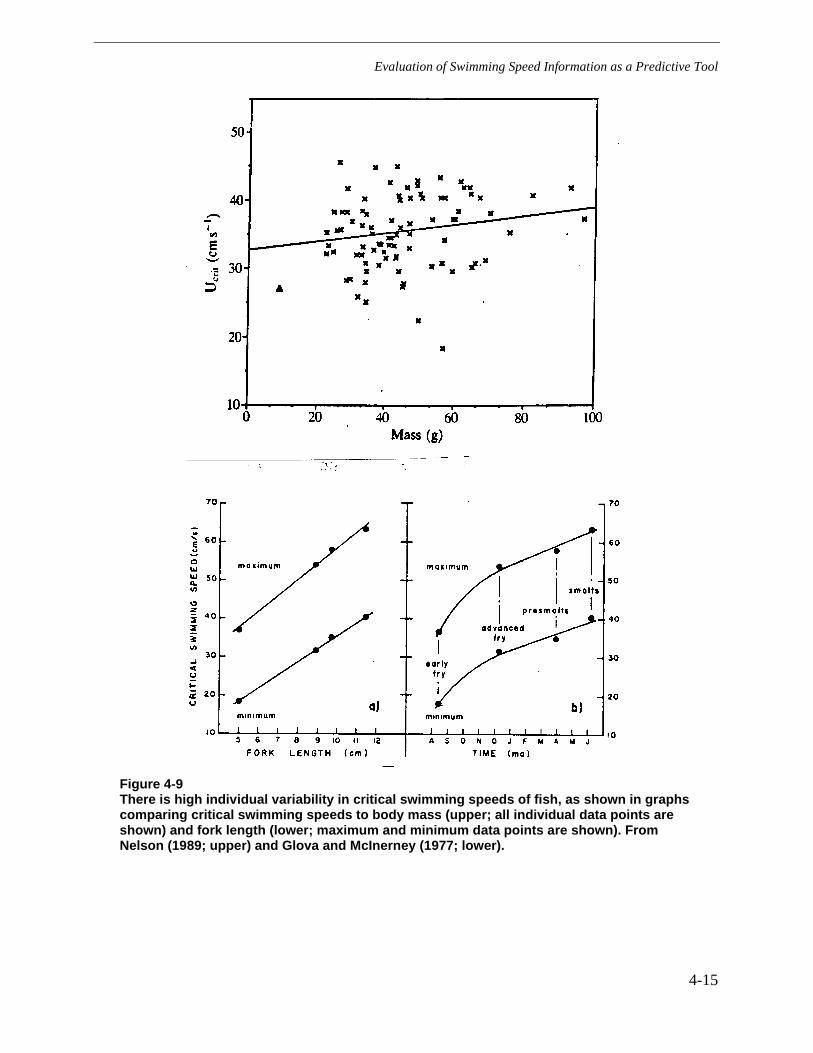
Evaluation of Swimming Speed Information as a Predictive Tool
4-15
Figure 4-9There is high individual variability in critical swimming speeds of fish, as shown in graphscomparing critical swimming speeds to body mass (upper; all individual data points areshown) and fork length (lower; maximum and minimum data points are shown). FromNelson (1989; upper) and Glova and McInerney (1977; lower).

Evaluation of Swimming Speed Information as a Predictive Tool
4-16
Figure 4-10Swimming performance of individual fish is fairly repeatable. Experiments by Kolok et al.(1998) determined critical swimming speeds of 10 fathead minnows in two swim tests 10 to14 days apart (same fish are connected by lines). These fish were controls for sedimenttoxicity exposures.
4.4.2 Exercise Conditioning
Several studies have shown that exercise conditioning will increase fish stamina and thereforeelevate the critical swimming speed (Davison 1989, 1997). For example, young largemouth basswere shown initially by MacLeod (1967) to perform better in swim tests when used again onsubsequent days. Largemouth bass swum at 35 cm/s conditioning velocity showed an increase inUcrit from 41.6 to 44.6 cm/s after 5 days and a further rise to 47.7 cm/s after 30 days (Farlingerand Beamish 1978). Rainbow trout Oncorhynchus mykiss swam 12% faster after exercisetraining for 28–52 days (Farrell et al. 1990). Young and Cech (1993) showed improvedswimming performance by young-of-the-year striped bass Morone saxatilis after exerciseconditioning. The coalfish Gadus virens (a cod) increased its swimming capability by 11% withexercise conditioning (Greer Walker and Pull 1973). However, sprint training (forced, rapidswimming) did not improve critical swimming speed of rainbow trout in experiments byGamperl et al. (1991), although acceleration in burst swimming did improve. However, exerciseconditioning with insufficient food can lower the condition factor of fish and negate anypotential increase in critical swimming speed (Farrell et al. 1991).
4.4.3 Fish Length
Prolonged swimming speeds are highly dependent on fish length, which is the predominantdetermining variable. The logarithm of swim speed at a given temperature usually increases withthe logarithm of length according to the equation:
log S = a + b log L
Evaluation of Swimming Speed Information as a Predictive Tool
4-17
where S is the critical swim speed, cm/s and L is total length, cm. Speed relative to body lengthdecreases linearly with the logarithm of length in a manner described by the equation:
C = a – b log L
Where C is the relative critical swim speed, body lengths/s and L is total length, cm.
The dependence of swim speed on length appears to be described best for salmonids by acoefficient (b) of 0.4 to 0.5 (Beamish 1980 based on data from Blaxter and Dickson 1959;Bainbridge 1960, 1962; Brett 1965; Fry and Cox 1970, Jones et al. 1974). In contrast,coefficients near unity have been reported for other teleosts (Beamish 1980 based on Blaxter andDickson 1959; Houde 1969). Some of the studies tabulated in Appendix A included equationsrelating critical swimming speed to body length. Wherever possible, the equations were includedin the table. We derived a regression equation for all of the species tabulated in this report:
Ucrit = 32.8 + 1.32 L
4.4.4 Body Shape
Body form has a great deal to do with swimming speeds (Lindsey 1978; Figure 4-11).Anguilliform species (eels, lampreys) are particularly poor swimmers. Adult sea lampreysPetromyzon marinus were estimated to be able to sustain swimming speeds of only about 1 cm/sfor 30 min at 15°C and less at 5°C (Beamish 1974). Eel Anguilla anguilla elvers could swim for3 minutes at 25 cm/s but only 0.7 min at 36 cm/s (McCleave 1980). They swim so poorly thatconventional tests of critical swim speed have not been performed, rather emphasis has beenplaced on endurance times at a variety of water velocities. These tests have generally fallen inthe category of burst swimming speeds. Clearly, the anguilliform species provide uniquechallenges for screening, both in CWIS and other situations (hydropower and irrigationdiversions).

Evaluation of Swimming Speed Information as a Predictive Tool
4-18
Figure 4-11Species differences in critical swimming speeds are strongly influenced by body shapeand method of propulsion. Fish propulsion is classified into several categories (left) thatcorrespond to characteristic body shapes. The propulsive parts of each body type isdarkened. Most fish near power stations are carangiform or subcarangiform. From Lindsey(1978).
4.4.5 Growth Rate
Higher specific growth rates (SGR) appear to lower critical swim speeds, but the relationship iscomplex. Rainbow trout tested by Gregory and Wood (1998) showed decreased relative criticalswim speeds (body lengths/s) by about 10% between near zero SGR and 1.8 % body weight perday. They concluded that there is a trade-off between high growth rate and swimmingperformance. This trade-off has been reported by others, e.g., Kolok and Oris (1995) for fatheadminnows, Farrell et al. (1997) for coho salmon Oncorhynchus kisutch, and Gregory and Wood(1999) for rainbow trout. The relationship is complex, however. Although absolute Ucrit ofrainbow trout declined as growth rate increased over a broad range, there was a positiverelationship between Ucrit and SGR at low ration levels (0.5% body mass per day), but a

Evaluation of Swimming Speed Information as a Predictive Tool
4-19
negative relationship between Ucrit and SGR at high SGR levels (2%/d). There was nosignificant relationship at intermediate feeding levels (Gregory and Wood 1999). Exercise-conditioned striped bass grew, as well as swam (Ucrit), faster than non-conditioned fish (Youngand Cech 1994).
4.4.6 Dissolved Oxygen
Low dissolved oxygen causes lower swimming speeds, generally after a threshold concentrationis reached. Sustained swimming speeds of juvenile coho and chinook salmon Oncorhynchustshawytscha were reduced significantly at dissolved oxygen concentrations below about 10 mg/L(Davis et al. 1963). However, first failure in swim tests occurred above about 20 cm/s even at alow level of 2 mg/L dissolved oxygen. Similar results were shown for largemouth bass and cohosalmon by Dahlberg et al. (1968). Early studies by Katz et al. (1956) had indicated a surprisinglyhigh swimming performance of chinook and coho salmon juveniles and largemouth bass atoxygen concentrations not much above the level that would be lethal in standing water. YoungAtlantic salmon showed marked reduction in swimming ability in the range of 4–5 mg/Ldissolved oxygen in studies at several constant swimming speeds at 15°C by Kutty and Saunders(1973) (Figure 4-12). Swimming ability of the fathead minnow was reduced by low dissolvedoxygen resulting from suspensions of wood fiber from pulpwood (MacLeod and Smith 1966).Reduction in dissolved oxygen reduced the maximum swimming velocity of rainbow trout (6%reduction at oxygen partial pressure of 60 mm of mercury; 24% at 40 mm) (Bushnell et al.1984). Pre-acclimation to low oxygen levels had little influence on the end results of that study.
Figure 4-12Low dissolved oxygen concentration reduces critical swimming speeds at differentconcentrations for each species. Summary curves are shown for three species (left) anddata points and summary line for Atlantic salmon. From Kutty and Saunders (1973).

Evaluation of Swimming Speed Information as a Predictive Tool
4-20
4.4.7 Super saturated Di ssol ved Gas
Supersaturation of dissolved atmospheric gases can lower swimming speeds. Juvenile chinooksalmon exposed to selected levels of dissolved atmospheric gas ranging from 100% (control) to120% saturation showed decreased performance between 106% and 120% when testedimmediately (Schiewe 1974). Recovery of swimming capability occurred within 2 hours whenfish were returned to 100% saturation before testing.
4.4.8 Temperature
Water temperature has a strong effect on critical swimming speed of nearly all fish tested. Often,there is a range of temperatures with relatively constant swimming speeds, with marked changes inswimming speed above and below that temperature range (Figures 4-13, 4-14). For largescalesuckers, for instance, critical swimming speed was not significantly different between 10°C and16°C, but from 10°C to 5°C there was a significant and dramatic decline in swimmingperformance (Kolok et al 1993). The Ucrit declined from near 50–55 cm/s (1.3–1.4 BL/s) at10°C and 16°C to about 32 cm/s at 5°C (0.8 BL/s; about a 30% decline). Delta smelt Ucrit wasunaffected by temperature in the 12–14°C range (Swanson et al. 1998). Effects of cold wintertemperatures (5°C) were likely responsible for lower critical swimming speeds of rainbow trout,rosyside dace Clinostomus funduloides, mottled sculpin and longnose dace in winter compared tospring (10°C), summer (15°C), and fall (10°C)(Facey and Grossman 1990). Failure of some fishto swim at all in swim-speed tests was related to low temperatures in studies of juvenileColorado squawfish Ptychocheilus lucius (Childs and Clarkson 1996). All fish appeared “lessmotivated” to swim at lower temperatures. Each species seems to have a characteristic pattern ofresponses to temperatures within its normal range of activity, even within a taxonomic Family,such as the Salmonidae (Figure 4-13).
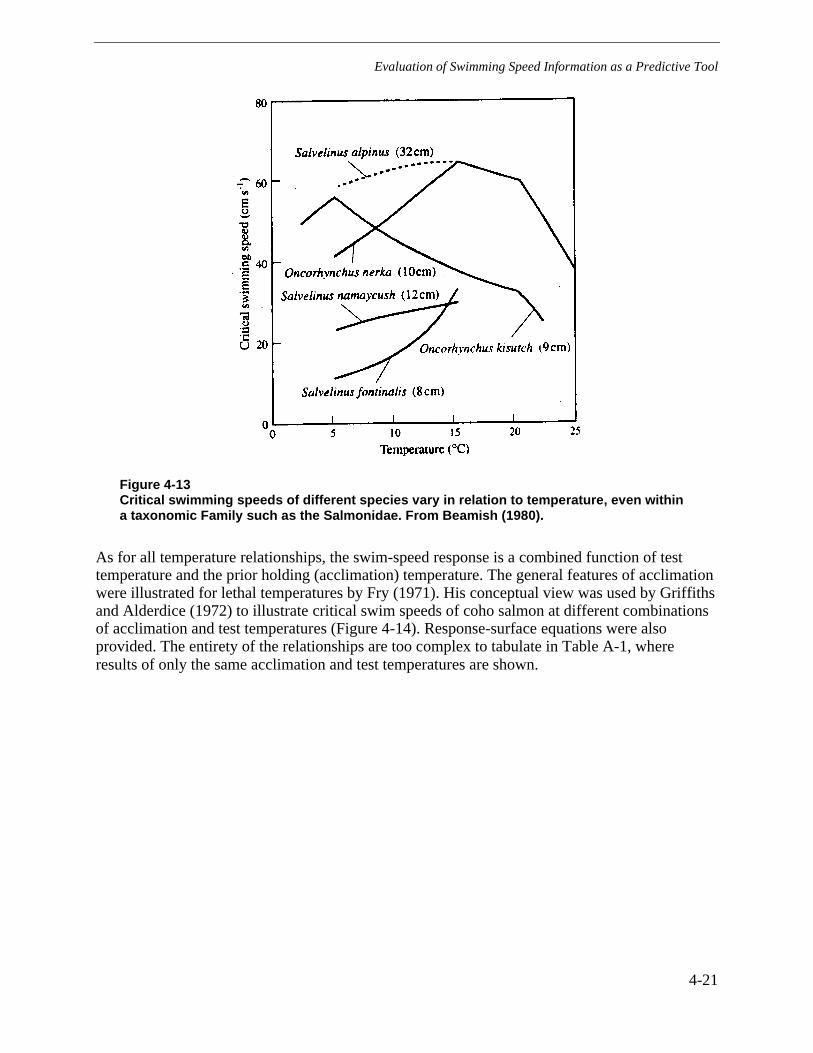
Evaluation of Swimming Speed Information as a Predictive Tool
4-21
Figure 4-13Critical swimming speeds of different species vary in relation to temperature, even withina taxonomic Family such as the Salmonidae. From Beamish (1980).
As for all temperature relationships, the swim-speed response is a combined function of testtemperature and the prior holding (acclimation) temperature. The general features of acclimationwere illustrated for lethal temperatures by Fry (1971). His conceptual view was used by Griffithsand Alderdice (1972) to illustrate critical swim speeds of coho salmon at different combinationsof acclimation and test temperatures (Figure 4-14). Response-surface equations were alsoprovided. The entirety of the relationships are too complex to tabulate in Table A-1, whereresults of only the same acclimation and test temperatures are shown.
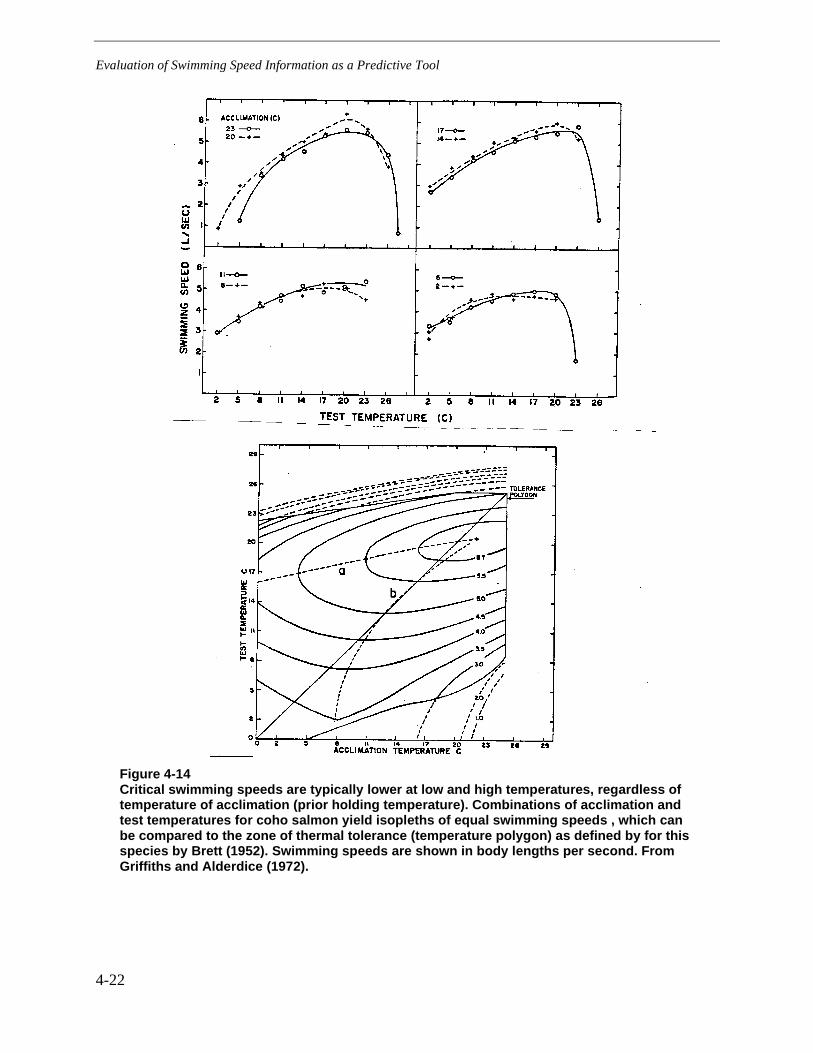
Evaluation of Swimming Speed Information as a Predictive Tool
4-22
Figure 4-14Critical swimming speeds are typically lower at low and high temperatures, regardless oftemperature of acclimation (prior holding temperature). Combinations of acclimation andtest temperatures for coho salmon yield isopleths of equal swimming speeds , which canbe compared to the zone of thermal tolerance (temperature polygon) as defined by for thisspecies by Brett (1952). Swimming speeds are shown in body lengths per second. FromGriffiths and Alderdice (1972).
Evaluation of Swimming Speed Information as a Predictive Tool
4-23
Critical swimming speeds at specific temperatures have been found to differ depending on thetime of year fish were collected and tested (Brett 1964; King 1971; Webb 1971). Brett (1964)first observed that there was a difference in the critical swimming speed of sockeye salmondependent on the time of year at which the measurements were made (at the same laboratoryacclimation temperature). A similar difference was seen in rainbow trout by Webb (1971). Field-acclimated fish tested in the laboratory by (King 1971) at the temperatures of collection differedbetween spring and fall. King attributed this effect to an acclimation process in the field, inwhich fish acclimate more rapidly to warming temperatures (spring) than to cooling ones(autumn). This feature of acclimation rate in the laboratory was earlier identified by Brett (1956).It is also possible that this effect could occur simply because the assumed acclimationtemperature (field collection temperature) would be higher (spring) or cooler (autumn) than thetrue acclimation temperature, which could lag the observed field temperature. This source ofuncertainty would not appear in test fish acclimated for several days in the laboratory. Thus, theacclimation state is important for both tested fish and fish for which the information is to beapplied in an assessment.
Rapid temperature changes cause a shift in swimming speeds that may exceed those attributableto changes in acclimation state. Rapid declines can cause a temporary “undershoot” in criticalswimming speed, that is, an initial new swim speed capability that is temporarily less than thestabilized value exhibited after several days acclimation (Figure 4-15). The swimming abilitystabilizes at a value somewhat higher than the temporary undershoot that is characteristic of thenew acclimation temperature. This undershoot has been shown for yellow perch Percaflavescens (Otto and O’Hara Rice 1974) and juvenile largemouth bass (Kolok 1992b), each ofwhich was tested for a change from 20°C acclimation to 10°C. The undershoot effect mayexplain why many impingement episodes occur shortly after cold weather fronts have passed infall, winter and early spring (McLean et al. 1979).

Evaluation of Swimming Speed Information as a Predictive Tool
4-24
Figure 4-15Abrupt temperature change can change critical swimming speed. Especially, a drop intemperature induces a marked temporary reduction (undershoot in top curve). From Ottoand O’Hara Rice 1974.
Thermal plume and warm-water recirculation effects of a heated effluent need to be consideredin evaluating swim speeds of fish in relation to the plant’s intake. Fish moving in the vicinity of apower station may encounter rapid temperature changes as they pass in and out of a thermalplume near the intake. The magnitude of temperature change depends on the size andtemperature differential of the plume, the rapidity of plume mixing, and the movement trajectoryof the fish. These rapid changes may cause temporary declines in critical swim speed. Also, thegeneral warming of waters in the vicinity (e.g., by tidal mixing) may cause the acclimationtemperature to differ from a more distant ambient temperature. Generally, however, the localtemperature will be warmer than ambient, causing local fish to have a better swimmingperformance than those quickly passing through.
4.4.9 Seasonality Not Related to Temperature
Swim speeds can differ among seasons in ways that do not reflect just temperature effects. Forexample, smallmouth buffalo Ictiobus bubalus tested seasonally by Adams (1998) at fieldacclimatization temperatures exhibited minimum critical swim speeds in autumn at temperatures(16.6°C, SD 1.89) considerably above winter temperatures (10.0°C, SD 0.92). Fall fish also hadthe lowest single swim speed (6.73 cm/s) and the most non-performers (those fish that failed to
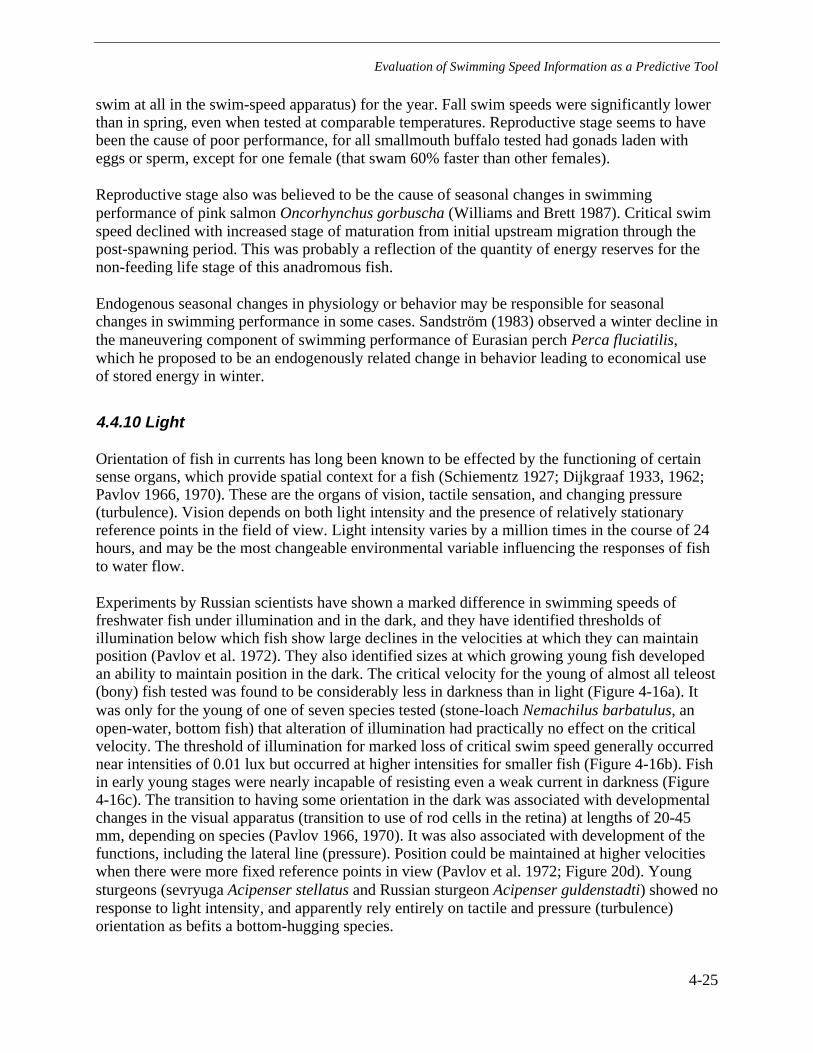
Evaluation of Swimming Speed Information as a Predictive Tool
4-25
swim at all in the swim-speed apparatus) for the year. Fall swim speeds were significantly lowerthan in spring, even when tested at comparable temperatures. Reproductive stage seems to havebeen the cause of poor performance, for all smallmouth buffalo tested had gonads laden witheggs or sperm, except for one female (that swam 60% faster than other females).
Reproductive stage also was believed to be the cause of seasonal changes in swimmingperformance of pink salmon Oncorhynchus gorbuscha (Williams and Brett 1987). Critical swimspeed declined with increased stage of maturation from initial upstream migration through thepost-spawning period. This was probably a reflection of the quantity of energy reserves for thenon-feeding life stage of this anadromous fish.
Endogenous seasonal changes in physiology or behavior may be responsible for seasonalchanges in swimming performance in some cases. Sandström (1983) observed a winter decline inthe maneuvering component of swimming performance of Eurasian perch Perca fluciatilis,which he proposed to be an endogenously related change in behavior leading to economical useof stored energy in winter.
4.4.10 Light
Orientation of fish in currents has long been known to be effected by the functioning of certainsense organs, which provide spatial context for a fish (Schiementz 1927; Dijkgraaf 1933, 1962;Pavlov 1966, 1970). These are the organs of vision, tactile sensation, and changing pressure(turbulence). Vision depends on both light intensity and the presence of relatively stationaryreference points in the field of view. Light intensity varies by a million times in the course of 24hours, and may be the most changeable environmental variable influencing the responses of fishto water flow.
Experiments by Russian scientists have shown a marked difference in swimming speeds offreshwater fish under illumination and in the dark, and they have identified thresholds ofillumination below which fish show large declines in the velocities at which they can maintainposition (Pavlov et al. 1972). They also identified sizes at which growing young fish developedan ability to maintain position in the dark. The critical velocity for the young of almost all teleost(bony) fish tested was found to be considerably less in darkness than in light (Figure 4-16a). Itwas only for the young of one of seven species tested (stone-loach Nemachilus barbatulus, anopen-water, bottom fish) that alteration of illumination had practically no effect on the criticalvelocity. The threshold of illumination for marked loss of critical swim speed generally occurrednear intensities of 0.01 lux but occurred at higher intensities for smaller fish (Figure 4-16b). Fishin early young stages were nearly incapable of resisting even a weak current in darkness (Figure4-16c). The transition to having some orientation in the dark was associated with developmentalchanges in the visual apparatus (transition to use of rod cells in the retina) at lengths of 20-45mm, depending on species (Pavlov 1966, 1970). It was also associated with development of thefunctions, including the lateral line (pressure). Position could be maintained at higher velocitieswhen there were more fixed reference points in view (Pavlov et al. 1972; Figure 20d). Youngsturgeons (sevryuga Acipenser stellatus and Russian sturgeon Acipenser guldenstadti) showed noresponse to light intensity, and apparently rely entirely on tactile and pressure (turbulence)orientation as befits a bottom-hugging species.
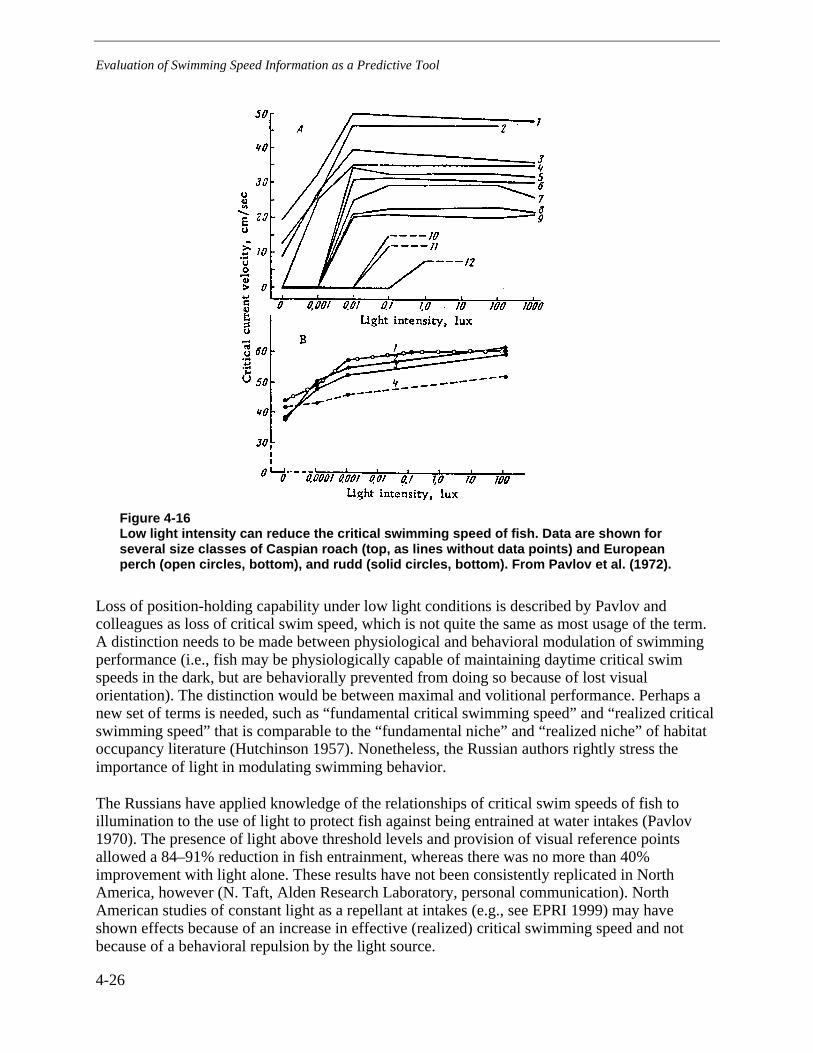
Evaluation of Swimming Speed Information as a Predictive Tool
4-26
Figure 4-16Low light intensity can reduce the critical swimming speed of fish. Data are shown forseveral size classes of Caspian roach (top, as lines without data points) and Europeanperch (open circles, bottom), and rudd (solid circles, bottom). From Pavlov et al. (1972).
Loss of position-holding capability under low light conditions is described by Pavlov andcolleagues as loss of critical swim speed, which is not quite the same as most usage of the term.A distinction needs to be made between physiological and behavioral modulation of swimmingperformance (i.e., fish may be physiologically capable of maintaining daytime critical swimspeeds in the dark, but are behaviorally prevented from doing so because of lost visualorientation). The distinction would be between maximal and volitional performance. Perhaps anew set of terms is needed, such as “fundamental critical swimming speed” and “realized criticalswimming speed” that is comparable to the “fundamental niche” and “realized niche” of habitatoccupancy literature (Hutchinson 1957). Nonetheless, the Russian authors rightly stress theimportance of light in modulating swimming behavior.
The Russians have applied knowledge of the relationships of critical swim speeds of fish toillumination to the use of light to protect fish against being entrained at water intakes (Pavlov1970). The presence of light above threshold levels and provision of visual reference pointsallowed a 84–91% reduction in fish entrainment, whereas there was no more than 40%improvement with light alone. These results have not been consistently replicated in NorthAmerica, however (N. Taft, Alden Research Laboratory, personal communication). NorthAmerican studies of constant light as a repellant at intakes (e.g., see EPRI 1999) may haveshown effects because of an increase in effective (realized) critical swimming speed and notbecause of a behavioral repulsion by the light source.
Evaluation of Swimming Speed Information as a Predictive Tool
4-27
Consideration of light per se as a stimulus factor does not automatically include a related andpotentially important factor, daytime versus nighttime behavioral differences. Many speciesexhibit substantially different behavior (including responsiveness to flow, distribution withintheir environment, etc.) during the night. Water withdrawal at an intake round the clock wouldinteract with both daytime and nighttime behavior, responsiveness, and perhaps physiologicalcapacity.
4.4.11 Photoperiod
Artificial (seasonally incorrect) photoperiods used in laboratory testing can alter the critical swimspeed that is determined. Kolok (1991) found that a constant 12:12 hour photoperiod reduced thecritical swim speed of juvenile largemouth bass in cold temperatures (5 and 10°C) but not atwarmer temperatures (15 to 19°C) compared to that at the seasonally consistent photoperiod.This photoperiod effect may explain the inability of Beamish (1970) to get fish at a laboratoryacclimation of 5°C to swim in his test apparatus (the photoperiod was 16:8 light-dark). Thus,experiments at cold temperatures need to be scrutinized for the photoperiod used in order todetermine if the resulting critical swim speed estimates may be lower than for wild fish underseasonally correct photoperiods.
4.4.12 Schooling
Average critical swimming speeds of a group of fish may be higher than that of an individual.That is, schools may be able to tolerate higher velocities, as discussed earlier. This is reasonableon theoretical grounds because of the hydraulic protection one fish in a school can provide foranother (Weihs 1975). It has been demonstrated experimentally, also. Schools of five roachRutilis rutilis each had critical swimming speeds of about 4 cm/s higher than individual fishwhen tested over a range of turbulence intensities (Pavlov et al. 1983). Stahlberg and Peckmann(1987) showed a small increase in critical swimming speed of the verkhovka Leucaspiusdelineatus with schools of 20 fish but not of 4, when compared to tests on individuals. Chan etal. (1997) cite unpublished data by G. L. Boyd on golden shiner Notemigonus crysoleucas thatshows mean critical swimming speeds to be higher for groups of 6 fish than for individuals. Thepotential alternative causes of lowered swimming ability from stress of isolation of individualsfrom the normal group environment and the lack of hydraulic assistance have not been isolated.The higher critical swimming speed of herring schools compared to solitary individuals observedby Domenici and Batty (1997) is interpreted to suggest that isolated individuals will experiencelonger latencies and slower responses in the face of circumstances requiring escape behavior.This latency is somewhat compensated for by the school by showing more appropriatedirectionality of the whole escape response. Schooling may be a factor in the responses of fishswimming abilities changing under different light conditions (noted above) because light levelscan alter schooling behavior (Blaxter and Parrish 1965; Whitney 1969; Higgs and Fuiman 1996).
4.4.13 Turbulence
Turbulent flow has been shown to reduce critical swimming speeds of fish (Pavlov et al. 1983,1994). In turbulent flow, the liquid particles move in irregular paths and at changing velocities,caused by eddies, bortices, upwellings, and the like, rather than in definite, smooth paths that

Evaluation of Swimming Speed Information as a Predictive Tool
4-28
characterize laminar flow (Chaudhry 1993). Although truly laminar flows are rarely found innature, the degrees of turbulence vary widely. Power station intake forebays have highly non-uniform velocities (Figure 4-17), probably a result of turbulence. When critical swimming speedis plotted against a standard measure of turbulence intensity (K = the standard deviation of theinstantaneous flow velocity divided by the mean velocity), a distinct relationship is evident(Figure 4-18). Critical swimming speeds for the gudgeon at two length ranges dropped markedlyas turbulence intensity rose from background levels to values of about 0.1. Thereafter, thereduction in critical swimming speed was less marked but still showed a decline with increasingK.
Figure 4-17Velocities into intakes are not uniform. Figure shows velocity contours taken in front offour operating traveling screens of the Contra Costa Steam Plant, California (Kerr 1953).
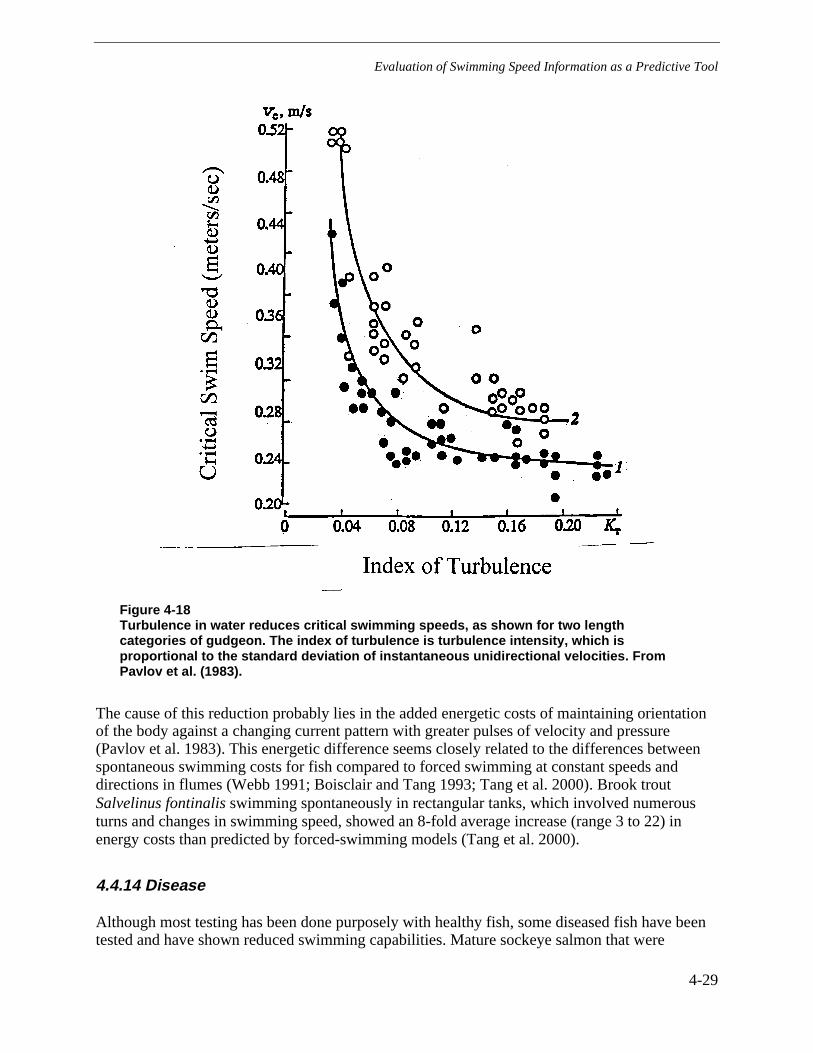
Evaluation of Swimming Speed Information as a Predictive Tool
4-29
Figure 4-18Turbulence in water reduces critical swimming speeds, as shown for two lengthcategories of gudgeon. The index of turbulence is turbulence intensity, which isproportional to the standard deviation of instantaneous unidirectional velocities. FromPavlov et al. (1983).
The cause of this reduction probably lies in the added energetic costs of maintaining orientationof the body against a changing current pattern with greater pulses of velocity and pressure(Pavlov et al. 1983). This energetic difference seems closely related to the differences betweenspontaneous swimming costs for fish compared to forced swimming at constant speeds anddirections in flumes (Webb 1991; Boisclair and Tang 1993; Tang et al. 2000). Brook troutSalvelinus fontinalis swimming spontaneously in rectangular tanks, which involved numerousturns and changes in swimming speed, showed an 8-fold average increase (range 3 to 22) inenergy costs than predicted by forced-swimming models (Tang et al. 2000).
4.4.14 Disease
Although most testing has been done purposely with healthy fish, some diseased fish have beentested and have shown reduced swimming capabilities. Mature sockeye salmon that were

Evaluation of Swimming Speed Information as a Predictive Tool
4-30
infected with opportunistic Vibrio and Sporocytophagosis infections as a result of capture andhandling swam at critical velocities about 30% below those of healthy fish (Jain et al. 1998).Repeat performance of these fish after a brief rest period was markedly less than that for healthyfish (healthy fish performed essentially the same in the second test whereas diseased fishwithstood critical velocities about 40% less than in their first test).
4.4.15 Toxicants
Toxic substances in water can reduce the swimming capabilities of fish. The list of examples islong, partly because the standardized critical swimming speed procedure has been adopted as anindicator of sublethal stresses in fish. Sublethal doses of the herbicides Diquat and Simazine incommercial formulations reduced swimming speeds and induced downstream drift of rainbowtrout in test chambers (Dodson and Mayfield 1979). The herbicides also reduced the percentageof fish exhibiting normal rheotactic responses and increased the frequency of those notresponding at all to water currents. Methyl parathion, an insecticide, decreased swimmingperformance of larval striped bass, Japanese medaka Oryzias latipes, and fathead minnows,probably associated with impaired muscular coordination (decreased acetylcholinesteraseactivity) (Heath et al. 1993a,b, 1997). Maximal critical swimming speeds were not achieved bycoho salmon fingerlings in concentrations of bleached kraft mill effluent above a thresholdconcentration between 10-20% of the 96-hour LC50 (50% lethal concentration; Howard 1975).Reduction in performance was related to effluent concentration but not to exposure time after theinitial 18 hours. Swimming performance returned to the levels of controls after 6-12 hoursrecovery. Exposure of mature sockeye salmon to between 0.12 and 0.77 mg/L of dehydroabieticacid (DHA) for 8–14 hours before swim tests reduced the initial Ucrit by about 10% and alsoreduced the ability of the fish to recover and perform in a second swim trial (Jain et al. 1998).Prior exposure to cyanide in sublethal concentrations markedly reduced the swimmingperformance of juvenile rainbow trout tested at acclimation temperatures of 6, 12, and 18°C incyanide-free water (Kovacs and Leduc 1982). The effect was greater at lower temperatures.Pentachlorophenol also reduced swimming capabilities of cichlid Cichlasoma bimaculatum andcoho salmon (Krueger et al. 1968). The pesticide Permethrin adversely affected the swimmingspeeds of rainbow trout in a manner that reflected its effects on basal metabolic rate(Kumaraguru and Beamish 1983). Methyl mercuric hydroxide at sublethal concentrationssignificantly reduced the swimming performance of roach Leuciscus rutilus in proportion to themercury content of muscle tissue (Lindahl and Schwanbom 1971). Swimming endurance wasreduced in young-of-the-year bluegill Lepomis macrochirus exposed to sub-lethal levels ofhydrogen sulfide (Oseid and Smith 1972). Copper reduced the swimming performance ofrainbow trout, particularly after 5 days of exposure (Waiwood and Beamish 1978). There was afairly complex relationship among copper, pH, water hardness and duration of exposure, withgreatest effect at low pH, low hardness, and high copper. The wood preservative, TCMTP,reduced swimming speed of coho salmon in a concentration-dependent manner, with a thresholdbetween 8 and 10 micrograms per liter (McKinnon and Farrell 1992). Critical swimming speedwas reduced from 11 to 25% over the concentration range of 10 to 20 micrograms per liter.
As a general principle, stress to a fish, whether toxic substances or other factors are the cause,seems to reduce swimming performance (Strange and Cech 1992). Stress is considered in thestrict physiological sense, of inducing changes in plasma cortisol, glucose, and lactateconcentrations in the bloodstream.
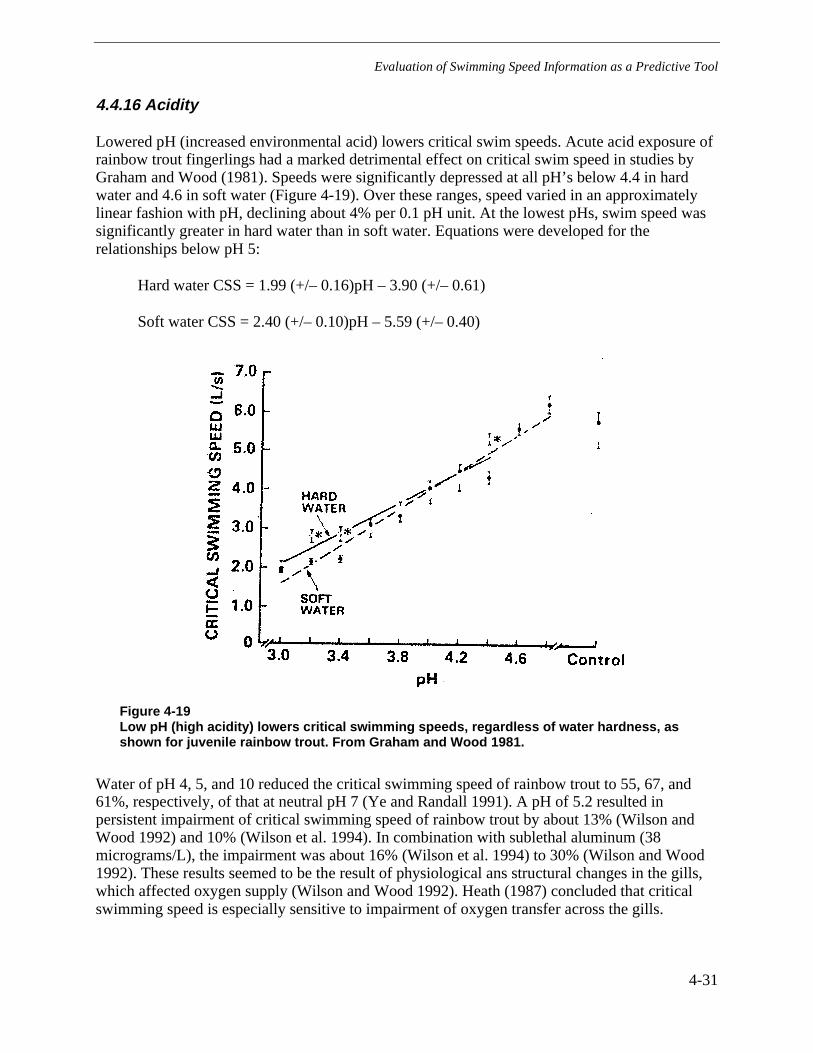
Evaluation of Swimming Speed Information as a Predictive Tool
4-31
4.4.16 Acidity
Lowered pH (increased environmental acid) lowers critical swim speeds. Acute acid exposure ofrainbow trout fingerlings had a marked detrimental effect on critical swim speed in studies byGraham and Wood (1981). Speeds were significantly depressed at all pH’s below 4.4 in hardwater and 4.6 in soft water (Figure 4-19). Over these ranges, speed varied in an approximatelylinear fashion with pH, declining about 4% per 0.1 pH unit. At the lowest pHs, swim speed wassignificantly greater in hard water than in soft water. Equations were developed for therelationships below pH 5:
Hard water CSS = 1.99 (+/– 0.16)pH – 3.90 (+/– 0.61)
Soft water CSS = 2.40 (+/– 0.10)pH – 5.59 (+/– 0.40)
Figure 4-19Low pH (high acidity) lowers critical swimming speeds, regardless of water hardness, asshown for juvenile rainbow trout. From Graham and Wood 1981.
Water of pH 4, 5, and 10 reduced the critical swimming speed of rainbow trout to 55, 67, and61%, respectively, of that at neutral pH 7 (Ye and Randall 1991). A pH of 5.2 resulted inpersistent impairment of critical swimming speed of rainbow trout by about 13% (Wilson andWood 1992) and 10% (Wilson et al. 1994). In combination with sublethal aluminum (38micrograms/L), the impairment was about 16% (Wilson et al. 1994) to 30% (Wilson and Wood1992). These results seemed to be the result of physiological ans structural changes in the gills,which affected oxygen supply (Wilson and Wood 1992). Heath (1987) concluded that criticalswimming speed is especially sensitive to impairment of oxygen transfer across the gills.
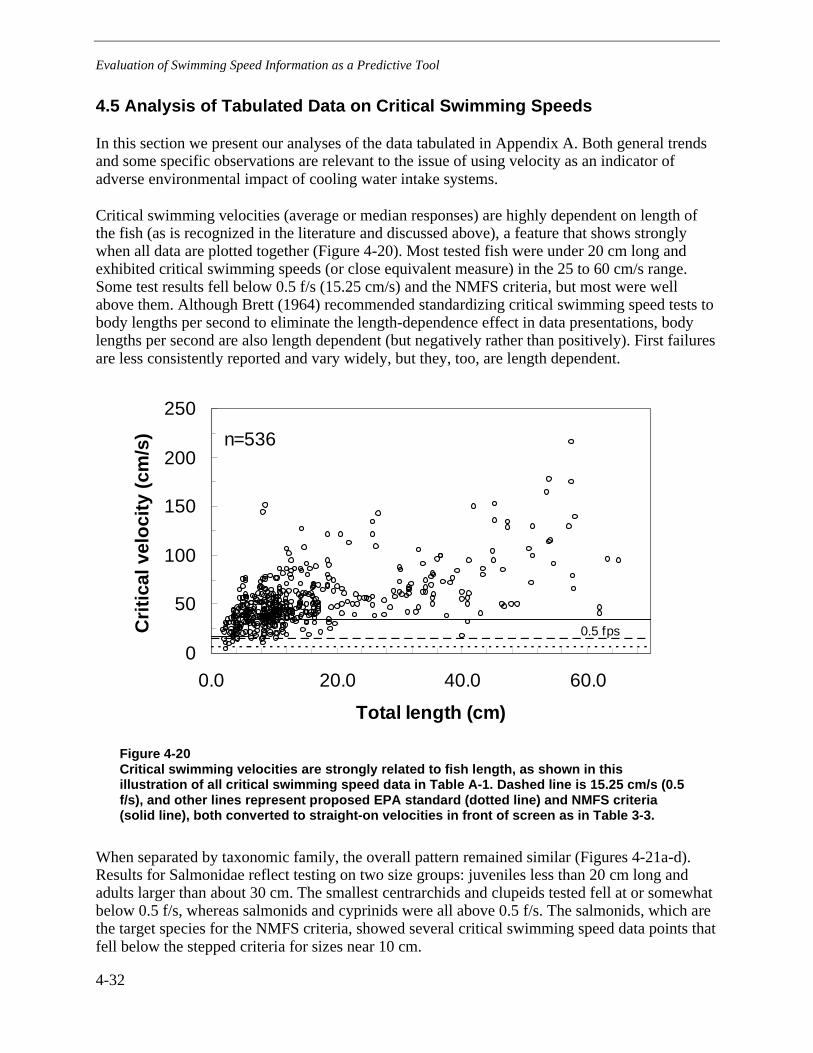
Evaluation of Swimming Speed Information as a Predictive Tool
4-32
4.5 Analysis of Tabulated Data on Critical Swimming Speeds
In this section we present our analyses of the data tabulated in Appendix A. Both general trendsand some specific observations are relevant to the issue of using velocity as an indicator ofadverse environmental impact of cooling water intake systems.
Critical swimming velocities (average or median responses) are highly dependent on length ofthe fish (as is recognized in the literature and discussed above), a feature that shows stronglywhen all data are plotted together (Figure 4-20). Most tested fish were under 20 cm long andexhibited critical swimming speeds (or close equivalent measure) in the 25 to 60 cm/s range.Some test results fell below 0.5 f/s (15.25 cm/s) and the NMFS criteria, but most were wellabove them. Although Brett (1964) recommended standardizing critical swimming speed tests tobody lengths per second to eliminate the length-dependence effect in data presentations, bodylengths per second are also length dependent (but negatively rather than positively). First failuresare less consistently reported and vary widely, but they, too, are length dependent.
0
50
100
150
200
250
0.0 20.0 40.0 60.0
Total length (cm)
Crit
ical
vel
ocity
(cm
/s)
.
n=536
0.5 fps
Figure 4-20Critical swimming velocities are strongly related to fish length, as shown in thisillustration of all critical swimming speed data in Table A-1. Dashed line is 15.25 cm/s (0.5f/s), and other lines represent proposed EPA standard (dotted line) and NMFS criteria(solid line), both converted to straight-on velocities in front of screen as in Table 3-3.
When separated by taxonomic family, the overall pattern remained similar (Figures 4-21a-d).Results for Salmonidae reflect testing on two size groups: juveniles less than 20 cm long andadults larger than about 30 cm. The smallest centrarchids and clupeids tested fell at or somewhatbelow 0.5 f/s, whereas salmonids and cyprinids were all above 0.5 f/s. The salmonids, which arethe target species for the NMFS criteria, showed several critical swimming speed data points thatfell below the stepped criteria for sizes near 10 cm.
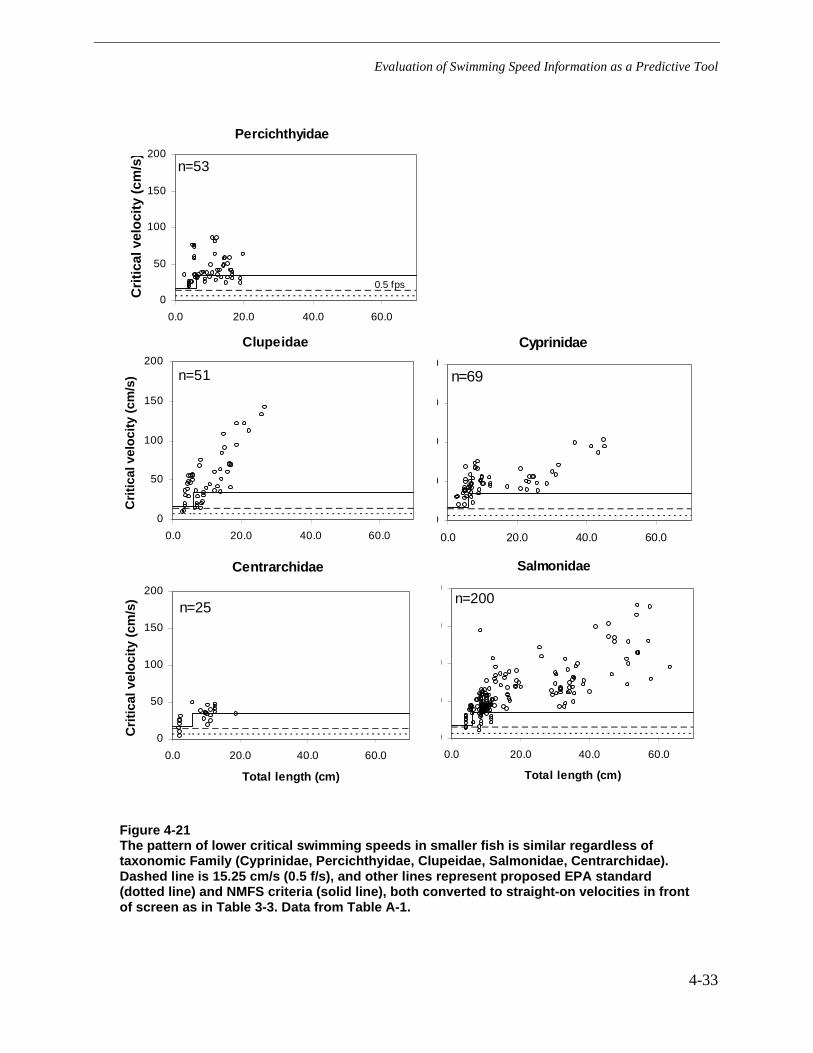
Evaluation of Swimming Speed Information as a Predictive Tool
4-33
Cyprinidae
0
50
100
150
200
0.0 20.0 40.0 60.0
n=69
Percichthyidae
0
50
100
150
200
0.0 20.0 40.0 60.0
Crit
ical
vel
ocity
(cm
/s)
n=53
0.5 fps
Clupeidae
0
50
100
150
200
0.0 20.0 40.0 60.0
Crit
ical
vel
ocity
(cm
/s)
n=51
Salmonidae
0
50
100
150
200
0.0 20.0 40.0 60.0
Total length (cm)
n=200
Centrarchidae
0
50
100
150
200
0.0 20.0 40.0 60.0
Total length (cm)
Crit
ical
vel
ocity
(cm
/s) n=25
Figure 4-21The pattern of lower critical swimming speeds in smaller fish is similar regardless oftaxonomic Family (Cyprinidae, Percichthyidae, Clupeidae, Salmonidae, Centrarchidae).Dashed line is 15.25 cm/s (0.5 f/s), and other lines represent proposed EPA standard(dotted line) and NMFS criteria (solid line), both converted to straight-on velocities in frontof screen as in Table 3-3. Data from Table A-1.

Evaluation of Swimming Speed Information as a Predictive Tool
4-34
When separated by assemblage, the pattern also remained similar to that for the data as a whole(Figure 4-22a–d). The Pacific assemblage reflected the data on salmonids that fell below theNMFS criteria. Lake and Atlantic assemblages showed the influence of very small fish on theoverall picture.
0
50
100
150
200
0.0 20.0 40.0 60.0
Crit
ical
vel
ocity
(cm
/s)
Atlantic, n=193
0.5 fps
0
50
100
150
200
0.0 20.0 40.0 60.0
Pacific, n=121
0
50
100
150
200
0.0 20.0 40.0 60.0
Total length (cm)
Crit
ical
vel
ocity
(cm
/s) Lakes, n=62
0
50
100
150
200
0 20 40 60Total length (cm)
Rivers, n=149
Figure 4-22The pattern of lower critical swimming speeds in smaller fish is similar regardless of fishassemblage ( a- Atlantic coast; b-Pacific coast; c- lakes; d- rivers). Dashed line is 15.25cm/s (0.5 f/s), and other lines represent proposed EPA standard (dotted line) and NMFScriteria (solid line), both converted to straight-on velocities in front of screen as in Table3-3. Data from Table A-1.
It is instructive to see which species and sizes have been shown to have average (or median)swim speeds less than or near EPA’s proposed criterion of 0.5 f/s. They are Atlantic estuarinespecies known to be impinged in large numbers at estuarine power stations (Ringger 2000):small bay anchovy Anchoa mitchilli near 3 cm long in summer, small Atlantic menhadenBrevoortia tyrannus near 3 cm long in summer, and Atlantic silverside Menidia menidia inwinter. The group also includes smallmouth bass Micropterus dolomieu fry, juvenile coho

Evaluation of Swimming Speed Information as a Predictive Tool
4-35
salmon, juvenile brook trout at cold temperatures (less than 15°C, 2–3°C, and 5–10°C,respectively), and Pacific lamprey Lampetra tridentata. A 0.5 f/s criterion based on average ormedian swim speed responses would not protect all members of this group, because it presumesthat about half of the individuals would have lower critical swimming speeds than the reportedaverage or median. The smallest fish tabulated (such as smallmouth bass fry) would probably notbe impinged, but would pas through the screens and be entrained in the cooling-water flow.
If a 1 f/s (30.48 cm/s) criterion were to be selected, the available laboratory data would indicatethat many other species would potentially be at risk. From the Atlantic assemblage, these includesomewhat larger Atlantic menhaden (4.5 cm) and spot Leiostomus xanthurus about 4 cm insummer, striped mullet Mugil cephalus about 3 cm, and small white perch Morone americana inwinter (2–7°C), striped bass, red hake Urophycis chuss and spotted hake Urophycis regius atcold temperatures, bluefish Potamous saltatrix, northern searobin Prionotus carolinus, stripedcusk-eel Rissola marginata, rough Membras martinica and Atlantic silversides Menidia menidiain winter, and blueback herring Alosa aestivalis in winter. In the Pacific estuarine group, bothsplittail and delta smelt. Of the salmonids, juvenile coho salmon up to 13°C and lake troutSalvelinus namaycush about 11 cm long would be included. Stream species include longnosesucker, rosyside dace in winter (5°C), and mottled sculpin in winter and spring. Lake specieswould include small (6 cm) broad whitefish Coregonus nasus, small northern pike Esox lucius,juvenile largemouth bass in winter (5–11°C), yellow perch in winter (2–10°C), lake sturgeonAcipenser fulvescens, smallmouth buffalo Ictiobus bubalus in the fall, and fathead minnows.Clearly, a criterion of 1 f/s (30.48 cm/s) would be insufficiently protective just about everywhereif it were used as a screening criterion with these laboratory swimming speed data.
The correspondence between species commonly impinged and those for which criticalswimming speed data are available is not particularly good (Table 4-1). Of the 40 fish speciesreported by utilities to the EPRI Intake Structure Database (EPRI 1995) as being impinged at 5or more power plants, 19 (48%) have not had laboratory determinations of critical swimmingspeeds (or close equivalents). Three of the top 5 have not been studied, including the top two(gizzard shad Dorosoma cepedianum and freshwater drum Aplodinotus grunniens). Eight of the15 species (53%) reported impinged at ten or more plants have not been studied. Inclusion ofspecies in the EPRI database reflects the large number of power plants located on freshwaterrivers, lakes, and reservoirs. In contrast, 9 of 12 species (75%) that were one of the five mostabundantly impinged species at the Calvert Cliffs Nuclear Power Plant on Chesapeake Bay atsome time in the years 1975–1995 (Ringger 2000) have critical swimming speed data in theliterature. The availability of swimming speed data reflects academic interest in fish swimmingphysiology and behavior (for which common species such as rainbow trout, sockeye salmon, andlargemouth bass were ready subjects), or concerns over swimming performance of migratoryspecies such as salmon. Concerns over certain commercially or recreationally importantfreshwater species overshadowed interest in forage fish species such as gizzard shad, threadfinshad Dorosoma petenense, and freshwater drum, which are among those most often impinged.There is considerable swimming speed data on estuarine species at all trophic levels, however,such as striped bass, white perch, manhaden, bay anchovy, and striped mullet, which are ofmajor concern at a few large estuarine power plants (e.g., Ringger 2000).

Evaluation of Swimming Speed Information as a Predictive Tool
4-36
Table 4-1Species occurrences at power plants for which impingement numbers were reported inEPRI's 1995 Intake Structure Database (ISDB) (five or more occurrences only) compared tothe number of swimming speed studies in the literature.
Common Name Number of Plants Number of Studies
Gizzard Shad 71 0
Freshwater Drum 38 0
Alewife 32 1
Rainbow Smelt 29 0
Yellow Perch 27 2
Channel Catfish 21 1
Emerald Shiner 20 1
Bluegill 19 0
White Bass 16 0
Atlantic Menhaden 16 2
Black Crappie 14 0
Bay Anchovy 14 1
Trout Perch 13 0
Spottail Shiner 13 0
Winter Flounder 10 1
White Perch 9 1
Threadfin Shad 9 0
Carp 9 0
White Seaperch 8 1
White Croaker 8 1
White Crappie 8 1
Walleye Surfperch 8 1
Spot 8 2
Shiner Surfperch 8 0
Queenfish 8 0
Hogchoker 8 0
Blueback Herring 7 1
Black Bullhead 7 0
Atlantic Silverside 7 2
Atlantic Croaker 7 1
Smallmouth Bass 6 1
Pumpkinseed 6 1
Logperch 6 0
Brown Bullhead 6 1
White Sucker or Common Sucker 5 1
White Catfish 5 0
Striped Searobin 5 0
Slimy Sculpin 5 0
Rockbass 5 0
Northern Pike 5 1
Evaluation of Swimming Speed Information as a Predictive Tool
4-37
EPRI is currently funding an update of the 1995 impingement database by Alden ResearchLaboratory, Inc. Collaboration with the Alden Laboratory in a continuation of this project willfurther reconcile the predictive information presented here with the retrospective informationfrom actual power station operations.
Despite the spotty match between impinged species and available critical swimming speed data,the existing laboratory tests data have fairly well characterized many of the species at risk. Thisis especially true for the Atlantic estuarine assemblage. For example, bay anchovy, Atlanticmenhaden, spot, and Atlantic silversides show up in laboratory tests as poor swimmers undercertain environmental conditions and at certain sizes and also on lists of high impingement. ThePacific estuarine species, delta smelt and spottail, are likewise at risk. Thus, the age-old questionof relevance of laboratory data to field situations may be put to rest. How well the exactnumerical values for swimming speeds in the laboratory would match swimming performance infield situations, however, could use further study. We may expect too much if we wantpredictability within a few centimeters per second.
This tabulation of fish critical swimming speeds should have application to site-specific analysesas well as for consideration of a velocity value for screening purposes to identify sites likely tohave a low potential for adverse impact. Each power station that needs to do a site-specific316(b) analysis and demonstration for a NPDES permit under the Clean Water Act will have thistable available as a resource to research the swimming capabilities of the fish species that occurat its site.
Limitations in the applicability of critical swimming speeds from laboratory testing need to bekept in mind, however. Critical swimming speed is one very useful tool for swimmingperformance assessment. However, it measures the aerobic swimming capacity of the fish under(almost always) relatively uniform, laminar flow conditions in a confined space. Criticalswimming speed is not an adequate tool alone for assessment of fish behavior in artificial flowconditions near a water intake. It is not necessarily the best estimator of the velocity threshold forintakes from which a fish could escape. Hanson and Li (1978) noted instances in which fish wereimpinged at velocities substantially below their Ucrit. Fish do not always respond to a current aswe would expect by swimming into it and, in many habitats (e.g., turbid water or in nighttimeconditions) they might not be able to respond visually to the intake screen until it was too late.Predictions of vulnerability to impingement based exclusively on how fast fish arephysiologically capable of swimming ignore the possibility that fish may not be stimulated toswim. Such caveats as these reinforce our recognition of the need for more study of the behaviorof fish in the field (Coutant 1999; Coutant and Whitney 2000) and an understanding of what isnormal for both hydraulics and fish behavior in the vicinity of an intake (Coutant 2000).
4.6 Burst Swimming Speeds and Fast Starts
When a fish is drawn backward toward an intake screen while swimming steadily into thecurrent at velocities greater than its critical swimming speed, it eventually touches the screenwith its tail or otherwise senses the obstacle. Video monitoring of actual screens as well asobservations in experimental flumes and tunnels (often as part of critical swim speed tests)indicates that most fish initiate a burst of swimming activity to quickly distance themselves fromthe screen. The burst of activity has been characterized by physiological researchers as occurring
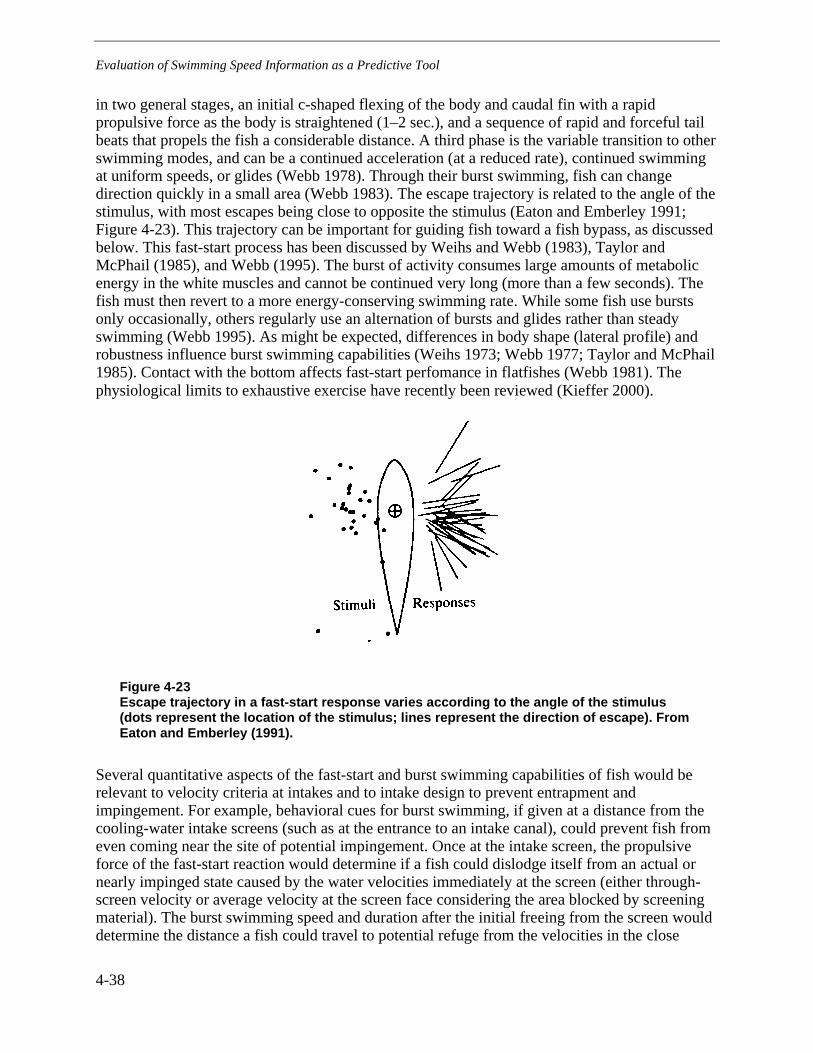
Evaluation of Swimming Speed Information as a Predictive Tool
4-38
in two general stages, an initial c-shaped flexing of the body and caudal fin with a rapidpropulsive force as the body is straightened (1–2 sec.), and a sequence of rapid and forceful tailbeats that propels the fish a considerable distance. A third phase is the variable transition to otherswimming modes, and can be a continued acceleration (at a reduced rate), continued swimmingat uniform speeds, or glides (Webb 1978). Through their burst swimming, fish can changedirection quickly in a small area (Webb 1983). The escape trajectory is related to the angle of thestimulus, with most escapes being close to opposite the stimulus (Eaton and Emberley 1991;Figure 4-23). This trajectory can be important for guiding fish toward a fish bypass, as discussedbelow. This fast-start process has been discussed by Weihs and Webb (1983), Taylor andMcPhail (1985), and Webb (1995). The burst of activity consumes large amounts of metabolicenergy in the white muscles and cannot be continued very long (more than a few seconds). Thefish must then revert to a more energy-conserving swimming rate. While some fish use burstsonly occasionally, others regularly use an alternation of bursts and glides rather than steadyswimming (Webb 1995). As might be expected, differences in body shape (lateral profile) androbustness influence burst swimming capabilities (Weihs 1973; Webb 1977; Taylor and McPhail1985). Contact with the bottom affects fast-start perfomance in flatfishes (Webb 1981). Thephysiological limits to exhaustive exercise have recently been reviewed (Kieffer 2000).
Figure 4-23Escape trajectory in a fast-start response varies according to the angle of the stimulus(dots represent the location of the stimulus; lines represent the direction of escape). FromEaton and Emberley (1991).
Several quantitative aspects of the fast-start and burst swimming capabilities of fish would berelevant to velocity criteria at intakes and to intake design to prevent entrapment andimpingement. For example, behavioral cues for burst swimming, if given at a distance from thecooling-water intake screens (such as at the entrance to an intake canal), could prevent fish fromeven coming near the site of potential impingement. Once at the intake screen, the propulsiveforce of the fast-start reaction would determine if a fish could dislodge itself from an actual ornearly impinged state caused by the water velocities immediately at the screen (either through-screen velocity or average velocity at the screen face considering the area blocked by screeningmaterial). The burst swimming speed and duration after the initial freeing from the screen woulddetermine the distance a fish could travel to potential refuge from the velocities in the close

Evaluation of Swimming Speed Information as a Predictive Tool
4-39
vicinity of the screen (Figure 2-1). For angled screens, the distance and direction of a fast-start,with or without a subsequent burst, would determine the distance a fish is swept along the screentoward a bypass (Figure 2-1e). Both the propulsive force and the distances swum in bursts wouldcertainly vary with fish size, species, and temperature in much the same manner as does thecritical swimming speed.
The available literature on fast-starts and burst swimming speeds is rich with concepts but pooron quantitative data. Research emphasis has concentrated on deciphering mechanisms ofswimming (how the body moves in relation to water) and the energy physiology andbiochemistry of various muscle types and other internal systems. There are too few data relevantto power station intake applications to warrant tabulation at this time. We did, however,accumulate numerous articles for future reference.


5-1
5 ADDITIONAL CONSIDERATIONS
5.1 Measures to Minimize Impingement and Related Injury and Mortality
By our earlier definition, once a fish passes the point-of-no-return, it will either becomeimpinged on the screen or bypassed away from the facility (or both). A fish’s ability to avoidimpingement partially depends on whether it can swim against the current produced by the intakestructure long enough to reach a point of safety. For an offshore intake placed in an open area ofa lake, bay, or estuary, the point of safety would be described as that distance from the intakewhere velocities created by the intake do not exceed a swimming speed that can be sustained bythe fish indefinitely. Burst swimming alone could be enough to prevent a fish from becomingimpinged, but since burst swimming is of short duration, escape could only be attained when thepoint of no return is near the screen or when an escape route (e.g., a bypass) is a relatively shortdistance from the screen. It is better to rely on a fish's sustained swimming speed to carry it tosafety. The intake velocity which matches the sustained swim speed occurs farther away from anoffshore intake than does the velocity that matches the burst swim speed, so the margin of safetyfor a potentially entrapped fish is greater. In more enclosed systems (e.g., in many rivers andintake canals), bypass routes are incorporated into the intake screen design to provide fish safepassage around the screen and back to the river or other body of water.
Many design features that have been developed to minimize the rate and effects of impingementare discussed below. These measures were designed to reduce mortality and injury by (1)reducing impingement time, (2) reducing impingement “force” (i.e., through-screen velocity),and (3) minimizing screen abrasiveness.
Screen angle and position relative to flow direction—River and tidal flow both affect thesusceptibility of fish to impingement on intake screens, and various designs have been developedto address this flow effect. The primary design consideration is the position of the screen relativeto the direction of the flow. For example, an intake screen positioned in line with the river bankand parallel to the natural flow usually presents conditions that are more conducive to avoidingimpingement.
The intent of angled barriers is that fish could more easily be directed or swept toward the bypassat the downstream end of the screen. It is a misconception that the parallel velocity component offlow describes a directional flow that could push a forward-facing fish toward the downstreamend of the screen where bypasses are typically located (Fletcher 1985, Alden ResearchLaboratory 1981). The angled screen does, however, aid in the successful bypass of fish in otherways.
Additional Considerations
5-2
Fletcher (1985) concluded that the diversion efficiency of angled barrier screens seems toincrease with steepness of pitch. However, he argued that angled screens only improve theconditions when fish are actually pressed against the screen, and provide no benefits otherwise.We believe that the forces experienced by fish once impinged are as presented in Figure 2-2c. Theforce V1 presses the fish against the screen, and V2 moves the fish along the face of the screen,but only if V2 is greater than f, the friction between the fish and the screen. As the angle of thescreen becomes more steep (i.e., θ gets smaller), V2 becomes greater making it more easy toovercome f which remains the same, thereby sliding the fish more easily along the face of thescreen.
Bates and Visonhaler (1956) describe the behavior of fish at a facility fitted with an angled arrayof louvers designed to direct fish toward a downstream bypass. As the fish were drawn near thelouvers, they positioned themselves one to three feet in front of them in an orientationperpendicular to the line of louvers. This caused the fish to be at an angle to the flow, fromwhich orientation they were apparently affected by the parallel-to-the-screen velocity componentand swept along the louvers to the bypass. In this instance, the sweeping component isexperienced only if the fish provides the force to keep it away from the screen at an angledorientation. The fish is influenced by the force associated with V2 (see Figure 2-2c), not by waterthat is actually flowing parallel to the screen. If a fish darts away from the screen and then quitsswimming it will drift straight back to the screen in line with the general direction of the flow.
Distance to bypass—Fletcher (1985) states that any effectiveness in bypassing fish derived byangling the screen likely decreases as the screen gets larger, because this often results in a longerdistance that the fish must travel to the bypass. Where bypasses are included to provide passagefor fish around the intake, it is important that the distance that a fish must travel along a screen toreach the bypass not be so long that a fish becomes fatigued and then impinged on the screenwithout enough energy to escape. Likewise, if a fish becomes impinged and is slid across thescreen to the bypass, the longer the fish is in contact with the screen, the greater the likelihood ofbeing injured or killed. Multiple bypasses may be necessary to quickly and safely move fishaway from the intake screen depending on the length and angle of the screen, the approachvelocity, and the swimming ability of the species present.
5.2 High Velocity Technologies
Even though criteria for intake velocities (if they exist at all) often restrict velocities to less than1 f/s, there are continuing efforts to design intake systems that are equally protective of fish athigher velocities. Studies on the success of high flow intake screens and bypass systems (e.g.,Eicher screens and modular inclined screens) with approach velocities up to 10 f/s have beenconducted on both small-scale and large-scale intake designs in the laboratory and athydroelectric dams (EPRI 1994, 1996). R2 Resource Consultants (1997a, 1997c, 1997d) providea thorough review of these studies. These systems have been developed not so much to minimizeimpingement, but to maximize the successful passage of healthy, viable fish around the intakeregardless of whether they contact the screen or not. These studies show that the development ofscreens that can successfully pass healthy fish with relatively high approach velocities is apotentially achievable goal. They also indicate that drawing fish toward a screen via highapproach velocities does not necessarily have to be a bad thing. Our summary of these studies isseparated into small-scale laboratory studies and large-scale field trials.
Additional Considerations
5-3
5.2.1 Laboratory Studies
Before new screen designs are tested in the field, small-scale laboratory studies are oftenconducted to perfect the design. Wert et al. (1987) evaluated passage of juvenile salmon at anangled screen bypass system at velocities of 6 f/s. Chinook salmon, coho salmon, and steelheadtrout were passed around the screen with no scale loss or delayed mortality. The smaller fish(chinook) of those tested were swept through the bypass more quickly. This study also includedan evaluation of impingement rates of rainbow trout at several velocities from 3–10 f/s. Theauthors found that the highest impingement occurred at <4 f/s; faster velocities swept the fishfrom the screen into the bypass.
A study of an experimental modular inclined screen system was performed to evaluate the effectsof velocities from 2 to 10 f/s on the passage of 10 species (EPRI 1994). The screen was angledvertically at 15 degrees and operated at flows from 16 to 80 cfs. Passage efficiency declined withincreasing velocity, but exceeded 95% for most tests up 10 f/s. The lowest passage efficiency(about 90%) occurred with alosid species. Most injuries were observed at the highest velocities,8 to 10 f/s. The largest fish tested, Atlantic salmon (170 mm), had an injury rate of 4% and asurvival rate after passage of 100%.
5.2.2 Field Studies
A number of field trials have been performed in recent years on a variety of screen systemsdesigned to operate under velocities higher than 1 f/s. Several of those studies are summarizedbelow.
Bomford and Lirette (1991) evaluated the passage efficiency of an operating screen in ahydroelectric canal. The screen was angled downward at a 6.5 degree angle and was evaluated atapproach velocities of 0.66–1.31 f/s and flows of 1500 cfs. Juvenile salmon were passed at 80%efficiency.
Matthews and Taylor (1994) and Smith (1997) report on the effectiveness of an Eicher penstockscreen and bypass system designed to pass juvenile salmon at the Puntledge River hydroelectricplant. Tests were performed at velocities of 6 f/s with a screen angled at 16.5 degrees and 58%porosity. Depending on the species being monitored, passage efficiency ranged from 96 to 100%.The new screen system resulted in a drop in mortality from near 60% prior to the new system toless than 5%.
Winchell et al. (1993) evaluated salmon passage and survival at an intake system with Eicherscreens and approach velocities of 4 to 7.8 f/s. Passage efficiency for steelhead, coho salmon,and chinook salmon fry and smolts ranged from 96 to 99%. Four-day survival rates ranged from91 to 98%. Descaling increased with velocity, and mortality was common for chinook andsteelhead with even minor descaling. Mortality rates ranged from 1 to 5% for fish with anaverage length of 44 to 52 mm, but were less than 1% for those greater than 73 mm.
Cramer (1997) reports on the evaluation of a combination of a louver guidance system and anEicher screen bypass system at a hydroelectric facility. Flow through the unit with theexperimental screen was about 400 cfs with an approach velocity of 6 f/s. The screen angled at
Additional Considerations
5-4
19 degrees provided 82–92% bypass efficiency for juvenile chinook salmon and steelhead. Theaverage occurrence of injury and descaling of those individuals passed was 0.44% and 1.8%,respectively.
Field testing of the modular inclined screen (MIS) system (vertically angled at 15 degrees) wassummarized in EPRI (1996) and Taft et al. (1997). Passage efficiency and fish survival weretested at velocities of 2 to 7.5 f/s. A greater than 99% passage efficiency and survival wasobserved for rainbow trout and golden shiners at all velocities. The survival rates of alosidspecies varied depending on velocity and ranged from 95% at 2 f/s to 27% at 6 f/s. Individuals ofthis species were reportedly in poor condition when tested; therefore, these results mayunderstate the potential effectiveness of the MIS with alosid species.
Although these studies of high velocity screens show a great deal of promise, there are stillseveral concerns that need to be addressed, including minimizing descaling of salmon smolts anddecreasing the added negative effects of debris accumulation on injury and descaling. Studies todate have been performed on a relatively narrow size range and limited test conditions. EPRI iscurrently testing angled bar racks and louvers for hydroelectric applications that may haveapplication for CWIS. Final results are expected in 2001.

6-1
6 ALTERNATIVE MEASURES FOR PREDICTINGIMPINGEMENT RATES
Reliance on a single criterion, i.e., approach velocity measured near or at the face of a fishscreen, may be of limited value for predicting whether a fish is likely to get impinged. Althoughapproach velocity has a major, perhaps primary, influence on impingement, there are many othercontributing factors related both to characteristics of the fish community and the intake design.
One of the design-related factors is the extent and magnitude of the velocity field around theintake. Whether a fish can escape from being impinged once it reaches a screen depends not onlyon what magnitude of approach velocities it must counteract but also for what length oftime/distance it must swim before eventually reaching a place outside of the influence of theintake. The amount of swimming (velocity and duration) necessary to move a fish from the frontof the screen to a point outside of the intake’s influence can be estimated. A comparison of thismeasure to the sustained swimming ability of various sizes and species of potentially impingedfish could conceivably be used to more accurately predict the risk of impingement for a givenCWIS. Such an analysis would also have to include consideration of the motivation of theaffected fish. Fish that are attempting to migrate through the area of the intake may not beinclined to turn around and swim away from the intake once attraction flows are detected sincethere motivation is in the direction of the intake. These fish would likely be more susceptible toimpingement than resident non-migratory fish of similar swimming ability.
Similarly, if the intake is fitted with a bypass, the amount of swimming required to reach thebypass could also be used to estimate the likelihood of impingement. Such a consideration isalready included in the NMFS criteria as it pertains to the distance to the bypass and the numberof bypass entrances required.
For a CWIS without a fish bypass or a fish-handling system (e.g., a Ristroph screen), thenumbers of impinged fish can generally be equated to the number of fish killed by impingement.For intakes with fish bypass systems, however, it is also important to evaluate the injury andmortality associated with bypass. A fish that is briefly impinged by greater-than-optimalapproach velocities may nonetheless be swept to a bypass and safely returned to the water body.On the other hand, there may be mortality associated with bypassing the fish, and this mortalitymay be latent, resulting from disease or increased susceptibility to predators. The important pointto bear in mind is that for CWIS with effective fish bypass systems at the screens, approachvelocities in excess of 0.5 f/s may not result in high impingement mortalities.
Along with a minimum approach velocity, EPA is also proposing another criterion—the ratio ofthe intake capacity (i.e., flow or volume) relative to that of the affected water body (65 FR49060; August 10, 2000). The proposed criterion varies based on the type of water body, and is
Alternative Measures for Predicting Impingement Rates
6-2
included apparently to address potential population-level effects. Although it was not the purposeof this report to evaluate the appropriateness of using an index of intake capacity as a criterion tominimize impingement, our initial impression is that a simple criterion like this has limitedutility. Similar to approach velocity, the volume of water diverted from a water body is only onefactor in the potential impact of water withdrawal on a fish population or community.
Ultimately, the impact of impingement should be evaluated from a population or communityperspective. Although an index of intake capacity may work for some facilities, we expect that amore detailed site-specific analysis (perhaps including a population model) is necessary to betterassess the potential for population- and community-level effects. Just as difficult as determiningwhat analyses should be performed to determine population- or community-level effects, isdetermining what would be considered a population- or community-level effect. For riskassessment purposes, Suter (1993) has established a 20% reduction in population as one that ismeasurable and potentially important. From a community perspective, a significant effect mightbe a change in fish abundance that upsets the community structure and function, which itself isnot easily defined.

7-1
7 CONCLUSIONS AND RECOMMENDATIONS
In this section, we address (and make recommendations about) the questions posed by EPRI staffat the initiation of the project:
• Is approach velocity an appropriate parameter for determining the potential for impingementimpact?
• Assuming approach velocity is technically supportable, what are the approaches and methodsthat can be universally applied to CWIS for its proper measurement?
• Is a single value appropriate and, if so, is 0.5 f/s a technically supportable criterion or isanother criterion technically supportable?
7.1 Is approach velocity an appropriate parameter for determining thepotential for impingement impact?
Water velocity is important to fish impingement at intakes. There is a substantial literature oflaboratory and field data that points to increased impingement with increased intake velocities.Velocities in some intake areas can exceed the swimming capabilities of fish, as thesecapabilities have been determined in standardized laboratory devices and protocols. Therelevance of laboratory data has been questioned, but appears to be upheld, at least in broadterms. For example, there appears to be a positive correlation between fish that have lowswimming abilities in laboratory tests (e.g., small bay anchovy, small Atlantic menhaden,Atlantic silverside, delta smelt), or fish performing at cold temperatures (e.g., juvenile salmonand trout, white perch, Atlantic menhaden, striped mullet), with the incidence of impingement atpower station intakes. The corollary is also generally true that species and life stages with highswimming performance capabilities in laboratory tests are less often impinged, although thisdepends on various features of organism and environmental health to be discussed below. Jointanalysis of power station data (retrospective) and laboratory data (predictive) is planned inconjunction with Alden Research Laboratory, which is analyzing the power station impingementdata. These results are expected to be available in 2001.
If emphasis is placed on approach velocity, then a more thorough consideration of the variousmeasurements of velocity at an intake is needed. One must specify which of several alternativemeasures is used, as discussed below.
For the majority of fish for which data are available, impingement probably depends onconditions of organism and environmental health as much as on water velocity alone. Thus, datashowing high swimming performance of healthy fish in tabulations such as Table A-1 are noguarantee of low impingement rates under naturally variable and anthropogenically impacted
Conclusions and Recommendations
7-2
conditions where these species occur. For example, winter cold torpor (a numbed state of poorresponsiveness and poor swimming capability) likely causes many impingement episodes. Thisphenomenon has been well documented for threadfin shad in southeastern reservoirs used forpower station cooling (McLean et al. 1979). Similarly, especially high temperatures or rapidtemperature changes can cause some fish to become debilitated and exhibit lower swimmingspeeds. Low dissolved oxygen, toxicants, low pH, and other water quality problems candebilitate fish and lower their ability to swim and avoid intakes, as was discussed above. Theavailability of light for visual orientation and direction of swimming behavior is especiallyimportant. A fish may be physiologically capable of attaining a swimming performancesufficient to avoid impingement but may be behaviorally unable to do so because of inability tosee landmarks to aid its orientation. Therefore, regulation of velocity is only one, albeitimportant, factor in reducing potential impingement. Careful attention to fish and ecosystemhealth will make the use of velocity as a regulatory tool more predictable and reliable. Howsufficient a velocity guideline can be for limiting impingement will depend on the site-specificcharacteristics of the waterbody and its fish populations. We therefore recommend that intakevelocity be an important, but not sole, consideration in regulating CWIS. Careful considerationmust be given to the exact measure of velocity, because “approach” can be ambiguous.
7.2 Assuming approach velocity is technically supportable, what are theapproaches and methods that can be universally applied to CWIS for itsproper measurement?
The precise definition of “approach velocity” can make a difference to the answer to the firstquestion. Velocity can be measured at different locations in the vicinity of an intake screen.These locations include within the holes in the screen, immediately in front of the screen wherepassage through the holes and blockage by the mesh are averaged, further from the screen whereblockage by larger structural members of the screen are also averaged with the through-screenvelocity, or even further away, where the geometry of the intake forebay creates vortices andother forms of turbulence that yield a different averaged velocity. All locations might beconsidered under the broad term “approach velocity.” We have explained the differences insection 3 above. When angled screens are considered, the theoretical directional vectors furtherconfuse the term “approach velocity.” The location and directional vectors that are selected forthe regulatory criteria should be specified carefully, because ambiguity can render a measuredvelocity parameter either appropriate or inappropriate for meeting the criterion. Also, the valuemeasured needs to be relevant to intake hydraulics and behavior of the fish in intakes as they areapproaching impingement, potentially being impinged, and seeking to escape.
Ideally, the full range of velocities in the flow field from source water to intake screen poreswould be known and these changing velocities could be related to the behavior of fish ofdifferent sizes and swimming capabilities expected at a site. It is unlikely that a universallyapplied measurement location will fit all circumstances of intake design, resulting velocity fields,and fish susceptibility. Nonetheless, the zone close to the screen is generally the most importantfor a fish seeking to avoid contact with the screen with either prolonged swimming or bursts ofactivity.
Directionality is also important. For angled screens, there are measurement options related to thescreen angle and potential or realized velocity vectors, as discussed above. It seems to us,
Conclusions and Recommendations
7-3
however, that the important vector is the one parallel with the main water flow. Features likesweeping velocity seem more theoretical than real when nearly all of the water is passingthrough the screens.
Consideration of the design and operation of the intake facility and screens is crucial for arrivingat an appropriate site-specific approach velocity. Recent developments in screen design suggestthat being able to minimize impingement and efficiently bypass healthy fish around a screen atrelatively high velocities (perhaps up to 10 f/s) may be an achievable goal.
We recommend that the most appropriate single velocity would be measured parallel to the mainwater movement in the intake forebay and in the zone between about 3 inches (7.5 cm) and 1foot (30 cm) from the screen face, to consist of the velocity prior to divergence of flows paststructural members of the screen. Site-specific analyses (Tiers 2 and 3) should measure orprovide adequate reference citations to the entire velocity field from source water body to theholes in the screen mesh.
7.3 Is a single value appropriate and, if so, is 0.5 f/s a technicallysupportable criterion or is another criterion technically supportable?
A single velocity value is not an adequate representation of all of the factors that influenceimpingement of fish, as discussed above. For well-founded regulation of an intake, a site-specificanalysis is essential. It is possible, however, to use a single velocity value (taken in the mostappropriate location and manner) as an indicator of the likely low occurrence of impingementproblems (the apparent intent of EPA’s proposed Tier 1). Based on laboratory data, one wouldpredict that a single value near 0.5 f/s (15.25 cm/s) would preclude most impingement of healthyfish large enough to be unable to pass through the screens, with certain (and important)exceptions noted above and thus make further detailed analyses unnecessary. This criterion forseparating intakes of low potential impact may have little practical value for existing powerstations, however, for few existing intakes currently have velocities this low. If the low-impact,screening criterion were to be raised to 1.0 f/s (30.48 cm/s) then the numbers of fish species andsizes potentially exceeding laboratory-derived critical swim speeds increases greatly. However,these susceptible species/sizes do not occur everywhere, and a higher criterion may be acceptablein certain regions, such as where only larger salmonids occur.
There is good reason to want some value for intake velocity that would indicate a low potentialfor detrimental impacts from impingement. Site-specific analysis entails considerable investmentin both site evaluation and basic swimming/impingement studies for many species, often onesnot yet studied. The spectrum of species to be considered keeps growing, and establishedswimming performance criteria based on juvenile salmonids and clupeids may no longer beadequate for any single site. With a fully site-specific approach, there is a possibility thatmaximum approach velocities for certain times of the year may be determined to be less than 0.5f/s (e.g., when very small, weakly swimming fishes or unusual environmental conditions dictate).Advocates for this approach should be willing to accept this outcome. It is clear that adoptingonly a site-specific approach could require considerable research effort, commitment by industry,and patience by management agencies.
Conclusions and Recommendations
7-4
We recommend that the value of 0.5 f/s be accepted as a national screening value for theregulatory purposes of suggesting low potential adverse environmental impact , that is, a valuebelow which an intake would not be subjected to as much detailed scrutiny for a CWA permit,unless the presence of especially vulnerable species or life stages or subsequent operationalmonitoring indicates particular problems. These potential problems must be looked for early inthe assessment process (e.g., presence of weakly swimming threatened or endangered speciesshould be known) and would then be handled on a site-specific basis. A higher single regulatoryvalue may suffice for certain regions, water body types, or seasons where and when susceptiblespecies/sizes do not occur.
8-1
8 REFERENCES
1. Adams, S. R., J. J. Hoover, and K. J. Killgore. 1999. Swimming endurance of juvenile pallidsturgeon, Scaphirhynchus albus. Copeia 1999:802–807.
2. Adams, S. R., and G. R. Parsons. 1998. Laboratory-based measurements of swimmingperformance and related metabolic rates of field-sampled smallmouth buffalo (Ictiobusbubalus): A study of seasonal changes. Physiological Zoology 71:350–358.
3. Adams, S. R., G. R. Parsons, J.J. Hoover, and K. J. Killgore. 1997. Observations ofswimming ability in shovelnose sturgeon (Scaphirhynchus platorhynchus). Journal ofFreshwater Ecology 12:631–633.
4. Alsop, D. H., and C. M. Wood. 1997. The interactive effects of feeding and exercise onoxygen consumption, swimming performance and protein usage in juvenile rainbow trout(Oncorhynchus mykiss). Journal of Experimental Biology 200:2337–2346.
5. Bainbridge, R. 1960. Speed and stamina in three fish. Journal of Experimental Biology37:129–153.
6. Baltz, D. M., P. B. Moyle, and N. J. Knight. 1982. Competitive interactions between benthicstream fishes, riffle sculpin, Cottus gulosus, and speckled dace, Rhinichthys osculus.Canadian Journal of Fisheries and Aquatic Sciences 39:1502–1511.
7. Barnthouse, L. W., R. J. Klauda, D. S. Vaughan, and R. L. Kendall (editors.). 1998. Science,Law, and Hudson River Power Plants: a Case Study in Environmental Impact Assessment.American Fisheries Society Monograph 4. American Fisheries Society, Bethesda, Maryland,U.S.A.
8. Bates, K. 1988. Screen criteria for juvenile salmon. Habitat Management Division,Washington State Department of Fisheries.
9. Beamish, F. W. H. 1966. Swimming endurance of some Northwest Atlantic fishes. Journal ofthe Fisheries Research Board of Canada 23:341–347.
10. Beamish, F. W. H. 1970. Oxygen consumption of largemouth bass, Micropterus salmoides,in relation to swimming speed and temperature. Canadian Journal of Zoology 48:1221–1228.
11. Beamish, F. W. H. 1974. Swimming performance of adult sea lamprey, Petromyzon marinus,in relation to weight and temperature. Transactions of the American Fisheries Society103:355–358.
References
8-2
12. Beamish, F. W. H. 1978. Swimming capacity. Pages 101–187 in W. S. Hoar and D. J.Randall, editors. Fish Physiology. Volume VII. Locomotion. Academic Press, New York.
13. Beamish, F. W. H. 1980. Swimming performance and oxygen consumption of the charrs.Pages 739–748, in E. K. Balon, editor. Charrs. Salmonid fishes of the genus Salvelinus. Dr.W. Junk, The Hague.
14. Beamish, F. W. H., J. C. Howlett, and T. E. Medland. 1989. Impact of diet on metabolismand swimming performance in juvenile lake trout, Salvelinus namaycush. Canadian Journalof Fisheries and Aquatic Sciences 46:384–388.
15. Beddow, T. A., and R. S. McKinley. 1998. Effects of thermal environment onelectromyographical signals obtained from Atlantic salmon (Salmo salar L.) during forcedswimming. Hydrobiologia 372:225–232.
16. Bernatchez, L., and J. J. Dodson. 1985. Influence of temperature and current speed on theswimming capacity of lake whitefish (Coregonus clupeaformis) and cisco (C. artedi).Canadian Journal of Fisheries and Aquatic Sciences 42:1522–1529.
17. Berry, C.R., Jr., and R. Pimentel. 1985. Swimming performances of three rare ColoradoRiver fishes. Transactions of the American Fisheries Society 114:397–402.
18. Besner, M., and L. S. Smith. 1983. Modification of swimming mode and stamina in twostocks of coho salmon (Oncorhynchus kisutch) by differing levels of long-term continuousexercise. Canadian Journal of Fisheries and Aquatic Sciences 40:933–939.
19. Bibko, P. N., L. Wirtenan, and P. E. Kueser. 1974. Preliminary studies on the effects of airbubbles and intense illumination on the swimming behavior of the striped bass (Moronesaxatiliis) and the gizzard shad (Dorosoma cepedianum). Pages 293–304 in L. D. Jensen,editor. Proceedings of the Second Entrainment and Intake Screening Workshop. PublicationNo. 74-049-00-5, Electric Power Research Institute, Palo Alto, California.
20. Blaxter, J. H. S., and B. B. Parrish. 1965. The importance of light in shoaling, avoidance ofnets and vertical migration of herring. Journal de Conseil Internationale de l’Exploration dela Mer: 3040–57.
21. Blazka, P. M., M. Voif, and M. Cepela. 1960. A new type of respirometer for thedetermination of metabolism of fish in an active state. Physiol. Bohemoslov 9:553–558.
22. Boisclair, D., and M. Tang. 1993. Empirical analysis of the influence of swimming pattern onthe net energetic cost of swimming in fishes. Journal of Fish Biology 42:169–183.
23. Bomford, J. A., and M. G. Lirette. 1991. Design, operation, and evaluation of an inverted,inclined, outmigrant fish screen. American Fisheries Society Symposium 10:228–236.
24. Booth, R. K., R. S. McKinley, F. Økland, and M. M. Sisak. 1997. In situ measurement ofswimming performance of wild Atlantic salmon (Salmo salar) using radio transmittedelectromyogram signals. Aquatic Living Resources 10:213–219.

References
8-3
25. Boyar, H. C. 1961. Swimming speed of immature Atlantic herring with reference to thePassamaquoddy Tidal Project. Transactions of the American Fisheries Society 90:21–26.
26. Brauner, C. J., A. L. Val, and D. J. Randall. 1993. The effect of graded methaemoglobinlevels on the swimming performance of chinook salmon (Oncorhynchus tshawytscha).Journal of Experimental Biology 185:121–135.
27. Brawn, V. M. 1960. Underwater television observations of the swimming speed andbehaviour of captive herring. Journal of the Fisheries Research Board of Canada 17:689–698.
28. Breder, C. M. 1926. The locomotion of fishes. Zoologica 4:159–256.
29. Brett. J. R. 1952. Temperature tolerance in young Pacific salmon, genus Oncorhynchus.Journal of the Fisheries Research Board of Canada 9:265–323.
30. Brett, J. R. 1956. Some principles in the thermal requirements of fishes. Quarterly Review ofBiology 31:75–87.
31. Brett, J. R. 1964. The respiratory metabolism and swimming performance of young sockeyesalmon. Journal of the Fisheries Research Board of Canada 21:1183–1226.
32. Brett, J. R. 1965. The relation of size to rate of oxygen consumption and sustained swimmingspeed of sockeye salmon (Oncorhynchus nerka) . Journal of the Fisheries Research Board ofCanada 22:1491–1501.
33. Brett, J. R. 1967. Swimming performance of sockeye salmon (Oncorhynchus nerka) inrelation to fatigue time and temperature. Journal of the Fisheries Research Board of Canada24:1731–1741.
34. Brett, J. R., and N. R. Glass. 1973. Metabolic rates and critical swimming speeds of sockeyesalmon (Oncorhynchus nerka) in relation to size and temperature. Journal of the FisheriesResearch Board of Canada 30:379–387.
35. Brett, J. R., and D. B. Sutherland. 1965. Respiratory metabolism of pumpkinseed (Lepomisgibbosus) in relation to swimming speed. Journal of the Fisheries Research Board of Canada22:405–409.
36. Bushnell, P. G, J. F. Steffensen, and K. Johansen. 1984. Oxygen consumption and swimmingperformance in hypoxia-acclimated rainbow trout Salmo gairdneri. Journal of ExperimentalBiology 113:225–235.
37. Bushnell, P. G., J. F. Steffensen, H. Schurmann, and D. R. Jones. 1994. Exercise metabolismin two species of cod in arctic waters. Polar Biology 14:43–48.
38. Butler, P. J., and N. Day. 1993. The relationship between intracellular pH and swimmingperformance of brown trout exposed to neutral and sublethal pH. Journal of ExperimentalBiology 176:271–284.
References
8-4
39. Butler, P. J., N. Day, and K. Namba. 1992. Interactive effects of seasonal temperature andlow pH on resting oxygen uptake and swimming performance of adult brown trout Salmotrutta. Journal of Experimental Biology 165:195–212,
40. Cannon, J. B., G. F. Cada, K. K. Campbell, D. W. Lee, A. T. Szluha. 1979. Fish protection atsteam-electric power plants: Alternative screening devices. Report. No. ORNL/TM-6472,Oak Ridge National Laboratory, Oak Ridge, Tennessee.
41. Chaudhry, M. H. 1993. Open-channel flow. Prentice Hall, Englewood Cliffs, New Jersey.
42. Childs, M. R., and R. W. Clarkson. 1996. Temperature effects on swimming performance oflarval and juvenile Colorado squawfish: Implications for survival and species recovery.Transactions of the American Fisheries Society 125:940–947.
43. Counihan, T. D., and C. D. Frost. 1999. Influence of externally attached transmitters on theswimming performance of juvenile white sturgeon. Transactions of the American FisheriesSociety 128:965–970.
44. Coutant, C. C. 1999. Think like a fish! Emphasizing the ‘behavior’ in behavioral guidancesystems. Hydro Review 18(3): 18–24.
45. Coutant, C. C. 2000. What is ‘normative’ at cooling water intakes? Defining normalcy beforejudging adverse. Environmental Science & Policy 3:S37–S42.
46. Coutant, C. C., and R. R. Whitney. 2000. Fish behavior in relation to passage throughhydropower turbines: a review. Transactions of the American Fisheries Society 129:351–380.
47. Cramer, D. 1997. Evaluation of a louver guidance system and Eicher screen for fishprotection at the T.W. Sullivan plant in Oregon. Presented at Fish passage Workshop,Milwaukee, Wisconsin, 6–8 May, 1997.
48. Cripe, G. M., L. R. Goodman, and D. J. Hansen. 1984. Effect of chronic exposure to EPNand to Guthion on the critical swimming speed and brain acetylcholinesterase activity ofCyprinodon variegatus. Aquatic Toxicology 5:255–266.
49. Dahlberg, M. L., D. L. Shumway, and P. Doudoroff. 1968. Influence of dissolved oxygenand carbon dioxide on swimming performance of largemouth bass and coho salmon. Journalof the Fisheries Research Board of Canada 25:49–70.
50. Dauble, D. D., and R. A. Moursund. Unpublished. Effects of extended length bypass screenson juvenile Pacific lamprey. Pacific Northwest National Laboratory, Richland, Washington.
51. Davidson, G. W., M. K. Sheehan, and P. S. Davie. 1999. The effect of tagging on theswimming performance of rainbow trout as a surrogate for kahawai Arripis trutta.Transactions of the American Fisheries Society 128:971–973.
52. Davis, G. E., J. Foster, C. E. Warren, and P. Doudoroff. 1963. The influence of oxygenconcentration on the swimming performance of juvenile Pacific salmon at varioustemperatures. Transactions of the American Fisheries Society 92:111–124.
References
8-5
53. Davison, W. 1989. Training and its effects on teleost fish. Comparative Biochemistry andPhysiology A 94:1–10.
54. Davison, W. 1997. The effects of exercise training on teleost fish, a review of recentliterature. Comparative Biochemistry and Physiology 117A:67–75.
55. Daxboek, D. 1982. Effect of coronary artery ablation on exercise performance in Salmogairdneri. Canadian Journal of Zoology 60:375–381.
56. Dijkgraaf, S., 1933. Untersuchungen uber die Funktion der Seitenorgane on Fisches. Z. vergl.Physiol. 20:
57. Dijkgraaf, S. 1962. The functioning and significance of the lateral line organs. BiologicalReviews of the Cambridge Philosophical Society 38(5):
58. Dodson, J. J., and C. I. Mayfield. 1979. Modification of the rheotropic response of rainbowtrout (Salmo gairdneri) by sublethal doses of the aquatic herbicides Diquat and Simazine.Environmental Pollution 18:147–157.
59. Domenici, P, and R. S. Batty. 1997. Escape behavior of solitary herring (Clupea harengus)and comparisons with schooling individuals. Marine Biology 128:29–38.
60. Dorn, P., L. Johnson, and C. Darby. 1979. The swimming performance of nine species ofcommon California inshore fishes. Transactions of the American Fisheries Society1089:366–372.
61. Duthie, G. G. 1987. Observations of poor swimming performance among hatchery-rearedrainbow trout, Salmo gairdneri. Environmental Biology of Fishes 18:309–311.
62. Eaton, R. C., R. A. Bombardieri, and D. L. Meyer. 1977. The Mauthner-initiated startleresponse in teleost fish. Journal of Experimental Biology 66:65–81.
63. Eaton, R. C., and D. S. Emberley. 1991. How stimulus direction determines the trajectory ofthe Mauthner-initiated escape response in a teleost fish. Journal of Experimental Biology161:469–487.
64. EPA (U.S. Environmental Protection Agency). 1998. Ecological Risk AssessmentGuidelines. Washington, DC.
65. EPA. 2000. National Pollutant Discharge Elimination System; Cooling Water IntakeStructures for New Facilities: Proposed Rules. Federal Register 65:49060–49121 (August 10,2000).
66. EPRI. 1986. Assessment of downstream migrant fish protection technologies forhydroelectric application. Prepared by Stone & Webster Engineering Corporation. EPRI AP-4711, Palo Alto, California.
References
8-6
67. EPRI. 1994. Biological evaluation of a modular inclined screen for protecting fish at waterintakes. Prepared by Stone & Webster Engineering Corporation. EPRI TR-104121, PaloAlto, California.
68. EPRI. 1996. Evaluation of the modular inclined screen (MIS) at the Green Islandhydroelectric project: 1995 test results. Prepared by Stone & Webster EnvironmentalTechnology & Services and Alden Research Laboratory, Inc. EPRI TR-106498, Palo Alto,California.
69. EPRI. 1999. Status report on fish protection at cooling water intakes. EPRI Report No. TR-114013, Palo Alto, California.
70. Facey, D. E., and G. D. Grossman. 1990. The metabolic cost of maintaining position for fourNorth American stream fishes: effects of season and velocity. Physiological Zoology 63:757–776.
71. Farlinger, S., and F. W. H. Beamish. 1977. Effects of time and velocity increments on thecritical swimming speed of largemouth bass (Micropterus salmoides). Transactions of theAmerican Fisheries Society 106:436–439.
72. Farlinger, S., and F. W. H. Beamish. 1978. Changes in blood chemistry and criticalswimming speed of largemouth bass, Micropterus salmoides, with physical conditioning.Transactions of the American Fisheries Society 107:523–527.
73. Farrell, A. P., W. Bennett, and R. H. Devlin. 1997. Growth-enhanced transgenic salmon canbe inferior swimmers. Canadian Journal of Zoology 75:335–337.
74. Farrell, A. P., A. K. Gamperl, and I. K. Birtwell. 1998. Prolonged swimming, recovery andrepeat swimming performance of mature sockeye salmon Oncorhynchus nerka exposed tomoderate hypoxia and Pentachlorophenol. Journal of Experimental Biology 201:2183–2193.
75. Farrell, A. P., J. A. Johnson, J. F. Steffensen, C. D. Moyes, T. G. West, and R., K. Suarez.1990. Effects of exercise training and coronary ablation on swimming performance, heartsize, and cardiac enzymes in rainbow trout, Oncorhynchus mykiss. Canadian Journal ofZoology 68:1174–1179.
76. Farrell, A. P. J. A. Johansen, and R. K. Suarez. 1991. Effects of exercise-training on cardiacperformance and muscle enzymes in rainbow trout Oncorhynchus mykiss. Fish Physiologyand Biochemistry 9:303–312.
77. Fletcher, R. I. 1985. Risk analysis for fish diversion experiments: Pumped Intake Systems.Transactions of the American Fisheries Society 114:652–694.
78. Fletcher, R. I. 1990. Flow dynamics and fish recovery experiments: Water intake systems.Transactions of the American Fisheries Society 119:393–415.
79. Fletcher, R. I. 1994. Flows and fish behavior: Large double-entry screening systems.Transactions of the American Fisheries Society 123:866–885.
References
8-7
80. Freadman, M. A. 1979. Swimming energetics of striped bass (Morone saxatilis) and bluefish(Pomatomus saltatrix): gill ventilation and swimming metabolism. Journal of ExperimentalBiology 83:217–230.
81. Fricke, R., H. Handermann, S. Stahlberg, and P. Peckmann. 1987. The compatible criticalswimming speed: a new measure for the specific swimming performance of fishes.Zoologische Jahrbucher Abteilung fuer Allgemeine Zoologie und Physiologie der Tiere91:101–111.
82. Fry, F. E. J., and E. T. Cox. 1970. A relation of size to swimming speed in rainbow trout.Journal of the Fisheries Research Board of Canada 27:976–978.
83. Gallaugher, P., M. Axelsson, and A. P. Farrell. 1992. Swimming performance andhaematological variables in splenectomized rainbow trout, Oncorhynchus mykiss. Journal ofExperimental Biology 171:301–314.
84. Gallaugher, P., H. Thorarensen, and A. P. Farrell. 1995. Hematocrit in oxygen transport andswimming in rainbow trout (Oncorhynchus mykiss). Respiration Physiology 102:279–292.
85. Gamperl, A. K., D. L. Schnurr, and E. D. Stevens. 1991. Effect of a sprint-training protocolon acceleration performance in rainbow trout (Salmo gairdneri). Canadian Journal ofZoology 69:578–582.
86. Glova, G. J., and J. E. McInerney. 1977. Critical swimming speeds of coho salmon(Oncorhynchus kisutch) fry to smolt stages in relation to salinity and temperature. Journal ofthe Fisheries Research Board of Canada 34:151–154.
87. Graham, M. S., and C. M. Wood. 1981. Toxicity of environmental acid to the rainbow trout:interactions of water hardness, acid type, and exercise. Canadian Journal of Zoology59:1518–1526.
88. Greer Walker, M., and G. Pull. 1973. Skeletal muscle function and sustained swimmingspeeds in the coalfish Gadus virens L. Comparative Biochemistry and Physiology A 44:495–501.
89. Gregory, T. R., and C. M. Wood. 1998. Individual variation and interrelationships betweenswimming performance, growth rate, and feeding in juvenile rainbow trout (Oncorhynchusmykiss). Canadian Journal of Fisheries and Aquatic Sciences 55:1583–1590.
90. Gregory, T. R., and C. M. Wood. 1999. Interactions between individual feeding behaviour,growth, and swimming performance in juvenile rainbow trout (Oncorhynchus mykiss) feddifferent rations. Canadian Journal of Fisheries and Aquatic Sciences 56:479–486.
91. Griffiths, J. S., and D. F. Alderdice. 1972. Effects of acclimation and acute temperatureexperience on the swimming speed of juvenile coho salmon. Journal of the FisheriesResearch Board of Canada 29:251–264.

References
8-8
92. Hammer, C. 1995. Fatigue and exercise tests with fish. Comparative Biochemistry andPhysiology A 112:1–20.
93. Hanson, C. H., and H. W. Li. 1978. A research program to examine fish behavior in responseto hydraulic flow fields – Development of biological design criteria for proposed waterdiversions. Completion Report, University of California, Davis, Project OWRT C-7679, U.S.Department of the Interior Office of Water Research and Technology.
94. Hanson, C. H., J. R. White, and H. W. Li. 1977. Entrapment and impingement of fishes bypower plant cooling-water intakes: an overview. Marine Fisheries Review 39(10):7–17.
95. Hawkins, D. K., and T. P. Quinn. 1996. Critical swimming velocity and associatedmorphology of juvenile coastal cutthroat trout (Oncorhynchus clarki clarki), steelhead trout(Oncorhynchus mykiss), and their hybrids. Canadian Journal of Fisheries and AquaticSciences 53:1487–1496.
96. Heath, A. G. 1987. Water Pollution and Fish Physiology. CRC Press, Boca Raton, Florida.
97. Heath, A. G., J. J. Cech, Jr., J. G. Zinkl, and M. D. Steele. 1993. Sublethal effects of threepesticides on Japanese medaka. Archives of Environmental Contamination and Toxicology25:485–491.
98. Heath, A. G., J. J. Cech, Jr., J. G. Zinkl, B. Finlayson, and R. Fujimura. 1993. Sublethaleffects of methyl parathion, carbofuran, and moline on larval striped bass. AmericanFisheries Society Symposium 14:17–28.
99. Heath, A. G., J. J. Cech, Jr., L. Brink, P. Moberg, and J. G. Zinkl. 1997. Physiologicalresponses of fathead minnow larvae to rice pesticides. Ecotoxicology and EnvironmentalSafety 37:280–288.
100. Hettler, W. F. 1977. Swimming speeds of juvenile estuarine fish in a circular flume.Proceedings of the Annual Conference of the Southeastern Association of Fish and WildlifeAgencies 31:392–398.
101. Higgs, D. M., and L. A. Fuiman. 1996. Light intensity and schooling behavior in larvalGulf menhaden. Journal of Fish Biology 48:979–991.
102. Hocutt, C. H. 1973. Swimming performance of three warmwater fishes exposed to arapid temperature change. Chesapeake Science 14:11–16.
103. Hocutt, C. H., and J. E. Edinger. 1980. Fish Behavior in Flow Fields. Pages 143–181 InC.H. Hocutt, J.R. Stauffer, Jr., J.E. Edinger, L.W. Hall, Jr., and R. P. Morgan II [eds] PowerPlants: Effects on Fish and Shellfish Behavior. Academic Press, Inc. New York.
104. Howard, T. E. 1975. Swimming performance of juvenile coho salmon (Oncorhynchuskisutch) exposed to bleached kraft pulpmill effluent. Journal of the Fisheries Research Boardof Canada 32:789–793.

References
8-9
105. Hutchinson, G. E. 1957. Concluding remarks. Cold Spring Harbor Symposium inQuantitative Biology 22:415–427.
106. Jain, K. E., J. C. Hamilton, and A. P. Farrell. 1997. Use of a ramp velocity test tomeasure critical swimming speed in rainbow trout (Onclrhynchus mykiss). ComparativeBiochemistry and Physiology 117A:441–444.
107. Jain, K. E., I. K. Birtwell, and A. P. Farrell. 1998. Repeat swimming performance ofmature sockeye salmon following a brief recovery period: a proposed measure of fish healthand water quality. Canadian Journal of Zoology 76:1488–1496.
108. Jones, D. R. 1971. The effect of hypoxia and anaemia on the swimming performance ofrainbow trout (Salmo gairdneri). Journal of Experimental Biology 55:541–551.
109. Jones, D. R., J. W. Kicenuik, and O. S. Bamford. 1974. Evaluation of the swimmingperformance of several fish species from the Mackenzie River. Journal of the FisheriesResearch Board of Canada 31:1641–1647.
110. Katz, M., A. Pritchard, and C. E. Warren. 1956. Ability of some salmonids and acentrarchid to swim in water of reduced oxygen content. Transactions of the AmericanFisheries Society 88:88–95.
111. Keen, J. E., and A. P. Farrell. 1994. Maximum prolonged swimming speed and maximumcardiac performance of rainbow trout, Oncorhynchus mykiss, acclimated to two differentwater temperatures. Comparative Biochemistry and Physiology 108A:287–295.
112. Kerr, J. E. 1953. Studies on fish preservation at the Contra Costa Steam Plant of thePacific Gas and Electric Company. Fish Bulletin No. 92, California Department of Fish andGame, Sacramento, California.
113. Kiceniuk, J. W., and D. R. Jones. 1977. The oxygen transport system in trout (Salmogairdneri) during sustained exercise. Journal of Experimental Biology 69:247–260.
114. Kieffer, J. D. 2000. Limits to exhaustive exercise in fish. Comparative Biochemistry andPhysiology, Part A 126:161–179.
115. King, L. R. 1971a. Swimming speed and endurance studies on white perch, Moroneamericana. Report for Consolidated Edison Company of New York, Inc. IchthyologicalAssociates, Ithaca, New York. (Note: Includes a series of progress reports for various monthsin 1970 and 1971, which are summarized in this report).
116. King, L. R. 1971b. Supplementary report on swimming speeds of bay anchovy and otherestuarine fishes (June–July 1971). Report for Consolidated Edison Company of New York,Inc. Ichthyological Associates, Ithaca, New York.
117. Kodrick-Brown, A., and P. F. Nicoletto. 1993. The relationship between physicalcondition and social status in pupfish Cyprinodon pecosensis. Animal Behavior 46:1234–1236.

References
8-10
118. Kolok, A. S. 1991. Photoperiod alters the critical swimming speed of juvenile largemouthbass, Micropterus salmoides, acclimated to cold water. Copeia 1991:1085–1090.
119. Kolok, A. S. 1992a. Morphological and physiological correlates with swimmingperformance in juvenile largemouth bass. American Journal of Physiology 263:R1042–R1048.
120. Kolok, A. S. 1992b. The swimming performances of individual largemouth bass(Micropterus salmoides) are repeatable. Journal of Experimental Biology 170:265–270.
121. Kolok, A. S. 1999. Interindividual variation in the prolonged locomotor performance ofectothermic vertebrates: a comparison of fish and herpetofaunal methodologies and a briefreview of the recent fish literature. Canadian Journal of Fisheries and Aquatic Sciences56:700–710.
122. Kolok, A. S., and A. P. Farrell. 1994a. Individual variation in the swimming performanceand cardiac performance of northern squawfish, Ptychocheilus oregonensis. PhysiologicalZoology 67:706–722.
123. Kolok, A. S., and A. P. Farrell. 1994b. The relationship between maximum cardiacoutput and swimming performance in northern squawfish, Ptychocheilus oregonensis: theeffect of coronary artery ligation. Canadian Journal of Zoology 72:1687–1690.
124. Kolok, A. S., and J. T. Oris. 1995. The relationship between specific growth rate andswimming performance in male fathead minnows (Pimephales promelas). Canadian Journalof Zoology 73:2165–2167.
125. Kolok, A. S, E. P. Plaisance, and A. Abdelghani. 1998. Individual variation in theswimming performance of fishes: an overlooked source of variation in toxicity studies.Environmental Toxicology and Chemistry 17:282–285.
126. Kolok, A. S., and D. Sharkey. 1997. Effect of freshwater acclimation on the swimmingperformance and plasma osmolarity of the euryhaline Gulf killifish. Transactions of theAmerican Fisheries Society 126:866–870.
127. Kolok, A. S., R. M. Spooner, and A. P. Farrell. 1993. The effect of exercise on thecardiac output and blood flow distribution of the largescale sucker Catostomus macrocheilus.Journal of Experimental Biology 183:301–321.
128. Kovacs, T. G., and G. Leduc. 1982. Sublethal toxicity of cyanide to rainbow trout (Salmogairdneri) at different temperatures. Canadian Journal of Fisheries and Aquatic Sciences39:1389–1395.
129. Krueger, H. M., J. B. Saddler, G. A. Chapman, I. J. Tinsley, and R. R. Lowrey. 1968.Bioenergetics, exercise, and fatty acids of fish. American Zoologist 8:119–129.
130. Kumaraguru, A. K., and F. W. H. Beamish. 1983. Bioenergetics of acclimation toPermethrin (NRDC-143) by rainbow trout. Comparative Biochemistry and Physiology C75:247–252.

References
8-11
131. Kutty, M. N., and R. L. Saunders. 1973. Swimming performance of young Atlanticsalmon (Salmo salar) as affected by reduced ambient oxygen concentration. Journal of theFisheries Research Board of Canada 30:223–227.
132. Larimore, R. W., and M. J. Duever. 1968. Effects of temperature acclimation on theswimming ability of smallmouth bass fry. Transactions of the American Fisheries Society97:175–184.
133. Lindahl, P. E., and E. Schwanbom. 1971. A method for the detection and quantitativeestimation of sublethal poisoning in living fish. Oikos 22:210–214.
134. Lindsey, C. C. 1978. Form, function, and locomotory habits in fish. Pages 1–100 in W. S.Hoar and D. J. Randall, editors. Fish Physiology. Volume VII. Locomotion. Academic Press,New York.
135. MacKinnon, D. L., and A. P. Farrell. 1992. The effect of 2-(thiocyanomethylthio)benzothiazole on juvenile coho salmon (Oncorhynchus kisutch):sublethal testing. Environmental Toxicology and Chemistry 11:1541–1548.
136. MacLeod, J. C. 1967. A new apparatus for measuring maximum swimming speeds ofsmall fish. Journal of the Fisheries Research Board of Canada 24:1241–1252.
137. MacLeod, J. C., and L. L. Smith, Jr. 1966. Effect of pulpwood fiber on oxygenconsumption and swimming endurance of the fathead minnow, Pimephales promelas.Transactions of the American Fisheries Society 95:71–84.
138. MacPhee, C., and F. J. Watts. 1975. Swimming performance of Arctic grayling inhighway culverts. University of Idaho, Moscow.
139. Magnuson, J. J. 1978. Locomotion by scombrid fishes: Hydromechanics, morphologyand behavior. Pages 239–313 in W. S. Hoar and D. J. Randall, editors. Fish Physiology. Vol.VII. Locomotion. Academic Press, New York.
140. Mathur, D., P. G. Heisey, and N. C. Magnusson. 1977. Impingement of fishes at PeachBottom Atomic Power Station, Pennsylvania. Transactions of the American Fisheries Society106:258–267.
141. Matthews, J. G., and J. W. Taylor. 1994. Design and construction of Eicher penstock fishscreens. Technical report for the B.C. Hydro and Power Authority. Vancouver, BritishColumbia.
142. Matthews, W. J. 1985. Critical current speeds and microhabitats of the benthic fishesPercina roanoka and Etheostoma flabellare. Environmental Biology of Fishes 12:303–308.
143. McCleave, J. D. 1980. Swimming performance of European eel (Anguilla anguilla (L.))elvers. Journal of Fish Biology 16:445–452.

References
8-12
144. McLean, R. B., P. T. Singley, J. S. Griffith, M. V. McGee, and R. Pasch. 1979. Threadfinand gizzard shad impingement: Causes and ecological effects. ORNL/NUREG/TM-340. Oakridge National Laboratory, Oak Ridge, Tennessee.
145. Meldrim, J. W., J. J. Gift, and B. R. Petrosky. 1974. The effect of temperature andchemical pollutants on the behavior of several estuarine organisms. Bulletin No. 11,Ichthyological Associates, Inc., Middletown, Delaware.
146. Mesa, M. G., and T. M. Olson. 1993. Prolonged swimming performance of northernsquawfish. Transactions of the American Fisheries Society 122:1104–1110.
147. Muir, B. S., and A. J. Niimi. 1972. Oxygen consumption of he euryhaline fish aholehole(Kuhlia sandvicensis) with reference to salinity, swimming, and food consumption. Journalof the Fisheries Research Board of Canada 29:67–77.
148. Mulchaey, B. W. 1994. An evaluation of the swimming performance of two strains ofhatchery-reared trainbow trout (Oncorhynchus mykiss). MS Thesis. Humboldt StateUniversity, Arcata, California.
149. Myrick, C. A., and J. J. Cech. 2000. Swimming performances of four California streamfishes: temperature effects. Environmental Biology of Fishes 58:289–295.
150. Nagle, D. G., and J. T. Morgan, Jr. 2000. A draft regulatory framework for analyzingpotential advarse environmental impact from cooling water intake structures. EnvironmentalScience & Policy 3:ix–xiv.
151. NMFS (National Marine Fisheries Service). 1995. Fish screening criteria for anadromoussalmonids. NMFS Northwest Region. Portland, Oregon.
152. NMFS. 1997. Fish screening criteria for anadromous salmonids. NMFS SouthwestRegion. Santa Rosa, California. http://swr.ucsd.edu/hcd/fishscrn.htm
153. Nelson, J. A., Y. Tang, and R. G. Boutellier. 1994. Differences in exercise physiologybetween two Atlantic cod (Gadus morhua) populations from different environments.Physiological Zoology 67:330–354.
154. Nelson, J. A., Y. Tang, and R. G. Boutellier. 1996. The effects of salinity change on theexercise performance of two Atlantic cod (Gadus morhua) populations inhabiting differentenvironments. Journal of Experimental Biology 199:295–1309.
155. Nicoletto, P. F. 1991. The relationship between male ornamentation and swimmingperformance in the guppy, Poecilia reticulata. Behavioral Biology and Sociobiology 28:365–370.
156. Nicoletto, P. F. 1993. Female sexual response to condition-dependent ornaments in theguppy, Poecilia reticulata. Animal Behavior 46:441–450.
157. Nordlund, B. 1996. Designing fish screens for fish protection at water diversions.National Marine Fisheries Service, Portland, Oregon.
References
8-13
158. Ojanguren, A. F., and F. Braña. 2000. Thermal dependence of swimming endurance injuvenile brown trout. Journal of Fish Biology 56:1342–1347.
159. Oseid, D., and L. L. Smith, Jr. 1972. Swimming endurance and resistance to copper andMalathion of bluegills treated by long-term exposure to sublethal levels of hydrogen sulfide.Transactions of the American Fisheries Society 101:620–625.
160. Otto, R. G., and J. O’Hara Rice. 1974. Swimming speeds of yellow perch (Percaflavescens) following an abrupt change in environmental temperature. Journal of theFisheries Research Board of Canada 31:1731–1734.
161. Parsons, G. R., and J. L. Sylvester, Jr. 1992. Swimming efficiency of the white crappie,Pomoxis annularis. Copeia 1992:1033–1038.
162. Pavlov, D. S. 1966. The relationship of young fish to a current of water and orientation init. Zoological Journal 45(6) [in Russian; cited by Pavlov et al. 1972]
163. Pavlov, D. S. 1970. The optomotor reaction and features of the orientation of fish in acurrent of water. Moscow, Nauka Press [in Russian; cited by Pavlov et al. 1972]
164. Pavlov, D. S., A. I. Lupandin, and M. A. Skorobogatov. 1994. Influence of flowturbulence on critical flow velocity for gudgeon (Gobio gobio). Doklady Biological Sciences(translation) 336:215–217.
165. Pavlov, D. S., Y. N. Sbikin, A. Y. Vashchinnikov, and A. S. Mochek. 1972. The effect oflight intensity and water temperature on the current velocities critical to fish. Journal ofIchthyology 12:703–711.
166. Pavlov, D. S., M. A. Skorobogatov, and L. G. Shtaf. 1983. Influence of degree of streamturbulence on the magnitude of the critical current velocity for fish. Doklady BiologicalSciences (translation) 267:560–562.
167. Peake, S., C. Barth, and R. S. McKinley. 1997. Effect of recovery parameters on criticalswimming speed of juvenile rainbow trout (Oncorhynchus mykiss). Canadian Journal ofZoology 75:1724–1727.
168. Peake, S., F. W. H. Beamish, R. S. McKinley, C. Katopodis, and D. A. Scruton. 1995.Swimming performance of lake sturgeon, Acipenser fulvescens. Canadian Technical Reportof Fisheries and Aquatic Sciences No. 2063.
169. Peake, S., R. S. McKinley, and D. A. Scruton. 1997. Swimming performance of variousfreshwater Newfoundland salmonids relative to habitat selection and fishway design. Journalof Fish Biology 51:710–723.
170. Pearce, R. O., and R. T. Lee. 1991. Some design considerations for approach velocities atjuvenile salmonid screening facilities. American Fisheries Society Symposium 10:237–248.
171. Pearson, M. P., and E. D. Stevens. 1991. Splenectomy impairs aerobic swim performancein trout. Canadian Journal of Zoology 69:2089–2092.

References
8-14
172. Peterson, R. H. 1974. Influence of fenitrothion on swimming velocities of brook trout(Salvelinus fontinalis). Journal of the Fisheries Research Board of Canada 31:1757–1762.
173. Plaut, I., and M. S. Gordon. 1994. Swimming metabolism of wild-type and clonedzebrafish Brachydanio rerio. Journal of Experimental Biology 194:209–223.
174. R2 Resource Consultants. 1997a. Annotated bibliography of literature regarding highflow dewatering systems. Report to US Army Corps of Engineers, Portland, District,Contract No. DACW57-96-0007. Portland, Oregon. 123 pp .http://www.nwp.usace.army.mil/PM/E/REPORTS/highflow/bib.pdf.
175. R2 Resource Consultants. 1997b. Biological Assumptions and Conceptual Study Designsfor High Flow Dewatering Systems. Report to US Army Corps of Engineers, Portland,District, Contract No. DACW57-96-0007. Portland, Oregon. 14 pp.http://www.nwp.usace.army.mil/PM/E/REPORTS/highflow/assumptions.pdf.
176. R2 Resource Consultants. 1997c. Review of Screening Criteria and Technology for HighFlow Fish Passage Systems in the Columbia River. Report to US Army Corps of Engineers,Portland, District, Contract No. DACW57-96-0007. Portland, Oregon. 71 pp.http://www.nwp.usace.army.mil/PM/E/REPORTS/highflow/Review.pdf.
177. R2 Resource Consultants. 1997d. Summary of Available Literature Regarding High FlowDewatering Systems. Report to US Army Corps of Engineers, Portland, District, ContractNo. DACW57-96-0007. Portland, Oregon. 17 pp.http://www.nwp.usace.army.mil/PM/E/REPORTS/highflow/summary.pdf.
178. Rainey, W. S. 1985. Considerations in the Design of Juvenile Bypass Systems. In: F.W.Olson, R.G. White and R.H. Hamre, Proceedings of the Symposium on Small Hydropowerand Fisheries, Aurora.
179. Rimmer, D. M., R. L. Saunders, and U. Paim. 1985. Effects of temperature and season onthe position holding performance of juvenile Atlantic salmon (Salmo salar). CanadianJournal of Zoology 63:92–96.
180. Ringger, T. G. 2000. Investigations of impingement of aquatic organisms at the CalvertCliffs Nuclear Power Plant, 1975–1995. Environmental Science & Policy 3:S261–S273.
181. Rulifson, R. A. 1977. Temperature and water velocity effects on the swimmingperformances of young-of-the-year striped mullet (Mugil cephalus), spot (Leiostomusxanthurus), and pinfish (Lagodon rhomboides). Journal of the Fisheries Research Board ofCanada 34:2316–2322.
182. Sandström, O. 1983. Seasonal variations in the swimming performance of perch (Percafluviatilis L.) measured with the rotary-flow technique. Canadian Journal of Zoology61:1475–1480.
183. Schiemenz, F. 1927. Das verhalten der Fishe in geraden Stromungen als Beitrag zurOrientirung der Fische in der freien naturlichen Wasserstromung. Z. Vergl. Physiol. 6:
References
8-15
184. Schiewe, M. H. 1974. Influence of dissolved atmospheric gas on swimming performanceof juvenile chinook salmon. Transactions of the American Fisheries Society 103:717–721.
185. Sfakiotakis, M., D. M. Lane, and J. B. C. Davies. 1999. Review of fish swimming modesfor aquatic locomotion. IEEE Journal of Oceanic Engineering 24:237–252.
186. Smith, H. 1997. Operating history of the Puntledge River Eicher screeen facility.Presented at Fish passage Workshop, Milwaukee, Wisconsin, 6–8 May, 1997.
187. Smith, L. S., and L. T. Carpenter. 1987. Salmonid fry swimming stamina data fordiversion screen criteria. Fisheries Research Institute, University of Washington, Seattle.
188. Soofiani, N. M., and I. G. Priede. 1985. Aerobic metabolic scope and swimmingperformance in juvenile cod, Gadus morhua L. Journal of Fish Biology 26:127–138.
189. Stahlberg, S., and P. Peckmann. 1987. The critical swimming speed of small teleost fishspecies in a flume. Archiv. Hydrobiologie 110:179–193.
190. Stevens, E. D., A. Sutterlin, and T. Cook. 1998. Respiratory metabolism and swimmingperformance in growth hormone transgenic Atlantic salmon. Canadian Journal of Fisheriesand Aquatic Sciences 55:2028–2035.
191. Strange, R. J., and J. J. Cech, Jr. 1992. Reduced swimming performance of striped bassafter confinement stress. Transactions of the American Fisheries Society 121:206–210.
192. Suter, G. W.,II. 1993. Ecological Risk Assessment. Lewis Publishers, Ann Arbor,Michigan.
193. Swanson, C., P. S. Young, and J. J. Cech, Jr. 1998. Swimming performance of deltasmelt: maximum performance, and behavioral and kinematic limitations on swimming atsubmaximal velocities. Journal of Experimental Biology 201:333–345.
194. Taft, E. P., F. C. Winchell, S. V. Amaral, T. C. Cook, A. W. Plizga, A. M. Paolini, andC.W. Sullivan. 1997. Field evaluations of the new modular inclined fish diversion screen.Waterpower ‘97:665–671
195. Tang, M., D. Boisclair, C. Ménard, and J. A. Downing. 2000. Influence of body weight,swimming characteristics, and water temperature on the cost of swimming in brook trout(Salvelinus forntinalis). Canadian Journal of Fisheries and Aquatic Sciences 57:1482–1488.
196. Tatham, T. R. 1970. Swimming speed of the white perch, Morone americana, stripedbass, Morone saxatilis, and other estuarine fishes. Ichthyological Associates, Ithaca, NewYork for Consolidated Edison Company of New York, Inc., New York, New York.
197. Taylor, E. B., and C. J. Foote. 1991. Critical swimming velocities of juvenile sockeyesalmon and kokanee, the anadromous and non-anadromous forms of Oncorhynchus nerka(Walbaum). Journal of Fish Biology 38:407–419.
References
8-16
198. Taylor, E. B., and J. D. McPhail. 1985. Variation in burst and prolonged swimmingperformance among British Columbia populations of coho salmon, Oncorhynchus kisutch.Canadian Journal of Fisheries and Aquatic Sciences 42:2029–2033.
199. Terpin, K. M., M. C. Wyllie, and E. R. Holmstrom. 1977. Temperature preference,avoidance, shock, and swim speed studies with marine and estuarine organisms from NewJersey. Bulletin No. 17, Ichthyological Associates, Inc. Brigantine, New Jersey for PublicService Electric and Gas Company, Newark, New Jersey.
200. Thorarensen, H., P Gallaugher, and A. P. Farrell. 1996. Cardiac output in swimmingrainbow trout, Oncorhynchus mykiss, acclimated to seawater. Physiological Zoology 69:139–153.
201. Thorarensen, H., P. E. Gallaugher , A. K. Kiessling, and A. P. Farrell. 1993. Intestinalblood flow in swimming chinook salmon Oncorhynchus tshawytscha and the effects ofhaematocrit on blood flow distribution. Journal of Experimental Biology 179:115–129.
202. Turnpenny, A. W. H. 1983. Swimming performance of juvenile sprat, Sprattus sprattusL., and herring, Clupea harengus L., at different salinities. Journal of Fish Biology 23:321–325.
203. Turnpenny, A. W. H., and R. N. Bamber. 1983. The critical swimming speed of the sandsmelt (Atherina presbyter Cuvier) in relation to capture at a power station cooling waterintake. Journal of Fish Biology 23:65–73.
204. USAEC (U.S. Atomic Energy Commission). 1975. Final Environmental Statementrelated to operation of Indian Point Nuclear Generating Plant Unit No. 3. ConsolidatedEdison Company of New York, Inc. Docket No. 50-286. Vol. 1. Office of NuclearRegulation, Washington, DC.
205. Waiwood, K. G., and F. W. H. Beamish. 1978. Effects of copper, pH, and hardness onthe critical swimming performance of rainbow trout (Salmo gairdneri Richardson). WaterResearch 12:611–619.
206. Webb, P. W. 1971. The swimming energetics of trout. II. Oxygen consumption andswimming efficiency. Journal of Experimental Biology 55:521–540.
207. Webb, P. W. 1978. Fast-start performance and body form in seven species of teleost fish.Journal of Experimental Biology 74:211–226.
208. Webb, P. W. 1981. The effect of the bottom on the fast start of flatfish Citharichthysstigmaeus. Fishery Bulletin 79:271–276.
209. Webb, P. W. 1983. Speed, acceleration and manoeuverability of two teleost fishes.Journal of Experimental Biology 102:115–122.
210. Webb, P. W. 1988. Simple physical principles and vertebrate aquatic locomotion.American Zoologist 28:709–725.
References
8-17
211. Webb, P. W. 1994. Exercise performance in fish. Advances in Veterinary Science andComparative Medicine 38B:1–49.
212. Webb, P. W., and J. R. Brett. 1973. Effects of sublethal concentrations of sodiumpentachlorophenate on growth rate, food conversion efficiency, and swimming performancein underyearling sockeye salmon (Oncorhynchus nerka). Journal of the Fisheries ResearchBoard of Canada 30:499–507.
213. Webb, P. W., C. L. Gerstner, and S. T. Minton. 1996. Station-holding by the mottledsculpin, Cottus bairdi (Teleostei: Cottidae) and other fishes. Copeia 1996:488–493.
214. Webb, P. H., D. H. Hardy, and V. L. Mehl. 1992. The effect of armored skin on theswimming of longnose gar, Lepisosteus osseus. Canadian Journal of Zoology 70:1173–1179.
215. Weihs, D. 1975. Some hydrodynamical aspects of fish schooling. Pages 703–718 in T. Y.T. Wu, C. J. Brokaw, and C. Brennen, editors. Swimming and flying in nature. Volume 2.Plenum Press, New York.
216. Whitney, R. R. 1969. Schooling of fishes relative to available light. Transactions of theAmerican Fisheries Society 98:497–504.
217. Williams, I. V., and J. R. Brett. 1987. Critical swimming speed of Fraser and ThompsonRiver pink salmon (Oncorhynchus gorbuscha). Canadian Journal of Fisheries and AquaticSciences 44:348–356.
218. Wilson, R. W., H. L. Bergman, and C. M. Wood. 1994. Metabolic costs andphysiological consequences of acclimation to aluminum in juvenile rainbow trout(Oncorhynchus mykiss). 2. Gill morphology, swimming performance, and aerobic scope.Canadian Journal of Fisheries and Aquatic Sciences 51:536–544.
219. Wilson, R. W., and C. M. Wood. 1992. Swimming performance, whole body ions, andgill Al accumulation during acclimation to sublethal aluminum in juvenile rainbow trout(Oncorhynchus mykiss). Fish Physiology and Biochemistry 10:149–159.
220. Winger, P. D., P. He, and S. J. Walsh. 2000. Factors affecting the swimming enduranceand catchability of Atlantic cod (Gadus morhua). Canadian Journal of Fisheries and AquaticSciences 57:1200–1207.
221. Wyllie, M. C., E. R. Holmstrom, and R. K. Wallace. 1976. Temperature preference,avoidance, shock, and swim speed studies with marine and estuarine organisms from NewJersey. Report for the period January–December 1975. Ichthyological Associates, Inc. Ithaca,New York, for Public Service Electric and Gas Company, Newark, New Jersey.
222. Ye, X., and D. J. Randall. 1991. The effect of water pH on swimming performance inrainbow trout (Salmo gairdneri, Richardson). Fish Physiology and Biochemistry 9:15–21.
References
8-18
223. Young, P. S., and J. J. Cech, Jr. 1993. Improved growth, swimming performance andmuscular development in exercise-conditioned young-of-the-year striped bass (Moronesaxatilis). Canadian Journal of Fisheries and Aquatic Sciences 50:703–707.
224. Young, P. S., and J. J. Cech, Jr. 1996. Environmental tolerances and requirements ofsplittail. Transactions of the American Fisheries Society 125:664–678.
A-1
A TABLE OF CRITICAL SWIMMING SPEEDS FOR FISH
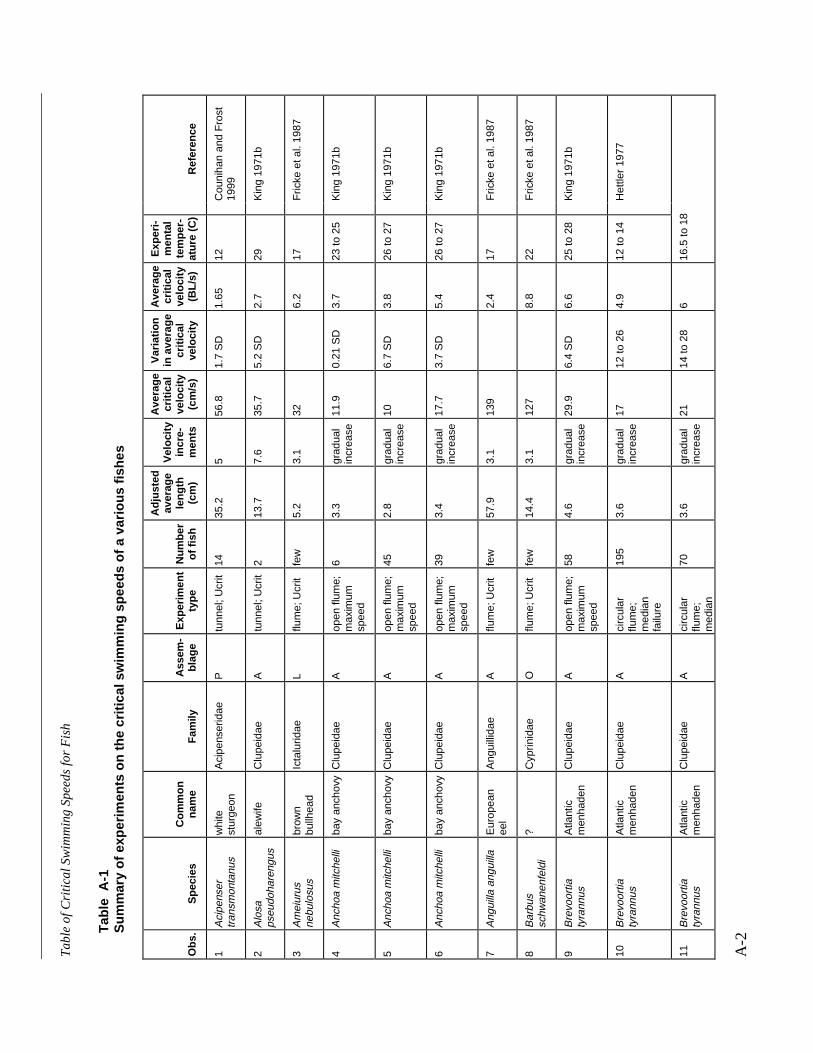
Ta
ble
of
Cri
tica
l Sw
imm
ing
Sp
ee
ds
for
Fis
h
A-2
Tab
le A
-1S
umm
ary
of e
xper
imen
ts o
n th
e cr
itica
l sw
imm
ing
spee
ds o
f a v
ario
us fi
shes
Obs
.S
peci
esC
omm
onna
me
Fam
ilyA
ssem
-bl
age
Exp
erim
ent
type
Num
ber
of fi
sh
Adj
uste
dav
erag
ele
ngth
(cm
)
Vel
ocity
incr
e-m
ents
Ave
rage
criti
cal
velo
city
(cm
/s)
Var
iatio
nin
ave
rage
criti
cal
velo
city
Ave
rage
criti
cal
velo
city
(BL/
s)
Exp
eri-
men
tal
tem
per-
atur
e (C
)R
efer
ence
1A
cipe
nser
tran
smon
tanu
sw
hite
stur
geon
Aci
pens
erid
aeP
tunn
el; U
crit
1435
.25
56.8
1.7
SD
1.65
12C
ouni
han
and
Fro
st19
99
2A
losa
pseu
doha
reng
usal
ewife
Clu
peid
aeA
tunn
el; U
crit
213
.77.
635
.75.
2 S
D2.
729
Kin
g 19
71b
3A
mei
urus
nebu
losu
sbr
own
bullh
ead
Icta
lurid
aeL
flum
e; U
crit
few
5.2
3.1
326.
217
Fric
ke e
t al.
1987
4A
ncho
a m
itche
lliba
y an
chov
yC
lupe
idae
Aop
en fl
ume;
max
imum
spee
d
63.
3gr
adua
lin
crea
se11
.90.
21 S
D3.
723
to 2
5K
ing
1971
b
5A
ncho
a m
itche
lliba
y an
chov
yC
lupe
idae
Aop
en fl
ume;
max
imum
spee
d
452.
8gr
adua
lin
crea
se10
6.7
SD
3.8
26 to
27
Kin
g 19
71b
6A
ncho
a m
itche
lliba
y an
chov
yC
lupe
idae
Aop
en fl
ume;
max
imum
spee
d
393.
4gr
adua
lin
crea
se17
.73.
7 S
D5.
426
to 2
7K
ing
1971
b
7A
ngui
lla a
ngui
llaE
urop
ean
eel
Ang
uilli
dae
Aflu
me;
Ucr
itfe
w57
.93.
113
92.
417
Fric
ke e
t al.
1987
8B
arbu
ssc
hwan
enfe
ldi
?C
yprin
idae
Oflu
me;
Ucr
itfe
w14
.43.
112
78.
822
Fric
ke e
t al.
1987
9B
revo
ortia
tyra
nnus
Atla
ntic
men
hade
nC
lupe
idae
Aop
en fl
ume;
max
imum
spee
d
584.
6gr
adua
lin
crea
se29
.96.
4 S
D6.
625
to 2
8K
ing
1971
b
10B
revo
ortia
tyra
nnus
Atla
ntic
men
hade
nC
lupe
idae
Aci
rcul
arflu
me;
med
ian
failu
re
195
3.6
grad
ual
incr
ease
1712
to 2
64.
912
to 1
4H
ettle
r 19
77
11B
revo
ortia
tyra
nnus
Atla
ntic
men
hade
nC
lupe
idae
Aci
rcul
arflu
me;
med
ian
703.
6gr
adua
lin
crea
se21
14 to
28
616
.5 to
18

Ta
ble
of
Cri
tica
l Sw
imm
ing
Sp
ee
ds
for
Fis
h
A-3
Obs
.S
peci
esC
omm
onna
me
Fam
ilyA
ssem
-bl
age
Exp
erim
ent
type
Num
ber
of fi
sh
Adj
uste
dav
erag
ele
ngth
(cm
)
Vel
ocity
incr
e-m
ents
Ave
rage
criti
cal
velo
city
(cm
/s)
Var
iatio
nin
ave
rage
criti
cal
velo
city
Ave
rage
criti
cal
velo
city
(BL/
s)
Exp
eri-
men
tal
tem
per-
atur
e (C
)R
efer
ence
failu
re
12B
revo
ortia
tyra
nnus
Atla
ntic
men
hade
nC
lupe
idae
Aci
rcul
arflu
me;
med
ian
failu
re
215
5.2
grad
ual
incr
ease
4732
.5 to
61.5
9.4
24 to
26.
5
13B
revo
ortia
tyra
nnus
Atla
ntic
men
hade
nC
lupe
idae
Aci
rcul
arflu
me;
med
ian
failu
re
155
5.2
grad
ual
incr
ease
5648
.5 to
66.5
11.2
30 to
35
Het
tler
1977
14C
aran
x hi
ppos
crev
alle
jack
Car
angi
dae
Aop
en fl
ume;
max
imum
spee
d
53.
9gr
adua
lin
crea
se41
.82.
7 S
D11
27K
ing
1971
b
15C
arne
giel
last
rigat
aM
arbe
led
hatc
hetfi
shG
aste
rope
leci
dae
Oflu
me;
Ucr
itfe
w3.
23.
122
6.9
22F
ricke
et a
l. 19
87
16C
atos
tom
usca
tost
omus
long
nose
suck
erC
atos
tom
idae
RE
tunn
el; U
crit
169
107
to 1
9Jo
nes
et a
l. 19
74
17C
atos
tom
usca
tost
omus
long
nose
suck
erC
atos
tom
idae
RE
tunn
el; U
crit
14.
010
235.
87
to 1
9Jo
nes
et a
l. 19
74
18C
atos
tom
usca
tost
omus
long
nose
suck
erC
atos
tom
idae
RE
tunn
el; U
crit
154
.610
911.
77
to 1
9Jo
nes
et a
l. 19
74
19C
atos
tom
usco
mm
erso
niw
hite
suc
ker
Cat
osto
mid
aeR
Etu
nnel
; Ucr
it20
1012
to 1
9Jo
nes
et a
l. 19
74
20C
atos
tom
usco
mm
erso
niw
hite
suc
ker
Cat
osto
mid
aeR
Etu
nnel
; Ucr
it17
.010
482.
812
to 1
9Jo
nes
et a
l. 19
74
21C
atos
tom
usco
mm
erso
niw
hite
suc
ker
Cat
osto
mid
aeR
Etu
nnel
; Ucr
it37
.010
732
12 to
19
Jone
s et
al.
1974
22C
atos
tom
usm
acro
chei
lus
larg
esca
lesu
cker
Cat
osto
mid
aeR
Etu
nnel
; Ucr
it6
40.9
532
3 S
E0.
815
Kol
ok e
t al.
1993
23C
atos
tom
usm
acro
chei
lus
larg
esca
lesu
cker
Cat
osto
mid
aeR
Etu
nnel
; Ucr
it6
40.9
550
.53.
5 S
E1.
2710
Kol
ok e
t al.
1993

Ta
ble
of
Cri
tica
l Sw
imm
ing
Sp
ee
ds
for
Fis
h
A-4
Obs
.S
peci
esC
omm
onna
me
Fam
ilyA
ssem
-bl
age
Exp
erim
ent
type
Num
ber
of fi
sh
Adj
uste
dav
erag
ele
ngth
(cm
)
Vel
ocity
incr
e-m
ents
Ave
rage
criti
cal
velo
city
(cm
/s)
Var
iatio
nin
ave
rage
criti
cal
velo
city
Ave
rage
criti
cal
velo
city
(BL/
s)
Exp
eri-
men
tal
tem
per-
atur
e (C
)R
efer
ence
24C
atos
tom
usm
acro
chei
lus
larg
esca
lesu
cker
Cat
osto
mid
aeR
Etu
nnel
; Ucr
it6
40.9
557
1.6
SE
1.44
16K
olok
et a
l. 19
93
25C
atos
tom
usoc
cide
ntal
isS
acra
men
tosu
cker
Cat
osto
mid
aeR
Wtu
nnel
; Ucr
it7
19.1
1047
0.05
SE
2.46
10M
yric
k an
d C
ech
2000
26C
atos
tom
usoc
cide
ntal
isS
acra
men
tosu
cker
Cat
osto
mid
aeR
Wtu
nnel
; Ucr
it8
20.0
1048
0.06
SE
2.4
15M
yric
k an
d C
ech
2000
27C
atos
tom
usoc
cide
ntal
isS
acra
men
tosu
cker
Cat
osto
mid
aeR
Wtu
nnel
; Ucr
it8
20.9
1051
0.05
SE
2.44
20M
yric
k an
d C
ech
2000
28C
linos
tom
usfu
ndul
oide
sro
sysi
deda
ceC
yprin
idae
RE
tunn
el; U
crit
106.
910
47.3
12.6
SD
7.5
10F
acey
and
Gro
ssm
an19
90
29C
linos
tom
usfu
ndul
oide
sro
sysi
deda
ceC
yprin
idae
RE
tunn
el; U
crit
107.
410
54.3
16.1
SD
8.1
15F
acey
and
Gro
ssm
an19
90
30C
linos
tom
usfu
ndul
oide
sro
sysi
deda
ceC
yprin
idae
RE
tunn
el; U
crit
106.
910
42.2
12.6
SD
6.7
10F
acey
and
Gro
ssm
an19
90
31C
linos
tom
usfu
ndul
oide
sro
sysi
deda
ceC
yprin
idae
RE
tunn
el; U
crit
107.
410
22.8
11.4
SD
3.4
5F
acey
and
Gro
ssm
an19
90
32C
lupe
a ha
reng
usha
reng
usA
tlant
iche
rrin
gC
lupe
idae
Ato
wed
cag
e;m
edia
nfa
ilure
3115
.23-
5cm
/s/m
in91
.46
12.2
Bra
wn
1960
33C
lupe
a ha
reng
usha
reng
usA
tlant
iche
rrin
gC
lupe
idae
Ato
wed
cag
e;m
edia
nfa
ilure
5018
.53-
5cm
/s/m
in12
1.9
6.6
12.1
Bra
wn
1960
34C
lupe
a ha
reng
usha
reng
usA
tlant
iche
rrin
gC
lupe
idae
Ato
wed
cag
e;m
edia
nfa
ilure
4318
.53-
5cm
/s/m
in94
.55.
112
.4B
raw
n 19
60
35C
lupe
a ha
reng
usha
reng
usA
tlant
iche
rrin
gC
lupe
idae
Ato
wed
cag
e;m
edia
nfa
ilure
3520
.73-
5cm
/s/m
in12
1.9
5.9
11.7
Bra
wn
1960
36C
lupe
a ha
reng
usha
reng
usA
tlant
iche
rrin
gC
lupe
idae
Ato
wed
cag
e;m
edia
n30
22.0
3-5
cm/s
/min
112.
85.
111
.6B
raw
n 19
60

Ta
ble
of
Cri
tica
l Sw
imm
ing
Sp
ee
ds
for
Fis
h
A-5
Obs
.S
peci
esC
omm
onna
me
Fam
ilyA
ssem
-bl
age
Exp
erim
ent
type
Num
ber
of fi
sh
Adj
uste
dav
erag
ele
ngth
(cm
)
Vel
ocity
incr
e-m
ents
Ave
rage
criti
cal
velo
city
(cm
/s)
Var
iatio
nin
ave
rage
criti
cal
velo
city
Ave
rage
criti
cal
velo
city
(BL/
s)
Exp
eri-
men
tal
tem
per-
atur
e (C
)R
efer
ence
failu
re
37C
lupe
a ha
reng
usha
reng
usA
tlant
iche
rrin
gC
lupe
idae
Ato
wed
cag
e;m
edia
nfa
ilure
4625
.83-
5cm
/s/m
in13
4.1
5.2
11.7
Bra
wn
1960
38C
lupe
a ha
reng
usha
reng
usA
tlant
iche
rrin
gC
lupe
idae
Ato
wed
cag
e;m
edia
nfa
ilure
2226
.73-
5cm
/s/m
in14
3.3
5.4
11.7
Bra
wn
1960
39C
lupe
a ha
reng
usha
reng
usA
tlant
iche
rrin
gC
lupe
idae
Aci
rc. t
ank,
50%
failu
re12
.036
.63.
1B
oyar
196
1
40C
lupe
a ha
reng
usha
reng
usA
tlant
iche
rrin
gC
lupe
idae
Aci
rc. t
ank,
50%
failu
re13
.042
.73.
3B
oyar
196
1
41C
lupe
a ha
reng
usha
reng
usA
tlant
iche
rrin
gC
lupe
idae
Aci
rc. t
ank,
50%
failu
re14
.051
.83.
7B
oyar
196
1
42C
lupe
a ha
reng
usha
reng
usA
tlant
iche
rrin
gC
lupe
idae
Aci
rc. t
ank,
50%
failu
re16
.061
3.8
Boy
ar 1
961
43C
lupe
a ha
reng
usha
reng
usA
tlant
iche
rrin
gC
lupe
idae
Aci
rc. t
ank,
50%
failu
re17
.070
.14.
1B
oyar
196
1
44C
oreg
onus
art
edii
cisc
oS
alm
onid
aeL
tunn
el; U
crit
813
.55
45.8
8.1
SD
3.4
12B
erna
tche
z an
dD
odso
n 19
85
45C
oreg
onus
autu
mna
lisA
rctic
cis
coS
alm
onid
aeL
tunn
el; U
crit
443
.410
801.
912
Jone
s et
al.
1974
46C
oreg
onus
clup
eafo
rmis
lake
whi
tefis
hS
alm
onid
aeL
tunn
el; U
crit
159
107
to 1
9Jo
nes
et a
l. 19
74
47C
oreg
onus
clup
eafo
rmis
lake
whi
tefis
hS
alm
onid
aeL
tunn
el; U
crit
16.
010
34.1
5.7
7 to
19
Jone
s et
al.
1974
48C
oreg
onus
clup
eafo
rmis
lake
whi
tefis
hS
alm
onid
aeL
tunn
el; U
crit
151
.010
72.1
1.4
7 to
19
Jone
s et
al.
1974
49C
oreg
onus
clup
eafo
rmis
lake
whi
tefis
hS
alm
onid
aeL
tunn
el; U
crit
834
.25
636.
0 S
D1.
85
Ber
natc
hez
and
Dod
son
1985
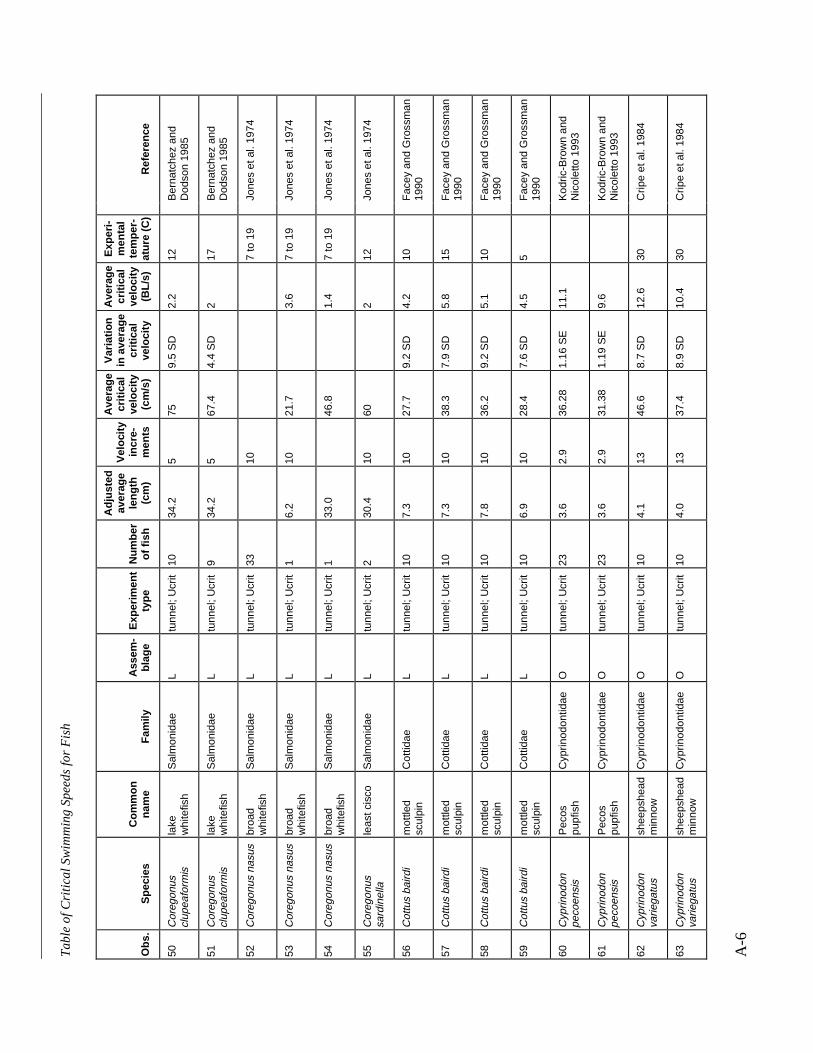
Ta
ble
of
Cri
tica
l Sw
imm
ing
Sp
ee
ds
for
Fis
h
A-6
Obs
.S
peci
esC
omm
onna
me
Fam
ilyA
ssem
-bl
age
Exp
erim
ent
type
Num
ber
of fi
sh
Adj
uste
dav
erag
ele
ngth
(cm
)
Vel
ocity
incr
e-m
ents
Ave
rage
criti
cal
velo
city
(cm
/s)
Var
iatio
nin
ave
rage
criti
cal
velo
city
Ave
rage
criti
cal
velo
city
(BL/
s)
Exp
eri-
men
tal
tem
per-
atur
e (C
)R
efer
ence
50C
oreg
onus
clup
eafo
rmis
lake
whi
tefis
hS
alm
onid
aeL
tunn
el; U
crit
1034
.25
759.
5 S
D2.
212
Ber
natc
hez
and
Dod
son
1985
51C
oreg
onus
clup
eafo
rmis
lake
whi
tefis
hS
alm
onid
aeL
tunn
el; U
crit
934
.25
67.4
4.4
SD
217
Ber
natc
hez
and
Dod
son
1985
52C
oreg
onus
nas
usbr
oad
whi
tefis
hS
alm
onid
aeL
tunn
el; U
crit
3310
7 to
19
Jone
s et
al.
1974
53C
oreg
onus
nas
usbr
oad
whi
tefis
hS
alm
onid
aeL
tunn
el; U
crit
16.
210
21.7
3.6
7 to
19
Jone
s et
al.
1974
54C
oreg
onus
nas
usbr
oad
whi
tefis
hS
alm
onid
aeL
tunn
el; U
crit
133
.046
.81.
47
to 1
9Jo
nes
et a
l. 19
74
55C
oreg
onus
sard
inel
lale
ast c
isco
Sal
mon
idae
Ltu
nnel
; Ucr
it2
30.4
1060
212
Jone
s et
al.
1974
56C
ottu
s ba
irdi
mot
tled
scul
pin
Cot
tidae
Ltu
nnel
; Ucr
it10
7.3
1027
.79.
2 S
D4.
210
Fac
ey a
nd G
ross
man
1990
57C
ottu
s ba
irdi
mot
tled
scul
pin
Cot
tidae
Ltu
nnel
; Ucr
it10
7.3
1038
.37.
9 S
D5.
815
Fac
ey a
nd G
ross
man
1990
58C
ottu
s ba
irdi
mot
tled
scul
pin
Cot
tidae
Ltu
nnel
; Ucr
it10
7.8
1036
.29.
2 S
D5.
110
Fac
ey a
nd G
ross
man
1990
59C
ottu
s ba
irdi
mot
tled
scul
pin
Cot
tidae
Ltu
nnel
; Ucr
it10
6.9
1028
.47.
6 S
D4.
55
Fac
ey a
nd G
ross
man
1990
60C
yprin
odon
peco
ensi
sP
ecos
pupf
ish
Cyp
rinod
ontid
aeO
tunn
el; U
crit
233.
62.
936
.28
1.16
SE
11.1
Kod
ric-B
row
n an
dN
icol
etto
199
3
61C
yprin
odon
peco
ensi
sP
ecos
pupf
ish
Cyp
rinod
ontid
aeO
tunn
el; U
crit
233.
62.
931
.38
1.19
SE
9.6
Kod
ric-B
row
n an
dN
icol
etto
199
3
62C
yprin
odon
varie
gatu
ssh
eeps
head
min
now
Cyp
rinod
ontid
aeO
tunn
el; U
crit
104.
113
46.6
8.7
SD
12.6
30C
ripe
et a
l. 19
84
63C
yprin
odon
varie
gatu
ssh
eeps
head
min
now
Cyp
rinod
ontid
aeO
tunn
el; U
crit
104.
013
37.4
8.9
SD
10.4
30C
ripe
et a
l. 19
84
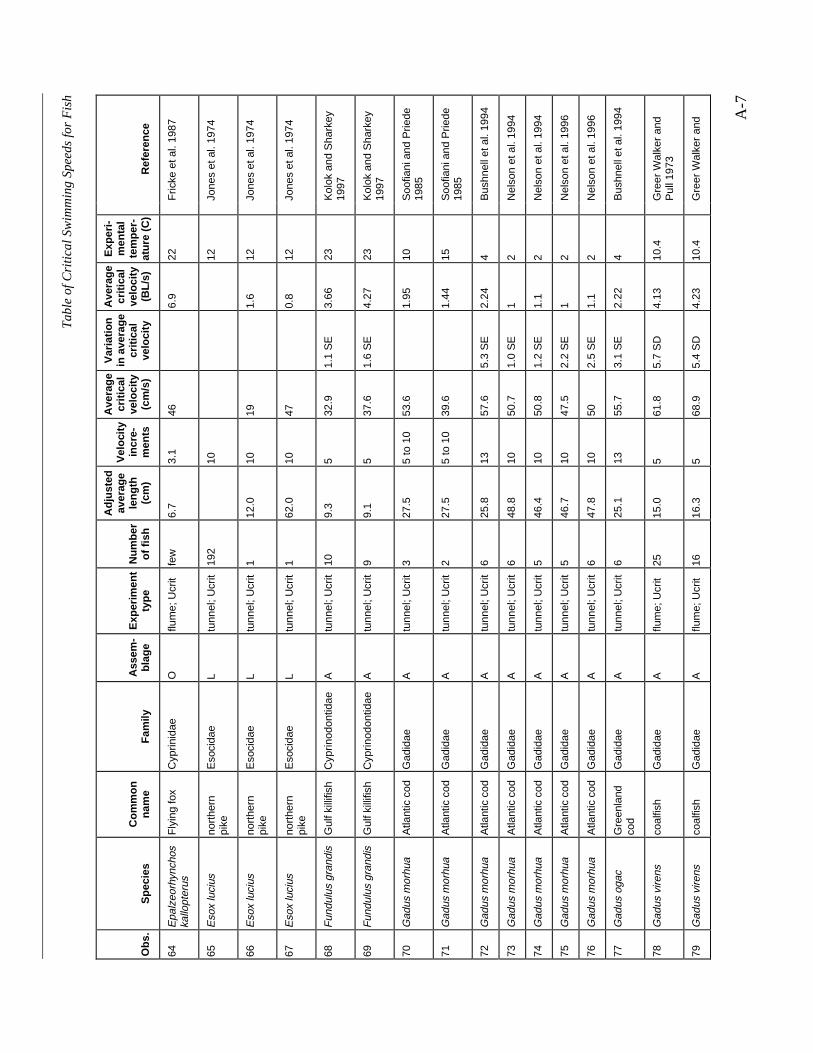
Ta
ble
of
Cri
tica
l Sw
imm
ing
Sp
ee
ds
for
Fis
h
A-7
Obs
.S
peci
esC
omm
onna
me
Fam
ilyA
ssem
-bl
age
Exp
erim
ent
type
Num
ber
of fi
sh
Adj
uste
dav
erag
ele
ngth
(cm
)
Vel
ocity
incr
e-m
ents
Ave
rage
criti
cal
velo
city
(cm
/s)
Var
iatio
nin
ave
rage
criti
cal
velo
city
Ave
rage
criti
cal
velo
city
(BL/
s)
Exp
eri-
men
tal
tem
per-
atur
e (C
)R
efer
ence
64E
palz
eorh
ynch
oska
llopt
erus
Fly
ing
fox
Cyp
rinid
aeO
flum
e; U
crit
few
6.7
3.1
466.
922
Fric
ke e
t al.
1987
65E
sox
luci
usno
rthe
rnpi
keE
soci
dae
Ltu
nnel
; Ucr
it19
210
12Jo
nes
et a
l. 19
74
66E
sox
luci
usno
rthe
rnpi
keE
soci
dae
Ltu
nnel
; Ucr
it1
12.0
1019
1.6
12Jo
nes
et a
l. 19
74
67E
sox
luci
usno
rthe
rnpi
keE
soci
dae
Ltu
nnel
; Ucr
it1
62.0
1047
0.8
12Jo
nes
et a
l. 19
74
68F
undu
lus
gran
dis
Gul
f kill
ifish
Cyp
rinod
ontid
aeA
tunn
el; U
crit
109.
35
32.9
1.1
SE
3.66
23K
olok
and
Sha
rkey
1997
69F
undu
lus
gran
dis
Gul
f kill
ifish
Cyp
rinod
ontid
aeA
tunn
el; U
crit
99.
15
37.6
1.6
SE
4.27
23K
olok
and
Sha
rkey
1997
70G
adus
mor
hua
Atla
ntic
cod
Gad
idae
Atu
nnel
; Ucr
it3
27.5
5 to
10
53.6
1.95
10S
oofia
ni a
nd P
riede
1985
71G
adus
mor
hua
Atla
ntic
cod
Gad
idae
Atu
nnel
; Ucr
it2
27.5
5 to
10
39.6
1.44
15S
oofia
ni a
nd P
riede
1985
72G
adus
mor
hua
Atla
ntic
cod
Gad
idae
Atu
nnel
; Ucr
it6
25.8
1357
.65.
3 S
E2.
244
Bus
hnel
l et a
l. 19
94
73G
adus
mor
hua
Atla
ntic
cod
Gad
idae
Atu
nnel
; Ucr
it6
48.8
1050
.71.
0 S
E1
2N
elso
n et
al.
1994
74G
adus
mor
hua
Atla
ntic
cod
Gad
idae
Atu
nnel
; Ucr
it5
46.4
1050
.81.
2 S
E1.
12
Nel
son
et a
l. 19
94
75G
adus
mor
hua
Atla
ntic
cod
Gad
idae
Atu
nnel
; Ucr
it5
46.7
1047
.52.
2 S
E1
2N
elso
n et
al.
1996
76G
adus
mor
hua
Atla
ntic
cod
Gad
idae
Atu
nnel
; Ucr
it6
47.8
1050
2.5
SE
1.1
2N
elso
n et
al.
1996
77G
adus
oga
cG
reen
land
cod
Gad
idae
Atu
nnel
; Ucr
it6
25.1
1355
.73.
1 S
E2.
224
Bus
hnel
l et a
l. 19
94
78G
adus
vire
nsco
alfis
hG
adid
aeA
flum
e; U
crit
2515
.05
61.8
5.7
SD
4.13
10.4
Gre
er W
alke
r an
dP
ull 1
973
79G
adus
vire
nsco
alfis
hG
adid
aeA
flum
e; U
crit
1616
.35
68.9
5.4
SD
4.23
10.4
Gre
er W
alke
r an
d
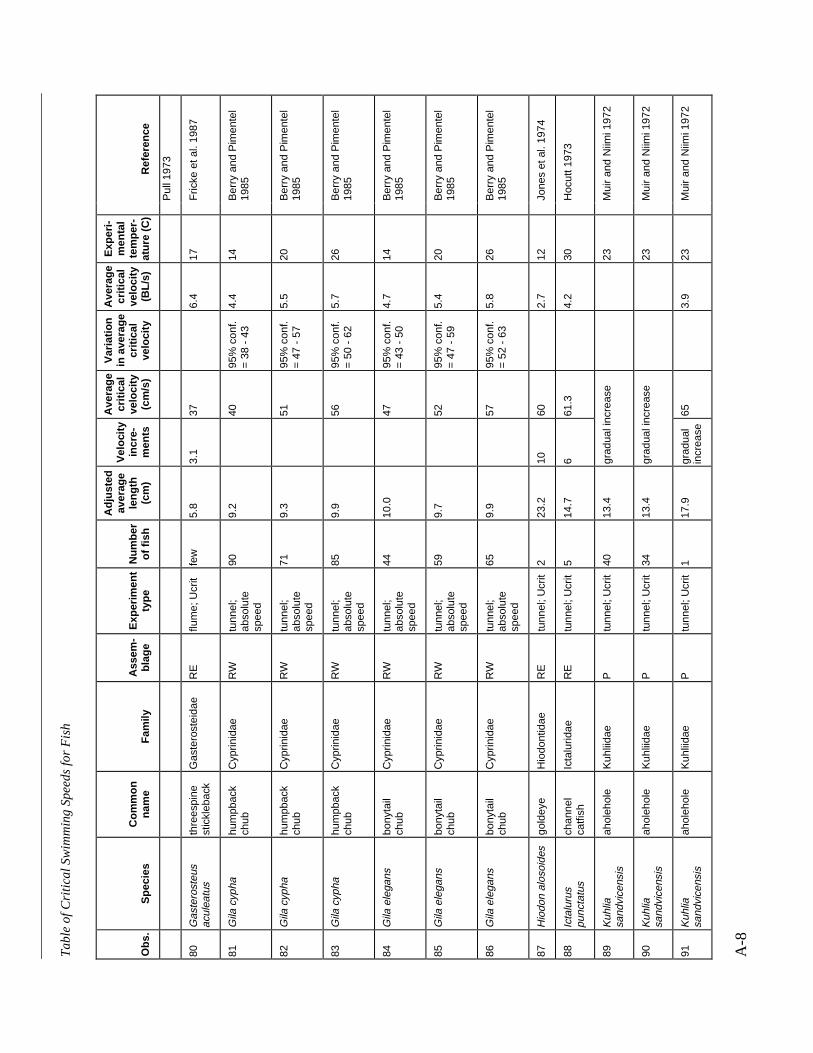
Ta
ble
of
Cri
tica
l Sw
imm
ing
Sp
ee
ds
for
Fis
h
A-8
Obs
.S
peci
esC
omm
onna
me
Fam
ilyA
ssem
-bl
age
Exp
erim
ent
type
Num
ber
of fi
sh
Adj
uste
dav
erag
ele
ngth
(cm
)
Vel
ocity
incr
e-m
ents
Ave
rage
criti
cal
velo
city
(cm
/s)
Var
iatio
nin
ave
rage
criti
cal
velo
city
Ave
rage
criti
cal
velo
city
(BL/
s)
Exp
eri-
men
tal
tem
per-
atur
e (C
)R
efer
ence
Pul
l 197
3
80G
aste
rost
eus
acul
eatu
sth
rees
pine
stic
kleb
ack
Gas
tero
stei
dae
RE
flum
e; U
crit
few
5.8
3.1
376.
417
Fric
ke e
t al.
1987
81G
ila c
ypha
hum
pbac
kch
ubC
yprin
idae
RW
tunn
el;
abso
lute
spee
d
909.
240
95%
con
f.=
38
- 43
4.4
14B
erry
and
Pim
ente
l19
85
82G
ila c
ypha
hum
pbac
kch
ubC
yprin
idae
RW
tunn
el;
abso
lute
spee
d
719.
351
95%
con
f.=
47
- 57
5.5
20B
erry
and
Pim
ente
l19
85
83G
ila c
ypha
hum
pbac
kch
ubC
yprin
idae
RW
tunn
el;
abso
lute
spee
d
859.
956
95%
con
f.=
50
- 62
5.7
26B
erry
and
Pim
ente
l19
85
84G
ila e
lega
nsbo
nyta
ilch
ubC
yprin
idae
RW
tunn
el;
abso
lute
spee
d
4410
.047
95%
con
f.=
43
- 50
4.7
14B
erry
and
Pim
ente
l19
85
85G
ila e
lega
nsbo
nyta
ilch
ubC
yprin
idae
RW
tunn
el;
abso
lute
spee
d
599.
752
95%
con
f.=
47
- 59
5.4
20B
erry
and
Pim
ente
l19
85
86G
ila e
lega
nsbo
nyta
ilch
ubC
yprin
idae
RW
tunn
el;
abso
lute
spee
d
659.
957
95%
con
f.=
52
- 63
5.8
26B
erry
and
Pim
ente
l19
85
87H
iodo
n al
osoi
des
gold
eye
Hio
dont
idae
RE
tunn
el; U
crit
223
.210
602.
712
Jone
s et
al.
1974
88Ic
talu
rus
punc
tatu
sch
anne
lca
tfish
Icta
lurid
aeR
Etu
nnel
; Ucr
it5
14.7
661
.34.
230
Hoc
utt 1
973
89K
uhlia
sand
vice
nsis
ahol
ehol
eK
uhlii
dae
Ptu
nnel
; Ucr
it40
13.4
grad
ual i
ncre
ase
23M
uir
and
Niim
i 197
2
90K
uhlia
sand
vice
nsis
ahol
ehol
eK
uhlii
dae
Ptu
nnel
; Ucr
it34
13.4
grad
ual i
ncre
ase
23M
uir
and
Niim
i 197
2
91K
uhlia
sand
vice
nsis
ahol
ehol
eK
uhlii
dae
Ptu
nnel
; Ucr
it1
17.9
grad
ual
incr
ease
653.
923
Mui
r an
d N
iimi 1
972
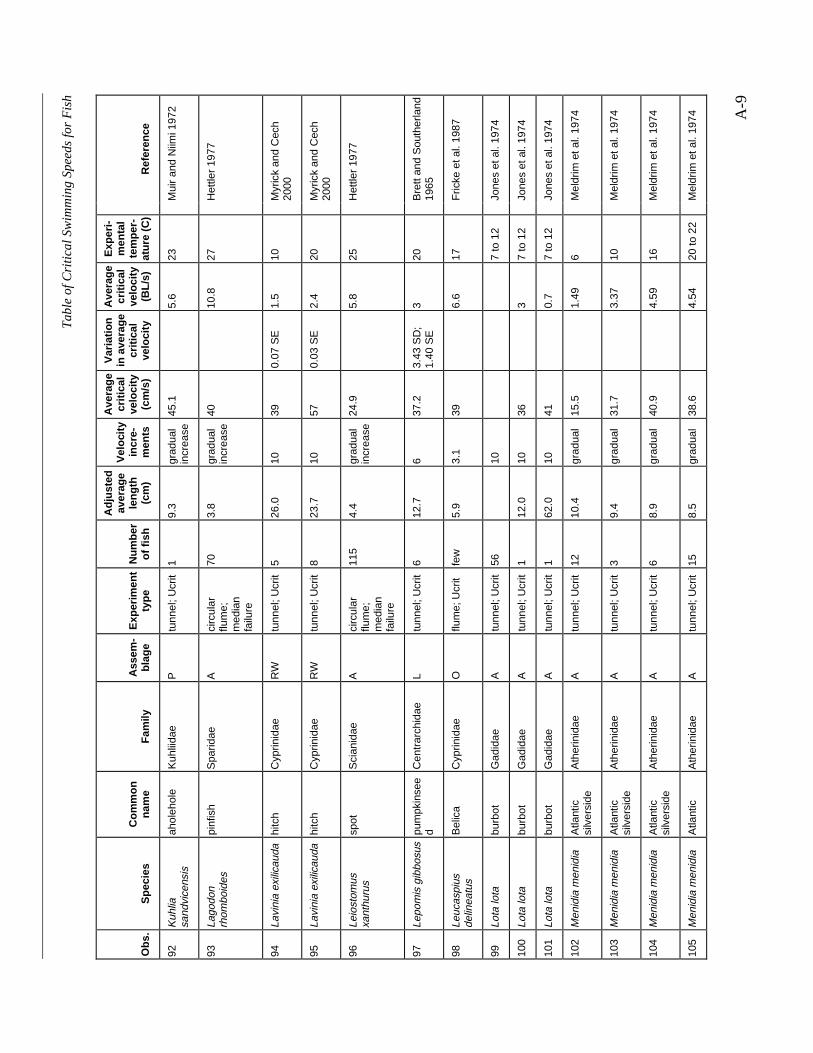
Ta
ble
of
Cri
tica
l Sw
imm
ing
Sp
ee
ds
for
Fis
h
A-9
Obs
.S
peci
esC
omm
onna
me
Fam
ilyA
ssem
-bl
age
Exp
erim
ent
type
Num
ber
of fi
sh
Adj
uste
dav
erag
ele
ngth
(cm
)
Vel
ocity
incr
e-m
ents
Ave
rage
criti
cal
velo
city
(cm
/s)
Var
iatio
nin
ave
rage
criti
cal
velo
city
Ave
rage
criti
cal
velo
city
(BL/
s)
Exp
eri-
men
tal
tem
per-
atur
e (C
)R
efer
ence
92K
uhlia
sand
vice
nsis
ahol
ehol
eK
uhlii
dae
Ptu
nnel
; Ucr
it1
9.3
grad
ual
incr
ease
45.1
5.6
23M
uir
and
Niim
i 197
2
93La
godo
nrh
ombo
ides
pinf
ish
Spa
ridae
Aci
rcul
arflu
me;
med
ian
failu
re
703.
8gr
adua
lin
crea
se40
10.8
27H
ettle
r 19
77
94La
vini
a ex
ilica
uda
hitc
hC
yprin
idae
RW
tunn
el; U
crit
526
.010
390.
07 S
E1.
510
Myr
ick
and
Cec
h20
00
95La
vini
a ex
ilica
uda
hitc
hC
yprin
idae
RW
tunn
el; U
crit
823
.710
570.
03 S
E2.
420
Myr
ick
and
Cec
h20
00
96Le
iost
omus
xant
huru
ssp
otS
cian
idae
Aci
rcul
arflu
me;
med
ian
failu
re
115
4.4
grad
ual
incr
ease
24.9
5.8
25H
ettle
r 19
77
97Le
pom
is g
ibbo
sus
pum
pkin
see
dC
entr
arch
idae
Ltu
nnel
; Ucr
it6
12.7
637
.23.
43 S
D;
1.40
SE
320
Bre
tt an
d S
outh
erla
nd19
65
98Le
ucas
pius
delin
eatu
sB
elic
aC
yprin
idae
Oflu
me;
Ucr
itfe
w5.
93.
139
6.6
17F
ricke
et a
l. 19
87
99Lo
ta lo
tabu
rbot
Gad
idae
Atu
nnel
; Ucr
it56
107
to 1
2Jo
nes
et a
l. 19
74
100
Lota
lota
burb
otG
adid
aeA
tunn
el; U
crit
112
.010
363
7 to
12
Jone
s et
al.
1974
101
Lota
lota
burb
otG
adid
aeA
tunn
el; U
crit
162
.010
410.
77
to 1
2Jo
nes
et a
l. 19
74
102
Men
idia
men
idia
Atla
ntic
silv
ersi
deA
ther
inid
aeA
tunn
el; U
crit
1210
.4gr
adua
l15
.51.
496
Mel
drim
et a
l. 19
74
103
Men
idia
men
idia
Atla
ntic
silv
ersi
deA
ther
inid
aeA
tunn
el; U
crit
39.
4gr
adua
l31
.73.
3710
Mel
drim
et a
l. 19
74
104
Men
idia
men
idia
Atla
ntic
silv
ersi
deA
ther
inid
aeA
tunn
el; U
crit
68.
9gr
adua
l40
.94.
5916
Mel
drim
et a
l. 19
74
105
Men
idia
men
idia
Atla
ntic
Ath
erin
idae
Atu
nnel
; Ucr
it15
8.5
grad
ual
38.6
4.54
20 to
22
Mel
drim
et a
l. 19
74
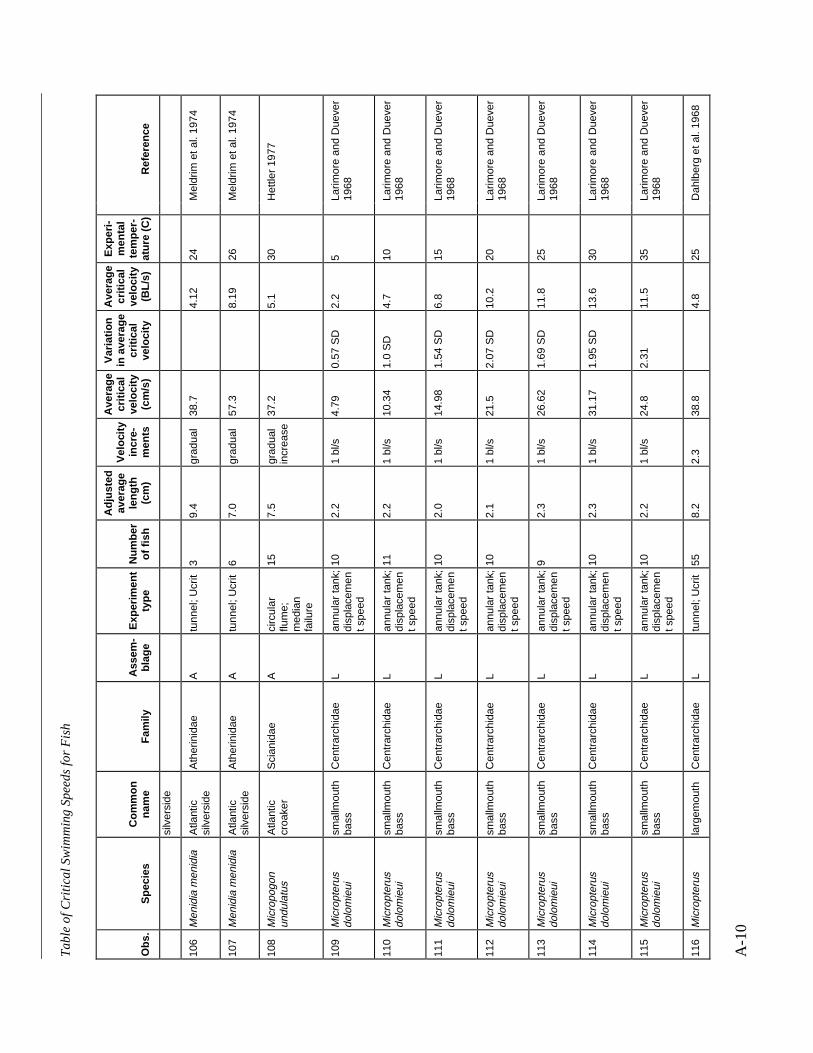
Ta
ble
of
Cri
tica
l Sw
imm
ing
Sp
ee
ds
for
Fis
h
A-1
0
Obs
.S
peci
esC
omm
onna
me
Fam
ilyA
ssem
-bl
age
Exp
erim
ent
type
Num
ber
of fi
sh
Adj
uste
dav
erag
ele
ngth
(cm
)
Vel
ocity
incr
e-m
ents
Ave
rage
criti
cal
velo
city
(cm
/s)
Var
iatio
nin
ave
rage
criti
cal
velo
city
Ave
rage
criti
cal
velo
city
(BL/
s)
Exp
eri-
men
tal
tem
per-
atur
e (C
)R
efer
ence
silv
ersi
de
106
Men
idia
men
idia
Atla
ntic
silv
ersi
deA
ther
inid
aeA
tunn
el; U
crit
39.
4gr
adua
l38
.74.
1224
Mel
drim
et a
l. 19
74
107
Men
idia
men
idia
Atla
ntic
silv
ersi
deA
ther
inid
aeA
tunn
el; U
crit
67.
0gr
adua
l57
.38.
1926
Mel
drim
et a
l. 19
74
108
Mic
ropo
gon
undu
latu
sA
tlant
iccr
oake
rS
cian
idae
Aci
rcul
arflu
me;
med
ian
failu
re
157.
5gr
adua
lin
crea
se37
.25.
130
Het
tler
1977
109
Mic
ropt
erus
dolo
mie
uism
allm
outh
bass
Cen
trar
chid
aeL
annu
lar
tank
;di
spla
cem
ent s
peed
102.
21
bl/s
4.79
0.57
SD
2.2
5La
rimor
e an
d D
ueve
r19
68
110
Mic
ropt
erus
dolo
mie
uism
allm
outh
bass
Cen
trar
chid
aeL
annu
lar
tank
;di
spla
cem
ent s
peed
112.
21
bl/s
10.3
41.
0 S
D4.
710
Larim
ore
and
Due
ver
1968
111
Mic
ropt
erus
dolo
mie
uism
allm
outh
bass
Cen
trar
chid
aeL
annu
lar
tank
;di
spla
cem
ent s
peed
102.
01
bl/s
14.9
81.
54 S
D6.
815
Larim
ore
and
Due
ver
1968
112
Mic
ropt
erus
dolo
mie
uism
allm
outh
bass
Cen
trar
chid
aeL
annu
lar
tank
;di
spla
cem
ent s
peed
102.
11
bl/s
21.5
2.07
SD
10.2
20La
rimor
e an
d D
ueve
r19
68
113
Mic
ropt
erus
dolo
mie
uism
allm
outh
bass
Cen
trar
chid
aeL
annu
lar
tank
;di
spla
cem
ent s
peed
92.
31
bl/s
26.6
21.
69 S
D11
.825
Larim
ore
and
Due
ver
1968
114
Mic
ropt
erus
dolo
mie
uism
allm
outh
bass
Cen
trar
chid
aeL
annu
lar
tank
;di
spla
cem
ent s
peed
102.
31
bl/s
31.1
71.
95 S
D13
.630
Larim
ore
and
Due
ver
1968
115
Mic
ropt
erus
dolo
mie
uism
allm
outh
bass
Cen
trar
chid
aeL
annu
lar
tank
;di
spla
cem
ent s
peed
102.
21
bl/s
24.8
2.31
11.5
35La
rimor
e an
d D
ueve
r19
68
116
Mic
ropt
erus
larg
emou
thC
entr
arch
idae
Ltu
nnel
; Ucr
it55
8.2
2.3
38.8
4.8
25D
ahlb
erg
et a
l. 19
68
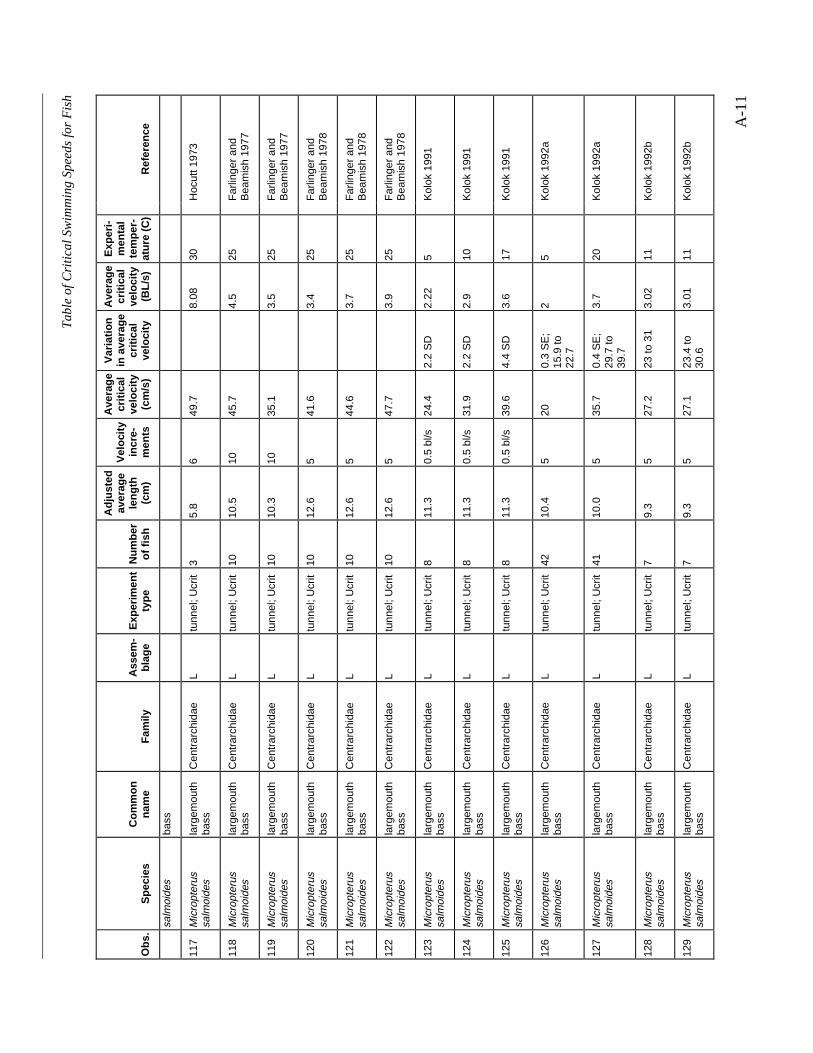
Ta
ble
of
Cri
tica
l Sw
imm
ing
Sp
ee
ds
for
Fis
h
A-1
1
Obs
.S
peci
esC
omm
onna
me
Fam
ilyA
ssem
-bl
age
Exp
erim
ent
type
Num
ber
of fi
sh
Adj
uste
dav
erag
ele
ngth
(cm
)
Vel
ocity
incr
e-m
ents
Ave
rage
criti
cal
velo
city
(cm
/s)
Var
iatio
nin
ave
rage
criti
cal
velo
city
Ave
rage
criti
cal
velo
city
(BL/
s)
Exp
eri-
men
tal
tem
per-
atur
e (C
)R
efer
ence
salm
oide
sba
ss
117
Mic
ropt
erus
salm
oide
sla
rgem
outh
bass
Cen
trar
chid
aeL
tunn
el; U
crit
35.
86
49.7
8.08
30H
ocut
t 197
3
118
Mic
ropt
erus
salm
oide
sla
rgem
outh
bass
Cen
trar
chid
aeL
tunn
el; U
crit
1010
.510
45.7
4.5
25F
arlin
ger
and
Bea
mis
h 19
77
119
Mic
ropt
erus
salm
oide
sla
rgem
outh
bass
Cen
trar
chid
aeL
tunn
el; U
crit
1010
.310
35.1
3.5
25F
arlin
ger
and
Bea
mis
h 19
77
120
Mic
ropt
erus
salm
oide
sla
rgem
outh
bass
Cen
trar
chid
aeL
tunn
el; U
crit
1012
.65
41.6
3.4
25F
arlin
ger
and
Bea
mis
h 19
78
121
Mic
ropt
erus
salm
oide
sla
rgem
outh
bass
Cen
trar
chid
aeL
tunn
el; U
crit
1012
.65
44.6
3.7
25F
arlin
ger
and
Bea
mis
h 19
78
122
Mic
ropt
erus
salm
oide
sla
rgem
outh
bass
Cen
trar
chid
aeL
tunn
el; U
crit
1012
.65
47.7
3.9
25F
arlin
ger
and
Bea
mis
h 19
78
123
Mic
ropt
erus
salm
oide
sla
rgem
outh
bass
Cen
trar
chid
aeL
tunn
el; U
crit
811
.30.
5 bl
/s24
.42.
2 S
D2.
225
Kol
ok 1
991
124
Mic
ropt
erus
salm
oide
sla
rgem
outh
bass
Cen
trar
chid
aeL
tunn
el; U
crit
811
.30.
5 bl
/s31
.92.
2 S
D2.
910
Kol
ok 1
991
125
Mic
ropt
erus
salm
oide
sla
rgem
outh
bass
Cen
trar
chid
aeL
tunn
el; U
crit
811
.30.
5 bl
/s39
.64.
4 S
D3.
617
Kol
ok 1
991
126
Mic
ropt
erus
salm
oide
sla
rgem
outh
bass
Cen
trar
chid
aeL
tunn
el; U
crit
4210
.45
200.
3 S
E;
15.9
to22
.7
25
Kol
ok 1
992a
127
Mic
ropt
erus
salm
oide
sla
rgem
outh
bass
Cen
trar
chid
aeL
tunn
el; U
crit
4110
.05
35.7
0.4
SE
;29
.7 to
39.7
3.7
20K
olok
199
2a
128
Mic
ropt
erus
salm
oide
sla
rgem
outh
bass
Cen
trar
chid
aeL
tunn
el; U
crit
79.
35
27.2
23 to
31
3.02
11K
olok
199
2b
129
Mic
ropt
erus
salm
oide
sla
rgem
outh
bass
Cen
trar
chid
aeL
tunn
el; U
crit
79.
35
27.1
23.4
to30
.63.
0111
Kol
ok 1
992b
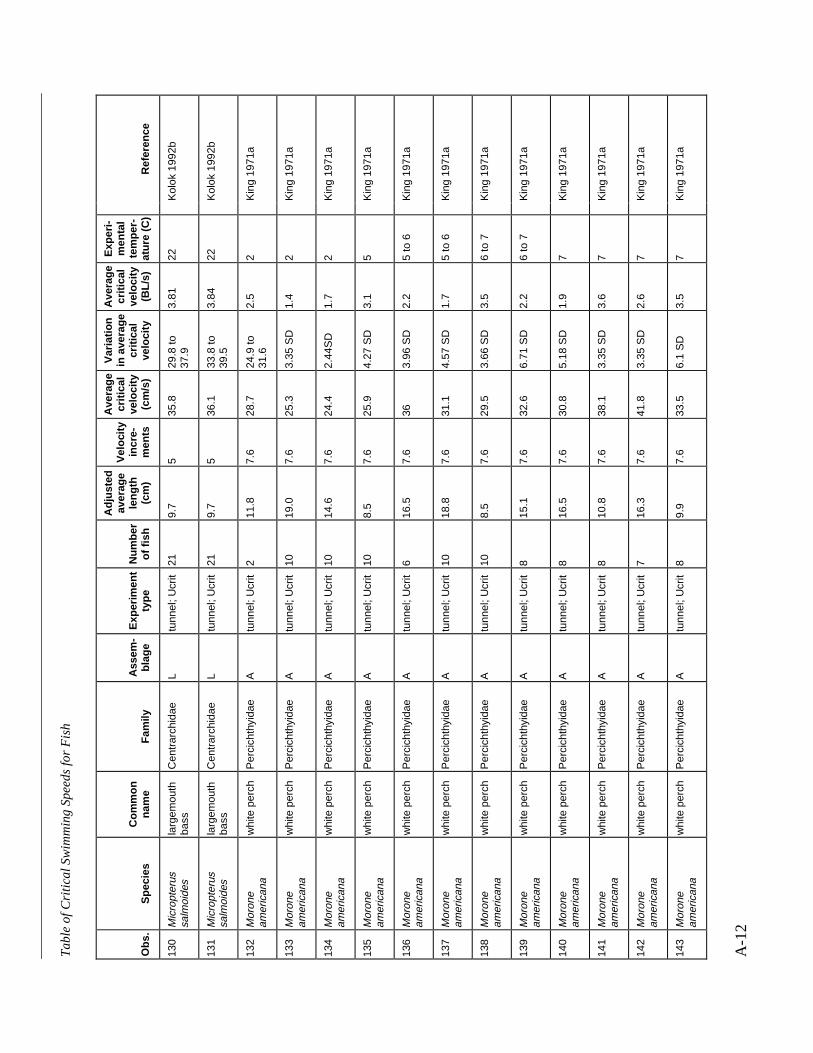
Ta
ble
of
Cri
tica
l Sw
imm
ing
Sp
ee
ds
for
Fis
h
A-1
2
Obs
.S
peci
esC
omm
onna
me
Fam
ilyA
ssem
-bl
age
Exp
erim
ent
type
Num
ber
of fi
sh
Adj
uste
dav
erag
ele
ngth
(cm
)
Vel
ocity
incr
e-m
ents
Ave
rage
criti
cal
velo
city
(cm
/s)
Var
iatio
nin
ave
rage
criti
cal
velo
city
Ave
rage
criti
cal
velo
city
(BL/
s)
Exp
eri-
men
tal
tem
per-
atur
e (C
)R
efer
ence
130
Mic
ropt
erus
salm
oide
sla
rgem
outh
bass
Cen
trar
chid
aeL
tunn
el; U
crit
219.
75
35.8
29.8
to37
.93.
8122
Kol
ok 1
992b
131
Mic
ropt
erus
salm
oide
sla
rgem
outh
bass
Cen
trar
chid
aeL
tunn
el; U
crit
219.
75
36.1
33.8
to39
.53.
8422
Kol
ok 1
992b
132
Mor
one
amer
ican
aw
hite
per
chP
erci
chth
yida
eA
tunn
el; U
crit
211
.87.
628
.724
.9 to
31.6
2.5
2K
ing
1971
a
133
Mor
one
amer
ican
aw
hite
per
chP
erci
chth
yida
eA
tunn
el; U
crit
1019
.07.
625
.33.
35 S
D1.
42
Kin
g 19
71a
134
Mor
one
amer
ican
aw
hite
per
chP
erci
chth
yida
eA
tunn
el; U
crit
1014
.67.
624
.42.
44S
D1.
72
Kin
g 19
71a
135
Mor
one
amer
ican
aw
hite
per
chP
erci
chth
yida
eA
tunn
el; U
crit
108.
57.
625
.94.
27 S
D3.
15
Kin
g 19
71a
136
Mor
one
amer
ican
aw
hite
per
chP
erci
chth
yida
eA
tunn
el; U
crit
616
.57.
636
3.96
SD
2.2
5 to
6K
ing
1971
a
137
Mor
one
amer
ican
aw
hite
per
chP
erci
chth
yida
eA
tunn
el; U
crit
1018
.87.
631
.14.
57 S
D1.
75
to 6
Kin
g 19
71a
138
Mor
one
amer
ican
aw
hite
per
chP
erci
chth
yida
eA
tunn
el; U
crit
108.
57.
629
.53.
66 S
D3.
56
to 7
Kin
g 19
71a
139
Mor
one
amer
ican
aw
hite
per
chP
erci
chth
yida
eA
tunn
el; U
crit
815
.17.
632
.66.
71 S
D2.
26
to 7
Kin
g 19
71a
140
Mor
one
amer
ican
aw
hite
per
chP
erci
chth
yida
eA
tunn
el; U
crit
816
.57.
630
.85.
18 S
D1.
97
Kin
g 19
71a
141
Mor
one
amer
ican
aw
hite
per
chP
erci
chth
yida
eA
tunn
el; U
crit
810
.87.
638
.13.
35 S
D3.
67
Kin
g 19
71a
142
Mor
one
amer
ican
aw
hite
per
chP
erci
chth
yida
eA
tunn
el; U
crit
716
.37.
641
.83.
35 S
D2.
67
Kin
g 19
71a
143
Mor
one
amer
ican
aw
hite
per
chP
erci
chth
yida
eA
tunn
el; U
crit
89.
97.
633
.56.
1 S
D3.
57
Kin
g 19
71a
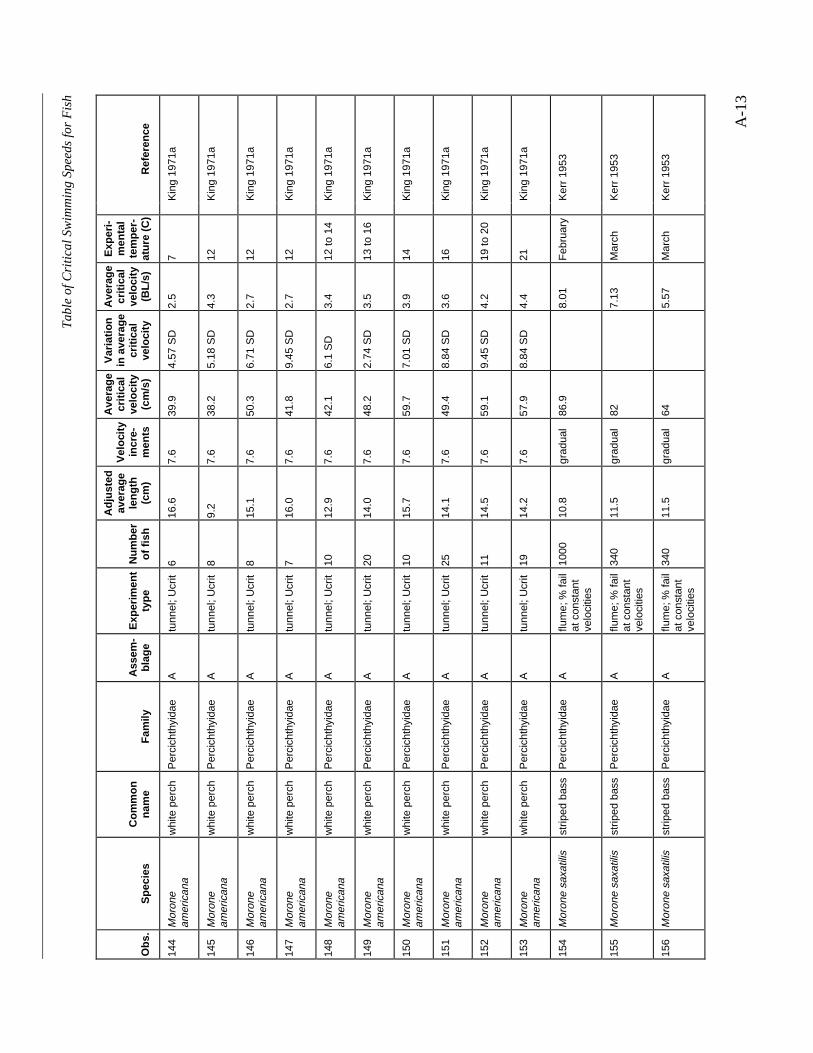
Ta
ble
of
Cri
tica
l Sw
imm
ing
Sp
ee
ds
for
Fis
h
A-1
3
Obs
.S
peci
esC
omm
onna
me
Fam
ilyA
ssem
-bl
age
Exp
erim
ent
type
Num
ber
of fi
sh
Adj
uste
dav
erag
ele
ngth
(cm
)
Vel
ocity
incr
e-m
ents
Ave
rage
criti
cal
velo
city
(cm
/s)
Var
iatio
nin
ave
rage
criti
cal
velo
city
Ave
rage
criti
cal
velo
city
(BL/
s)
Exp
eri-
men
tal
tem
per-
atur
e (C
)R
efer
ence
144
Mor
one
amer
ican
aw
hite
per
chP
erci
chth
yida
eA
tunn
el; U
crit
616
.67.
639
.94.
57 S
D2.
57
Kin
g 19
71a
145
Mor
one
amer
ican
aw
hite
per
chP
erci
chth
yida
eA
tunn
el; U
crit
89.
27.
638
.25.
18 S
D4.
312
Kin
g 19
71a
146
Mor
one
amer
ican
aw
hite
per
chP
erci
chth
yida
eA
tunn
el; U
crit
815
.17.
650
.36.
71 S
D2.
712
Kin
g 19
71a
147
Mor
one
amer
ican
aw
hite
per
chP
erci
chth
yida
eA
tunn
el; U
crit
716
.07.
641
.89.
45 S
D2.
712
Kin
g 19
71a
148
Mor
one
amer
ican
aw
hite
per
chP
erci
chth
yida
eA
tunn
el; U
crit
1012
.97.
642
.16.
1 S
D3.
412
to 1
4K
ing
1971
a
149
Mor
one
amer
ican
aw
hite
per
chP
erci
chth
yida
eA
tunn
el; U
crit
2014
.07.
648
.22.
74 S
D3.
513
to 1
6K
ing
1971
a
150
Mor
one
amer
ican
aw
hite
per
chP
erci
chth
yida
eA
tunn
el; U
crit
1015
.77.
659
.77.
01 S
D3.
914
Kin
g 19
71a
151
Mor
one
amer
ican
aw
hite
per
chP
erci
chth
yida
eA
tunn
el; U
crit
2514
.17.
649
.48.
84 S
D3.
616
Kin
g 19
71a
152
Mor
one
amer
ican
aw
hite
per
chP
erci
chth
yida
eA
tunn
el; U
crit
1114
.57.
659
.19.
45 S
D4.
219
to 2
0K
ing
1971
a
153
Mor
one
amer
ican
aw
hite
per
chP
erci
chth
yida
eA
tunn
el; U
crit
1914
.27.
657
.98.
84 S
D4.
421
Kin
g 19
71a
154
Mor
one
saxa
tilis
strip
ed b
ass
Per
cich
thyi
dae
Aflu
me;
% fa
ilat
con
stan
tve
loci
ties
1000
10.8
grad
ual
86.9
8.01
Feb
ruar
yK
err
1953
155
Mor
one
saxa
tilis
strip
ed b
ass
Per
cich
thyi
dae
Aflu
me;
% fa
ilat
con
stan
tve
loci
ties
340
11.5
grad
ual
827.
13M
arch
Ker
r 19
53
156
Mor
one
saxa
tilis
strip
ed b
ass
Per
cich
thyi
dae
Aflu
me;
% fa
ilat
con
stan
tve
loci
ties
340
11.5
grad
ual
645.
57M
arch
Ker
r 19
53

Ta
ble
of
Cri
tica
l Sw
imm
ing
Sp
ee
ds
for
Fis
h
A-1
4
Obs
.S
peci
esC
omm
onna
me
Fam
ilyA
ssem
-bl
age
Exp
erim
ent
type
Num
ber
of fi
sh
Adj
uste
dav
erag
ele
ngth
(cm
)
Vel
ocity
incr
e-m
ents
Ave
rage
criti
cal
velo
city
(cm
/s)
Var
iatio
nin
ave
rage
criti
cal
velo
city
Ave
rage
criti
cal
velo
city
(BL/
s)
Exp
eri-
men
tal
tem
per-
atur
e (C
)R
efer
ence
157
Mor
one
saxa
tilis
strip
ed b
ass
Per
cich
thyi
dae
Aflu
me;
% fa
ilat
con
stan
tve
loci
ties
902.
5gr
adua
l35
.427
.4 to
42.1
13.9
Aug
ust
Ker
r 19
53
158
Mor
one
saxa
tilis
strip
ed b
ass
Per
cich
thyi
dae
Aflu
me;
% fa
ilat
con
stan
tve
loci
ties
555.
1gr
adua
l76
28 to
90
14.9
Oct
ober
Ker
r 19
53
159
Mor
one
saxa
tilis
strip
ed b
ass
Per
cich
thyi
dae
Atu
nnel
; Ucr
it12
10.3
grad
ual
incr
ease
48.8
27.4
to 6
14.
817
.2B
ibko
et a
l. 19
74
160
Mor
one
saxa
tilis
strip
ed b
ass
Per
cich
thyi
dae
Atu
nnel
; Ucr
it12
19.6
grad
ual
incr
ease
6451
.8 to
76.2
3.3
17.2
Bib
ko e
t al.
1974
161
Mor
one
saxa
tilis
strip
ed b
ass
Per
cich
thyi
dae
Atu
nnel
; Ucr
it5
13.5
grad
ual
32.3
30.5
to38
.12.
3914
to 1
5M
eldr
im e
t al.
1974
162
Mor
one
saxa
tilis
strip
ed b
ass
Per
cich
thyi
dae
Atu
nnel
; Ucr
it6
686
2.5
SE
3.28
15F
read
man
197
9
163
Mor
one
saxa
tilis
strip
ed b
ass
Per
cich
thyi
dae
Atu
nnel
; Ucr
it6
676
2.9
SE
2.9
15F
read
man
197
9
164
Mug
il ce
phal
usst
riped
mul
let
Mug
ilida
eA
circ
ular
flum
e;m
edia
nfa
ilure
135
3.2
grad
ual
incr
ease
2515
.5 to
30
815
to 1
7.5
165
Mug
il ce
phal
usst
riped
mul
let
Mug
ilida
eA
circ
ular
flum
e;m
edia
nfa
ilure
603.
2gr
adua
lin
crea
se36
27.9
to38
.411
.521
.5 to
24.
8
166
Myl
opha
rodo
nco
noce
phal
usha
rdhe
adC
yprin
idae
RW
tunn
el; U
crit
1028
.510
473
SE
1.65
10M
yric
k an
d C
ech
2000
167
Myl
opha
rodo
nco
noce
phal
usha
rdhe
adC
yprin
idae
RW
tunn
el; U
crit
724
.410
572
SE
2.33
15M
yric
k an
d C
ech
2000
168
Myl
opha
rodo
nco
noce
phal
usha
rdhe
adC
yprin
idae
RW
tunn
el; U
crit
1222
.510
514
SE
2.27
20M
yric
k an
d C
ech
2000
169
Noe
mac
heilu
sba
rbat
ulus
Sto
ne lo
ach
Bal
itorid
aeO
flum
e; U
crit
few
7.5
3.1
618.
117
Fric
ke e
t al.
1987
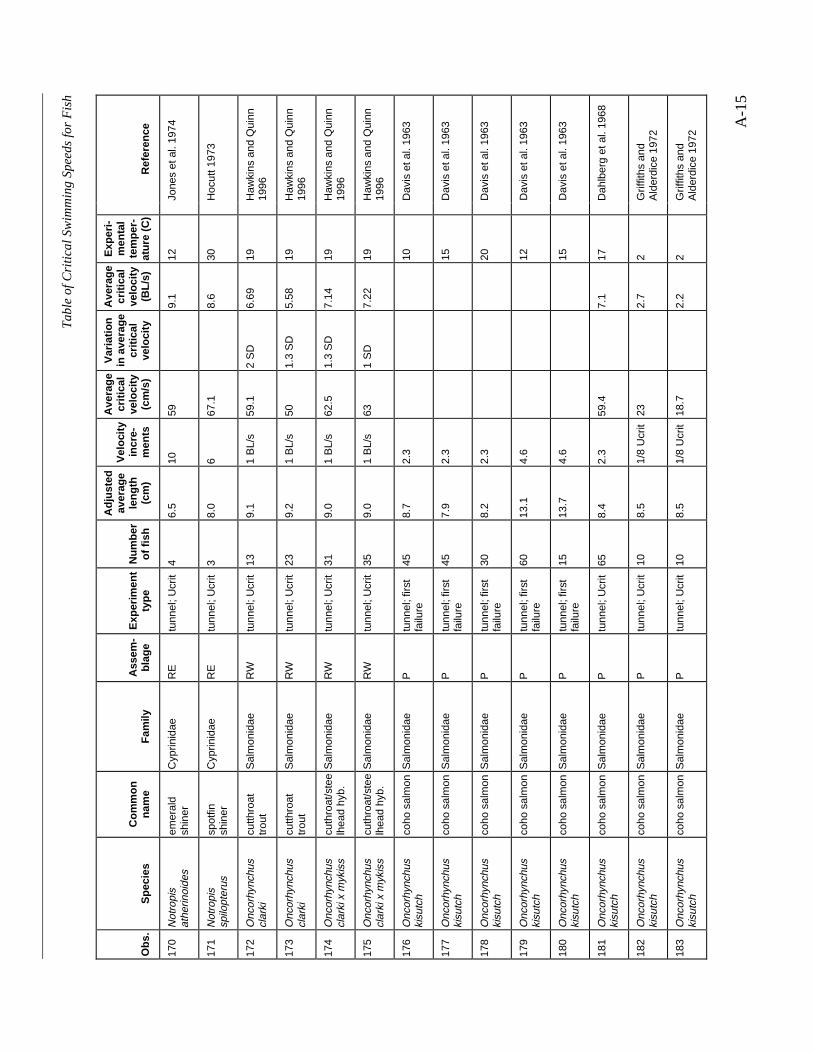
Ta
ble
of
Cri
tica
l Sw
imm
ing
Sp
ee
ds
for
Fis
h
A-1
5
Obs
.S
peci
esC
omm
onna
me
Fam
ilyA
ssem
-bl
age
Exp
erim
ent
type
Num
ber
of fi
sh
Adj
uste
dav
erag
ele
ngth
(cm
)
Vel
ocity
incr
e-m
ents
Ave
rage
criti
cal
velo
city
(cm
/s)
Var
iatio
nin
ave
rage
criti
cal
velo
city
Ave
rage
criti
cal
velo
city
(BL/
s)
Exp
eri-
men
tal
tem
per-
atur
e (C
)R
efer
ence
170
Not
ropi
sat
herin
oide
sem
eral
dsh
iner
Cyp
rinid
aeR
Etu
nnel
; Ucr
it4
6.5
1059
9.1
12Jo
nes
et a
l. 19
74
171
Not
ropi
ssp
ilopt
erus
spot
finsh
iner
Cyp
rinid
aeR
Etu
nnel
; Ucr
it3
8.0
667
.18.
630
Hoc
utt 1
973
172
Onc
orhy
nchu
scl
arki
cutth
roat
trou
tS
alm
onid
aeR
Wtu
nnel
; Ucr
it13
9.1
1 B
L/s
59.1
2 S
D6.
6919
Haw
kins
and
Qui
nn19
96
173
Onc
orhy
nchu
scl
arki
cutth
roat
trou
tS
alm
onid
aeR
Wtu
nnel
; Ucr
it23
9.2
1 B
L/s
501.
3 S
D5.
5819
Haw
kins
and
Qui
nn19
96
174
Onc
orhy
nchu
scl
arki
x m
ykis
scu
thro
at/s
tee
lhea
d hy
b.S
alm
onid
aeR
Wtu
nnel
; Ucr
it31
9.0
1 B
L/s
62.5
1.3
SD
7.14
19H
awki
ns a
nd Q
uinn
1996
175
Onc
orhy
nchu
scl
arki
x m
ykis
scu
thro
at/s
tee
lhea
d hy
b.S
alm
onid
aeR
Wtu
nnel
; Ucr
it35
9.0
1 B
L/s
631
SD
7.22
19H
awki
ns a
nd Q
uinn
1996
176
Onc
orhy
nchu
ski
sutc
hco
ho s
alm
onS
alm
onid
aeP
tunn
el; f
irst
failu
re45
8.7
2.3
10D
avis
et a
l. 19
63
177
Onc
orhy
nchu
ski
sutc
hco
ho s
alm
onS
alm
onid
aeP
tunn
el; f
irst
failu
re45
7.9
2.3
15D
avis
et a
l. 19
63
178
Onc
orhy
nchu
ski
sutc
hco
ho s
alm
onS
alm
onid
aeP
tunn
el; f
irst
failu
re30
8.2
2.3
20D
avis
et a
l. 19
63
179
Onc
orhy
nchu
ski
sutc
hco
ho s
alm
onS
alm
onid
aeP
tunn
el; f
irst
failu
re60
13.1
4.6
12D
avis
et a
l. 19
63
180
Onc
orhy
nchu
ski
sutc
hco
ho s
alm
onS
alm
onid
aeP
tunn
el; f
irst
failu
re15
13.7
4.6
15D
avis
et a
l. 19
63
181
Onc
orhy
nchu
ski
sutc
hco
ho s
alm
onS
alm
onid
aeP
tunn
el; U
crit
658.
42.
359
.47.
117
Dah
lber
g et
al.
1968
182
Onc
orhy
nchu
ski
sutc
hco
ho s
alm
onS
alm
onid
aeP
tunn
el; U
crit
108.
51/
8 U
crit
232.
72
Grif
fiths
and
Ald
erdi
ce 1
972
183
Onc
orhy
nchu
ski
sutc
hco
ho s
alm
onS
alm
onid
aeP
tunn
el; U
crit
108.
51/
8 U
crit
18.7
2.2
2G
riffit
hs a
ndA
lder
dice
197
2

Ta
ble
of
Cri
tica
l Sw
imm
ing
Sp
ee
ds
for
Fis
h
A-1
6
Obs
.S
peci
esC
omm
onna
me
Fam
ilyA
ssem
-bl
age
Exp
erim
ent
type
Num
ber
of fi
sh
Adj
uste
dav
erag
ele
ngth
(cm
)
Vel
ocity
incr
e-m
ents
Ave
rage
criti
cal
velo
city
(cm
/s)
Var
iatio
nin
ave
rage
criti
cal
velo
city
Ave
rage
criti
cal
velo
city
(BL/
s)
Exp
eri-
men
tal
tem
per-
atur
e (C
)R
efer
ence
184
Onc
orhy
nchu
ski
sutc
hco
ho s
alm
onS
alm
onid
aeP
tunn
el; U
crit
108.
51/
8 U
crit
31.5
3.7
5G
riffit
hs a
ndA
lder
dice
197
2
185
Onc
orhy
nchu
ski
sutc
hco
ho s
alm
onS
alm
onid
aeP
tunn
el; U
crit
108.
51/
8 U
crit
29.8
3.5
5G
riffit
hs a
ndA
lder
dice
197
2
186
Onc
orhy
nchu
ski
sutc
hco
ho s
alm
onS
alm
onid
aeP
tunn
el; U
crit
108.
51/
8 U
crit
34.9
4.1
8G
riffit
hs a
ndA
lder
dice
197
2
187
Onc
orhy
nchu
ski
sutc
hco
ho s
alm
onS
alm
onid
aeP
tunn
el; U
crit
108.
51/
8 U
crit
38.3
4.5
8G
riffit
hs a
ndA
lder
dice
197
2
188
Onc
orhy
nchu
ski
sutc
hco
ho s
alm
onS
alm
onid
aeP
tunn
el; U
crit
108.
51/
8 U
crit
40.8
4.8
11G
riffit
hs a
ndA
lder
dice
197
2
189
Onc
orhy
nchu
ski
sutc
hco
ho s
alm
onS
alm
onid
aeP
tunn
el; U
crit
108.
51/
8 U
crit
38.3
4.5
11G
riffit
hs a
ndA
lder
dice
197
2
190
Onc
orhy
nchu
ski
sutc
hco
ho s
alm
onS
alm
onid
aeP
tunn
el; U
crit
108.
51/
8 U
crit
44.2
5.2
14G
riffit
hs a
ndA
lder
dice
197
2
191
Onc
orhy
nchu
ski
sutc
hco
ho s
alm
onS
alm
onid
aeP
tunn
el; U
crit
108.
51/
8 U
crit
45.1
5.3
14G
riffit
hs a
ndA
lder
dice
197
2
192
Onc
orhy
nchu
ski
sutc
hco
ho s
alm
onS
alm
onid
aeP
tunn
el; U
crit
108.
51/
8 U
crit
44.2
5.2
17G
riffit
hs a
ndA
lder
dice
197
2
193
Onc
orhy
nchu
ski
sutc
hco
ho s
alm
onS
alm
onid
aeP
tunn
el; U
crit
108.
51/
8 U
crit
43.4
5.1
17G
riffit
hs a
ndA
lder
dice
197
2
194
Onc
orhy
nchu
ski
sutc
hco
ho s
alm
onS
alm
onid
aeP
tunn
el; U
crit
108.
51/
8 U
crit
54.4
6.4
20G
riffit
hs a
ndA
lder
dice
197
2
195
Onc
orhy
nchu
ski
sutc
hco
ho s
alm
onS
alm
onid
aeP
tunn
el; U
crit
108.
51/
8 U
crit
48.5
5.7
20G
riffit
hs a
ndA
lder
dice
197
2
196
Onc
orhy
nchu
ski
sutc
hco
ho s
alm
onS
alm
onid
aeP
tunn
el; U
crit
108.
51/
8 U
crit
465.
423
Grif
fiths
and
Ald
erdi
ce 1
972
197
Onc
orhy
nchu
ski
sutc
hco
ho s
alm
onS
alm
onid
aeP
tunn
el; U
crit
108.
51/
8 U
crit
455.
323
Grif
fiths
and
Ald
erdi
ce 1
972
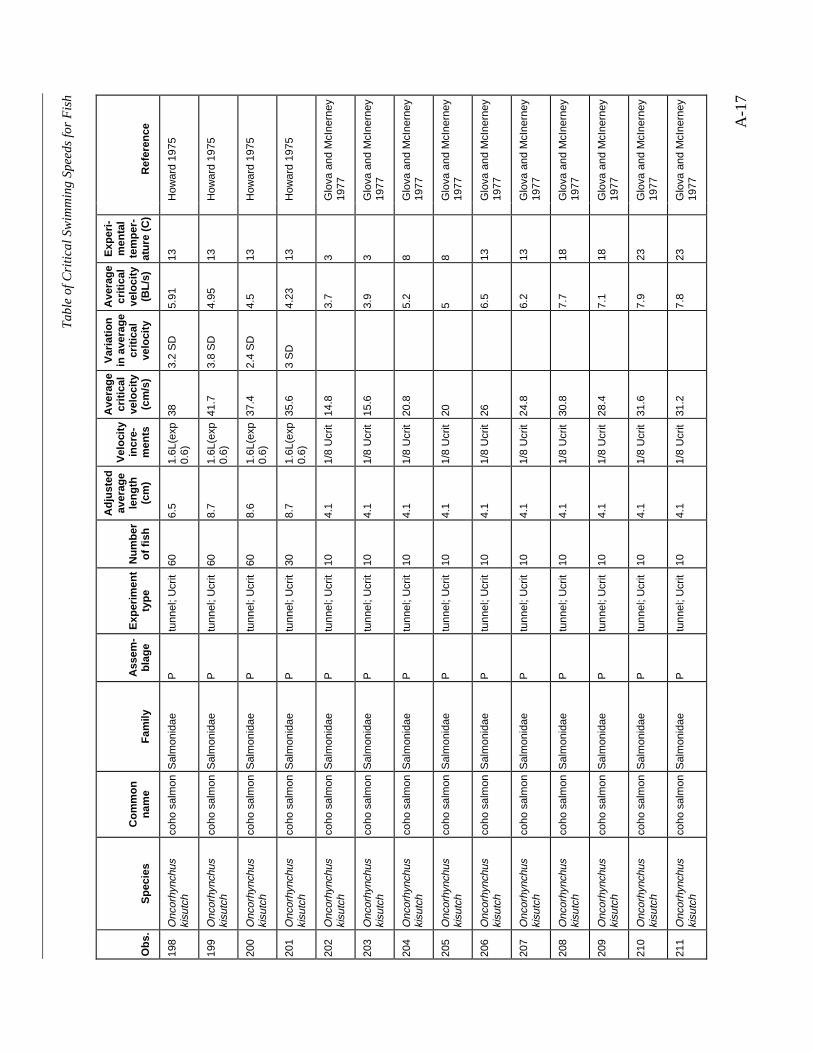
Ta
ble
of
Cri
tica
l Sw
imm
ing
Sp
ee
ds
for
Fis
h
A-1
7
Obs
.S
peci
esC
omm
onna
me
Fam
ilyA
ssem
-bl
age
Exp
erim
ent
type
Num
ber
of fi
sh
Adj
uste
dav
erag
ele
ngth
(cm
)
Vel
ocity
incr
e-m
ents
Ave
rage
criti
cal
velo
city
(cm
/s)
Var
iatio
nin
ave
rage
criti
cal
velo
city
Ave
rage
criti
cal
velo
city
(BL/
s)
Exp
eri-
men
tal
tem
per-
atur
e (C
)R
efer
ence
198
Onc
orhy
nchu
ski
sutc
hco
ho s
alm
onS
alm
onid
aeP
tunn
el; U
crit
606.
51.
6L(e
xp0.
6)38
3.2
SD
5.91
13H
owar
d 19
75
199
Onc
orhy
nchu
ski
sutc
hco
ho s
alm
onS
alm
onid
aeP
tunn
el; U
crit
608.
71.
6L(e
xp0.
6)41
.73.
8 S
D4.
9513
How
ard
1975
200
Onc
orhy
nchu
ski
sutc
hco
ho s
alm
onS
alm
onid
aeP
tunn
el; U
crit
608.
61.
6L(e
xp0.
6)37
.42.
4 S
D4.
513
How
ard
1975
201
Onc
orhy
nchu
ski
sutc
hco
ho s
alm
onS
alm
onid
aeP
tunn
el; U
crit
308.
71.
6L(e
xp0.
6)35
.63
SD
4.23
13H
owar
d 19
75
202
Onc
orhy
nchu
ski
sutc
hco
ho s
alm
onS
alm
onid
aeP
tunn
el; U
crit
104.
11/
8 U
crit
14.8
3.7
3G
lova
and
McI
nern
ey19
77
203
Onc
orhy
nchu
ski
sutc
hco
ho s
alm
onS
alm
onid
aeP
tunn
el; U
crit
104.
11/
8 U
crit
15.6
3.9
3G
lova
and
McI
nern
ey19
77
204
Onc
orhy
nchu
ski
sutc
hco
ho s
alm
onS
alm
onid
aeP
tunn
el; U
crit
104.
11/
8 U
crit
20.8
5.2
8G
lova
and
McI
nern
ey19
77
205
Onc
orhy
nchu
ski
sutc
hco
ho s
alm
onS
alm
onid
aeP
tunn
el; U
crit
104.
11/
8 U
crit
205
8G
lova
and
McI
nern
ey19
77
206
Onc
orhy
nchu
ski
sutc
hco
ho s
alm
onS
alm
onid
aeP
tunn
el; U
crit
104.
11/
8 U
crit
266.
513
Glo
va a
nd M
cIne
rney
1977
207
Onc
orhy
nchu
ski
sutc
hco
ho s
alm
onS
alm
onid
aeP
tunn
el; U
crit
104.
11/
8 U
crit
24.8
6.2
13G
lova
and
McI
nern
ey19
77
208
Onc
orhy
nchu
ski
sutc
hco
ho s
alm
onS
alm
onid
aeP
tunn
el; U
crit
104.
11/
8 U
crit
30.8
7.7
18G
lova
and
McI
nern
ey19
77
209
Onc
orhy
nchu
ski
sutc
hco
ho s
alm
onS
alm
onid
aeP
tunn
el; U
crit
104.
11/
8 U
crit
28.4
7.1
18G
lova
and
McI
nern
ey19
77
210
Onc
orhy
nchu
ski
sutc
hco
ho s
alm
onS
alm
onid
aeP
tunn
el; U
crit
104.
11/
8 U
crit
31.6
7.9
23G
lova
and
McI
nern
ey19
77
211
Onc
orhy
nchu
ski
sutc
hco
ho s
alm
onS
alm
onid
aeP
tunn
el; U
crit
104.
11/
8 U
crit
31.2
7.8
23G
lova
and
McI
nern
ey19
77
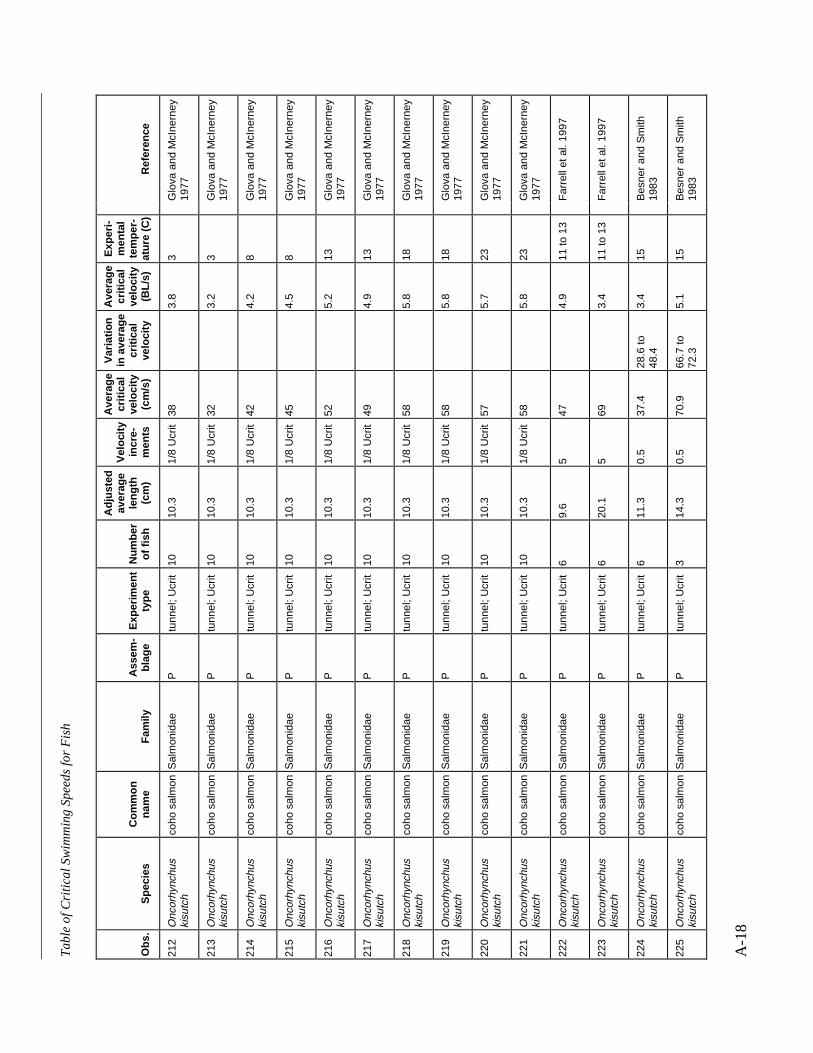
Ta
ble
of
Cri
tica
l Sw
imm
ing
Sp
ee
ds
for
Fis
h
A-1
8
Obs
.S
peci
esC
omm
onna
me
Fam
ilyA
ssem
-bl
age
Exp
erim
ent
type
Num
ber
of fi
sh
Adj
uste
dav
erag
ele
ngth
(cm
)
Vel
ocity
incr
e-m
ents
Ave
rage
criti
cal
velo
city
(cm
/s)
Var
iatio
nin
ave
rage
criti
cal
velo
city
Ave
rage
criti
cal
velo
city
(BL/
s)
Exp
eri-
men
tal
tem
per-
atur
e (C
)R
efer
ence
212
Onc
orhy
nchu
ski
sutc
hco
ho s
alm
onS
alm
onid
aeP
tunn
el; U
crit
1010
.31/
8 U
crit
383.
83
Glo
va a
nd M
cIne
rney
1977
213
Onc
orhy
nchu
ski
sutc
hco
ho s
alm
onS
alm
onid
aeP
tunn
el; U
crit
1010
.31/
8 U
crit
323.
23
Glo
va a
nd M
cIne
rney
1977
214
Onc
orhy
nchu
ski
sutc
hco
ho s
alm
onS
alm
onid
aeP
tunn
el; U
crit
1010
.31/
8 U
crit
424.
28
Glo
va a
nd M
cIne
rney
1977
215
Onc
orhy
nchu
ski
sutc
hco
ho s
alm
onS
alm
onid
aeP
tunn
el; U
crit
1010
.31/
8 U
crit
454.
58
Glo
va a
nd M
cIne
rney
1977
216
Onc
orhy
nchu
ski
sutc
hco
ho s
alm
onS
alm
onid
aeP
tunn
el; U
crit
1010
.31/
8 U
crit
525.
213
Glo
va a
nd M
cIne
rney
1977
217
Onc
orhy
nchu
ski
sutc
hco
ho s
alm
onS
alm
onid
aeP
tunn
el; U
crit
1010
.31/
8 U
crit
494.
913
Glo
va a
nd M
cIne
rney
1977
218
Onc
orhy
nchu
ski
sutc
hco
ho s
alm
onS
alm
onid
aeP
tunn
el; U
crit
1010
.31/
8 U
crit
585.
818
Glo
va a
nd M
cIne
rney
1977
219
Onc
orhy
nchu
ski
sutc
hco
ho s
alm
onS
alm
onid
aeP
tunn
el; U
crit
1010
.31/
8 U
crit
585.
818
Glo
va a
nd M
cIne
rney
1977
220
Onc
orhy
nchu
ski
sutc
hco
ho s
alm
onS
alm
onid
aeP
tunn
el; U
crit
1010
.31/
8 U
crit
575.
723
Glo
va a
nd M
cIne
rney
1977
221
Onc
orhy
nchu
ski
sutc
hco
ho s
alm
onS
alm
onid
aeP
tunn
el; U
crit
1010
.31/
8 U
crit
585.
823
Glo
va a
nd M
cIne
rney
1977
222
Onc
orhy
nchu
ski
sutc
hco
ho s
alm
onS
alm
onid
aeP
tunn
el; U
crit
69.
65
474.
911
to 1
3F
arre
ll et
al.
1997
223
Onc
orhy
nchu
ski
sutc
hco
ho s
alm
onS
alm
onid
aeP
tunn
el; U
crit
620
.15
693.
411
to 1
3F
arre
ll et
al.
1997
224
Onc
orhy
nchu
ski
sutc
hco
ho s
alm
onS
alm
onid
aeP
tunn
el; U
crit
611
.30.
537
.428
.6 to
48.4
3.4
15B
esne
r an
d S
mith
1983
225
Onc
orhy
nchu
ski
sutc
hco
ho s
alm
onS
alm
onid
aeP
tunn
el; U
crit
314
.30.
570
.966
.7 to
72.3
5.1
15B
esne
r an
d S
mith
1983
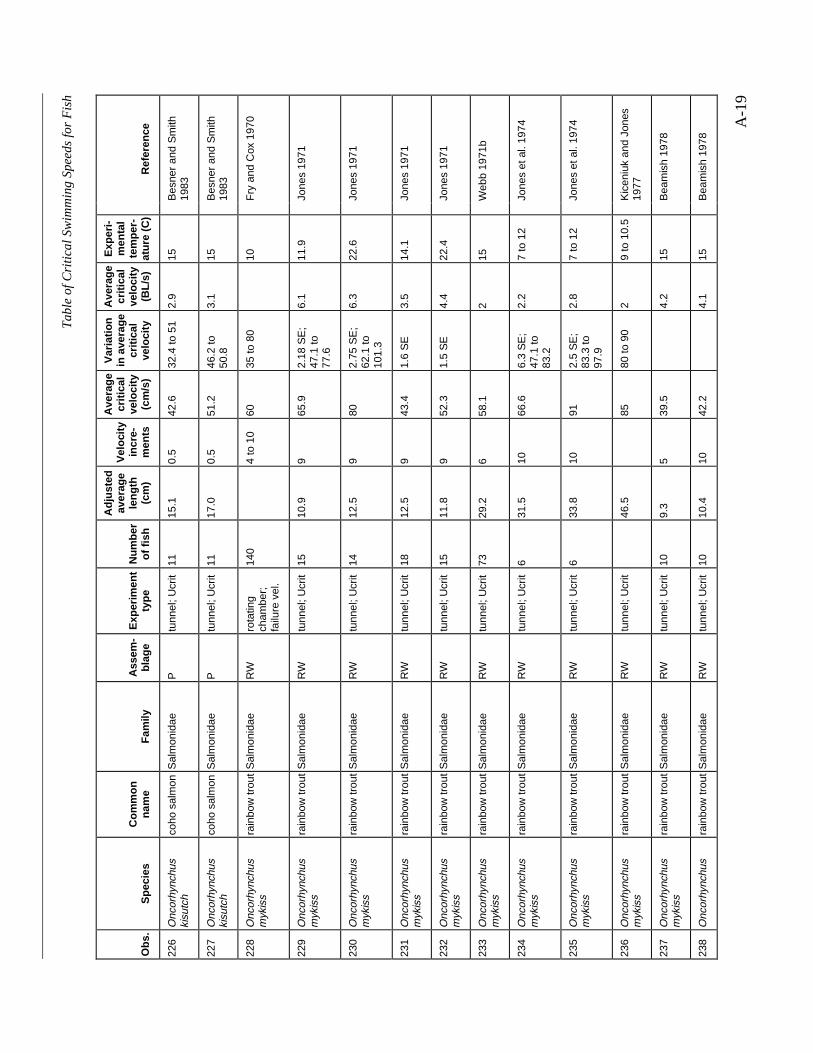
Ta
ble
of
Cri
tica
l Sw
imm
ing
Sp
ee
ds
for
Fis
h
A-1
9
Obs
.S
peci
esC
omm
onna
me
Fam
ilyA
ssem
-bl
age
Exp
erim
ent
type
Num
ber
of fi
sh
Adj
uste
dav
erag
ele
ngth
(cm
)
Vel
ocity
incr
e-m
ents
Ave
rage
criti
cal
velo
city
(cm
/s)
Var
iatio
nin
ave
rage
criti
cal
velo
city
Ave
rage
criti
cal
velo
city
(BL/
s)
Exp
eri-
men
tal
tem
per-
atur
e (C
)R
efer
ence
226
Onc
orhy
nchu
ski
sutc
hco
ho s
alm
onS
alm
onid
aeP
tunn
el; U
crit
1115
.10.
542
.632
.4 to
51
2.9
15B
esne
r an
d S
mith
1983
227
Onc
orhy
nchu
ski
sutc
hco
ho s
alm
onS
alm
onid
aeP
tunn
el; U
crit
1117
.00.
551
.246
.2 to
50.8
3.1
15B
esne
r an
d S
mith
1983
228
Onc
orhy
nchu
sm
ykis
sra
inbo
w tr
out
Sal
mon
idae
RW
rota
ting
cham
ber;
failu
re v
el.
140
4 to
10
6035
to 8
010
Fry
and
Cox
197
0
229
Onc
orhy
nchu
sm
ykis
sra
inbo
w tr
out
Sal
mon
idae
RW
tunn
el; U
crit
1510
.99
65.9
2.18
SE
;47
.1 to
77.6
6.1
11.9
Jone
s 19
71
230
Onc
orhy
nchu
sm
ykis
sra
inbo
w tr
out
Sal
mon
idae
RW
tunn
el; U
crit
1412
.59
802.
75 S
E;
62.1
to10
1.3
6.3
22.6
Jone
s 19
71
231
Onc
orhy
nchu
sm
ykis
sra
inbo
w tr
out
Sal
mon
idae
RW
tunn
el; U
crit
1812
.59
43.4
1.6
SE
3.5
14.1
Jone
s 19
71
232
Onc
orhy
nchu
sm
ykis
sra
inbo
w tr
out
Sal
mon
idae
RW
tunn
el; U
crit
1511
.89
52.3
1.5
SE
4.4
22.4
Jone
s 19
71
233
Onc
orhy
nchu
sm
ykis
sra
inbo
w tr
out
Sal
mon
idae
RW
tunn
el; U
crit
7329
.26
58.1
215
Web
b 19
71b
234
Onc
orhy
nchu
sm
ykis
sra
inbo
w tr
out
Sal
mon
idae
RW
tunn
el; U
crit
631
.510
66.6
6.3
SE
;47
.1 to
83.2
2.2
7 to
12
Jone
s et
al.
1974
235
Onc
orhy
nchu
sm
ykis
sra
inbo
w tr
out
Sal
mon
idae
RW
tunn
el; U
crit
633
.810
912.
5 S
E;
83.3
to97
.9
2.8
7 to
12
Jone
s et
al.
1974
236
Onc
orhy
nchu
sm
ykis
sra
inbo
w tr
out
Sal
mon
idae
RW
tunn
el; U
crit
46.5
8580
to 9
02
9 to
10.
5K
icen
iuk
and
Jone
s19
77
237
Onc
orhy
nchu
sm
ykis
sra
inbo
w tr
out
Sal
mon
idae
RW
tunn
el; U
crit
109.
35
39.5
4.2
15B
eam
ish
1978
238
Onc
orhy
nchu
sra
inbo
w tr
out
Sal
mon
idae
RW
tunn
el; U
crit
1010
.410
42.2
4.1
15B
eam
ish
1978
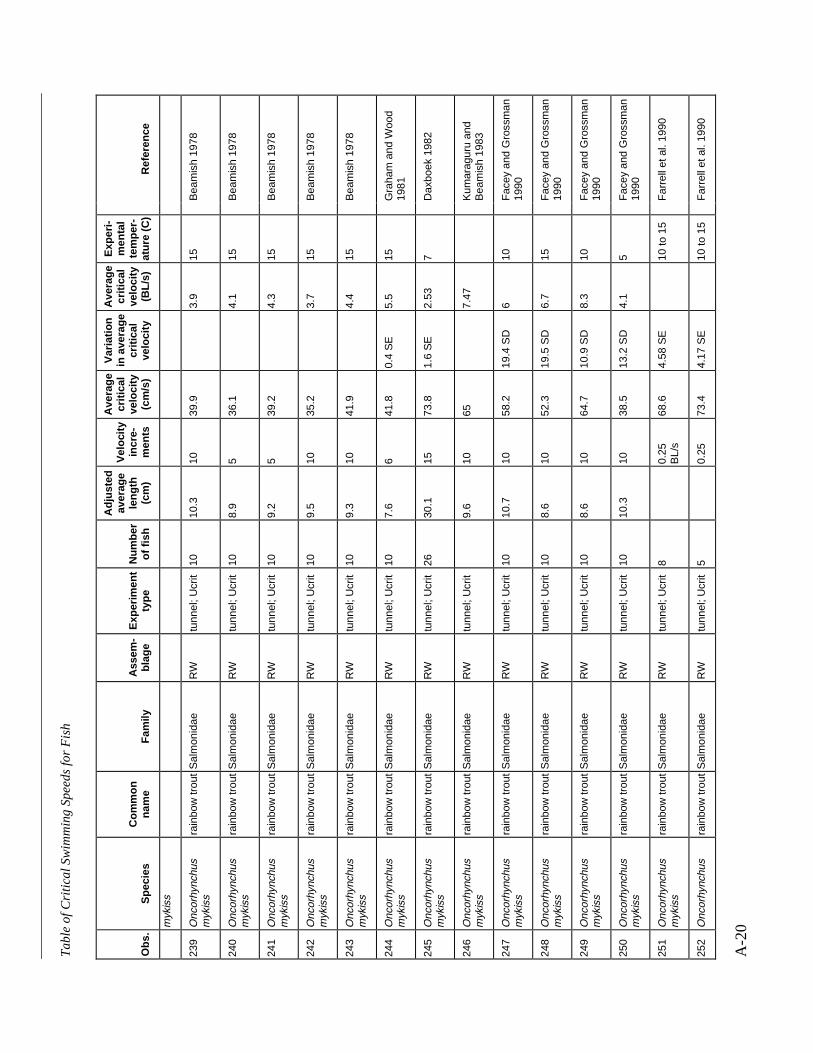
Ta
ble
of
Cri
tica
l Sw
imm
ing
Sp
ee
ds
for
Fis
h
A-2
0
Obs
.S
peci
esC
omm
onna
me
Fam
ilyA
ssem
-bl
age
Exp
erim
ent
type
Num
ber
of fi
sh
Adj
uste
dav
erag
ele
ngth
(cm
)
Vel
ocity
incr
e-m
ents
Ave
rage
criti
cal
velo
city
(cm
/s)
Var
iatio
nin
ave
rage
criti
cal
velo
city
Ave
rage
criti
cal
velo
city
(BL/
s)
Exp
eri-
men
tal
tem
per-
atur
e (C
)R
efer
ence
myk
iss
239
Onc
orhy
nchu
sm
ykis
sra
inbo
w tr
out
Sal
mon
idae
RW
tunn
el; U
crit
1010
.310
39.9
3.9
15B
eam
ish
1978
240
Onc
orhy
nchu
sm
ykis
sra
inbo
w tr
out
Sal
mon
idae
RW
tunn
el; U
crit
108.
95
36.1
4.1
15B
eam
ish
1978
241
Onc
orhy
nchu
sm
ykis
sra
inbo
w tr
out
Sal
mon
idae
RW
tunn
el; U
crit
109.
25
39.2
4.3
15B
eam
ish
1978
242
Onc
orhy
nchu
sm
ykis
sra
inbo
w tr
out
Sal
mon
idae
RW
tunn
el; U
crit
109.
510
35.2
3.7
15B
eam
ish
1978
243
Onc
orhy
nchu
sm
ykis
sra
inbo
w tr
out
Sal
mon
idae
RW
tunn
el; U
crit
109.
310
41.9
4.4
15B
eam
ish
1978
244
Onc
orhy
nchu
sm
ykis
sra
inbo
w tr
out
Sal
mon
idae
RW
tunn
el; U
crit
107.
66
41.8
0.4
SE
5.5
15G
raha
m a
nd W
ood
1981
245
Onc
orhy
nchu
sm
ykis
sra
inbo
w tr
out
Sal
mon
idae
RW
tunn
el; U
crit
2630
.115
73.8
1.6
SE
2.53
7D
axbo
ek 1
982
246
Onc
orhy
nchu
sm
ykis
sra
inbo
w tr
out
Sal
mon
idae
RW
tunn
el; U
crit
9.6
1065
7.47
Kum
arag
uru
and
Bea
mis
h 19
83
247
Onc
orhy
nchu
sm
ykis
sra
inbo
w tr
out
Sal
mon
idae
RW
tunn
el; U
crit
1010
.710
58.2
19.4
SD
610
Fac
ey a
nd G
ross
man
1990
248
Onc
orhy
nchu
sm
ykis
sra
inbo
w tr
out
Sal
mon
idae
RW
tunn
el; U
crit
108.
610
52.3
19.5
SD
6.7
15F
acey
and
Gro
ssm
an19
90
249
Onc
orhy
nchu
sm
ykis
sra
inbo
w tr
out
Sal
mon
idae
RW
tunn
el; U
crit
108.
610
64.7
10.9
SD
8.3
10F
acey
and
Gro
ssm
an19
90
250
Onc
orhy
nchu
sm
ykis
sra
inbo
w tr
out
Sal
mon
idae
RW
tunn
el; U
crit
1010
.310
38.5
13.2
SD
4.1
5F
acey
and
Gro
ssm
an19
90
251
Onc
orhy
nchu
sm
ykis
sra
inbo
w tr
out
Sal
mon
idae
RW
tunn
el; U
crit
80.
25B
L/s
68.6
4.58
SE
10 to
15
Far
rell
et a
l. 19
90
252
Onc
orhy
nchu
sra
inbo
w tr
out
Sal
mon
idae
RW
tunn
el; U
crit
50.
2573
.44.
17 S
E10
to 1
5F
arre
ll et
al.
1990
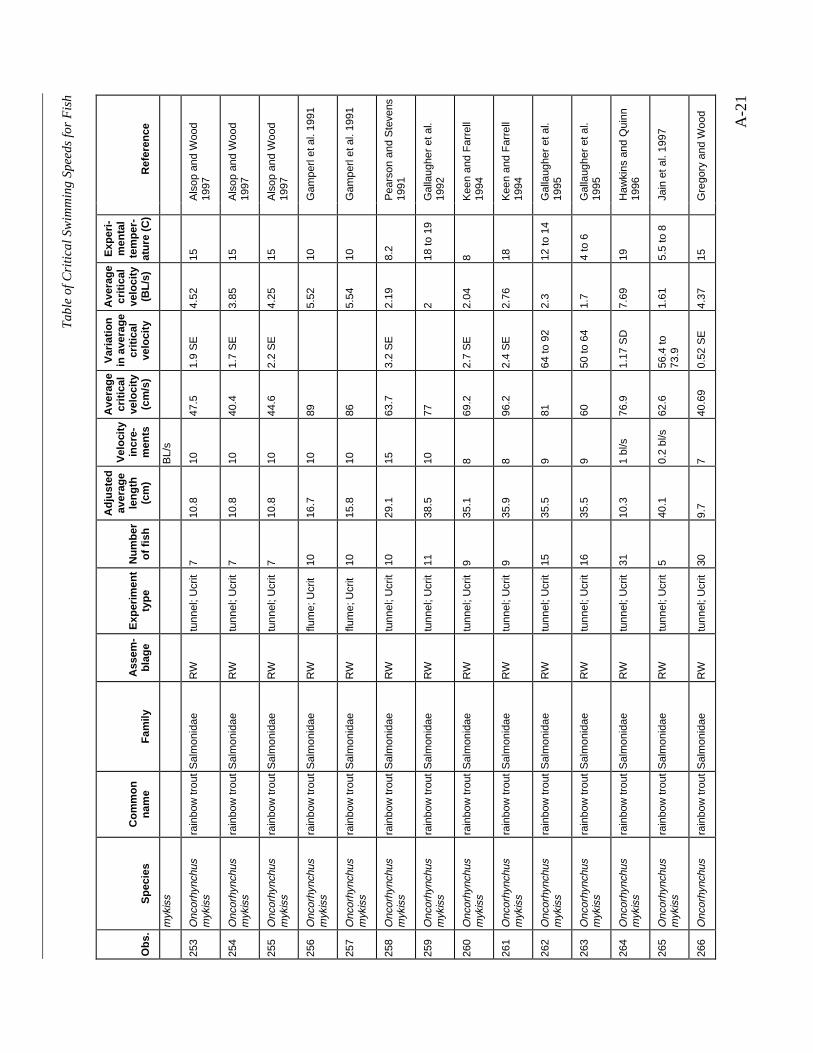
Ta
ble
of
Cri
tica
l Sw
imm
ing
Sp
ee
ds
for
Fis
h
A-2
1
Obs
.S
peci
esC
omm
onna
me
Fam
ilyA
ssem
-bl
age
Exp
erim
ent
type
Num
ber
of fi
sh
Adj
uste
dav
erag
ele
ngth
(cm
)
Vel
ocity
incr
e-m
ents
Ave
rage
criti
cal
velo
city
(cm
/s)
Var
iatio
nin
ave
rage
criti
cal
velo
city
Ave
rage
criti
cal
velo
city
(BL/
s)
Exp
eri-
men
tal
tem
per-
atur
e (C
)R
efer
ence
myk
iss
BL/
s
253
Onc
orhy
nchu
sm
ykis
sra
inbo
w tr
out
Sal
mon
idae
RW
tunn
el; U
crit
710
.810
47.5
1.9
SE
4.52
15A
lsop
and
Woo
d19
97
254
Onc
orhy
nchu
sm
ykis
sra
inbo
w tr
out
Sal
mon
idae
RW
tunn
el; U
crit
710
.810
40.4
1.7
SE
3.85
15A
lsop
and
Woo
d19
97
255
Onc
orhy
nchu
sm
ykis
sra
inbo
w tr
out
Sal
mon
idae
RW
tunn
el; U
crit
710
.810
44.6
2.2
SE
4.25
15A
lsop
and
Woo
d19
97
256
Onc
orhy
nchu
sm
ykis
sra
inbo
w tr
out
Sal
mon
idae
RW
flum
e; U
crit
1016
.710
895.
5210
Gam
perl
et a
l. 19
91
257
Onc
orhy
nchu
sm
ykis
sra
inbo
w tr
out
Sal
mon
idae
RW
flum
e; U
crit
1015
.810
865.
5410
Gam
perl
et a
l. 19
91
258
Onc
orhy
nchu
sm
ykis
sra
inbo
w tr
out
Sal
mon
idae
RW
tunn
el; U
crit
1029
.115
63.7
3.2
SE
2.19
8.2
Pea
rson
and
Ste
vens
1991
259
Onc
orhy
nchu
sm
ykis
sra
inbo
w tr
out
Sal
mon
idae
RW
tunn
el; U
crit
1138
.510
772
18 to
19
Gal
laug
her
et a
l.19
92
260
Onc
orhy
nchu
sm
ykis
sra
inbo
w tr
out
Sal
mon
idae
RW
tunn
el; U
crit
935
.18
69.2
2.7
SE
2.04
8K
een
and
Far
rell
1994
261
Onc
orhy
nchu
sm
ykis
sra
inbo
w tr
out
Sal
mon
idae
RW
tunn
el; U
crit
935
.98
96.2
2.4
SE
2.76
18K
een
and
Far
rell
1994
262
Onc
orhy
nchu
sm
ykis
sra
inbo
w tr
out
Sal
mon
idae
RW
tunn
el; U
crit
1535
.59
8164
to 9
22.
312
to 1
4G
alla
ughe
r et
al.
1995
263
Onc
orhy
nchu
sm
ykis
sra
inbo
w tr
out
Sal
mon
idae
RW
tunn
el; U
crit
1635
.59
6050
to 6
41.
74
to 6
Gal
laug
her
et a
l.19
95
264
Onc
orhy
nchu
sm
ykis
sra
inbo
w tr
out
Sal
mon
idae
RW
tunn
el; U
crit
3110
.31
bl/s
76.9
1.17
SD
7.69
19H
awki
ns a
nd Q
uinn
1996
265
Onc
orhy
nchu
sm
ykis
sra
inbo
w tr
out
Sal
mon
idae
RW
tunn
el; U
crit
540
.10.
2 bl
/s62
.656
.4 to
73.9
1.61
5.5
to 8
Jain
et a
l. 19
97
266
Onc
orhy
nchu
sra
inbo
w tr
out
Sal
mon
idae
RW
tunn
el; U
crit
309.
77
40.6
90.
52 S
E4.
3715
Gre
gory
and
Woo
d
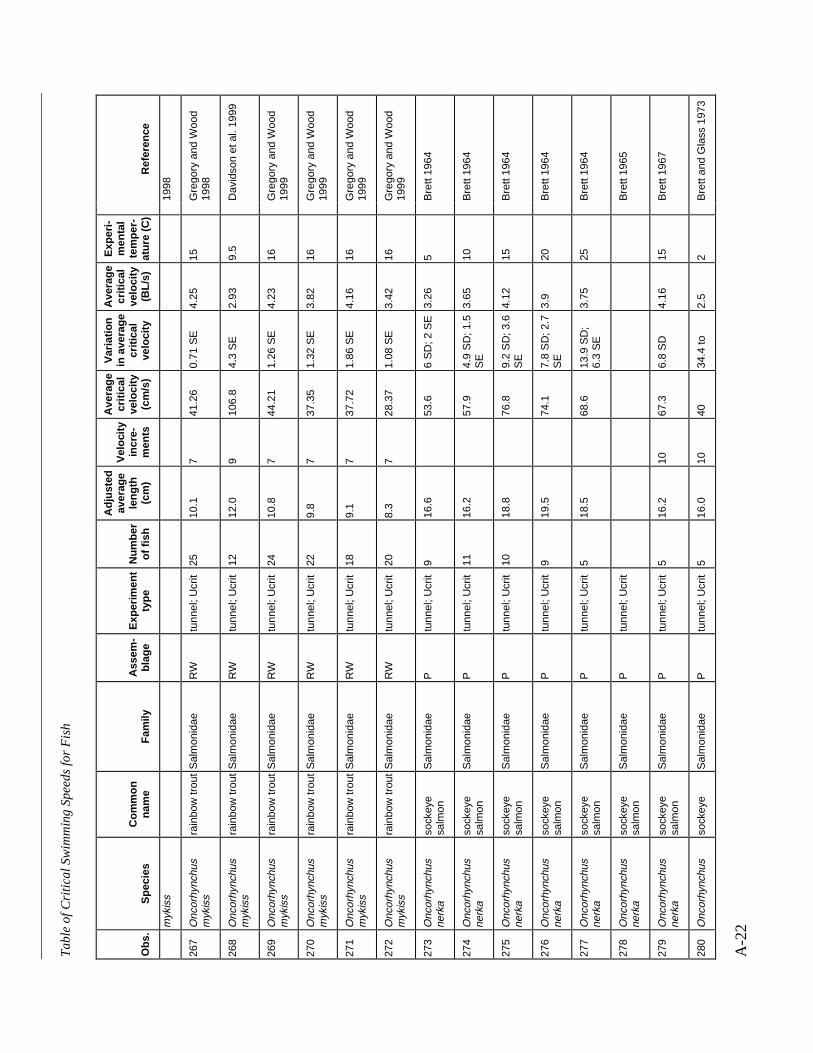
Ta
ble
of
Cri
tica
l Sw
imm
ing
Sp
ee
ds
for
Fis
h
A-2
2
Obs
.S
peci
esC
omm
onna
me
Fam
ilyA
ssem
-bl
age
Exp
erim
ent
type
Num
ber
of fi
sh
Adj
uste
dav
erag
ele
ngth
(cm
)
Vel
ocity
incr
e-m
ents
Ave
rage
criti
cal
velo
city
(cm
/s)
Var
iatio
nin
ave
rage
criti
cal
velo
city
Ave
rage
criti
cal
velo
city
(BL/
s)
Exp
eri-
men
tal
tem
per-
atur
e (C
)R
efer
ence
myk
iss
1998
267
Onc
orhy
nchu
sm
ykis
sra
inbo
w tr
out
Sal
mon
idae
RW
tunn
el; U
crit
2510
.17
41.2
60.
71 S
E4.
2515
Gre
gory
and
Woo
d19
98
268
Onc
orhy
nchu
sm
ykis
sra
inbo
w tr
out
Sal
mon
idae
RW
tunn
el; U
crit
1212
.09
106.
84.
3 S
E2.
939.
5D
avid
son
et a
l. 19
99
269
Onc
orhy
nchu
sm
ykis
sra
inbo
w tr
out
Sal
mon
idae
RW
tunn
el; U
crit
2410
.87
44.2
11.
26 S
E4.
2316
Gre
gory
and
Woo
d19
99
270
Onc
orhy
nchu
sm
ykis
sra
inbo
w tr
out
Sal
mon
idae
RW
tunn
el; U
crit
229.
87
37.3
51.
32 S
E3.
8216
Gre
gory
and
Woo
d19
99
271
Onc
orhy
nchu
sm
ykis
sra
inbo
w tr
out
Sal
mon
idae
RW
tunn
el; U
crit
189.
17
37.7
21.
86 S
E4.
1616
Gre
gory
and
Woo
d19
99
272
Onc
orhy
nchu
sm
ykis
sra
inbo
w tr
out
Sal
mon
idae
RW
tunn
el; U
crit
208.
37
28.3
71.
08 S
E3.
4216
Gre
gory
and
Woo
d19
99
273
Onc
orhy
nchu
sne
rka
sock
eye
salm
onS
alm
onid
aeP
tunn
el; U
crit
916
.653
.66
SD
; 2 S
E3.
265
Bre
tt 19
64
274
Onc
orhy
nchu
sne
rka
sock
eye
salm
onS
alm
onid
aeP
tunn
el; U
crit
1116
.257
.94.
9 S
D; 1
.5S
E3.
6510
Bre
tt 19
64
275
Onc
orhy
nchu
sne
rka
sock
eye
salm
onS
alm
onid
aeP
tunn
el; U
crit
1018
.876
.89.
2 S
D; 3
.6S
E4.
1215
Bre
tt 19
64
276
Onc
orhy
nchu
sne
rka
sock
eye
salm
onS
alm
onid
aeP
tunn
el; U
crit
919
.574
.17.
8 S
D; 2
.7S
E3.
920
Bre
tt 19
64
277
Onc
orhy
nchu
sne
rka
sock
eye
salm
onS
alm
onid
aeP
tunn
el; U
crit
518
.568
.613
.9 S
D;
6.3
SE
3.75
25B
rett
1964
278
Onc
orhy
nchu
sne
rka
sock
eye
salm
onS
alm
onid
aeP
tunn
el; U
crit
Bre
tt 19
65
279
Onc
orhy
nchu
sne
rka
sock
eye
salm
onS
alm
onid
aeP
tunn
el; U
crit
516
.210
67.3
6.8
SD
4.16
15B
rett
1967
280
Onc
orhy
nchu
sso
ckey
eS
alm
onid
aeP
tunn
el; U
crit
516
.010
4034
.4 to
2.5
2B
rett
and
Gla
ss 1
973

Ta
ble
of
Cri
tica
l Sw
imm
ing
Sp
ee
ds
for
Fis
h
A-2
3
Obs
.S
peci
esC
omm
onna
me
Fam
ilyA
ssem
-bl
age
Exp
erim
ent
type
Num
ber
of fi
sh
Adj
uste
dav
erag
ele
ngth
(cm
)
Vel
ocity
incr
e-m
ents
Ave
rage
criti
cal
velo
city
(cm
/s)
Var
iatio
nin
ave
rage
criti
cal
velo
city
Ave
rage
criti
cal
velo
city
(BL/
s)
Exp
eri-
men
tal
tem
per-
atur
e (C
)R
efer
ence
nerk
asa
lmon
45.9
281
Onc
orhy
nchu
sne
rka
sock
eye
salm
onS
alm
onid
aeP
tunn
el; U
crit
411
.610
44.3
40.5
to54
.23.
95
Bre
tt an
d G
lass
197
3
282
Onc
orhy
nchu
sne
rka
sock
eye
salm
onS
alm
onid
aeP
tunn
el; U
crit
116
.210
593.
710
Bre
tt an
d G
lass
197
3
283
Onc
orhy
nchu
sne
rka
sock
eye
salm
onS
alm
onid
aeP
tunn
el; U
crit
17.
710
51.5
6.7
15B
rett
and
Gla
ss 1
973
284
Onc
orhy
nchu
sne
rka
sock
eye
salm
onS
alm
onid
aeP
tunn
el; U
crit
110
.010
59.8
5.9
15B
rett
and
Gla
ss 1
973
285
Onc
orhy
nchu
sne
rka
sock
eye
salm
onS
alm
onid
aeP
tunn
el; U
crit
112
.810
53.2
4.2
15B
rett
and
Gla
ss 1
973
286
Onc
orhy
nchu
sne
rka
sock
eye
salm
onS
alm
onid
aeP
tunn
el; U
crit
118
.810
90.7
4.8
15B
rett
and
Gla
ss 1
973
287
Onc
orhy
nchu
sne
rka
sock
eye
salm
onS
alm
onid
aeP
tunn
el; U
crit
141
.810
150
3.6
15B
rett
and
Gla
ss 1
973
288
Onc
orhy
nchu
sne
rka
sock
eye
salm
onS
alm
onid
aeP
tunn
el; U
crit
153
.910
178
3.3
15B
rett
and
Gla
ss 1
973
289
Onc
orhy
nchu
sne
rka
sock
eye
salm
onS
alm
onid
aeP
tunn
el; U
crit
55.
810
42.2
37.1
to46
.07.
320
Bre
tt an
d G
lass
197
3
290
Onc
orhy
nchu
sne
rka
sock
eye
salm
onS
alm
onid
aeP
tunn
el; U
crit
89.
010
5852
.9 to
64.4
6.5
20B
rett
and
Gla
ss 1
973
291
Onc
orhy
nchu
sne
rka
sock
eye
salm
onS
alm
onid
aeP
tunn
el; U
crit
757
.010
130
126
to 1
362.
320
Bre
tt an
d G
lass
197
3
292
Onc
orhy
nchu
sne
rka
sock
eye
salm
onS
alm
onid
aeP
tunn
el; U
crit
118
.510
69.4
3.8
24B
rett
and
Gla
ss 1
973
293
Onc
orhy
nchu
sne
rka
sock
eye
salm
onS
alm
onid
aeP
tunn
el; U
crit
105.
35
387.
215
Web
b an
d B
rett
1973
294
Onc
orhy
nchu
sso
ckey
eS
alm
onid
aeP
tunn
el; U
crit
105.
45
407.
315
Web
b an
d B
rett
1973
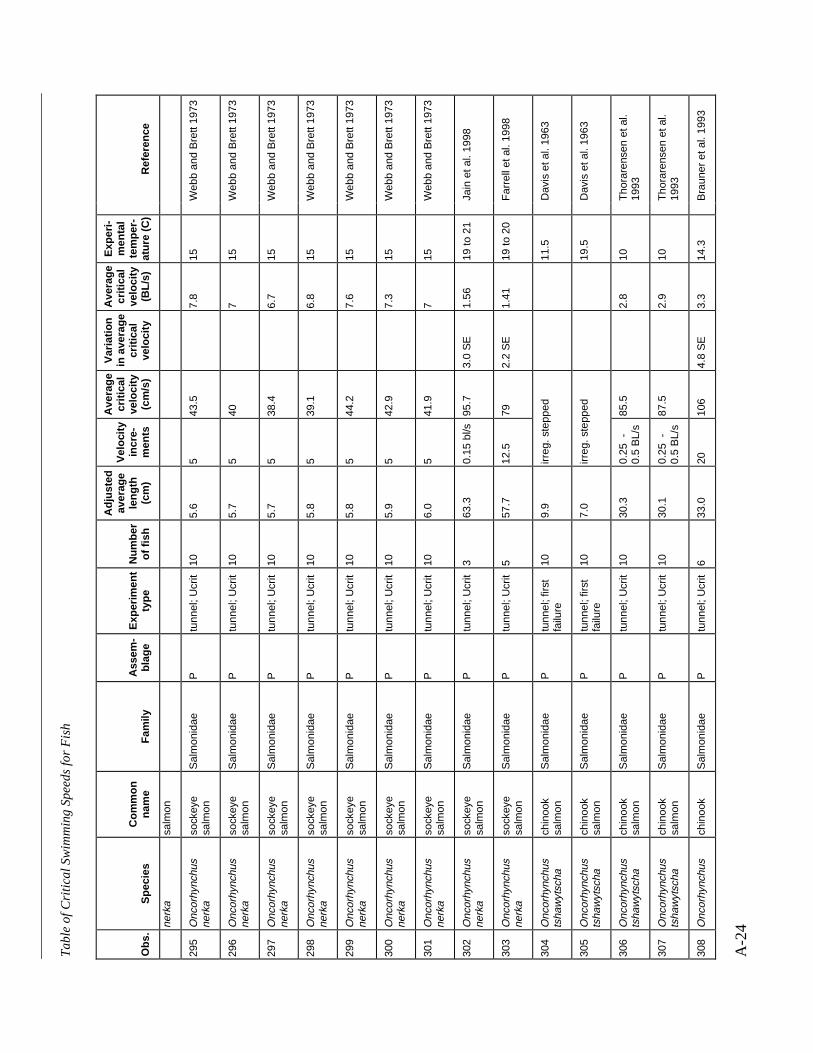
Ta
ble
of
Cri
tica
l Sw
imm
ing
Sp
ee
ds
for
Fis
h
A-2
4
Obs
.S
peci
esC
omm
onna
me
Fam
ilyA
ssem
-bl
age
Exp
erim
ent
type
Num
ber
of fi
sh
Adj
uste
dav
erag
ele
ngth
(cm
)
Vel
ocity
incr
e-m
ents
Ave
rage
criti
cal
velo
city
(cm
/s)
Var
iatio
nin
ave
rage
criti
cal
velo
city
Ave
rage
criti
cal
velo
city
(BL/
s)
Exp
eri-
men
tal
tem
per-
atur
e (C
)R
efer
ence
nerk
asa
lmon
295
Onc
orhy
nchu
sne
rka
sock
eye
salm
onS
alm
onid
aeP
tunn
el; U
crit
105.
65
43.5
7.8
15W
ebb
and
Bre
tt 19
73
296
Onc
orhy
nchu
sne
rka
sock
eye
salm
onS
alm
onid
aeP
tunn
el; U
crit
105.
75
407
15W
ebb
and
Bre
tt 19
73
297
Onc
orhy
nchu
sne
rka
sock
eye
salm
onS
alm
onid
aeP
tunn
el; U
crit
105.
75
38.4
6.7
15W
ebb
and
Bre
tt 19
73
298
Onc
orhy
nchu
sne
rka
sock
eye
salm
onS
alm
onid
aeP
tunn
el; U
crit
105.
85
39.1
6.8
15W
ebb
and
Bre
tt 19
73
299
Onc
orhy
nchu
sne
rka
sock
eye
salm
onS
alm
onid
aeP
tunn
el; U
crit
105.
85
44.2
7.6
15W
ebb
and
Bre
tt 19
73
300
Onc
orhy
nchu
sne
rka
sock
eye
salm
onS
alm
onid
aeP
tunn
el; U
crit
105.
95
42.9
7.3
15W
ebb
and
Bre
tt 19
73
301
Onc
orhy
nchu
sne
rka
sock
eye
salm
onS
alm
onid
aeP
tunn
el; U
crit
106.
05
41.9
715
Web
b an
d B
rett
1973
302
Onc
orhy
nchu
sne
rka
sock
eye
salm
onS
alm
onid
aeP
tunn
el; U
crit
363
.30.
15 b
l/s95
.73.
0 S
E1.
5619
to 2
1Ja
in e
t al.
1998
303
Onc
orhy
nchu
sne
rka
sock
eye
salm
onS
alm
onid
aeP
tunn
el; U
crit
557
.712
.579
2.2
SE
1.41
19 to
20
Far
rell
et a
l. 19
98
304
Onc
orhy
nchu
sts
haw
ytsc
hach
inoo
ksa
lmon
Sal
mon
idae
Ptu
nnel
; firs
tfa
ilure
109.
9irr
eg. s
tepp
ed11
.5D
avis
et a
l. 19
63
305
Onc
orhy
nchu
sts
haw
ytsc
hach
inoo
ksa
lmon
Sal
mon
idae
Ptu
nnel
; firs
tfa
ilure
107.
0irr
eg. s
tepp
ed19
.5D
avis
et a
l. 19
63
306
Onc
orhy
nchu
sts
haw
ytsc
hach
inoo
ksa
lmon
Sal
mon
idae
Ptu
nnel
; Ucr
it10
30.3
0.25
-0.
5 B
L/s
85.5
2.8
10T
hora
rens
en e
t al.
1993
307
Onc
orhy
nchu
sts
haw
ytsc
hach
inoo
ksa
lmon
Sal
mon
idae
Ptu
nnel
; Ucr
it10
30.1
0.25
-0.
5 B
L/s
87.5
2.9
10T
hora
rens
en e
t al.
1993
308
Onc
orhy
nchu
sch
inoo
kS
alm
onid
aeP
tunn
el; U
crit
633
.020
106
4.8
SE
3.3
14.3
Bra
uner
et a
l. 19
93
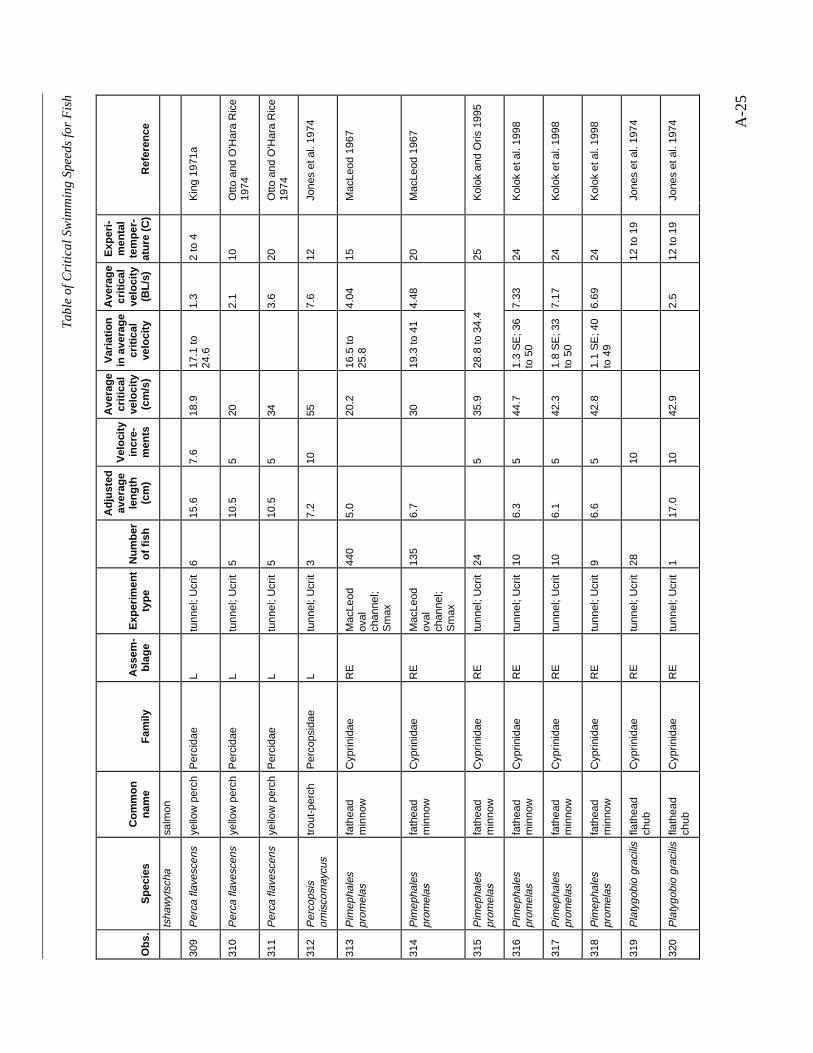
Ta
ble
of
Cri
tica
l Sw
imm
ing
Sp
ee
ds
for
Fis
h
A-2
5
Obs
.S
peci
esC
omm
onna
me
Fam
ilyA
ssem
-bl
age
Exp
erim
ent
type
Num
ber
of fi
sh
Adj
uste
dav
erag
ele
ngth
(cm
)
Vel
ocity
incr
e-m
ents
Ave
rage
criti
cal
velo
city
(cm
/s)
Var
iatio
nin
ave
rage
criti
cal
velo
city
Ave
rage
criti
cal
velo
city
(BL/
s)
Exp
eri-
men
tal
tem
per-
atur
e (C
)R
efer
ence
tsha
wyt
scha
salm
on
309
Per
ca fl
aves
cens
yello
w p
erch
Per
cida
eL
tunn
el; U
crit
615
.67.
618
.917
.1 to
24.6
1.3
2 to
4K
ing
1971
a
310
Per
ca fl
aves
cens
yello
w p
erch
Per
cida
eL
tunn
el; U
crit
510
.55
202.
110
Otto
and
O'H
ara
Ric
e19
74
311
Per
ca fl
aves
cens
yello
w p
erch
Per
cida
eL
tunn
el; U
crit
510
.55
343.
620
Otto
and
O'H
ara
Ric
e19
74
312
Per
cops
isom
isco
may
cus
trou
t-pe
rch
Per
cops
idae
Ltu
nnel
; Ucr
it3
7.2
1055
7.6
12Jo
nes
et a
l. 19
74
313
Pim
epha
les
prom
elas
fath
ead
min
now
Cyp
rinid
aeR
EM
acLe
odov
alch
anne
l;S
max
440
5.0
20.2
16.5
to25
.84.
0415
Mac
Leod
196
7
314
Pim
epha
les
prom
elas
fath
ead
min
now
Cyp
rinid
aeR
EM
acLe
odov
alch
anne
l;S
max
135
6.7
3019
.3 to
41
4.48
20M
acLe
od 1
967
315
Pim
epha
les
prom
elas
fath
ead
min
now
Cyp
rinid
aeR
Etu
nnel
; Ucr
it24
535
.928
.8 to
34.
425
Kol
ok a
nd O
ris 1
995
316
Pim
epha
les
prom
elas
fath
ead
min
now
Cyp
rinid
aeR
Etu
nnel
; Ucr
it10
6.3
544
.71.
3 S
E; 3
6to
50
7.33
24K
olok
et a
l. 19
98
317
Pim
epha
les
prom
elas
fath
ead
min
now
Cyp
rinid
aeR
Etu
nnel
; Ucr
it10
6.1
542
.31.
8 S
E; 3
3to
50
7.17
24K
olok
et a
l. 19
98
318
Pim
epha
les
prom
elas
fath
ead
min
now
Cyp
rinid
aeR
Etu
nnel
; Ucr
it9
6.6
542
.81.
1 S
E; 4
0to
49
6.69
24K
olok
et a
l. 19
98
319
Pla
tygo
bio
grac
ilis
flath
ead
chub
Cyp
rinid
aeR
Etu
nnel
; Ucr
it28
1012
to 1
9Jo
nes
et a
l. 19
74
320
Pla
tygo
bio
grac
ilis
flath
ead
chub
Cyp
rinid
aeR
Etu
nnel
; Ucr
it1
17.0
1042
.92.
512
to 1
9Jo
nes
et a
l. 19
74

Ta
ble
of
Cri
tica
l Sw
imm
ing
Sp
ee
ds
for
Fis
h
A-2
6
Obs
.S
peci
esC
omm
onna
me
Fam
ilyA
ssem
-bl
age
Exp
erim
ent
type
Num
ber
of fi
sh
Adj
uste
dav
erag
ele
ngth
(cm
)
Vel
ocity
incr
e-m
ents
Ave
rage
criti
cal
velo
city
(cm
/s)
Var
iatio
nin
ave
rage
criti
cal
velo
city
Ave
rage
criti
cal
velo
city
(BL/
s)
Exp
eri-
men
tal
tem
per-
atur
e (C
)R
efer
ence
321
Pla
tygo
bio
grac
ilis
flath
ead
chub
Cyp
rinid
aeR
Etu
nnel
; Ucr
it1
30.0
1062
.72.
112
to 1
9Jo
nes
et a
l. 19
74
322
Ple
cost
omus
sp.
Arm
ored
catfi
shLo
ricar
iidae
Oflu
me;
Ucr
itfe
w8.
63.
115
117
.622
.F
ricke
et a
l. 19
87
323
Pom
atom
ussa
ltatr
ixbl
uefis
hP
omat
omid
aeA
tunn
el; U
crit
66
101.
92.
1 S
E4.
6115
Fre
adm
an 1
979
324
Pom
atom
ussa
ltatr
ixbl
uefis
hP
omat
omid
aeA
tunn
el; U
crit
66
845.
3 S
E4.
0115
Fre
adm
an 1
979
325
Pom
oxis
ann
ular
isw
hite
crap
pie
Cen
trar
chid
aeL
tunn
el; U
crit
1218
.75
34.7
25.5
to 4
5;6.
6 S
D2.
0425
Par
sons
and
Syl
vest
er 1
992
326
Pro
sopi
umw
illia
mso
nim
ount
ain
whi
tefis
hS
alm
onid
aeR
Wtu
nnel
; Ucr
it9
31.3
1042
.56.
5 S
E1.
47
to 1
2Jo
nes
et a
l. 19
74
327
Pty
choc
heilu
sgr
andi
sS
acra
men
topi
kem
inno
wC
yprin
idae
RW
tunn
el; U
crit
922
.910
406
SE
1.75
10M
yric
k an
d C
ech
2000
328
Pty
choc
heilu
sgr
andi
sS
acra
men
topi
kem
inno
wC
yprin
idae
RW
tunn
el; U
crit
1024
.710
574
SE
2.31
15M
yric
k an
d C
ech
2000
329
Pty
choc
heilu
sgr
andi
sS
acra
men
topi
kem
inno
wC
yprin
idae
RW
tunn
el; U
crit
823
.310
506
SE
2.15
20M
yric
k an
d C
ech
2000
330
Pty
choc
heilu
slu
cius
Col
orad
opi
kem
inno
wC
yprin
idae
RW
tunn
el;
abso
lute
spee
d
768.
835
95%
con
f.=
32
- 39
414
Ber
ry a
nd P
imen
tel
1985
331
Pty
choc
heilu
slu
cius
Col
orad
opi
kem
inno
wC
yprin
idae
RW
tunn
el;
abso
lute
spee
d
6012
.147
95%
con
f.=
45
- 48
3.9
20B
erry
and
Pim
ente
l19
85
332
Pty
choc
heilu
slu
cius
Col
orad
opi
kem
inno
wC
yprin
idae
RW
tunn
el;
abso
lute
spee
d
6710
.447
95%
con
f.=
45
- 49
4.5
26B
erry
and
Pim
ente
l19
85
333
Pty
choc
heilu
slu
cius
Col
orad
opi
kem
inno
wC
yprin
idae
RW
tunn
el;
abso
lute
spee
d
1941
.195
95%
con
f.=
90
- 10
32.
314
Ber
ry a
nd P
imen
tel
1985
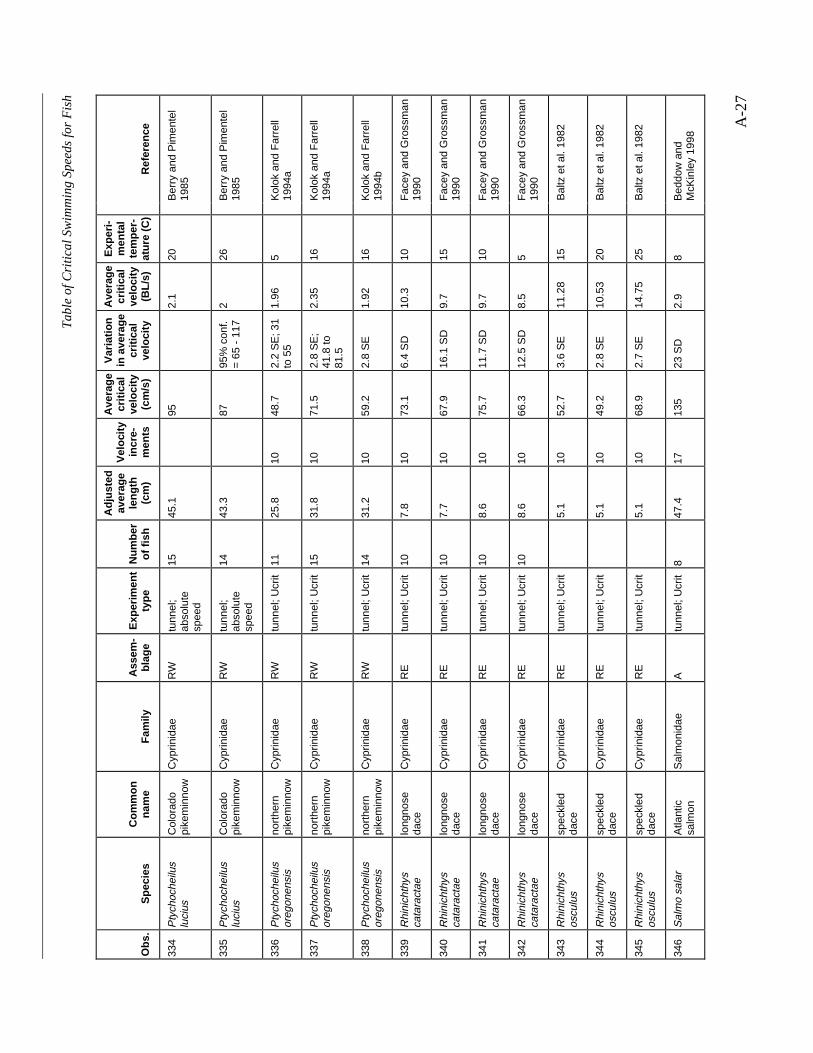
Ta
ble
of
Cri
tica
l Sw
imm
ing
Sp
ee
ds
for
Fis
h
A-2
7
Obs
.S
peci
esC
omm
onna
me
Fam
ilyA
ssem
-bl
age
Exp
erim
ent
type
Num
ber
of fi
sh
Adj
uste
dav
erag
ele
ngth
(cm
)
Vel
ocity
incr
e-m
ents
Ave
rage
criti
cal
velo
city
(cm
/s)
Var
iatio
nin
ave
rage
criti
cal
velo
city
Ave
rage
criti
cal
velo
city
(BL/
s)
Exp
eri-
men
tal
tem
per-
atur
e (C
)R
efer
ence
334
Pty
choc
heilu
slu
cius
Col
orad
opi
kem
inno
wC
yprin
idae
RW
tunn
el;
abso
lute
spee
d
1545
.195
2.1
20B
erry
and
Pim
ente
l19
85
335
Pty
choc
heilu
slu
cius
Col
orad
opi
kem
inno
wC
yprin
idae
RW
tunn
el;
abso
lute
spee
d
1443
.387
95%
con
f.=
65
- 11
72
26B
erry
and
Pim
ente
l19
85
336
Pty
choc
heilu
sor
egon
ensi
sno
rthe
rnpi
kem
inno
wC
yprin
idae
RW
tunn
el; U
crit
1125
.810
48.7
2.2
SE
; 31
to 5
51.
965
Kol
ok a
nd F
arre
ll19
94a
337
Pty
choc
heilu
sor
egon
ensi
sno
rthe
rnpi
kem
inno
wC
yprin
idae
RW
tunn
el; U
crit
1531
.810
71.5
2.8
SE
;41
.8 to
81.5
2.35
16K
olok
and
Far
rell
1994
a
338
Pty
choc
heilu
sor
egon
ensi
sno
rthe
rnpi
kem
inno
wC
yprin
idae
RW
tunn
el; U
crit
1431
.210
59.2
2.8
SE
1.92
16K
olok
and
Far
rell
1994
b
339
Rhi
nich
thys
cata
ract
aelo
ngno
seda
ceC
yprin
idae
RE
tunn
el; U
crit
107.
810
73.1
6.4
SD
10.3
10F
acey
and
Gro
ssm
an19
90
340
Rhi
nich
thys
cata
ract
aelo
ngno
seda
ceC
yprin
idae
RE
tunn
el; U
crit
107.
710
67.9
16.1
SD
9.7
15F
acey
and
Gro
ssm
an19
90
341
Rhi
nich
thys
cata
ract
aelo
ngno
seda
ceC
yprin
idae
RE
tunn
el; U
crit
108.
610
75.7
11.7
SD
9.7
10F
acey
and
Gro
ssm
an19
90
342
Rhi
nich
thys
cata
ract
aelo
ngno
seda
ceC
yprin
idae
RE
tunn
el; U
crit
108.
610
66.3
12.5
SD
8.5
5F
acey
and
Gro
ssm
an19
90
343
Rhi
nich
thys
oscu
lus
spec
kled
dace
Cyp
rinid
aeR
Etu
nnel
; Ucr
it5.
110
52.7
3.6
SE
11.2
815
Bal
tz e
t al.
1982
344
Rhi
nich
thys
oscu
lus
spec
kled
dace
Cyp
rinid
aeR
Etu
nnel
; Ucr
it5.
110
49.2
2.8
SE
10.5
320
Bal
tz e
t al.
1982
345
Rhi
nich
thys
oscu
lus
spec
kled
dace
Cyp
rinid
aeR
Etu
nnel
; Ucr
it5.
110
68.9
2.7
SE
14.7
525
Bal
tz e
t al.
1982
346
Sal
mo
sala
rA
tlant
icsa
lmon
Sal
mon
idae
Atu
nnel
; Ucr
it8
47.4
1713
523
SD
2.9
8B
eddo
w a
ndM
cKin
ley
1998

Ta
ble
of
Cri
tica
l Sw
imm
ing
Sp
ee
ds
for
Fis
h
A-2
8
Obs
.S
peci
esC
omm
onna
me
Fam
ilyA
ssem
-bl
age
Exp
erim
ent
type
Num
ber
of fi
sh
Adj
uste
dav
erag
ele
ngth
(cm
)
Vel
ocity
incr
e-m
ents
Ave
rage
criti
cal
velo
city
(cm
/s)
Var
iatio
nin
ave
rage
criti
cal
velo
city
Ave
rage
criti
cal
velo
city
(BL/
s)
Exp
eri-
men
tal
tem
per-
atur
e (C
)R
efer
ence
347
Sal
mo
sala
rA
tlant
icsa
lmon
Sal
mon
idae
Atu
nnel
; Ucr
it8
47.4
1712
916
SD
2.8
8B
eddo
w a
ndM
cKin
ley
1998
348
Sal
mo
sala
rA
tlant
icsa
lmon
Sal
mon
idae
Atu
nnel
; Ucr
it8
45.3
1715
325
SD
3.5
18B
eddo
w a
ndM
cKin
ley
1998
349
Sal
mo
sala
rA
tlant
icsa
lmon
Sal
mon
idae
Atu
nnel
; Ucr
it8
45.3
1713
618
SD
3.1
18B
eddo
w a
ndM
cKin
ley
1998
350
Sal
mo
sala
rA
tlant
icsa
lmon
Sal
mon
idae
Atu
nnel
; Ucr
it4
57.5
1017
60.
06 S
E3
12B
ooth
et a
l. 19
97
351
Sal
mo
sala
rA
tlant
icsa
lmon
Sal
mon
idae
Atu
nnel
; Ucr
it4
57.5
1021
60.
18 S
E3.
818
Boo
th e
t al.
1997
352
Sal
mo
trut
tabr
own
trou
tS
alm
onid
aeR
tunn
el; U
crit
1035
.010
784
SE
2.18
15B
utle
r et
al.
1992
353
Sal
mo
trut
tabr
own
trou
tS
alm
onid
aeR
tunn
el; U
crit
1435
.210
502
SE
1.42
15B
utle
r et
al.
1992
354
Sal
mo
trut
tabr
own
trou
tS
alm
onid
aeR
tunn
el; U
crit
1833
.710
622
SE
1.85
5B
utle
r et
al.
1992
355
Sal
mo
trut
tabr
own
trou
tS
alm
onid
aeR
tunn
el; U
crit
1432
.710
423
SE
1.27
5B
utle
r et
al.
1992
356
Sal
velin
us a
lpin
usA
rctic
cha
rS
alm
onid
aeR
Wtu
nnel
; Ucr
it11
36.6
1010
0.2
3.0
SE
2.8
12Jo
nes
et a
l. 19
74
357
Sal
velin
us a
lpin
usA
rctic
cha
rS
alm
onid
aeR
Wtu
nnel
; Ucr
it8
31.6
561
1.93
5B
eam
ish
1980
358
Sal
velin
us a
lpin
usA
rctic
cha
rS
alm
onid
aeR
Wtu
nnel
; Ucr
it9
31.6
567
2.12
10B
eam
ish
1980
359
Sal
velin
us a
lpin
usA
rctic
cha
rS
alm
onid
aeR
Wtu
nnel
; Ucr
it11
31.6
565
2.06
15B
eam
ish
1980
360
Sal
velin
usfo
ntin
alis
broo
k ch
ar(t
rout
)S
alm
onid
aeR
Etu
nnel
; Ucr
it6
8.2
511
1.34
5B
eam
ish
1980
361
Sal
velin
usfo
ntin
alis
broo
k ch
ar(t
rout
)S
alm
onid
aeR
Etu
nnel
; Ucr
it6
8.2
516
1.95
10B
eam
ish
1980
362
Sal
velin
usfo
ntin
alis
broo
k ch
ar(t
rout
)S
alm
onid
aeR
Etu
nnel
; Ucr
it16
8.2
534
4.15
15B
eam
ish
1980
363
Sal
velin
usla
ke tr
out
Sal
mon
idae
Ltu
nnel
; Ucr
it6
12.7
576
.52.
3 95
% C
L6
10B
eam
ish
et a
l. 19
89
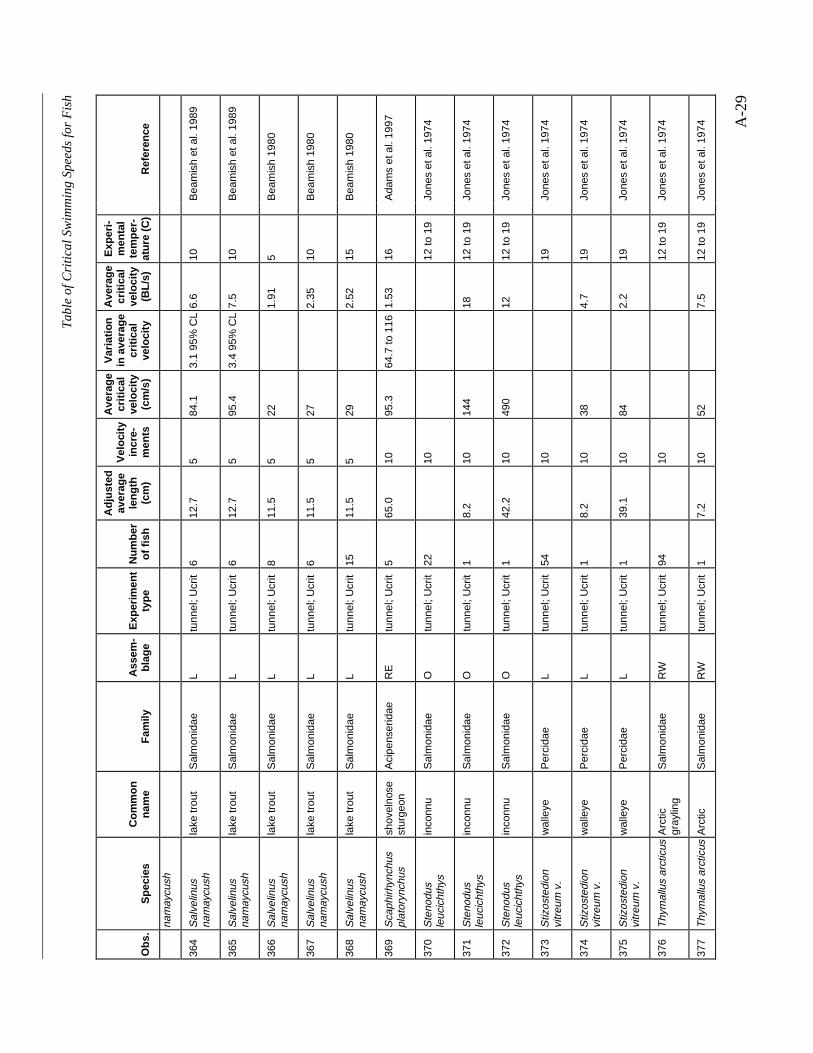
Ta
ble
of
Cri
tica
l Sw
imm
ing
Sp
ee
ds
for
Fis
h
A-2
9
Obs
.S
peci
esC
omm
onna
me
Fam
ilyA
ssem
-bl
age
Exp
erim
ent
type
Num
ber
of fi
sh
Adj
uste
dav
erag
ele
ngth
(cm
)
Vel
ocity
incr
e-m
ents
Ave
rage
criti
cal
velo
city
(cm
/s)
Var
iatio
nin
ave
rage
criti
cal
velo
city
Ave
rage
criti
cal
velo
city
(BL/
s)
Exp
eri-
men
tal
tem
per-
atur
e (C
)R
efer
ence
nam
aycu
sh
364
Sal
velin
usna
may
cush
lake
trou
tS
alm
onid
aeL
tunn
el; U
crit
612
.75
84.1
3.1
95%
CL
6.6
10B
eam
ish
et a
l. 19
89
365
Sal
velin
usna
may
cush
lake
trou
tS
alm
onid
aeL
tunn
el; U
crit
612
.75
95.4
3.4
95%
CL
7.5
10B
eam
ish
et a
l. 19
89
366
Sal
velin
usna
may
cush
lake
trou
tS
alm
onid
aeL
tunn
el; U
crit
811
.55
221.
915
Bea
mis
h 19
80
367
Sal
velin
usna
may
cush
lake
trou
tS
alm
onid
aeL
tunn
el; U
crit
611
.55
272.
3510
Bea
mis
h 19
80
368
Sal
velin
usna
may
cush
lake
trou
tS
alm
onid
aeL
tunn
el; U
crit
1511
.55
292.
5215
Bea
mis
h 19
80
369
Sca
phirh
ynch
uspl
ator
ynch
ussh
ovel
nose
stur
geon
Aci
pens
erid
aeR
Etu
nnel
; Ucr
it5
65.0
1095
.364
.7 to
116
1.53
16A
dam
s et
al.
1997
370
Ste
nodu
sle
ucic
hthy
sin
conn
uS
alm
onid
aeO
tunn
el; U
crit
2210
12 to
19
Jone
s et
al.
1974
371
Ste
nodu
sle
ucic
hthy
sin
conn
uS
alm
onid
aeO
tunn
el; U
crit
18.
210
144
1812
to 1
9Jo
nes
et a
l. 19
74
372
Ste
nodu
sle
ucic
hthy
sin
conn
uS
alm
onid
aeO
tunn
el; U
crit
142
.210
490
1212
to 1
9Jo
nes
et a
l. 19
74
373
Stiz
oste
dion
vitr
eum
v.
wal
leye
Per
cida
eL
tunn
el; U
crit
5410
19Jo
nes
et a
l. 19
74
374
Stiz
oste
dion
vitr
eum
v.
wal
leye
Per
cida
eL
tunn
el; U
crit
18.
210
384.
719
Jone
s et
al.
1974
375
Stiz
oste
dion
vitr
eum
v.
wal
leye
Per
cida
eL
tunn
el; U
crit
139
.110
842.
219
Jone
s et
al.
1974
376
Thy
mal
lus
arct
icus
Arc
ticgr
aylin
gS
alm
onid
aeR
Wtu
nnel
; Ucr
it94
1012
to 1
9Jo
nes
et a
l. 19
74
377
Thy
mal
lus
arct
icus
Arc
ticS
alm
onid
aeR
Wtu
nnel
; Ucr
it1
7.2
1052
7.5
12 to
19
Jone
s et
al.
1974
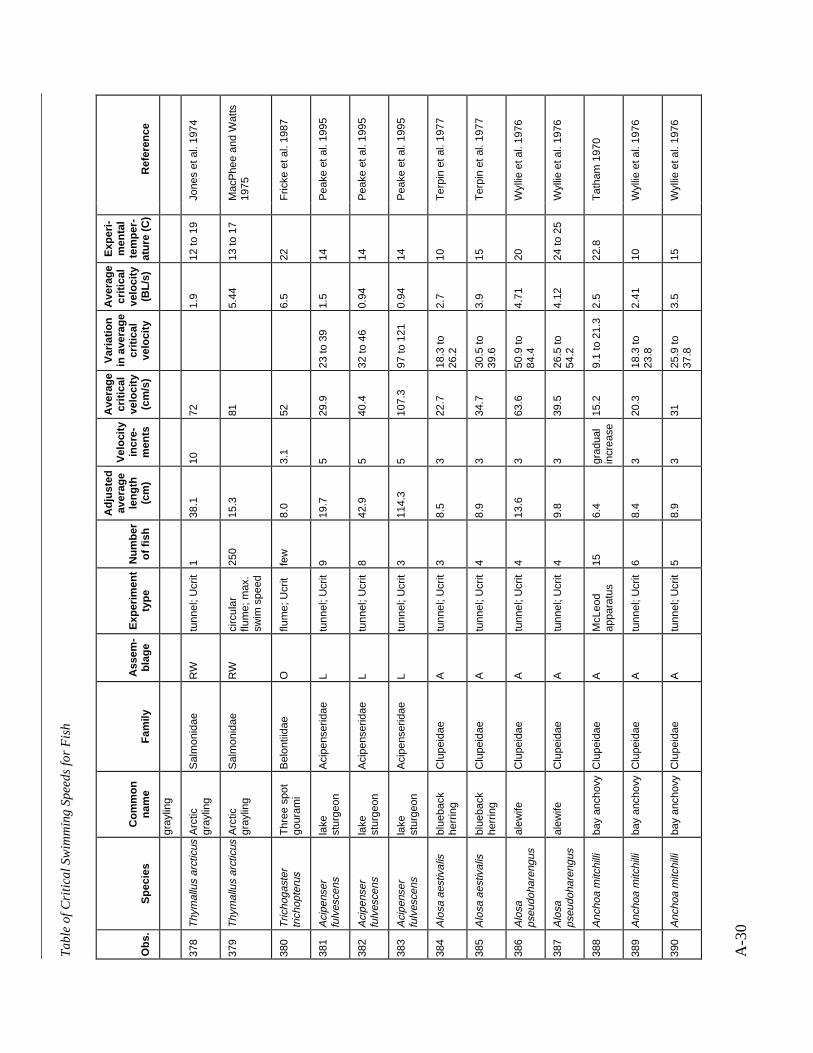
Ta
ble
of
Cri
tica
l Sw
imm
ing
Sp
ee
ds
for
Fis
h
A-3
0
Obs
.S
peci
esC
omm
onna
me
Fam
ilyA
ssem
-bl
age
Exp
erim
ent
type
Num
ber
of fi
sh
Adj
uste
dav
erag
ele
ngth
(cm
)
Vel
ocity
incr
e-m
ents
Ave
rage
criti
cal
velo
city
(cm
/s)
Var
iatio
nin
ave
rage
criti
cal
velo
city
Ave
rage
criti
cal
velo
city
(BL/
s)
Exp
eri-
men
tal
tem
per-
atur
e (C
)R
efer
ence
gray
ling
378
Thy
mal
lus
arct
icus
Arc
ticgr
aylin
gS
alm
onid
aeR
Wtu
nnel
; Ucr
it1
38.1
1072
1.9
12 to
19
Jone
s et
al.
1974
379
Thy
mal
lus
arct
icus
Arc
ticgr
aylin
gS
alm
onid
aeR
Wci
rcul
arflu
me;
max
.sw
im s
peed
250
15.3
815.
4413
to 1
7M
acP
hee
and
Wat
ts19
75
380
Tric
hoga
ster
tric
hopt
erus
Thr
ee s
pot
gour
ami
Bel
ontii
dae
Oflu
me;
Ucr
itfe
w8.
03.
152
6.5
22F
ricke
et a
l. 19
87
381
Aci
pens
erfu
lves
cens
lake
stur
geon
Aci
pens
erid
aeL
tunn
el; U
crit
919
.75
29.9
23 to
39
1.5
14P
eake
et a
l. 19
95
382
Aci
pens
erfu
lves
cens
lake
stur
geon
Aci
pens
erid
aeL
tunn
el; U
crit
842
.95
40.4
32 to
46
0.94
14P
eake
et a
l. 19
95
383
Aci
pens
erfu
lves
cens
lake
stur
geon
Aci
pens
erid
aeL
tunn
el; U
crit
311
4.3
510
7.3
97 to
121
0.94
14P
eake
et a
l. 19
95
384
Alo
sa a
estiv
alis
blue
back
herr
ing
Clu
peid
aeA
tunn
el; U
crit
38.
53
22.7
18.3
to26
.22.
710
Ter
pin
et a
l. 19
77
385
Alo
sa a
estiv
alis
blue
back
herr
ing
Clu
peid
aeA
tunn
el; U
crit
48.
93
34.7
30.5
to39
.63.
915
Ter
pin
et a
l. 19
77
386
Alo
saps
eudo
hare
ngus
alew
ifeC
lupe
idae
Atu
nnel
; Ucr
it4
13.6
363
.650
.9 to
84.4
4.71
20W
yllie
et a
l. 19
76
387
Alo
saps
eudo
hare
ngus
alew
ifeC
lupe
idae
Atu
nnel
; Ucr
it4
9.8
339
.526
.5 to
54.2
4.12
24 to
25
Wyl
lie e
t al.
1976
388
Anc
hoa
mitc
hilli
bay
anch
ovy
Clu
peid
aeA
McL
eod
appa
ratu
s15
6.4
grad
ual
incr
ease
15.2
9.1
to 2
1.3
2.5
22.8
Tat
ham
197
0
389
Anc
hoa
mitc
hilli
bay
anch
ovy
Clu
peid
aeA
tunn
el; U
crit
68.
43
20.3
18.3
to23
.82.
4110
Wyl
lie e
t al.
1976
390
Anc
hoa
mitc
hilli
bay
anch
ovy
Clu
peid
aeA
tunn
el; U
crit
58.
93
3125
.9 to
37.8
3.5
15W
yllie
et a
l. 19
76
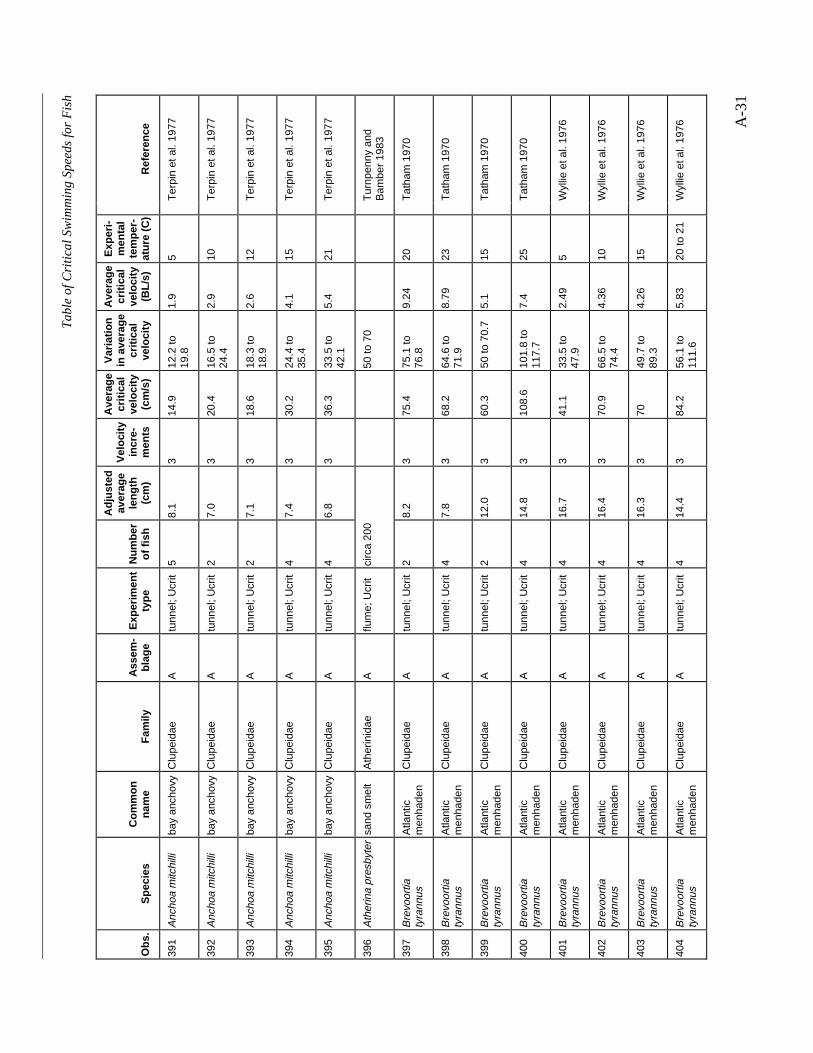
Ta
ble
of
Cri
tica
l Sw
imm
ing
Sp
ee
ds
for
Fis
h
A-3
1
Obs
.S
peci
esC
omm
onna
me
Fam
ilyA
ssem
-bl
age
Exp
erim
ent
type
Num
ber
of fi
sh
Adj
uste
dav
erag
ele
ngth
(cm
)
Vel
ocity
incr
e-m
ents
Ave
rage
criti
cal
velo
city
(cm
/s)
Var
iatio
nin
ave
rage
criti
cal
velo
city
Ave
rage
criti
cal
velo
city
(BL/
s)
Exp
eri-
men
tal
tem
per-
atur
e (C
)R
efer
ence
391
Anc
hoa
mitc
hilli
bay
anch
ovy
Clu
peid
aeA
tunn
el; U
crit
58.
13
14.9
12.2
to19
.81.
95
Ter
pin
et a
l. 19
77
392
Anc
hoa
mitc
hilli
bay
anch
ovy
Clu
peid
aeA
tunn
el; U
crit
27.
03
20.4
16.5
to24
.42.
910
Ter
pin
et a
l. 19
77
393
Anc
hoa
mitc
hilli
bay
anch
ovy
Clu
peid
aeA
tunn
el; U
crit
27.
13
18.6
18.3
to18
.92.
612
Ter
pin
et a
l. 19
77
394
Anc
hoa
mitc
hilli
bay
anch
ovy
Clu
peid
aeA
tunn
el; U
crit
47.
43
30.2
24.4
to35
.44.
115
Ter
pin
et a
l. 19
77
395
Anc
hoa
mitc
hilli
bay
anch
ovy
Clu
peid
aeA
tunn
el; U
crit
46.
83
36.3
33.5
to42
.15.
421
Ter
pin
et a
l. 19
77
396
Ath
erin
a pr
esby
ter
sand
sm
elt
Ath
erin
idae
Aflu
me;
Ucr
itci
rca
200
50 to
70
Tur
npen
ny a
ndB
ambe
r 19
83
397
Bre
voor
tiaty
rann
usA
tlant
icm
enha
den
Clu
peid
aeA
tunn
el; U
crit
28.
23
75.4
75.1
to76
.89.
2420
Tat
ham
197
0
398
Bre
voor
tiaty
rann
usA
tlant
icm
enha
den
Clu
peid
aeA
tunn
el; U
crit
47.
83
68.2
64.6
to71
.98.
7923
Tat
ham
197
0
399
Bre
voor
tiaty
rann
usA
tlant
icm
enha
den
Clu
peid
aeA
tunn
el; U
crit
212
.03
60.3
50 to
70.
75.
115
Tat
ham
197
0
400
Bre
voor
tiaty
rann
usA
tlant
icm
enha
den
Clu
peid
aeA
tunn
el; U
crit
414
.83
108.
610
1.8
to11
7.7
7.4
25T
atha
m 1
970
401
Bre
voor
tiaty
rann
usA
tlant
icm
enha
den
Clu
peid
aeA
tunn
el; U
crit
416
.73
41.1
33.5
to47
.92.
495
Wyl
lie e
t al.
1976
402
Bre
voor
tiaty
rann
usA
tlant
icm
enha
den
Clu
peid
aeA
tunn
el; U
crit
416
.43
70.9
66.5
to74
.44.
3610
Wyl
lie e
t al.
1976
403
Bre
voor
tiaty
rann
usA
tlant
icm
enha
den
Clu
peid
aeA
tunn
el; U
crit
416
.33
7049
.7 to
89.3
4.26
15W
yllie
et a
l. 19
76
404
Bre
voor
tiaty
rann
usA
tlant
icm
enha
den
Clu
peid
aeA
tunn
el; U
crit
414
.43
84.2
56.1
to11
1.6
5.83
20 to
21
Wyl
lie e
t al.
1976
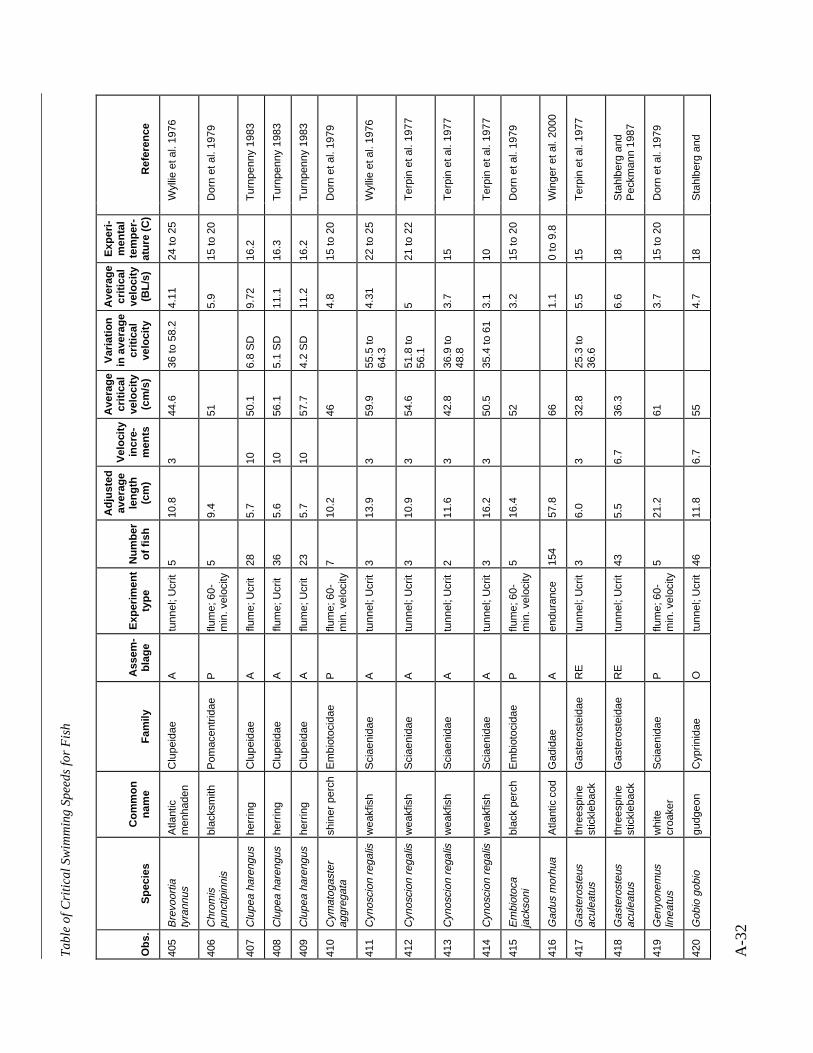
Ta
ble
of
Cri
tica
l Sw
imm
ing
Sp
ee
ds
for
Fis
h
A-3
2
Obs
.S
peci
esC
omm
onna
me
Fam
ilyA
ssem
-bl
age
Exp
erim
ent
type
Num
ber
of fi
sh
Adj
uste
dav
erag
ele
ngth
(cm
)
Vel
ocity
incr
e-m
ents
Ave
rage
criti
cal
velo
city
(cm
/s)
Var
iatio
nin
ave
rage
criti
cal
velo
city
Ave
rage
criti
cal
velo
city
(BL/
s)
Exp
eri-
men
tal
tem
per-
atur
e (C
)R
efer
ence
405
Bre
voor
tiaty
rann
usA
tlant
icm
enha
den
Clu
peid
aeA
tunn
el; U
crit
510
.83
44.6
36 to
58.
24.
1124
to 2
5W
yllie
et a
l. 19
76
406
Chr
omis
punc
tipin
nis
blac
ksm
ithP
omac
entr
idae
Pflu
me;
60-
min
. vel
ocity
59.
451
5.9
15 to
20
Dor
n et
al.
1979
407
Clu
pea
hare
ngus
herr
ing
Clu
peid
aeA
flum
e; U
crit
285.
710
50.1
6.8
SD
9.72
16.2
Tur
npen
ny 1
983
408
Clu
pea
hare
ngus
herr
ing
Clu
peid
aeA
flum
e; U
crit
365.
610
56.1
5.1
SD
11.1
16.3
Tur
npen
ny 1
983
409
Clu
pea
hare
ngus
herr
ing
Clu
peid
aeA
flum
e; U
crit
235.
710
57.7
4.2
SD
11.2
16.2
Tur
npen
ny 1
983
410
Cym
atog
aste
rag
greg
ata
shin
er p
erch
Em
biot
ocid
aeP
flum
e; 6
0-m
in. v
eloc
ity7
10.2
464.
815
to 2
0D
orn
et a
l. 19
79
411
Cyn
osci
on r
egal
isw
eakf
ish
Sci
aeni
dae
Atu
nnel
; Ucr
it3
13.9
359
.955
.5 to
64.3
4.31
22 to
25
Wyl
lie e
t al.
1976
412
Cyn
osci
on r
egal
isw
eakf
ish
Sci
aeni
dae
Atu
nnel
; Ucr
it3
10.9
354
.651
.8 to
56.1
521
to 2
2T
erpi
n et
al.
1977
413
Cyn
osci
on r
egal
isw
eakf
ish
Sci
aeni
dae
Atu
nnel
; Ucr
it2
11.6
342
.836
.9 to
48.8
3.7
15T
erpi
n et
al.
1977
414
Cyn
osci
on r
egal
isw
eakf
ish
Sci
aeni
dae
Atu
nnel
; Ucr
it3
16.2
350
.535
.4 to
61
3.1
10T
erpi
n et
al.
1977
415
Em
biot
oca
jack
soni
blac
k pe
rch
Em
biot
ocid
aeP
flum
e; 6
0-m
in. v
eloc
ity5
16.4
523.
215
to 2
0D
orn
et a
l. 19
79
416
Gad
us m
orhu
aA
tlant
ic c
odG
adid
aeA
endu
ranc
e15
457
.866
1.1
0 to
9.8
Win
ger
et a
l. 20
00
417
Gas
tero
steu
sac
ulea
tus
thre
espi
nest
ickl
ebac
kG
aste
rost
eida
eR
Etu
nnel
; Ucr
it3
6.0
332
.825
.3 to
36.6
5.5
15T
erpi
n et
al.
1977
418
Gas
tero
steu
sac
ulea
tus
thre
espi
nest
ickl
ebac
kG
aste
rost
eida
eR
Etu
nnel
; Ucr
it43
5.5
6.7
36.3
6.6
18S
tahl
berg
and
Pec
kman
n 19
87
419
Gen
yone
mus
linea
tus
whi
tecr
oake
rS
ciae
nida
eP
flum
e; 6
0-m
in. v
eloc
ity5
21.2
613.
715
to 2
0D
orn
et a
l. 19
79
420
Gob
io g
obio
gudg
eon
Cyp
rinid
aeO
tunn
el; U
crit
4611
.86.
755
4.7
18S
tahl
berg
and
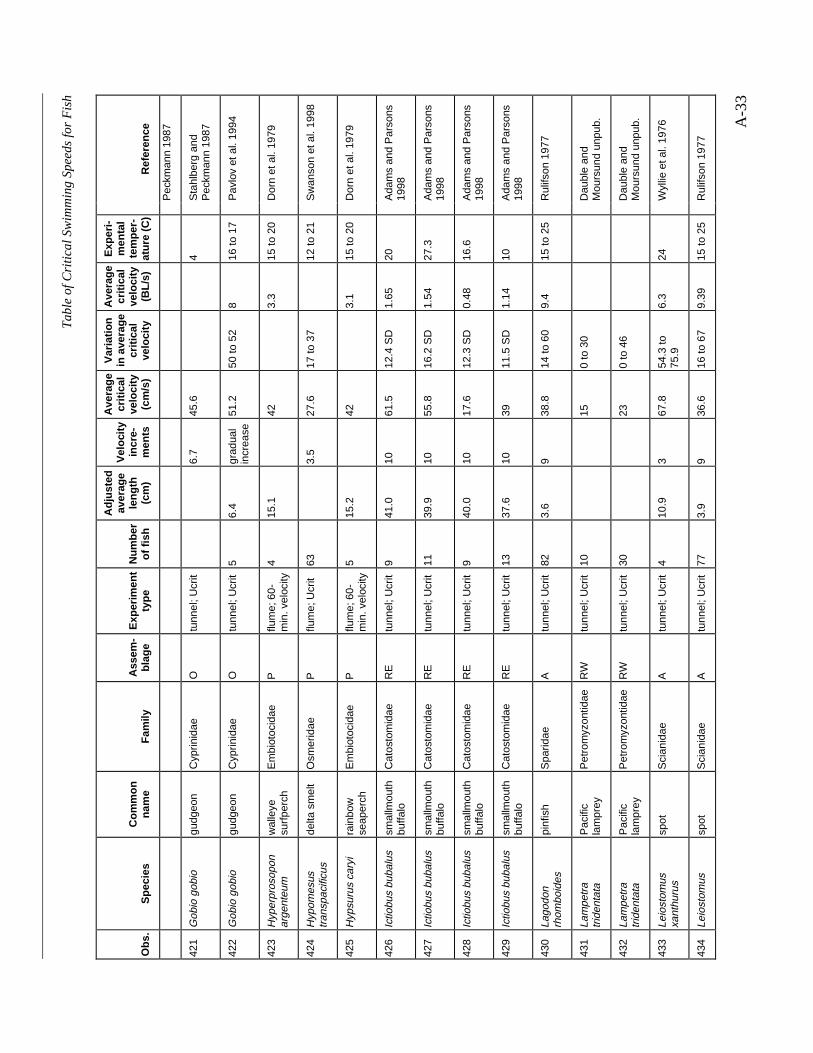
Ta
ble
of
Cri
tica
l Sw
imm
ing
Sp
ee
ds
for
Fis
h
A-3
3
Obs
.S
peci
esC
omm
onna
me
Fam
ilyA
ssem
-bl
age
Exp
erim
ent
type
Num
ber
of fi
sh
Adj
uste
dav
erag
ele
ngth
(cm
)
Vel
ocity
incr
e-m
ents
Ave
rage
criti
cal
velo
city
(cm
/s)
Var
iatio
nin
ave
rage
criti
cal
velo
city
Ave
rage
criti
cal
velo
city
(BL/
s)
Exp
eri-
men
tal
tem
per-
atur
e (C
)R
efer
ence
Pec
kman
n 19
87
421
Gob
io g
obio
gudg
eon
Cyp
rinid
aeO
tunn
el; U
crit
6.7
45.6
4S
tahl
berg
and
Pec
kman
n 19
87
422
Gob
io g
obio
gudg
eon
Cyp
rinid
aeO
tunn
el; U
crit
56.
4gr
adua
lin
crea
se51
.250
to 5
28
16 to
17
Pav
lov
et a
l. 19
94
423
Hyp
erpr
osop
onar
gent
eum
wal
leye
surf
perc
hE
mbi
otoc
idae
Pflu
me;
60-
min
. vel
ocity
415
.142
3.3
15 to
20
Dor
n et
al.
1979
424
Hyp
omes
ustr
ansp
acifi
cus
delta
sm
elt
Osm
erid
aeP
flum
e; U
crit
633.
527
.617
to 3
712
to 2
1S
wan
son
et a
l. 19
98
425
Hyp
suru
s ca
ryi
rain
bow
seap
erch
Em
biot
ocid
aeP
flum
e; 6
0-m
in. v
eloc
ity5
15.2
423.
115
to 2
0D
orn
et a
l. 19
79
426
Ictio
bus
buba
lus
smal
lmou
thbu
ffalo
Cat
osto
mid
aeR
Etu
nnel
; Ucr
it9
41.0
1061
.512
.4 S
D1.
6520
Ada
ms
and
Par
sons
1998
427
Ictio
bus
buba
lus
smal
lmou
thbu
ffalo
Cat
osto
mid
aeR
Etu
nnel
; Ucr
it11
39.9
1055
.816
.2 S
D1.
5427
.3A
dam
s an
d P
arso
ns19
98
428
Ictio
bus
buba
lus
smal
lmou
thbu
ffalo
Cat
osto
mid
aeR
Etu
nnel
; Ucr
it9
40.0
1017
.612
.3 S
D0.
4816
.6A
dam
s an
d P
arso
ns19
98
429
Ictio
bus
buba
lus
smal
lmou
thbu
ffalo
Cat
osto
mid
aeR
Etu
nnel
; Ucr
it13
37.6
1039
11.5
SD
1.14
10A
dam
s an
d P
arso
ns19
98
430
Lago
don
rhom
boid
espi
nfis
hS
parid
aeA
tunn
el; U
crit
823.
69
38.8
14 to
60
9.4
15 to
25
Rul
ifson
197
7
431
Lam
petr
atr
iden
tata
Pac
ific
lam
prey
Pet
rom
yzon
tidae
RW
tunn
el; U
crit
1015
0 to
30
Dau
ble
and
Mou
rsun
d un
pub.
432
Lam
petr
atr
iden
tata
Pac
ific
lam
prey
Pet
rom
yzon
tidae
RW
tunn
el; U
crit
3023
0 to
46
Dau
ble
and
Mou
rsun
d un
pub.
433
Leio
stom
usxa
nthu
rus
spot
Sci
anid
aeA
tunn
el; U
crit
410
.93
67.8
54.3
to75
.96.
324
Wyl
lie e
t al.
1976
434
Leio
stom
ussp
otS
cian
idae
Atu
nnel
; Ucr
it77
3.9
936
.616
to 6
79.
3915
to 2
5R
ulifs
on 1
977

Ta
ble
of
Cri
tica
l Sw
imm
ing
Sp
ee
ds
for
Fis
h
A-3
4
Obs
.S
peci
esC
omm
onna
me
Fam
ilyA
ssem
-bl
age
Exp
erim
ent
type
Num
ber
of fi
sh
Adj
uste
dav
erag
ele
ngth
(cm
)
Vel
ocity
incr
e-m
ents
Ave
rage
criti
cal
velo
city
(cm
/s)
Var
iatio
nin
ave
rage
criti
cal
velo
city
Ave
rage
criti
cal
velo
city
(BL/
s)
Exp
eri-
men
tal
tem
per-
atur
e (C
)R
efer
ence
xant
huru
s
435
Leuc
aspi
usde
linea
tus
verk
hovk
aC
yprin
idae
Otu
nnel
; Ucr
it6
2.5
grad
ual
incr
ease
30.3
26 to
35
12.1
19 to
21
Pav
lov
et a
l. 19
72
436
Leuc
aspi
usde
linea
tus
verk
hovk
aC
yprin
idae
Otu
nnel
; Ucr
it38
5.1
6.7
38.6
7.7
18S
tahl
berg
and
Pec
kman
n 19
87
437
Leuc
aspi
usde
linea
tus
verk
hovk
aC
yprin
idae
Otu
nnel
; Ucr
it6.
722
.74
Sta
hlbe
rg a
ndP
eckm
ann
1987
438
Leuc
aspi
usde
linea
tus
verk
hovk
aC
yprin
idae
Otu
nnel
; Ucr
it76
4.9
6.7
387.
818
Sta
hlbe
rg a
ndP
eckm
ann
1987
439
Leuc
aspi
usde
linea
tus
verk
hovk
aC
yprin
idae
Otu
nnel
; Ucr
it13
75.
06.
740
.18.
118
Sta
hlbe
rg a
ndP
eckm
ann
1987
440
Mem
bras
mar
tinic
aro
ugh
silv
ersi
deA
ther
inid
aeA
McL
eod
appa
ratu
s8
9.4
grad
ual
incr
ease
21.3
18.3
to24
.42.
324
.4T
atha
m 1
970
441
Men
idia
men
idia
Atla
ntic
silv
ersi
deA
ther
inid
aeA
tunn
el; U
crit
710
.13
28.2
24.7
to32
.62.
794
Wyl
lie e
t al.
1976
442
Men
idia
men
idia
Atla
ntic
silv
ersi
deA
ther
inid
aeA
tunn
el; U
crit
410
.73
43.3
38.4
to48
.43.
486.
2 to
7W
yllie
et a
l. 19
76
443
Men
idia
men
idia
Atla
ntic
silv
ersi
deA
ther
inid
aeA
tunn
el; U
crit
1310
.73
38.3
26.8
to49
.73.
618
to 9
Wyl
lie e
t al.
1976
444
Men
idia
men
idia
Atla
ntic
silv
ersi
deA
ther
inid
aeA
tunn
el; U
crit
410
.93
43.4
30.5
to55
.84.
0710
Wyl
lie e
t al.
1976
445
Men
idia
men
idia
Atla
ntic
silv
ersi
deA
ther
inid
aeA
tunn
el; U
crit
212
.03
7167
.1 to
75
5.92
20 to
21
Wyl
lie e
t al.
1976
446
Men
idia
men
idia
Atla
ntic
silv
ersi
deA
ther
inid
aeA
tunn
el; U
crit
29.
83
35.5
34.4
to36
.63.
735
Ter
pin
et a
l. 19
77
447
Men
idia
men
idia
Atla
ntic
silv
ersi
deA
ther
inid
aeA
tunn
el; U
crit
410
.03
44.6
39.9
to55
.84.
5110
Ter
pin
et a
l. 19
77
448
Men
idia
tidew
ater
Ath
erin
idae
AM
cLeo
d12
6.4
grad
ual
51.8
39.6
to8.
422
.8T
atha
m 1
970

Ta
ble
of
Cri
tica
l Sw
imm
ing
Sp
ee
ds
for
Fis
h
A-3
5
Obs
.S
peci
esC
omm
onna
me
Fam
ilyA
ssem
-bl
age
Exp
erim
ent
type
Num
ber
of fi
sh
Adj
uste
dav
erag
ele
ngth
(cm
)
Vel
ocity
incr
e-m
ents
Ave
rage
criti
cal
velo
city
(cm
/s)
Var
iatio
nin
ave
rage
criti
cal
velo
city
Ave
rage
criti
cal
velo
city
(BL/
s)
Exp
eri-
men
tal
tem
per-
atur
e (C
)R
efer
ence
peni
nsul
aesi
lver
side
appa
ratu
sin
crea
se57
.9
449
Men
ticirr
hus
saxa
tilis
nort
hern
king
fish
Sci
anid
aeA
tunn
el; U
crit
39.
63
59.7
52.1
to65
.26.
3222
to 2
5W
yllie
et a
l. 19
76
450
Mor
one
amer
ican
aw
hite
per
chP
erci
chth
yida
eA
McL
eod
appa
ratu
s42
4.0
grad
ual
incr
ease
19.6
9.1
to 3
0.5
5.1
23.9
Tat
ham
197
0
451
Mor
one
amer
ican
aw
hite
per
chP
erci
chth
yida
eA
McL
eod
appa
ratu
s33
3.9
grad
ual
incr
ease
21.9
15.2
to27
.45.
826
.7T
atha
m 1
970
452
Mor
one
amer
ican
aw
hite
per
chP
erci
chth
yida
eA
McL
eod
appa
ratu
s57
6.3
grad
ual
incr
ease
30.3
21.3
to39
.65
26.7
Tat
ham
197
0
453
Mor
one
amer
ican
aw
hite
per
chP
erci
chth
yida
eA
McL
eod
appa
ratu
s27
4.5
grad
ual
incr
ease
2618
.3 to
39.6
5.9
29.4
Tat
ham
197
0
454
Mor
one
amer
ican
aw
hite
per
chP
erci
chth
yida
eA
McL
eod
appa
ratu
s15
5.8
grad
ual
incr
ease
32.3
30.5
to36
.65.
829
.4T
atha
m 1
970
455
Mor
one
amer
ican
aw
hite
per
chP
erci
chth
yida
eA
McL
eod
appa
ratu
s30
6.8
grad
ual
incr
ease
35.7
27.4
to42
.75.
429
.4T
atha
m 1
970
456
Mor
one
amer
ican
aw
hite
per
chP
erci
chth
yida
eA
McL
eod
appa
ratu
s48
7.6
grad
ual
incr
ease
37.8
27.4
to45
.75.
129
.4T
atha
m 1
970
457
Mor
one
amer
ican
aw
hite
per
chP
erci
chth
yida
eA
McL
eod
appa
ratu
s21
4.7
grad
ual
incr
ease
26.5
21.3
to30
.55.
832
.2T
atha
m 1
970
458
Mor
one
amer
ican
aw
hite
per
chP
erci
chth
yida
eA
McL
eod
appa
ratu
s29
5.6
grad
ual
incr
ease
35.7
27.4
to39
.66.
632
.2T
atha
m 1
970
459
Mor
one
amer
ican
aw
hite
per
chP
erci
chth
yida
eA
McL
eod
appa
ratu
s21
6.6
grad
ual
incr
ease
33.5
27.4
to39
.65.
232
.2T
atha
m 1
970
460
Mor
one
amer
ican
aw
hite
per
chP
erci
chth
yida
eA
McL
eod
appa
ratu
s18
8.0
grad
ual
incr
ease
3936
.6 to
42.7
532
.2T
atha
m 1
970
461
Mor
one
amer
ican
aw
hite
per
chP
erci
chth
yida
eA
tunn
el; U
crit
412
.23
35.7
24.4
to42
.73
5T
erpi
n et
al.
1977
462
Mor
one
whi
te p
erch
Per
cich
thyi
dae
Atu
nnel
; Ucr
it4
12.3
342
32.9
to3.
810
Ter
pin
et a
l. 19
77
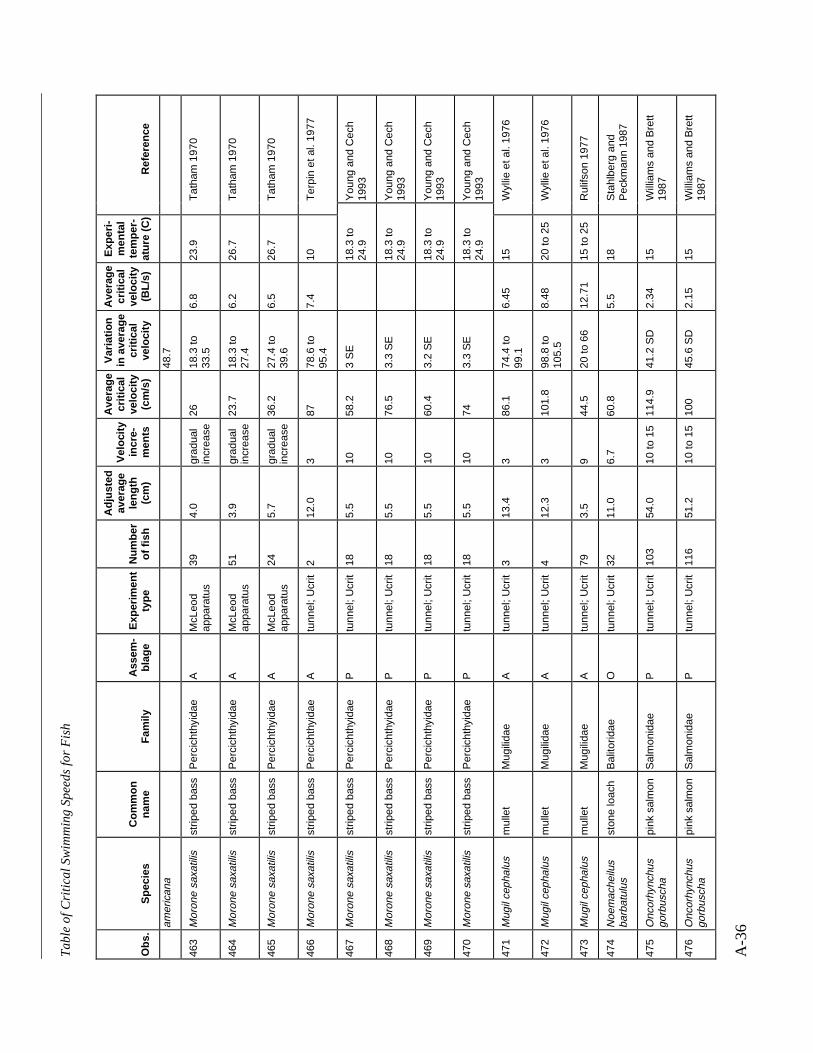
Ta
ble
of
Cri
tica
l Sw
imm
ing
Sp
ee
ds
for
Fis
h
A-3
6
Obs
.S
peci
esC
omm
onna
me
Fam
ilyA
ssem
-bl
age
Exp
erim
ent
type
Num
ber
of fi
sh
Adj
uste
dav
erag
ele
ngth
(cm
)
Vel
ocity
incr
e-m
ents
Ave
rage
criti
cal
velo
city
(cm
/s)
Var
iatio
nin
ave
rage
criti
cal
velo
city
Ave
rage
criti
cal
velo
city
(BL/
s)
Exp
eri-
men
tal
tem
per-
atur
e (C
)R
efer
ence
amer
ican
a48
.7
463
Mor
one
saxa
tilis
strip
ed b
ass
Per
cich
thyi
dae
AM
cLeo
dap
para
tus
394.
0gr
adua
lin
crea
se26
18.3
to33
.56.
823
.9T
atha
m 1
970
464
Mor
one
saxa
tilis
strip
ed b
ass
Per
cich
thyi
dae
AM
cLeo
dap
para
tus
513.
9gr
adua
lin
crea
se23
.718
.3 to
27.4
6.2
26.7
Tat
ham
197
0
465
Mor
one
saxa
tilis
strip
ed b
ass
Per
cich
thyi
dae
AM
cLeo
dap
para
tus
245.
7gr
adua
lin
crea
se36
.227
.4 to
39.6
6.5
26.7
Tat
ham
197
0
466
Mor
one
saxa
tilis
strip
ed b
ass
Per
cich
thyi
dae
Atu
nnel
; Ucr
it2
12.0
387
78.6
to95
.47.
410
Ter
pin
et a
l. 19
77
467
Mor
one
saxa
tilis
strip
ed b
ass
Per
cich
thyi
dae
Ptu
nnel
; Ucr
it18
5.5
1058
.23
SE
18.3
to24
.9Y
oung
and
Cec
h19
93
468
Mor
one
saxa
tilis
strip
ed b
ass
Per
cich
thyi
dae
Ptu
nnel
; Ucr
it18
5.5
1076
.53.
3 S
E18
.3 to
24.9
You
ng a
nd C
ech
1993
469
Mor
one
saxa
tilis
strip
ed b
ass
Per
cich
thyi
dae
Ptu
nnel
; Ucr
it18
5.5
1060
.43.
2 S
E18
.3 to
24.9
You
ng a
nd C
ech
1993
470
Mor
one
saxa
tilis
strip
ed b
ass
Per
cich
thyi
dae
Ptu
nnel
; Ucr
it18
5.5
1074
3.3
SE
18.3
to24
.9Y
oung
and
Cec
h19
93
471
Mug
il ce
phal
usm
ulle
tM
ugili
dae
Atu
nnel
; Ucr
it3
13.4
386
.174
.4 to
99.1
6.45
15W
yllie
et a
l. 19
76
472
Mug
il ce
phal
usm
ulle
tM
ugili
dae
Atu
nnel
; Ucr
it4
12.3
310
1.8
98.8
to10
5.5
8.48
20 to
25
Wyl
lie e
t al.
1976
473
Mug
il ce
phal
usm
ulle
tM
ugili
dae
Atu
nnel
; Ucr
it79
3.5
944
.520
to 6
612
.71
15 to
25
Rul
ifson
197
7
474
Noe
mac
heilu
sba
rbat
ulus
ston
e lo
ach
Bal
itorid
aeO
tunn
el; U
crit
3211
.06.
760
.85.
518
Sta
hlbe
rg a
ndP
eckm
ann
1987
475
Onc
orhy
nchu
sgo
rbus
cha
pink
sal
mon
Sal
mon
idae
Ptu
nnel
; Ucr
it10
354
.010
to 1
511
4.9
41.2
SD
2.34
15W
illia
ms
and
Bre
tt19
87
476
Onc
orhy
nchu
sgo
rbus
cha
pink
sal
mon
Sal
mon
idae
Ptu
nnel
; Ucr
it11
651
.210
to 1
510
045
.6 S
D2.
1515
Will
iam
s an
d B
rett
1987
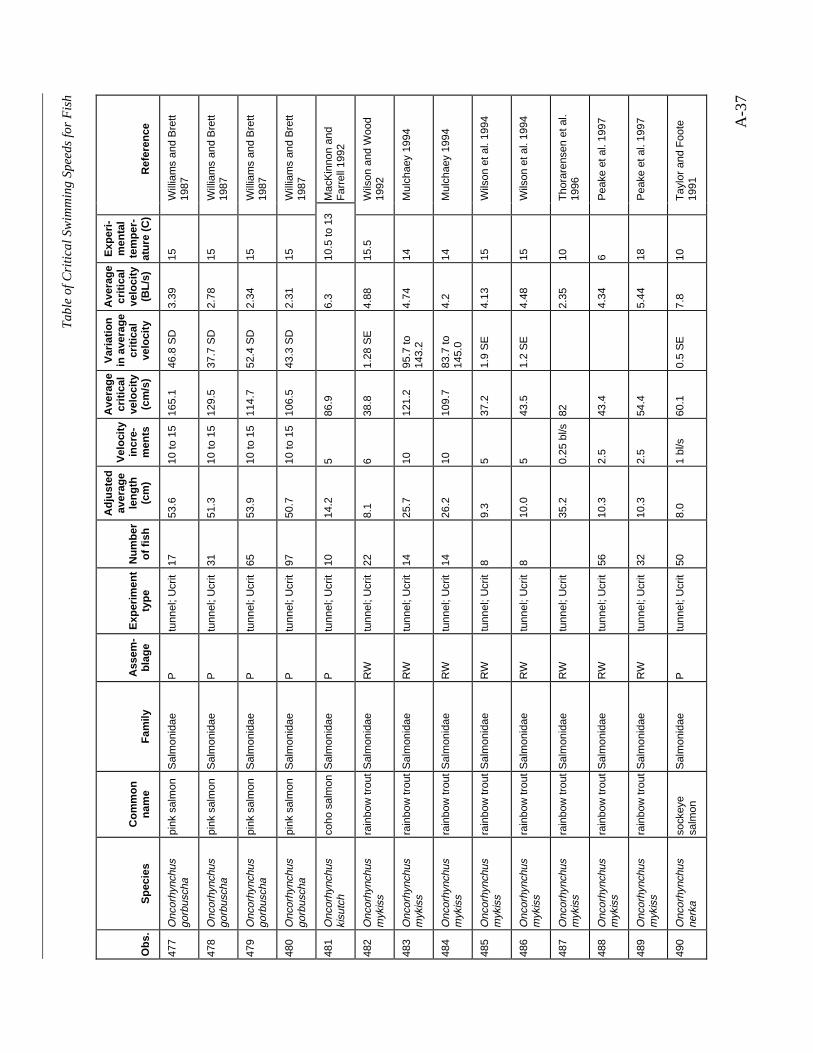
Ta
ble
of
Cri
tica
l Sw
imm
ing
Sp
ee
ds
for
Fis
h
A-3
7
Obs
.S
peci
esC
omm
onna
me
Fam
ilyA
ssem
-bl
age
Exp
erim
ent
type
Num
ber
of fi
sh
Adj
uste
dav
erag
ele
ngth
(cm
)
Vel
ocity
incr
e-m
ents
Ave
rage
criti
cal
velo
city
(cm
/s)
Var
iatio
nin
ave
rage
criti
cal
velo
city
Ave
rage
criti
cal
velo
city
(BL/
s)
Exp
eri-
men
tal
tem
per-
atur
e (C
)R
efer
ence
477
Onc
orhy
nchu
sgo
rbus
cha
pink
sal
mon
Sal
mon
idae
Ptu
nnel
; Ucr
it17
53.6
10 to
15
165.
146
.8 S
D3.
3915
Will
iam
s an
d B
rett
1987
478
Onc
orhy
nchu
sgo
rbus
cha
pink
sal
mon
Sal
mon
idae
Ptu
nnel
; Ucr
it31
51.3
10 to
15
129.
537
.7 S
D2.
7815
Will
iam
s an
d B
rett
1987
479
Onc
orhy
nchu
sgo
rbus
cha
pink
sal
mon
Sal
mon
idae
Ptu
nnel
; Ucr
it65
53.9
10 to
15
114.
752
.4 S
D2.
3415
Will
iam
s an
d B
rett
1987
480
Onc
orhy
nchu
sgo
rbus
cha
pink
sal
mon
Sal
mon
idae
Ptu
nnel
; Ucr
it97
50.7
10 to
15
106.
543
.3 S
D2.
3115
Will
iam
s an
d B
rett
1987
481
Onc
orhy
nchu
ski
sutc
hco
ho s
alm
onS
alm
onid
aeP
tunn
el; U
crit
1014
.25
86.9
6.3
10.5
to 1
3M
acK
inno
n an
dF
arre
ll 19
92
482
Onc
orhy
nchu
sm
ykis
sra
inbo
w tr
out
Sal
mon
idae
RW
tunn
el; U
crit
228.
16
38.8
1.28
SE
4.88
15.5
Wils
on a
nd W
ood
1992
483
Onc
orhy
nchu
sm
ykis
sra
inbo
w tr
out
Sal
mon
idae
RW
tunn
el; U
crit
1425
.710
121.
295
.7 to
143.
24.
7414
Mul
chae
y 19
94
484
Onc
orhy
nchu
sm
ykis
sra
inbo
w tr
out
Sal
mon
idae
RW
tunn
el; U
crit
1426
.210
109.
783
.7 to
145.
04.
214
Mul
chae
y 19
94
485
Onc
orhy
nchu
sm
ykis
sra
inbo
w tr
out
Sal
mon
idae
RW
tunn
el; U
crit
89.
35
37.2
1.9
SE
4.13
15W
ilson
et a
l. 19
94
486
Onc
orhy
nchu
sm
ykis
sra
inbo
w tr
out
Sal
mon
idae
RW
tunn
el; U
crit
810
.05
43.5
1.2
SE
4.48
15W
ilson
et a
l. 19
94
487
Onc
orhy
nchu
sm
ykis
sra
inbo
w tr
out
Sal
mon
idae
RW
tunn
el; U
crit
35.2
0.25
bl/s
822.
3510
Tho
rare
nsen
et a
l.19
96
488
Onc
orhy
nchu
sm
ykis
sra
inbo
w tr
out
Sal
mon
idae
RW
tunn
el; U
crit
5610
.32.
543
.44.
346
Pea
ke e
t al.
1997
489
Onc
orhy
nchu
sm
ykis
sra
inbo
w tr
out
Sal
mon
idae
RW
tunn
el; U
crit
3210
.32.
554
.45.
4418
Pea
ke e
t al.
1997
490
Onc
orhy
nchu
sne
rka
sock
eye
salm
onS
alm
onid
aeP
tunn
el; U
crit
508.
01
bl/s
60.1
0.5
SE
7.8
10T
aylo
r an
d F
oote
1991

Ta
ble
of
Cri
tica
l Sw
imm
ing
Sp
ee
ds
for
Fis
h
A-3
8
Obs
.S
peci
esC
omm
onna
me
Fam
ilyA
ssem
-bl
age
Exp
erim
ent
type
Num
ber
of fi
sh
Adj
uste
dav
erag
ele
ngth
(cm
)
Vel
ocity
incr
e-m
ents
Ave
rage
criti
cal
velo
city
(cm
/s)
Var
iatio
nin
ave
rage
criti
cal
velo
city
Ave
rage
criti
cal
velo
city
(BL/
s)
Exp
eri-
men
tal
tem
per-
atur
e (C
)R
efer
ence
491
Onc
orhy
nchu
sne
rka
koka
nee
Sal
mon
idae
Ltu
nnel
; Ucr
it50
8.0
1 bl
/s53
.30.
53 S
E6.
810
Tay
lor
and
Foo
te19
91
492
Pep
rilus
tria
cant
hus
butte
rfis
hS
trom
atei
dae
Atu
nnel
; Ucr
it3
9.9
354
.733
.3 to
69.2
5.57
20W
yllie
et a
l. 19
76
493
Pep
rilus
tria
cant
hus
butte
rfis
hS
trom
atei
dae
Atu
nnel
; Ucr
it2
9.3
378
.871
.3 to
86.3
8.5
23T
erpi
n et
al.
1977
494
Per
ca fl
uvia
talis
Eur
opea
npe
rch
Per
cida
eO
tunn
el; U
crit
55.
4gr
adua
lin
crea
se58
.255
to 6
210
.819
to 2
1P
avlo
v et
al.
1972
495
Per
ca fl
uvia
talis
Eur
opea
npe
rch
Per
cida
eO
tunn
el; U
crit
43.
5gr
adua
lin
crea
se43
37 to
49
12.3
19 to
21
Pav
lov
et a
l. 19
72
496
Per
ca fl
uvia
talis
Eur
opea
npe
rch
Per
cida
eO
tunn
el; U
crit
34.
5gr
adua
lin
crea
se65
60 to
70
14.4
19 to
21
Pav
lov
et a
l. 19
72
497
Pha
nero
don
furc
atus
whi
tese
aper
chE
mbi
otoc
idae
Pflu
me;
60-
min
. vel
ocity
417
.148
3.1
15 to
20
Dor
n et
al.
1979
498
Poe
cilia
ret
icul
ata
gupp
yP
oeci
liida
eO
tunn
el; U
crit
271.
92.
923
.70.
96 S
E13
.727
to 2
9N
icol
etto
199
1
499
Poe
cilia
ret
icul
ata
gupp
yP
oeci
liida
eO
tunn
el; U
crit
108
2.9
24.3
3.39
inte
rqua
rtile
rang
e27
to 2
9N
icol
etto
199
3
500
Pog
onic
hthy
sm
acro
lepi
dotu
ssp
litta
ilC
yprin
idae
Pflu
me;
Ucr
it8
20.9
1041
212
You
ng a
nd C
ech
1996
501
Pog
onic
hthy
sm
acro
lepi
dotu
ssp
litta
ilC
yprin
idae
Pflu
me;
Ucr
it8
3.1
1020
6.6
17Y
oung
and
Cec
h19
96
502
Pog
onic
hthy
sm
acro
lepi
dotu
ssp
litta
ilC
yprin
idae
Pflu
me;
Ucr
it8
5.5
1031
6.3
17Y
oung
and
Cec
h19
96
503
Pog
onic
hthy
sm
acro
lepi
dotu
ssp
litta
ilC
yprin
idae
Pflu
me;
Ucr
it8
12.1
1044
3.8
17Y
oung
and
Cec
h19
96
504
Pog
onic
hthy
sm
acro
lepi
dotu
ssp
litta
ilC
yprin
idae
Pflu
me;
Ucr
it8
20.9
1066
3.4
17Y
oung
and
Cec
h19
96
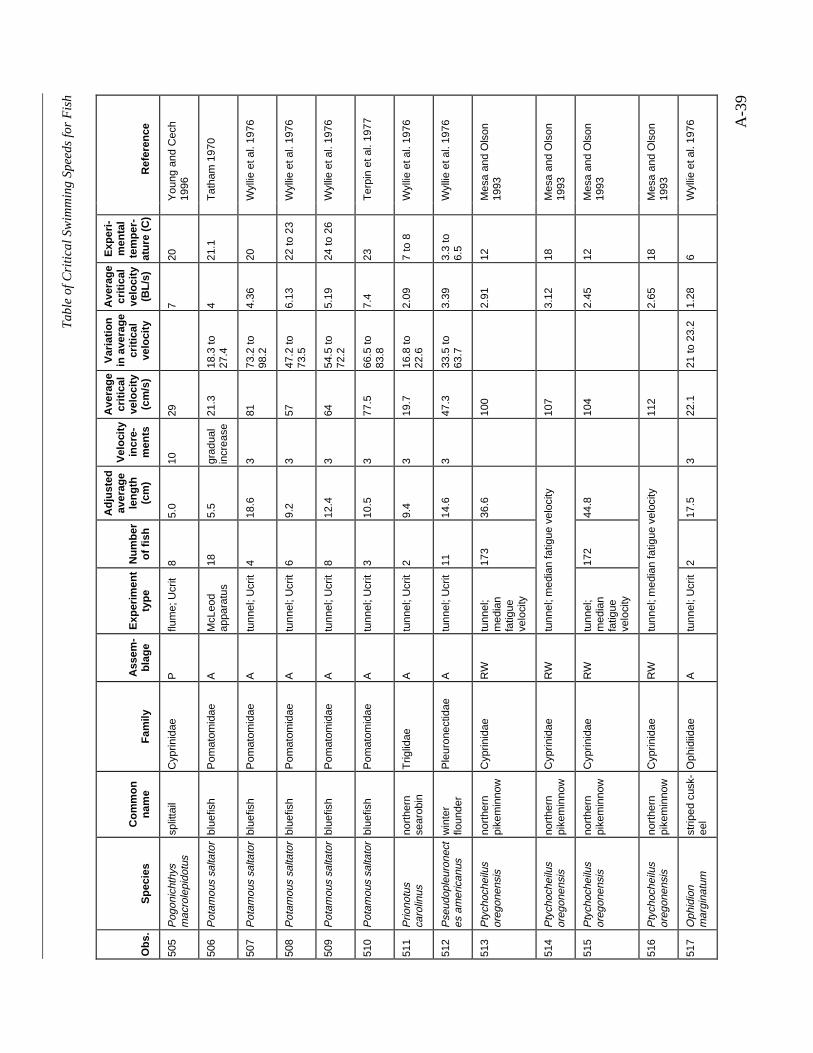
Ta
ble
of
Cri
tica
l Sw
imm
ing
Sp
ee
ds
for
Fis
h
A-3
9
Obs
.S
peci
esC
omm
onna
me
Fam
ilyA
ssem
-bl
age
Exp
erim
ent
type
Num
ber
of fi
sh
Adj
uste
dav
erag
ele
ngth
(cm
)
Vel
ocity
incr
e-m
ents
Ave
rage
criti
cal
velo
city
(cm
/s)
Var
iatio
nin
ave
rage
criti
cal
velo
city
Ave
rage
criti
cal
velo
city
(BL/
s)
Exp
eri-
men
tal
tem
per-
atur
e (C
)R
efer
ence
505
Pog
onic
hthy
sm
acro
lepi
dotu
ssp
litta
ilC
yprin
idae
Pflu
me;
Ucr
it8
5.0
1029
720
You
ng a
nd C
ech
1996
506
Pot
amou
s sa
ltato
rbl
uefis
hP
omat
omid
aeA
McL
eod
appa
ratu
s18
5.5
grad
ual
incr
ease
21.3
18.3
to27
.44
21.1
Tat
ham
197
0
507
Pot
amou
s sa
ltato
rbl
uefis
hP
omat
omid
aeA
tunn
el; U
crit
418
.63
8173
.2 to
98.2
4.36
20W
yllie
et a
l. 19
76
508
Pot
amou
s sa
ltato
rbl
uefis
hP
omat
omid
aeA
tunn
el; U
crit
69.
23
5747
.2 to
73.5
6.13
22 to
23
Wyl
lie e
t al.
1976
509
Pot
amou
s sa
ltato
rbl
uefis
hP
omat
omid
aeA
tunn
el; U
crit
812
.43
6454
.5 to
72.2
5.19
24 to
26
Wyl
lie e
t al.
1976
510
Pot
amou
s sa
ltato
rbl
uefis
hP
omat
omid
aeA
tunn
el; U
crit
310
.53
77.5
66.5
to83
.87.
423
Ter
pin
et a
l. 19
77
511
Prio
notu
sca
rolin
usno
rthe
rnse
arob
inT
riglid
aeA
tunn
el; U
crit
29.
43
19.7
16.8
to22
.62.
097
to 8
Wyl
lie e
t al.
1976
512
Pse
udop
leur
onec
tes
am
eric
anus
win
ter
floun
der
Ple
uron
ectid
aeA
tunn
el; U
crit
1114
.63
47.3
33.5
to63
.73.
393.
3 to
6.5
Wyl
lie e
t al.
1976
513
Pty
choc
heilu
sor
egon
ensi
sno
rthe
rnpi
kem
inno
wC
yprin
idae
RW
tunn
el;
med
ian
fatig
ueve
loci
ty
173
36.6
100
2.91
12M
esa
and
Ols
on19
93
514
Pty
choc
heilu
sor
egon
ensi
sno
rthe
rnpi
kem
inno
wC
yprin
idae
RW
tunn
el; m
edia
n fa
tigue
vel
ocity
107
3.12
18M
esa
and
Ols
on19
93
515
Pty
choc
heilu
sor
egon
ensi
sno
rthe
rnpi
kem
inno
wC
yprin
idae
RW
tunn
el;
med
ian
fatig
ueve
loci
ty
172
44.8
104
2.45
12M
esa
and
Ols
on19
93
516
Pty
choc
heilu
sor
egon
ensi
sno
rthe
rnpi
kem
inno
wC
yprin
idae
RW
tunn
el; m
edia
n fa
tigue
vel
ocity
112
2.65
18M
esa
and
Ols
on19
93
517
Oph
idio
nm
argi
natu
mst
riped
cus
k-ee
lO
phid
iidae
Atu
nnel
; Ucr
it2
17.5
322
.121
to 2
3.2
1.28
6W
yllie
et a
l. 19
76

Ta
ble
of
Cri
tica
l Sw
imm
ing
Sp
ee
ds
for
Fis
h
A-4
0
Obs
.S
peci
esC
omm
onna
me
Fam
ilyA
ssem
-bl
age
Exp
erim
ent
type
Num
ber
of fi
sh
Adj
uste
dav
erag
ele
ngth
(cm
)
Vel
ocity
incr
e-m
ents
Ave
rage
criti
cal
velo
city
(cm
/s)
Var
iatio
nin
ave
rage
criti
cal
velo
city
Ave
rage
criti
cal
velo
city
(BL/
s)
Exp
eri-
men
tal
tem
per-
atur
e (C
)R
efer
ence
518
Rut
ilus
rutil
usro
ach
Cyp
rinid
aeO
tunn
el; U
crit
94.
9gr
adua
lin
crea
se41
.934
to 5
28.
5519
to 2
1P
avlo
v et
al.
1972
519
Rut
ilus
rutil
usca
spic
usC
aspi
anro
ach
Cyp
rinid
aeO
tunn
el; U
crit
122.
8gr
adua
lin
crea
se31
.421
.5 to
38
11.4
19 to
21
Pav
lov
et a
l. 19
72
520
Sal
mo
sala
rA
tlant
icsa
lmon
Sal
mon
idae
Atu
nnel
; Ucr
it16
9.6
1044
.81.
4 S
E4.
8312
.5S
teve
ns e
t al.
1998
521
Sal
mo
sala
rA
tlant
icsa
lmon
Sal
mon
idae
Atu
nnel
; Ucr
it15
11.1
1044
.22.
65 S
E4.
1112
.5S
teve
ns e
t al.
1998
522
Sal
velin
usfo
ntin
alis
broo
k tr
out
Sal
mon
idae
RE
tunn
el; U
crit
612
.03
51.3
5.13
15P
eter
son
1974
523
Sal
velin
usfo
ntin
alis
broo
k tr
out
Sal
mon
idae
RE
3411
.13
48.6
4.85
15P
eter
son
1974
524
Sal
velin
usfo
ntin
alis
broo
k tr
out
Sal
mon
idae
RE
611
.43
46.3
4.63
15P
eter
son
1974
525
Sca
rdin
ius
eryt
hrop
htha
lmus
rudd
Cyp
rinid
aeO
tunn
el; U
crit
44.
3gr
adua
lin
crea
se34
.830
to 4
08.
117
Pav
lov
et a
l. 19
72
526
Sca
rdin
ius
eryt
hrop
htha
lmus
rudd
Cyp
rinid
aeO
tunn
el; U
crit
46.
7gr
adua
lin
crea
se36
all 3
65.
421
Pav
lov
et a
l. 19
72
527
Seb
aste
sm
ystin
usbl
ue r
ockf
ish
Sco
rpae
nida
eP
flum
e; 6
0-m
in. v
eloc
ity5
16.6
554
15 to
20
Dor
n et
al.
1979
528
Seb
aste
sse
rran
oide
sol
ive
rock
fish
Sco
rpae
nida
eP
flum
e; 6
0-m
in. v
eloc
ity6
21.8
532.
715
to 2
0D
orn
et a
l. 19
79
529
Sph
yrae
nabo
real
isno
rthe
rnse
nnet
Sph
yrae
nida
eA
tunn
el; U
crit
414
.53
39.3
32.6
to 5
02.
7225
Wyl
lie e
t al.
1976
530
Spr
attu
s sp
rattu
ssp
rat
Clu
peid
aeA
flum
e; U
crit
134.
410
45.3
8.5
SD
11.4
716
.2T
urnp
enny
198
3
531
Spr
attu
s sp
rattu
ssp
rat
Clu
peid
aeA
flum
e; U
crit
403.
910
30.7
3.3
SD
8.77
16.2
Tur
npen
ny 1
983
532
Spr
attu
s sp
rattu
ssp
rat
Clu
peid
aeA
flum
e; U
crit
284.
510
56.3
4.7
SD
13.9
16.3
Tur
npen
ny 1
983
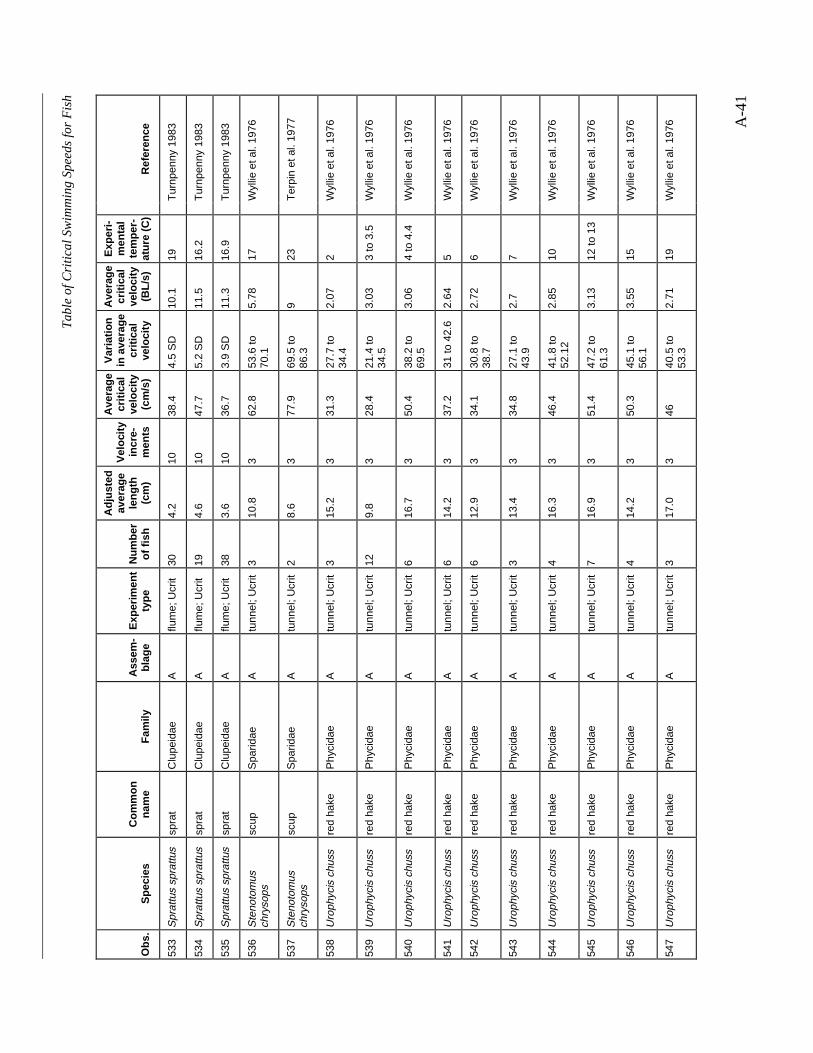
Ta
ble
of
Cri
tica
l Sw
imm
ing
Sp
ee
ds
for
Fis
h
A-4
1
Obs
.S
peci
esC
omm
onna
me
Fam
ilyA
ssem
-bl
age
Exp
erim
ent
type
Num
ber
of fi
sh
Adj
uste
dav
erag
ele
ngth
(cm
)
Vel
ocity
incr
e-m
ents
Ave
rage
criti
cal
velo
city
(cm
/s)
Var
iatio
nin
ave
rage
criti
cal
velo
city
Ave
rage
criti
cal
velo
city
(BL/
s)
Exp
eri-
men
tal
tem
per-
atur
e (C
)R
efer
ence
533
Spr
attu
s sp
rattu
ssp
rat
Clu
peid
aeA
flum
e; U
crit
304.
210
38.4
4.5
SD
10.1
19T
urnp
enny
198
3
534
Spr
attu
s sp
rattu
ssp
rat
Clu
peid
aeA
flum
e; U
crit
194.
610
47.7
5.2
SD
11.5
16.2
Tur
npen
ny 1
983
535
Spr
attu
s sp
rattu
ssp
rat
Clu
peid
aeA
flum
e; U
crit
383.
610
36.7
3.9
SD
11.3
16.9
Tur
npen
ny 1
983
536
Ste
noto
mus
chry
sops
scup
Spa
ridae
Atu
nnel
; Ucr
it3
10.8
362
.853
.6 to
70.1
5.78
17W
yllie
et a
l. 19
76
537
Ste
noto
mus
chry
sops
scup
Spa
ridae
Atu
nnel
; Ucr
it2
8.6
377
.969
.5 to
86.3
923
Ter
pin
et a
l. 19
77
538
Uro
phyc
is c
huss
red
hake
Phy
cida
eA
tunn
el; U
crit
315
.23
31.3
27.7
to34
.42.
072
Wyl
lie e
t al.
1976
539
Uro
phyc
is c
huss
red
hake
Phy
cida
eA
tunn
el; U
crit
129.
83
28.4
21.4
to34
.53.
033
to 3
.5W
yllie
et a
l. 19
76
540
Uro
phyc
is c
huss
red
hake
Phy
cida
eA
tunn
el; U
crit
616
.73
50.4
38.2
to69
.53.
064
to 4
.4W
yllie
et a
l. 19
76
541
Uro
phyc
is c
huss
red
hake
Phy
cida
eA
tunn
el; U
crit
614
.23
37.2
31 to
42.
62.
645
Wyl
lie e
t al.
1976
542
Uro
phyc
is c
huss
red
hake
Phy
cida
eA
tunn
el; U
crit
612
.93
34.1
30.8
to38
.72.
726
Wyl
lie e
t al.
1976
543
Uro
phyc
is c
huss
red
hake
Phy
cida
eA
tunn
el; U
crit
313
.43
34.8
27.1
to43
.92.
77
Wyl
lie e
t al.
1976
544
Uro
phyc
is c
huss
red
hake
Phy
cida
eA
tunn
el; U
crit
416
.33
46.4
41.8
to52
.12
2.85
10W
yllie
et a
l. 19
76
545
Uro
phyc
is c
huss
red
hake
Phy
cida
eA
tunn
el; U
crit
716
.93
51.4
47.2
to61
.33.
1312
to 1
3W
yllie
et a
l. 19
76
546
Uro
phyc
is c
huss
red
hake
Phy
cida
eA
tunn
el; U
crit
414
.23
50.3
45.1
to56
.13.
5515
Wyl
lie e
t al.
1976
547
Uro
phyc
is c
huss
red
hake
Phy
cida
eA
tunn
el; U
crit
317
.03
4640
.5 to
53.3
2.71
19W
yllie
et a
l. 19
76
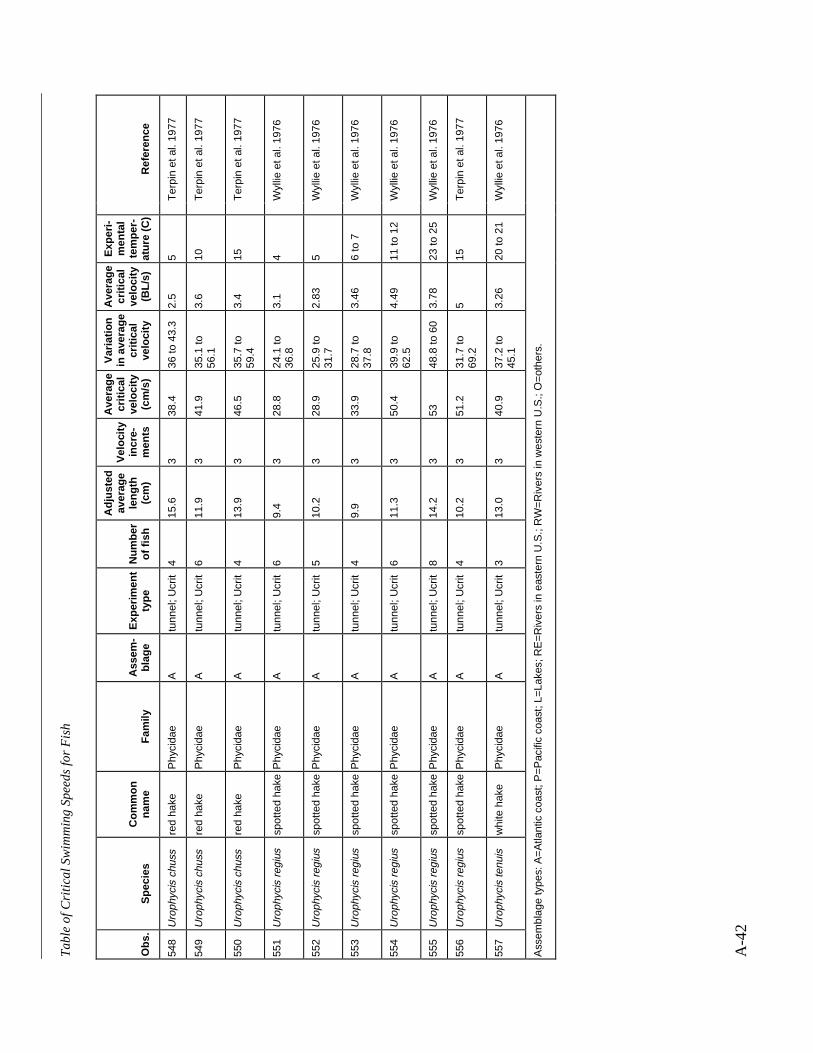
Ta
ble
of
Cri
tica
l Sw
imm
ing
Sp
ee
ds
for
Fis
h
A-4
2
Obs
.S
peci
esC
omm
onna
me
Fam
ilyA
ssem
-bl
age
Exp
erim
ent
type
Num
ber
of fi
sh
Adj
uste
dav
erag
ele
ngth
(cm
)
Vel
ocity
incr
e-m
ents
Ave
rage
criti
cal
velo
city
(cm
/s)
Var
iatio
nin
ave
rage
criti
cal
velo
city
Ave
rage
criti
cal
velo
city
(BL/
s)
Exp
eri-
men
tal
tem
per-
atur
e (C
)R
efer
ence
548
Uro
phyc
is c
huss
red
hake
Phy
cida
eA
tunn
el; U
crit
415
.63
38.4
36 to
43.
32.
55
Ter
pin
et a
l. 19
77
549
Uro
phyc
is c
huss
red
hake
Phy
cida
eA
tunn
el; U
crit
611
.93
41.9
35.1
to56
.13.
610
Ter
pin
et a
l. 19
77
550
Uro
phyc
is c
huss
red
hake
Phy
cida
eA
tunn
el; U
crit
413
.93
46.5
35.7
to59
.43.
415
Ter
pin
et a
l. 19
77
551
Uro
phyc
is r
egiu
ssp
otte
d ha
keP
hyci
dae
Atu
nnel
; Ucr
it6
9.4
328
.824
.1 to
36.8
3.1
4W
yllie
et a
l. 19
76
552
Uro
phyc
is r
egiu
ssp
otte
d ha
keP
hyci
dae
Atu
nnel
; Ucr
it5
10.2
328
.925
.9 to
31.7
2.83
5W
yllie
et a
l. 19
76
553
Uro
phyc
is r
egiu
ssp
otte
d ha
keP
hyci
dae
Atu
nnel
; Ucr
it4
9.9
333
.928
.7 to
37.8
3.46
6 to
7W
yllie
et a
l. 19
76
554
Uro
phyc
is r
egiu
ssp
otte
d ha
keP
hyci
dae
Atu
nnel
; Ucr
it6
11.3
350
.439
.9 to
62.5
4.49
11 to
12
Wyl
lie e
t al.
1976
555
Uro
phyc
is r
egiu
ssp
otte
d ha
keP
hyci
dae
Atu
nnel
; Ucr
it8
14.2
353
48.8
to 6
03.
7823
to 2
5W
yllie
et a
l. 19
76
556
Uro
phyc
is r
egiu
ssp
otte
d ha
keP
hyci
dae
Atu
nnel
; Ucr
it4
10.2
351
.231
.7 to
69.2
515
Ter
pin
et a
l. 19
77
557
Uro
phyc
is te
nuis
whi
te h
ake
Phy
cida
eA
tunn
el; U
crit
313
.03
40.9
37.2
to45
.13.
2620
to 2
1W
yllie
et a
l. 19
76
Ass
embl
age
type
s: A
=A
tlant
ic c
oast
; P=
Pac
ific
coas
t; L=
Lake
s; R
E=
Riv
ers
in e
aste
rn U
.S.;
RW
=R
iver
s in
wes
tern
U.S
.; O
=ot
hers
.
B-1
B FISH ENDURANCE (FATIGUE TIMES AT CONSTANTVELOCITIES)
As discussed in the text (Section 4.2), several methods have been used to express or display thetime a fish can continue to swim at a constant velocity. There have been few studies of fishendurance compared to the number of studies of critical swimming speed (or slight variations ofit) given in Appendix A. The few endurance studies have used different display methods. Themost common is a graph comparing time to fatigue on the vertical axis to swimming speed onthe horizontal axis, with swimming speed being given in values of body lengths per second. Datatables for the graphs have almost never been published. Without original data in hand, it isdifficult to relate these graphs to absolute velocities that are of interest for application toimpingement issues (e.g., in cm/s). With some difficulty, the data might be obtained fromauthors and converted to absolute velocities. We did not do this.
This appendix presents the graphs published by the original investigators, labeled with speciesand reference. We have also included the original legends, for purposes of explanation. Thesegraphs and their references may serve as starting points for further analyses by persons interestedin the performance of a particular species. Such analyses of endurance may be important forevaluating acceptable lengths of intake canals, for instance.
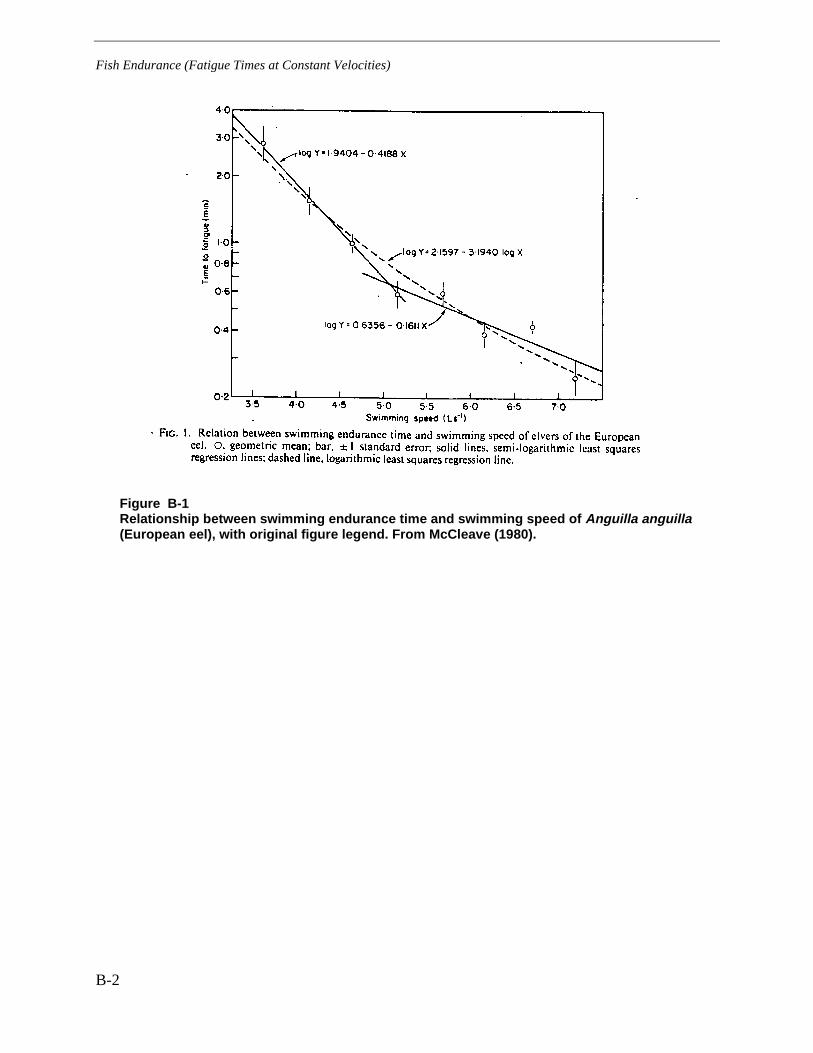
Fish Endurance (Fatigue Times at Constant Velocities)
B-2
Figure B-1Relationship between swimming endurance time and swimming speed of Anguilla anguilla(European eel), with original figure legend. From McCleave (1980).
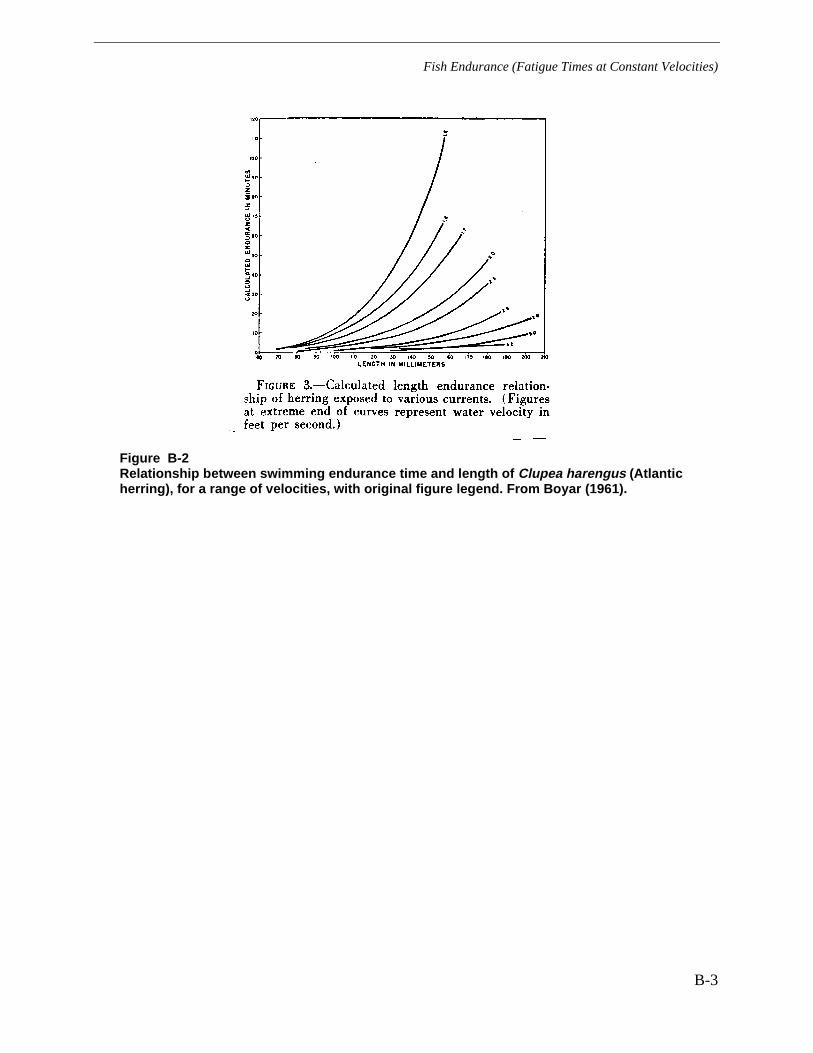
Fish Endurance (Fatigue Times at Constant Velocities)
B-3
Figure B-2Relationship between swimming endurance time and length of Clupea harengus (Atlanticherring), for a range of velocities, with original figure legend. From Boyar (1961).
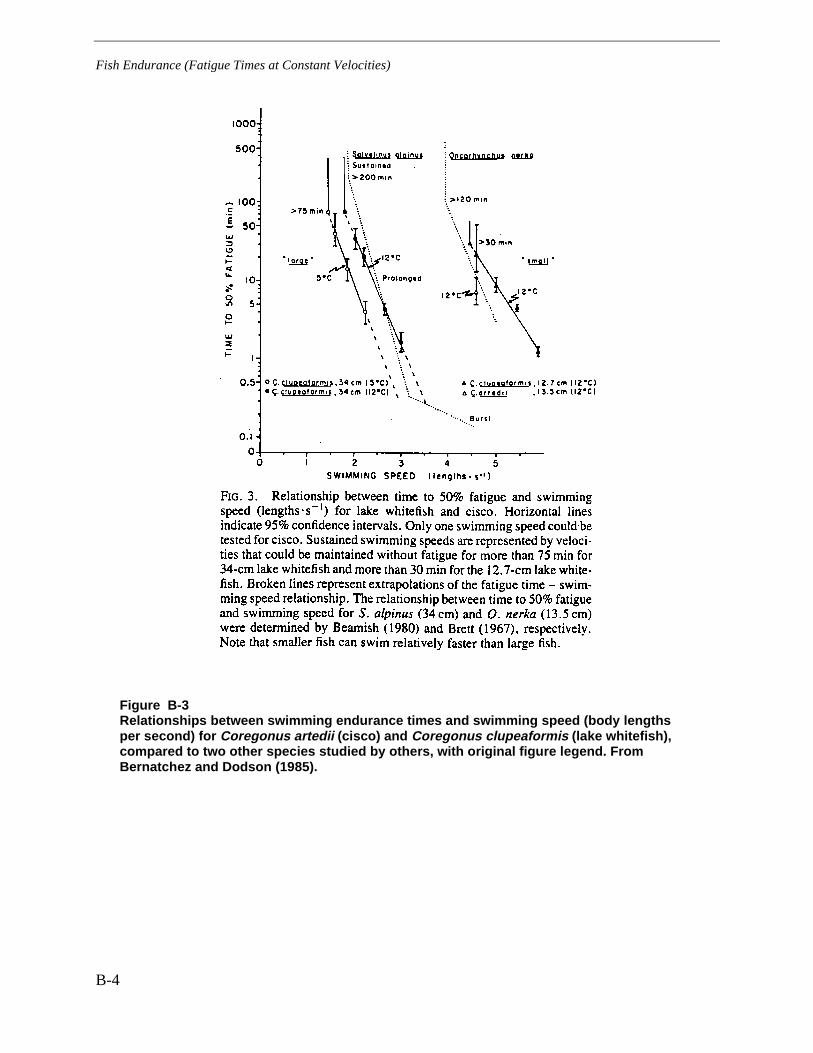
Fish Endurance (Fatigue Times at Constant Velocities)
B-4
Figure B-3Relationships between swimming endurance times and swimming speed (body lengthsper second) for Coregonus artedii (cisco) and Coregonus clupeaformis (lake whitefish),compared to two other species studied by others, with original figure legend. FromBernatchez and Dodson (1985).
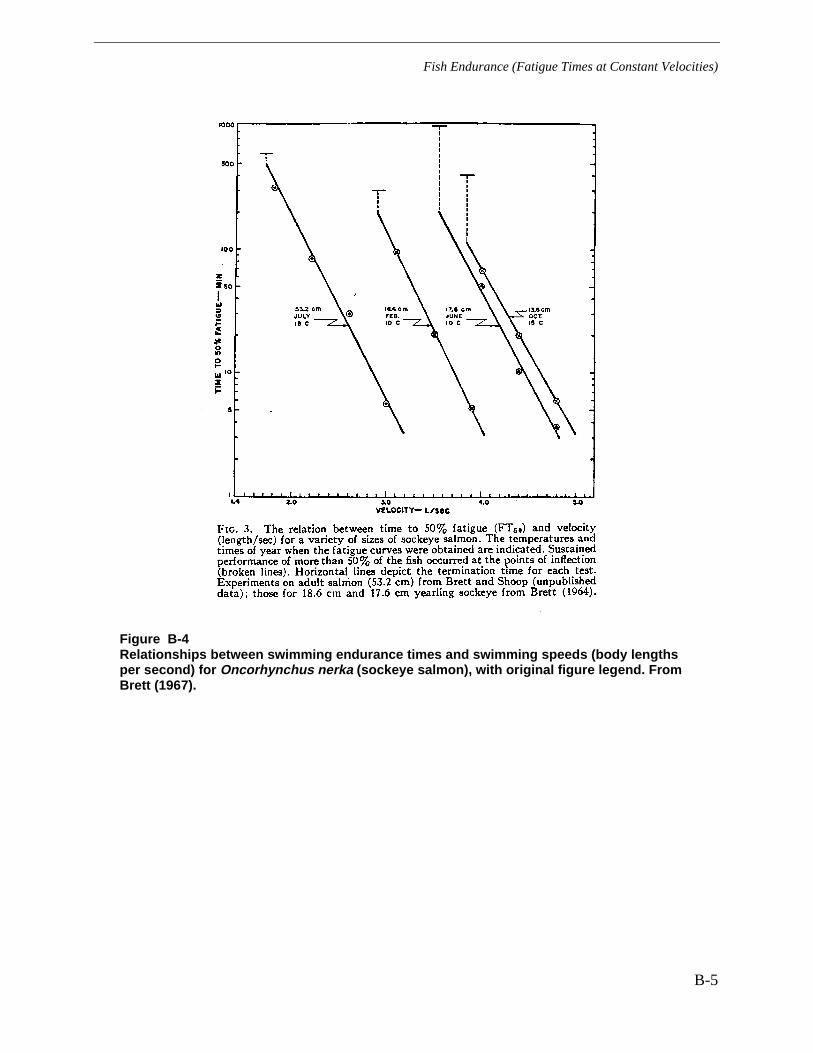
Fish Endurance (Fatigue Times at Constant Velocities)
B-5
Figure B-4Relationships between swimming endurance times and swimming speeds (body lengthsper second) for Oncorhynchus nerka (sockeye salmon), with original figure legend. FromBrett (1967).
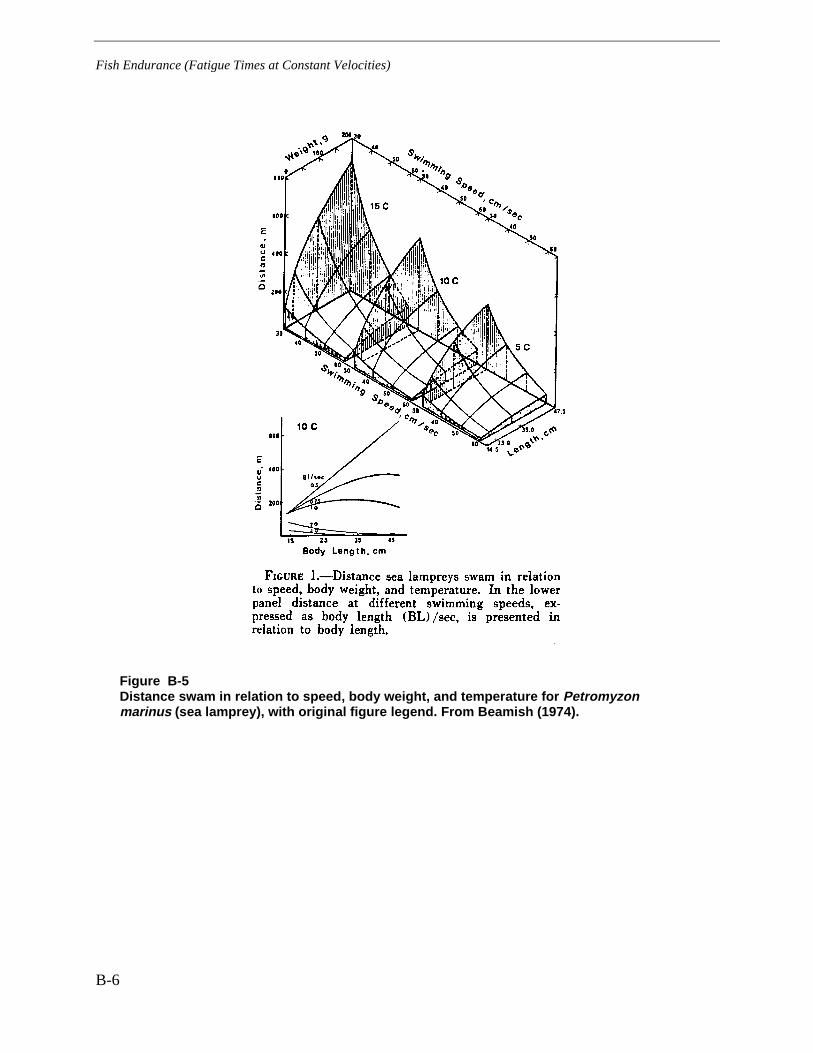
Fish Endurance (Fatigue Times at Constant Velocities)
B-6
Figure B-5Distance swam in relation to speed, body weight, and temperature for Petromyzonmarinus (sea lamprey), with original figure legend. From Beamish (1974).

Fish Endurance (Fatigue Times at Constant Velocities)
B-7
Figure B-6Relationship between swimming endurance times and swimming speed for Salmo salar(Atlantic salmon), with original figure legend. From Booth et al. (1997).

Fish Endurance (Fatigue Times at Constant Velocities)
B-8
Figure B-7Relationship between swimming endurance times and swimming speed for anadromousand land-locked Salmo salar (Atlantic salmon), with original figure legend. From Peake etal. (1997).
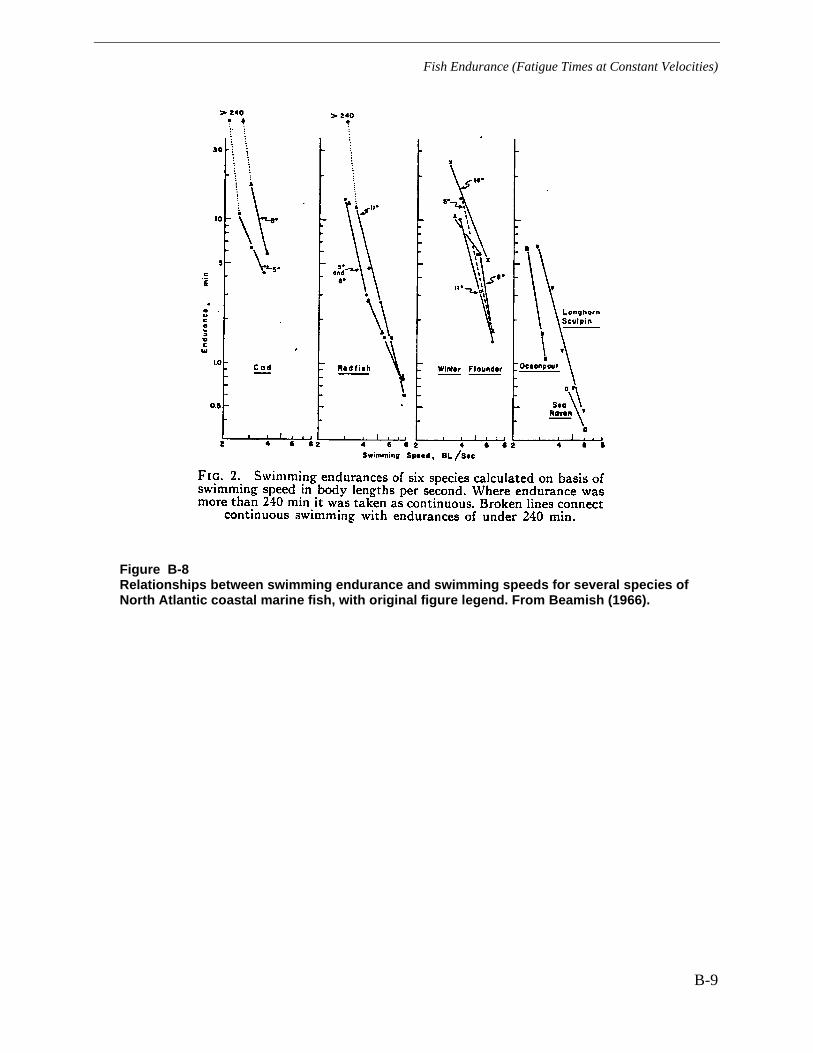
Fish Endurance (Fatigue Times at Constant Velocities)
B-9
Figure B-8Relationships between swimming endurance and swimming speeds for several species ofNorth Atlantic coastal marine fish, with original figure legend. From Beamish (1966).
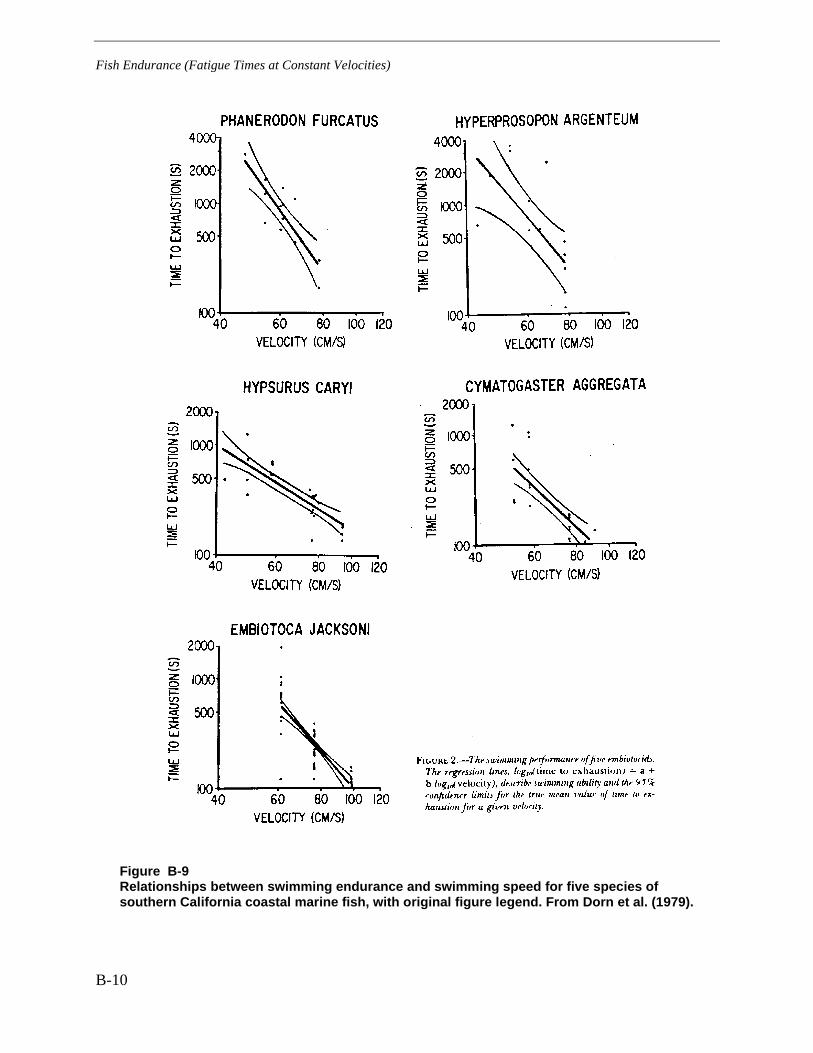
Fish Endurance (Fatigue Times at Constant Velocities)
B-10
Figure B-9Relationships between swimming endurance and swimming speed for five species ofsouthern California coastal marine fish, with original figure legend. From Dorn et al. (1979).
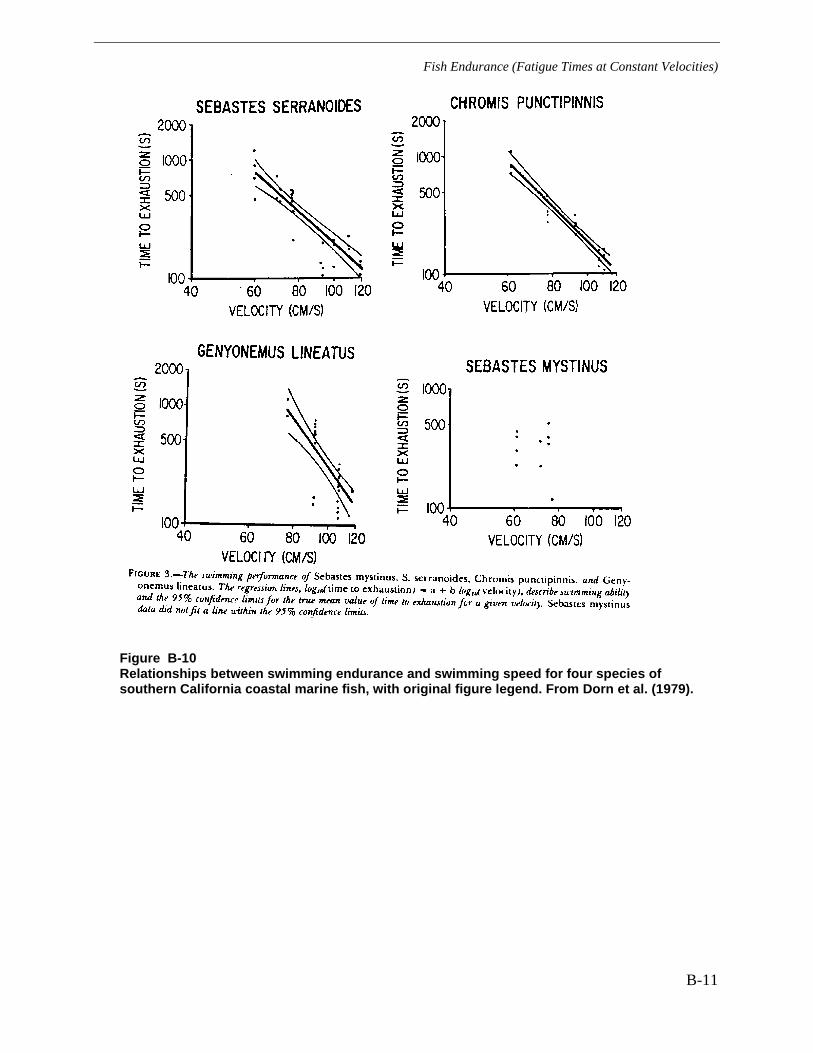
Fish Endurance (Fatigue Times at Constant Velocities)
B-11
Figure B-10Relationships between swimming endurance and swimming speed for four species ofsouthern California coastal marine fish, with original figure legend. From Dorn et al. (1979).


© 2000 Electric Power Research Institute (EPRI), Inc.All rightsreserved. Electric Power Research Institute and EPRI are registered service marks of the Electric Power Research Institute, Inc.EPRI. ELECTRIFY THE WORLD is a service mark of the ElectricPower Research Institute, Inc.
Printed on recycled paper in the United States of America
1000731
Target:
Section 316 (a) and (b) Fish Protection Issues
EPRI • 3412 Hillview Avenue, Palo Alto, California 94304 • PO Box 10412, Palo Alto, California 94303 • USA800.313.3774 • 650.855.2121 • [email protected] • www.epri.com
About EPRI
EPRI creates science and technology solutions for
the global energy and energy services industry. U.S.
electric utilities established the Electric Power
Research Institute in 1973 as a nonprofit research
consortium for the benefit of utility members, their
customers, and society. Now known simply as EPRI,
the company provides a wide range of innovative
products and services to more than 1000 energy-
related organizations in 40 countries. EPRI’s
multidisciplinary team of scientists and engineers
draws on a worldwide network of technical and
business expertise to help solve today’s toughest
energy and environmental problems.
EPRI. Electrify the World


![[PPT]PowerPoint Presentationc.ymcdn.com/.../Diabetes_lecture_slides_nov.pptx · Web view... urosepsis, trauma, reduced caloric or fluid intake, and reduced insulin dose. Potential](https://img.dokumen.tips/doc/110x75/5acf30e57f8b9ad24f8c2429/pptpowerpoint-view-urosepsis-trauma-reduced-caloric-or-fluid-intake-and.jpg)