Embed Size (px)
Citation preview

Technical Brief
Understanding OscilloscopeBandwidth, Rise Time and Signal FidelityIntroductionWhen an oscilloscope user chooses an oscilloscope for making critical measurements,
banner specifications are often the only criterion used to make this choice. The top
three oscilloscope banner specification categories are:BandwidthSample RateRecord Length
And of these banner specification categories, the number one asked for capability in
an oscilloscope is bandwidth. After all, more bandwidth means higher performance,
right? Well, not necessarily. This article will point out the pitfalls in this very simple
assumption. Depending upon your expectation to see and analyze signals as they
really are, more knowledge about the true performance of your oscilloscope will
be needed.

Understanding Oscilloscope Bandwidth, Rise Time and Signal FidelityTechnical Brief
2 www.tektronix.com/oscilloscope222
Bandwidth – What Does ThisSpecification Tell Us?Analog bandwidth is a measurement specification that simply defines the frequency at which the measured ampli-tude of a sinewave is 3 dB lower than the actual sinewaveamplitude (see IEEE-1057). Figure 1 shows an idealizedamplitude roll off error as a sinewave signal approaches thespecified bandwidth frequency of a measurement devicehaving a first order or single pole Gaussian response. At therated bandwidth, the measurement error approaches 30%!
If you want to make a measurement on a sinewave that hasonly 3% error, you would only want to measure sinewavesmuch lower in frequency than the rated bandwidth of theoscilloscope, about 0.3 times the rated instrument bandwidth. Because most signals are more complex than sinewaves, it is a general rule of thumb is use a measurement device, like an oscilloscope, that has 5 times the bandwidth of the signal you intend to measure(explained later and shown in Figure 5).
What Does Bandwidth Not Tell Us?Most typical users choose an oscilloscope to display andmeasure complex electrical and optical signals, seen on theinstrument display as a graph of signal amplitude versustime. Analog Bandwidth, a key oscilloscope specification, isdefined by necessity in the frequency domain, not the timedomain. Complex signals, according to sampling theory, willcontain many spectral components (e.g., multi-tones thatcontain several discrete but harmonically related sinewave components), as shown in Figure 2.
Using spectral analysis, we can learn what these components are for a sampled signal. However, to fullycharacterize these components, we must know both the accurate amplitude and phase of each of these components making up the complex signal. In this case,the bandwidth specification tells us almost nothing abouthow the instrument will capture these details. From abandwidth measurement alone, we only know that for asinewave input, the measurement error approaches 30% at the specified bandwidth.
2
Figure 1. Oscilloscope Bandwidth vs. Frequency. Figure 2. Digital Square Wave – Odd Fourier Sums.
0.1 0.2 0.3 0.4 0.5 0.6 0.7 0.8 0.9 1.0100.0
97.5
95.092.5
90.087.585.0
82.580.0
77.575.0
72.570.7 (-3 dB)
77.5

Understanding Oscilloscope Bandwidth, Rise Time and Signal FidelityTechnical Brief
3www.tektronix.com/oscilloscope
What is the Relationship BetweenBandwidth and Rise Time?Beyond general purpose signal analysis, most engineers arealso interested in time measurements such as a squarewave rise time and fall time. Therefore, to estimate theoscilloscope system rise time from its specified bandwidthwe can use an equation such as:
tr = 0.35
BW
This 0.35 factor between bandwidth and rise time is basedon a simple one-pole model for 10-90% rise time. The most commonly used model for a one-pole response is aresistor-capacitor (RC) low pass filter. By using this formula,it is easy to calculate Tr. However, the real world is oftennot quite this simple.
Figure 3 is a table that illustrates the measurement systembandwidth suggestions for various types of common signaling standards when reasonable measurement accuracy is needed for rise time or other measurements.Keep in mind that many elements of your instrumentationsystem will affect the rise time result shown on your oscilloscope display. These elements include your signalsource, probe, and oscilloscope.
Figure 3 makes the assumption that the signal and theoscilloscope measurement system each has a one-pole rolloff response characteristic. In reality, especially with today’shigh-speed signals, this assumption is far from correct. Fora maximum flat envelope delay response, the bandwidthtimes rise time constant of an oscilloscope can approach 0.45.
So what does this really mean concerning the best oscilloscope to use? Two oscilloscopes that have the samebandwidth performance can have very different rise times,amplitude and phase response! So, knowing only the bandwidth of an oscilloscope will not reliably tell us itsmeasurement capability or its ability to accurately capturecomplex signals like high speed serial data streams. Also,instruments that specify rise time as calculated from band-width should be highly questioned. The only reliable way toknow the rise and fall time response of an oscilloscope isto measure it with an ideal step signal that is much fasterthan the oscilloscope!
Figure 3. Bandwidth requirements for various high speed standards.

Understanding Oscilloscope Bandwidth, Rise Time and Signal FidelityTechnical Brief
4 www.tektronix.com/oscilloscope
What is Step Response?In reality, most oscilloscope users want an oscilloscope that has excellent overall step response. Bandwidth, as aspecification, tells us next to nothing about how well anoscilloscope can reproduce a complex waveform shape. To verify step response performance, a very clean step generator is needed. When an oscilloscope reproduces thisclean (close to ideal) step signal on its screen, the displayeddeviations are known as aberrations.
Figures 4 and 5 show what step response aberrations andrise time might look like on an oscilloscope screen.
So how much deviation from an ideal step response areyou willing to tolerate when using your oscilloscope? Therecan be four key contributing categories to these stepresponse deviations:
Base Oscilloscope Analog Performance
Probing Effects
Under Sample Alias Effects
Digital Signal Processing Effects
What Defines the Base AnalogPerformance of an Oscilloscope?True analog performance is defined by the analog oscilloscope circuitry leading up to the analog-to-digital(A/D) converter. This includes the vertical input attenuators,as well as the vertical amplifiers, position controls and
trigger pick off circuitry in each channel of the oscilloscope.The following discussion will explain what you will need toconsider in this circuitry when using your oscilloscope tolook for suble signal integrity details.
When you decide to explore a detail of your waveform, youwill likely discover the limits of the traditional vertical positioncontrol quite quickly. Each time you change the volts/divcontrol to expand the trace, you must reposition the waveform. And when you wish to expand a portion of thewaveform that is not close to the ground reference, the typical –12 divisions of vertical position range quickly limitsthe expansion or zoom range you can use. Also, when youreposition a vertically expanded trace, you may also need toretain a trigger point or timing reference on that detail sothat it remains on-screen. This requires that you also consider the range of your trigger level control. Figure 6illustrates these analog limits.
Figure 4. Step Response Aberrations.
Figure 5. Step Response Rise Time.
Figure 6. Dynamic range for vertical position and trigger level.
Overshoot
SettlingTime forRinging
Droop
Peak-to-PeakRounding
Preshoot
Nonlinearity
Equivalent Edge Bandwidth:Rule of Thumb: BW - 0.35*
tr
-

Understanding Oscilloscope Bandwidth, Rise Time and Signal FidelityTechnical Brief
5www.tektronix.com/oscilloscope
When you vertically reposition the trace, you also repositionthe expansion reference, which is fixed at ground, as shownin Figure 7.
If you want to “zoom” in on a waveform detail that is not atground, consider specifying an offset control, illustrated inFigure 8.
Vertical offset allows you to redefine the displayed referencefor expansion. For example, if you want to zoom in on awaveform detail at the top of a pulse that is at +5 volts,simply set the offset control to +5 volts. Then change thevolts/div to the needed sensitivity without the need to repo-sition the trace. Offset results in a tremendous increase inthe vertical analog dynamic range of your oscilloscope.
One drawback to “zooming” in on vertical waveform detailswill be the overdrive recovery limit of your oscilloscope’svertical amplifiers and acquisition system. When you drive aportion of your waveform off screen in order to expand on aparticular detail, the vertical system will need to recoverfrom that overdriven condition. A typical overdrive recoveryspecification could be “90% recovery in 1 nsec.” This wouldimply “99% recovery in 2 nsec.” On current models ofTektronix DPO/DSA Series oscilloscopes, overdrive recoverycan be as low as 100ps for a 15 division overdrive.
True analog performance goes well beyond bandwidth.Bandwidth, step response aberrations which affect in-bandflatness and phase-response, rise time and fall time mustbe understood. Having the ability to zoom in on details
requires both vertical position and offset controls that haveadequate range for your applications. This implies that theoscilloscope vertical system also has adequate overdriverecovery characteristics for your measurement requirements.
And any time a part of the signal is taken out of the rangeof the analog-to-digital converter (as just described), digitalsignal processing of the signal can become more of a problem than a solution, and having the ability to disableDSP is crucial to accurately evaluating regions of a wave-form using the techniques mentioned above. This is truebecause the entire signal is no longer available to the processing system and DSP artifacts can swamp subtlesignal features. We will cover more on this topic at the endof this technical brief.
Figure 7. Vertical position moves the volts/div zero reference point. Figure 8. Vertical offset changes the volts/div reference point from zero to some
other voltage.
Figure 9. Overdrive recovery characteristics can cause high-speed details
to disappear.

Understanding Oscilloscope Bandwidth, Rise Time and Signal FidelityTechnical Brief
6 www.tektronix.com/oscilloscope
How Can a Probe Affect Bandwidthand Rise Time?If you solder in a resistor, a capacitor, or even a piece ofwire to a circuit, would you expect these components toaffect the signals in that part of the circuit? Of course, youwould. These components affect signal amplitude, slowdown a signal, and influence signal shape. Likewise, everyoscilloscope probe has some capacitance. Every oscillo-scope probe has a resistance value. Every oscilloscopeprobe is going to affect the signals at the measurementpoint. It’s not a matter of if the probe will change the signal;it s a matter of how much.
An ideal probe would capture any signal with perfect fidelityand would be non-invasive to the circuit under test. Therequirements for the probe designer seem clear: extremelyhigh bandwidth, broad dynamic range, and don’t affect the signal under test. We ll consider the following topicsand their impact on bandwidth, rise times, and the step response.
Different Requirements. Different Probes.
Probe Bandwidth and Rise Time
Short Leads & Selecting the Right Accessories
Different Requirements. Different Probes.
Probes are used in many different environments and areused in testing to numerous industry standards. For example, measuring high voltage in power applicationsrequires adherence to safety certification standards. Thistype of measurement requires mechanically rugged probeswith very large dynamic range, but these probes do notrequire high bandwidth. On the other hand, applicationssuch as modern serial standards require measurement toolsthat use precision parts that are high bandwidth and have alow dynamic range.
It is important to realize that oscilloscope probes aredesigned for target markets that influence the probe’sdesign requirements. For varying measurement environments, probes have varying bandwidth capabilities.When determining the right probe for your measurement,make sure the probe has enough bandwidth. How much is enough? Let’s take a look.
Figure 10. Frequency vs. Amplitude Bandwidth Plot.

Understanding Oscilloscope Bandwidth, Rise Time and Signal FidelityTechnical Brief
7www.tektronix.com/oscilloscope
Probe Bandwidth and Rise Time
Bandwidth
Bandwidth is the range of frequencies that an oscilloscopeprobe is designed for. For example, a 100 MHz oscilloscopeprobe is specified for measurements on all frequencies upto 100 MHz. However, the probe s ability to capture signalschanges across the specified frequency range. In fact, every probe manufacturer assumes that at the maximumspecified bandwidth, the probe’s frequency response isdown 3 dB. At frequencies beyond the 3 dB point, signalamplitudes are overly attenuated and measurement resultsmay be unpredictable.
A general rule for accurate amplitude measurements is thebandwidth of the measurement system should be three tofive times greater than the frequency of the measuredwaveform. This recommendation ensures adequate bandwidth for the higher-frequency components of non-sinusoidal waveforms, such as square waves. Forexample, a measurement system with 300 to 500 MHzbandwidth is suggested to capture the fifth harmonic of a100 MHz square wave.
Consider the bandwidth plot in Figure 1. As the frequencyincreases, the amplitude of the signal decreases. As previously mentioned, probe manufacturers specify bandwidth out to the 3 dB point where amplitude losseshave not significantly affected the test signal. At 3 dB down,the noticeable signal changes occur at the rising and fallingedges where the corners of the square wave are roundedas the high frequency portion of the signal is attenuated. By selecting a probe that is three to five times faster thanthe signal under test, the amplitude error is considerablyreduced from 30% at 3 dB to approximately 3%.
Rise Time
Bandwidth describes frequency domain characterization butdoes not provide the complete picture of how the probeand scope will reproduce a complex waveform shape overtime. To get the full story, the step response is essential inobtaining the time domain characterization. This characteri-zation is provided through the probe’s rise time value whererise time is obtained by evaluating the response of a systemto a step input that is faster than the capabilities of the testsystem. The general rule for evaluating the probe’s rise timecapabilities is the probe’s rise time should be three to fivetimes faster than the rise time of the signal under test.
Figure 11. Keep Signal Leads Short.

Understanding Oscilloscope Bandwidth, Rise Time and Signal FidelityTechnical Brief
Short Leads & Selecting the Right Accessories
Keep Signal Leads and Ground Leads Short
When a probe is attached to a measurement point, it willinduce a load on the circuit. The capacitive and inductiveelements typically come from the probe tip geometry andwire lengths. The inductive element is likely to have variationdue to the addition of different probe tip accessories andvarying wire lengths for signal and ground leads.
At times, connecting wire leads to the test point may bechallenging. Users may compensate for this connectivityproblem by making the signal or ground wires too long. As shown in Figure 11, lengthening the signal leads on aP7500 probe influences the measurement. The plot on theleft has shorter leads whereas the plot on the right hasmuch longer signal wires. The rise time and overshoot values change due to wire length.
Selecting the Right Accessories
Oscilloscope probes are typically equipped with a numberof different probe tip accessories. The different accessoriesare included with the probe to support the various designactivities such as validation, debug, compliance testing, etc.Additionally, some probes are equipped with solder downsolutions to enable a solid, hands-free connection.
Users should be aware that different probe accessory tipsmay have different measurement results. In an effort tomake the connectivity to the device under test more convenient, some test leads have clips, some leads arelonger, and some probe connectors have square pin sockets. Consider the connection in Figure 12. The probe inthis picture has 1” signal and ground leads. Obviously,these longer leads will be more inductive and will causeeffects such as ringing, aberrations or overshoot. The pointis that there are a wide variety of connection methods andthese varying methods may cause varying measurementresults. Probe manufacturers will typically specify how theprobe tip accessory will influence the measurement.
8 www.tektronix.com/oscilloscope
Figure 12. Make sure you understand how the probe tip accessory will affect
your measurement.
Understanding Oscilloscope Bandwidth, Rise Time and Signal FidelityTechnical Brief
What are Under Sample Alias Effects?For a complex waveform, the spectral sine waves that exist in the waveform can be determined with a spectrumanalyzer, or a Fast Fourier Transform (FFT) of the waveform.Nyquist Theory states that, for a signal to be properly digitized, it needs to be sampled more than twice for eachand every spectral sine wave cycle that is in the waveform.If the fastest sine wave in your signal is not sampled fasterthan this two times rate, then Nyquist Theory is violated andthe signal will be reconstructed in a false way (aliased) thatcannot be corrected. Figure 13 shows how under samplingcan cause false waveform reconstruction.
If the signal present on the display seems to have anappearance of being not triggered, even though the triggerlight is solidly lit, then under sampling is very likely to be theproblem. If this is suspected, turn the sec/div control to afaster speed and you should eventually see a stable triggered display. This can be true for a repeating waveform.
For single-shot conditions, it is not possible to have a hintabout this type of aliasing (false waveform reconstruction)without some real initial knowledge about the waveform.The shape of a repeating waveform can appear to be correct, but can have the wrong timing. Or, the shape offast moving waveform details can be incorrect, due tounder sampling.
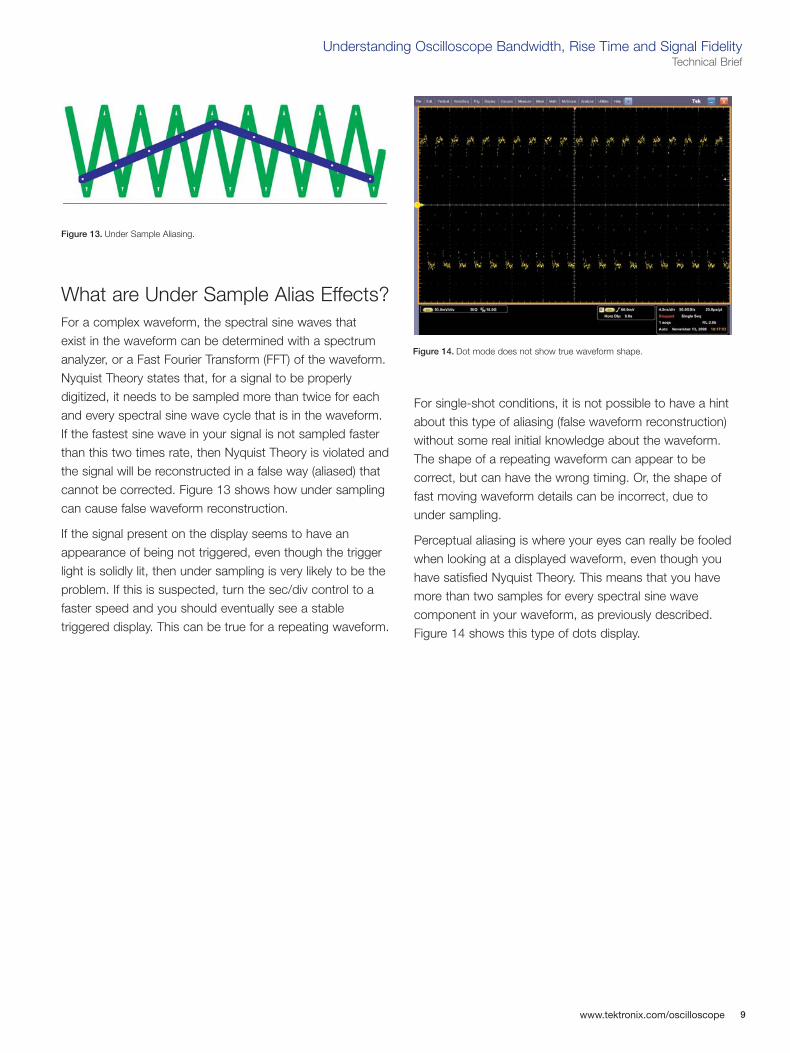
Perceptual aliasing is where your eyes can really be fooledwhen looking at a displayed waveform, even though youhave satisfied Nyquist Theory. This means that you havemore than two samples for every spectral sine wave component in your waveform, as previously described.Figure 14 shows this type of dots display.
9www.tektronix.com/oscilloscope
Figure 13. Under Sample Aliasing.
Figure 14. Dot mode does not show true waveform shape.

Understanding Oscilloscope Bandwidth, Rise Time and Signal FidelityTechnical Brief
Perceptual aliasing can appear as patterns of dots. The real waveform, of course, is still not visible. This type of displayed aliasing, or false waveform reproduction, can be significantly improved by joining the dots with varioustypes of lines. This process of joining the dots is calledinterpolation, as shown in Figure 15, using the same dotsused in Figure 14.
In order to truly remove the effects of perceptual aliasing,we must use the digital filter from Nyquist Theory, calledsine(x)/x. This mathematical filter allows truly correct inter-mediate points to be calculated between real samples on awaveform, provided that no “actual aliasing” is present. Thismeans that more than 2 samples exist for each and everyspectral (sine wave component) cycle in the signal thatreaches the oscilloscope analog-to-digital converter.
So what will sine(x)/x do to a step response that is undersampled? In Figures 16a the waveform is over sampled, and isdisplayed correctly with sine(x)/x interpolation. In Figure 16bthe waveform is under sampled, with sine(x)/x interpolationused for the display, and results in ringing that isn’t presenton the original signal. In Figure 16c, the waveform is alsounder sampled, with linear interpolation (straight linesbetween acquisition samples) used for the display, andresults in a better representation of the original signal.
As you can see, under sampling combined with interpolationcan give you very misleading information about a waveform.So be careful about your choice of sample rate and displayinterpolation to ensure the best measurement signal fidelityfor your signals.
10 www.tektronix.com/oscilloscope
Figure 15. Vector Mode Improves Perceptual Aliasing. Figure 16a. Oversampled waveform using sin(x)/x interpolation.
Figure 16b. Undersampled waveform using sine(x)/s interpolation.
Figure 16c. Undersampled waveform using linear interpolation.

Understanding Oscilloscope Bandwidth, Rise Time and Signal FidelityTechnical Brief
What can Digital Signal Processingdo to Risetime, Bandwidth and Signal Fidelity?In reality, interpolation between real samples is a form ofDigital Signal Processing (DSP). Processing waveforms canserve many purposes, including the following:
Bandwidth Enhancement
Rise Time Improvement
Gain and Wave Shape Calibration
Spectral Magnitude and Phase Correction
Optical Reference Receiver Normalization
Jitter Analysis of Waveform Deviations and Anomalies
In Figure 17, the blue trace is the uncorrected waveformthrough a less than perfect vertical amplifier system on anoscilloscope. The red trace shows DSP correction of shape,as well as enhanced bandwidth and improved rise time.
A DSP filter can be used to improve the pass band magnitude and phase response of an oscilloscope acquisition channel. This filter can extend the bandwidth,flatten the oscilloscope channel frequency response,improve phase linearity, and provide a better matchbetween channels. Fourier Series DSP filtering is most commonly used for bandwidth and rise time improvement.
When enhancing the rise time of a fast rise step, the FourierSeries DSP converges to the mid point of the step. On bothsides of the step, the series will oscillate. The height of thepeaks of the oscillation decreases away from the step, butthe heights of peak1, peak2, etc. remain the same as thenumber of terms summed increases, making the amplitudeand shape of the ring the same but at a higher frequency.The peak overshoot of each ring has a constant height(=18% of the step) and moves towards the step edge asthe number of terms increases. This effect is referred to asthe Gibbs Phenomenon.
So, according to Gibbs Phenomenon, pre and post ringingwill occur on the step edge, when enhancing bandwidth tothe limit with Fourier math. This is shown in Figure 17,where the oscilloscope channel response is low pass andlinear in phase. The amount of Gibbs Phenomenon ringingwill depend on the amount of rise time and bandwidthimprovement being implemented with the DSP, as well asthe speed of the signal being measured.
In order for DSP bandwidth enhancement to work consis-tently as described here, two conditions must be met. First,the sample rate must be kept high enough to ensure thatno spectral frequency component at or above the Nyquistrate (half the sample rate) gets through to the oscilloscope’sanalog-to-digital converter. If this condition is not met,under sampling will occur, and DSP will very likely destroythe integrity of the displayed waveform. Second, the totalwaveform must be kept within the range of the analog-to-digital converter. If you choose to zoom in on a detail of thewaveform, and subsequently drive another part of the signalvertically off screen, digital signal processing is very likely tocause unwanted distortions.
11www.tektronix.com/oscilloscope
Figure 17. DSP enhanced shape, rise time and bandwidth.

Contact Tektronix:ASEAN / Australasia (65) 6356 3900
Austria +41 52 675 3777
Balkans, Israel, South Africa and other ISE Countries +41 52 675 3777
Belgium 07 81 60166
Brazil +55 (11) 40669400
Canada 1 (800) 661-5625
Central East Europe, Ukraine and the Baltics +41 52 675 3777
Central Europe & Greece +41 52 675 3777
Denmark +45 80 88 1401
Finland +41 52 675 3777
France +33 (0) 1 69 86 81 81
Germany +49 (221) 94 77 400
Hong Kong (852) 2585-6688
India (91) 80-42922600
Italy +39 (02) 25086 1
Japan 81 (3) 6714-3010
Luxembourg +44 (0) 1344 392400
Mexico, Central/South America & Caribbean 52 (55) 54247900
Middle East, Asia and North Africa +41 52 675 3777
The Netherlands 090 02 021797
Norway 800 16098
People’s Republic of China 86 (10) 6235 1230
Poland +41 52 675 3777
Portugal 80 08 12370
Republic of Korea 82 (2) 6917-5000
Russia & CIS +7 (495) 7484900
South Africa +27 11 206 8360
Spain (+34) 901 988 054
Sweden 020 08 80371
Switzerland +41 52 675 3777
Taiwan 886 (2) 2722-9622
United Kingdom & Ireland +44 (0) 1344 392400
USA 1 (800) 426-2200
For other areas contact Tektronix, Inc. at: 1 (503) 627-7111
Updated 30 October 2008
SummaryBandwidth, as a banner specification, tells you somethingabout how well your oscilloscope will reproduce the truenature of your waveform, but not the entire story. Stepresponse rise time, fall time, aberrations, and in-band flatness and phase response will tell you much more aboutthe true fidelity of your measurement system. And when youwant to explore in on waveform details, remember that vertical offset and trigger level range, along with goodoverdrive recovery capability, will allow you to see thesedetails as you expect. And don’t forget probe loading effects,especially from signal tip and ground lead adapters.
Sample rate is another top banner specification. When youhave the right amount of sample rate, combined with the cor-rect interpolation between acquired samples, plus proper trigger-to-sample time correction, you can be lessconcerned about under sample aliasing effects. And makesure that digital signal processing enhancement of bandwidthand rise time, when used, delivers to you the signal fidelitythat you expect.
For Further InformationTektronix maintains a comprehensive, constantly expandingcollection of application notes, technical briefs and otherresources to help engineers working on the cutting edge oftechnology. Please visit www.tektronix.com
Copyright © 2009, Tektronix. All rights reserved. Tektronix products are covered by U.S. and foreign patents, issued and pending. Information in this publicationsupersedes that in all previously published material. Specification and pricechange privileges reserved. TEKTRONIX and TEK are registered trademarks of Tektronix, Inc. All other trade names referenced are the service marks, trademarks or registered trademarks of their respective companies. 3/09 JS/WWW 55W-18024-2