Embed Size (px)
Citation preview

EARLY IDENTIFICATION OF PEOPLE AT-RISK OF HOSPITALIZATIONHospital Admission Risk Prediction (HARP) – a new tool for supporting providers and patients
TECHNICAL APPENDIX

2 Health Quality Ontario | Early Identification of People At-Risk of Hospitalization | Technical Appendix
Methods details
The unit of analysis was an episode of care. An episode of care refers to all contiguous acute care hospitalizations and same-day
surgery visits. To construct an episode of care, transfers within and between facilities were linked. A transfer was assumed to
have occurred if either of the following conditions was met:
• An acute care hospitalization or a same-day surgery visit occurred within six hours of discharge from a previous acute
care hospitalization or same-day surgery visit, regardless of whether a transfer was coded; or
• An acute care hospitalization or same-day surgery visit occurred between six and 12 hours after discharge from a
previous acute care hospitalization or same-day surgery visit and at least one hospitalization or visit was coded as a
transfer.
Results
Statistical measures usedSensitivity: ability of model to correctly predict that an individual will be hospitalized
Specificity: ability of model to correctly predict that an individual will not be hospitalized
Positive Predictive Value (PV+): proportion of test positives that are true positives, or the percentage of those that the model
predicts will be hospitalized that actually are
Negative Predictive Value (PV-): proportion of test positives that are true negatives, or percentage of those that the model predicts
will not be hospitalized that actually aren’t
Kappa coefficient: measure of inter-rater agreement that also accounts for agreement occurring by chance.
Technical graphs The following tables plot the distribution of patients by HARP risk score.
Figure 1: Distribution of Simple Algorithm Score for Admission within 30 Days at Patient Level
0
5000
10000
15000
20000
25000
30000
35000
40000
45000
50000
0 2 4 6 8 10 12 14 16 18 20 22 24 26 28 30 32 34+
Freq
uenc
y o
f P
atie
nts
Score for Simple Algorithm
Percentiles of Score50th percentile: 975th percentile: 1290th percentile: 16
Notes
The results are based on
Ontario and Manitoba.
Sources
Discharge Abstract
Database 2008-2009
to 2011-2012, and
National Ambulatory
Care Reporting System
2008-2009 to 2009-2010,
Canadian Institute for
Health Information.

Health Quality Ontario | Early Identification of People At-Risk of Hospitalization | Technical Appendix 3
Figure 2: Distribution of Complex Algorithm Score for Admission within 30 Days at Patient Level
0
5000
10000
15000
20000
25000
30000
35000
0 2 4 6 8 10 12 14 16 18 20 22 24 26 28 30 32 34+
Freq
uenc
y o
f P
atie
nts
Score for Complex Algorithm
Percentiles of Score50th percentile: 975th percentile: 1390th percentile: 18
Figure 3: Distribution of Simple Algorithm Score for Admission within 15 Months at Patient Level
0
10000
20000
30000
40000
50000
60000
70000
1 2 3 4 5 6 7 8 9 10 11 12+
Freq
uenc
y o
f P
atie
nts
Score for Simple Algorithm
Percentiles of Score50th percentile: 475th percentile: 690th percentile: 7
Notes
The results are based on
Ontario and Manitoba.
Sources
Discharge Abstract
Database 2008-2009
to 2011-2012, and
National Ambulatory
Care Reporting System
2008-2009 to 2009-2010,
Canadian Institute for
Health Information.
Notes
The results are based on
Ontario and Manitoba.
Sources
Discharge Abstract
Database 2008-2009
to 2011-2012, and
National Ambulatory
Care Reporting System
2008-2009 to 2009-2010,
Canadian Institute for
Health Information.

4 Health Quality Ontario | Early Identification of People At-Risk of Hospitalization | Technical Appendix
Figure 4: Distribution of Complex Algorithm Score for Admission within 15 Months at Patient Level
0
2000
4000
6000
8000
10000
12000
14000
16000
18000
0 2 4 6 8 10 12 14 16 18 20 22 24 26 28 30 32 34 36 38 40 42 44+
Freq
uenc
y o
f P
atie
nts
Score for Complex Algorithm
Percentiles of Score50th percentile: 1775th percentile: 2290th percentile: 30
The following tables plot the expected versus observed rate of admissions, over the number of admissions per risk score, for
each HARP algorithm. Note: score percentiles differ from the percentiles in the above patient distribution graphs, as these are
based on admissions, not patients. A patient with multiple admissions would be represented multiple times in the below data,
as each admission would be counted and scored separately.
Figure 5: Calibration Curve of the Simple Algorithm for Admission within 30 Days based on Validation Data
0
5000
10000
15000
20000
25000
30000
0 2 4 6 8 10 12 14 16 18 20 22 24 26 28 30 32 34+
Ad
mis
sio
n R
ate
wit
hin
30 D
ays
No
. of
Ep
iso
des
Score for Simple Algorithm
No. of Episodes Expected Rate Observed Rate
Percentiles of Score50th percentile: 975th percentile: 1390th percentile: 18
0
10
20
30
40
50
60
70
Notes
The results are based on
Ontario and Manitoba.
Sources
Discharge Abstract
Database 2008-2009
to 2011-2012, and
National Ambulatory
Care Reporting System
2008-2009 to 2009-2010,
Canadian Institute for
Health Information.
Notes
The results are based on
Ontario and Manitoba.
Sources
Discharge Abstract
Database 2008-2009
to 2011-2012, and
National Ambulatory
Care Reporting System
2008-2009 to 2009-2010,
Canadian Institute for
Health Information.
Health Quality Ontario | Early Identification of People At-Risk of Hospitalization | Technical Appendix 5
Figure 6: Calibration Curve of the Complex Algorithm for Admission within 30 Days based on Validation Data
0
10
20
30
40
50
60
70
80
0
5000
10000
15000
20000
25000
0 2 4 6 8 10 12 14 16 18 20 22 24 26 28 30 32 34
Ad
mis
sio
n R
ate
wit
hin
30 D
ays
No
. of
Ep
iso
des
Score for Complex Algorithm
No. of Episodes Expected Rate Observed Rate
Percentiles of Score50th percentile: 1075th percentile: 1490th percentile: 19
Figure 7: Calibration Curve of the Simple Algorithm for Admission within 15 Months based on Validation Data
0
10
20
30
40
50
60
70
80
90
100
0
5000
10000
15000
20000
25000
30000
35000
40000
45000
0 1 2 3 4 5 6 7 8 9 10 11 12+
Ad
mis
sio
n R
ate
wit
hin
15 M
ont
hs
No
. of
Ep
iso
des
Score for Simple Algorithm
No. of Episodes Expected Rate Observed Rate
Percentiles of Score50th percentile: 575th percentile: 690th percentile: 8
Notes
The results are based on
Ontario and Manitoba.
Sources
Discharge Abstract
Database 2008-2009
to 2011-2012, and
National Ambulatory
Care Reporting System
2008-2009 to 2009-2010,
Canadian Institute for
Health Information.
Notes
The results are based on
Ontario and Manitoba.
Sources
Discharge Abstract
Database 2008-2009
to 2011-2012, and
National Ambulatory
Care Reporting System
2008-2009 to 2009-2010,
Canadian Institute for
Health Information.

6 Health Quality Ontario | Early Identification of People At-Risk of Hospitalization | Technical Appendix
Figure 8: Calibration Curve of the Complex Algorithm for Admission within 15 Months based on Validation Data
0
10
20
30
40
50
60
70
80
90
100
0
2000
4000
6000
8000
10000
12000
0 2 4 6 8 10 12 14 16 18 20 22 24 26 28 30 32 34 36 38 40 42 44+
Ad
mis
sio
n R
ate
wit
hin
15 M
ont
hs
No
. of
Ep
iso
de
Score for Complex Algorithm
No. of Episodes Expected Rate Observed Rate
Percentiles of Score50th percentile: 1875th percentile: 2490th percentile: 30
Notes
The results are based
on Ontario and
Manitoba.
Sources
Discharge Abstract
Database 2008-2009
to 2011-2012, and
National Ambulatory
Care Reporting
System 2008-2009 to
2009-2010, Canadian
Institute for Health
Information.

Health Quality Ontario | Early Identification of People At-Risk of Hospitalization | Technical Appendix 7
Final results for the four HARP algorithms:
Table 1: The simple algorithm for the admission within one month
Variable name Parameters Odds ratios and 95% CI
Assigned score
Max score for variable
Patient age group65-84 vs. 18-64 1.32 (1.28,1.36) 3 3
85+ 1.26 (1.21,1.31) 2
Discharge disposition
Transfer to acute care vs. home and others 1.76 (1.52,2.05)
6 6
Transfer to home with support 1.43 (1.38,1.48) 4
Acute care admission six months prior
1 vs. 0 1.36 (1.31,1.41) 3 12
2 1.84 (1.75,1.93) 6
3+ 3.09 (2.93,3.27) 12
Emergency department visits six months prior
1 vs. 0 1.45 (1.33,1.57) 4 10
2 1.84 (1.69,2.00) 6
3 1.97 (1.81,2.15) 7
4+ 2.55 (2.34,2.77) 10
Missing (MB patients) 1.89 (1.73,2.06) 6
Select CMG
(vs. all other CMG)
Chronic obstructive pulmonary disease 139 1.28 (1.22,1.35)
3 10
Heart failure without coronary angiogram 196 1.50 (1.42,1.58)
4
Inflammatory bowel disease 253 1.70 (1.47,1.96) 5
Gastrointestinal obstruction 255 1.24 (1.14,1.36) 2
Cirrhosis/alcoholic hepatitis 285 2.74 (2.43,3.09) 10
Diabetes 437 1.10 (1.00,1.22) 1 Notes The results are based on Ontario and Manitoba. R square: 0.0705. C statistic: 0.661. Hosmer and Lemeshow Goodness-of-fit test: chi-square 62.41, p<0.0001. Sources Discharge Abstract Database 2008-2009 to 2011-2012, and National Ambulatory Care Reporting System 2008-2009 to 2009-2010, Canadian Institute for Health Information.
Table 2: The complex algorithm for the admission within one month
Variables Parameters Odds ratios and 95% CI
Assigned score
Max score for variable
Patient age group 65-84 vs. 18-64 1.23 (1.19,1.27) 2 2
85+ vs. 18,64 1.19 (1.14,1.24) 2
Discharge disposition
Transfer to acute care vs. home and others
1.79 (1.54,2.08) 6 6
Transfer to home with support 1.34 (1.29,1.38) 3
Acute care admission six months prior
1 vs. 0 1.35 (1.30,1.40) 3 10
2 1.79 (1.70,1.88) 5
3+ 2.96 (2.80,3.13) 10

8 Health Quality Ontario | Early Identification of People At-Risk of Hospitalization | Technical Appendix
Variables Parameters Odds ratios and 95% CI
Assigned score
Max score for variable
Emergency department visits six months prior
1 vs. 0 1.24 (1.14,1.36) 2 7
2 1.56 (1.43,1.71) 4
3 1.66 (1.51,1.83) 5
4+ 2.16 (1.97,2.37) 7
Missing (MB patients) 1.69 (1.53,1.85) 5
Admission via emergency department Yes vs. No
1.19 (1.14,1.25) 2 2
Charlson index 1 vs. 0 1.35 (1.30,1.41) 3 4
2 1.29 (1.23,1.35) 2
3+ 1.46 (1.39,1.54) 4
Resource intensity level
2 vs. 1 1.11 (1.08,1.15) 1 2
3 1.22 (1.15,1.28) 2
4 1.24 (1.17,1.31) 2
Paracentesis Yes vs. No 1.36 (1.21,1.54) 3 3
Select CMG (vs. all other CMG)
Malignant neoplasm of respiratory System 132
1.64 (1.44,1.86) 5 8
Aspiration pneumonia 135 1.30 (1.10,1.53) 2
Chronic obstructive pulmonary disease 139
1.35 (1.28,1.43) 3
Other lung disease 142 1.26 (1.05,1.51) 2
Disease of pleura 143 1.59 (1.35,1.88) 4
Myocardial infarction/shock/arrest without coronary angiogram 194
1.51 (1.37,1.65) 4
Heart failure without coronary angiogram 196
1.49 (1.41,1.58) 4
Severe enteritis 248 1.41 (1.24,1.61) 3
Digestive malignancy 250 1.71 (1.45,2.02) 5
Inflammatory bowel disease 253 1.84 (1.59,2.13) 6
Hepatobiliary/pancreatic malignancy 284
1.77 (1.46,2.15) 5
Cirrhosis/alcoholic hepatitis 285 2.40 (2.12,2.72) 8
Disorder of pancreas except malignancy 287
1.39 (1.25,1.54) 3
Disorder of biliary tract 288 1.36 (1.21,1.54) 3
Dehydration 438 1.42 (1.21,1.67) 3
Renal failure 477 1.42 (1.28,1.58) 3
Lymphoma 628 2.07 (1.68,2.55) 7
Other anemia 635 1.39 (1.23,1.57) 3 Notes The results are based on Ontario and Manitoba. R square: 0.0818. C statistic: 0.678. Hosmer and Lemeshow Goodness-of-fit test: chi-square 189.02, p<0.0001. Sources Discharge Abstract Database 2008-2009 to 2011-2012, and National Ambulatory Care Reporting System 2008-2009 to 2009-2010, Canadian Institute for Health Information.
Health Quality Ontario | Early Identification of People At-Risk of Hospitalization | Technical Appendix 9
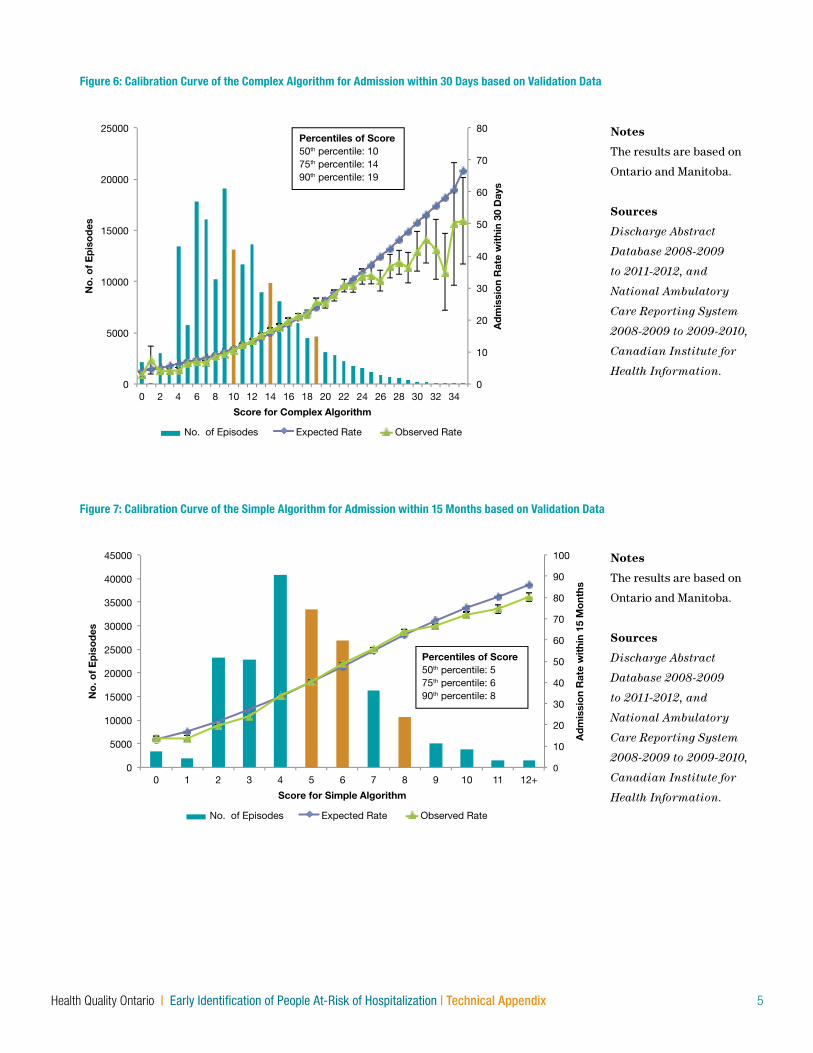
Table 3: The simple algorithm for the admission within 15 months
Variables Parameters Odds ratios and 95% CI
Assigned score
Max score for variable
Patient age group65-84 vs. 18-64 1.68 (1.64,1.71) 2 2
85+ vs. 18-64 1.96 (1.91,2.02) 2
Discharge disposition
Transfer to home care vs. others 1.54 (1.50,1.57) 1 1
Acute care admission six months prior
1 vs. 0 1.35 (1.32,1.38) 1 4
2 1.84 (1.77,1.91) 2
3+ 2.86 (2.72,3.00) 4
Emergency department visits six months prior
1 vs. 0 1.73 (1.64,1.82) 2 4
2 2.24 (2.12,2.36) 3
3 2.57 (2.43,2.72) 3
4+ 3.57 (3.38,3.78) 4
Missing (MB patients) 2.42 (2.29,2.57) 3
Select CMG
(vs. all other CMG)
Chronic obstructive pulmonary disease 139
2.10 (2.01,2.18) 2 4
Heart failure without coronary angiogram 196
2.00 (1.91,2.09) 2
Inflammatory bowel disease 253 1.86 (1.66,2.08) 2
Gastrointestinal obstruction 255 1.36 (1.27,1.45) 1
Cirrhosis/alcoholic hepatitis 285 3.38 (3.00,3.81) 4
Diabetes 437 1.61 (1.50,1.73) 2 Notes The results are based on Ontario and Manitoba. R square: 0.1343. C statistic: 0.687. Hosmer and Lemeshow Goodness-of-fit test: chi-square 289.25, p<0.0001. Sources Discharge Abstract Database 2008-2009 to 2011-2012, and National Ambulatory Care Reporting System 2008-2009 to 2009-2010, Cana-dian Institute for Health Information.
Table 4: The complex algorithm for the admission within 15 months
Variables ParametersOdds ratios and
95% CIAssigned
score
Max score for variable
Patient age group
65-84 vs. 18-64 1.53 (1.49,1.56) 5 6
85+ 1.80 (1.74,1.85) 6
Discharge disposition
Transfer to home care vs. others 1.41 (1.37,1.45) 4 4
Acute care admission six months prior
1 vs. 0 1.37 (1.34,1.41) 4 11
2 1.84 (1.77,1.92) 7
3+ 2.81 (2.67,2.95) 11
Emergency department visits six months prior
1 vs. 0 1.27 (1.20,1.34) 3 10
2 1.61 (1.52,1.71) 5
3 1.82 (1.71,1.94) 7
4+ 2.53 (2.38,2.69) 10
Missing (MB patients) 1.83 (1.72,1.95) 7

10 Health Quality Ontario | Early Identification of People At-Risk of Hospitalization | Technical Appendix
Variables ParametersOdds ratios and
95% CIAssigned
score
Max score for variable
Admission via emergency department
Yes vs. No 1.30 (1.26,1.35) 3 3
Charlson index
1 vs. 0 1.65 (1.61,1.70) 6 6
2 1.20 (1.16,1.24) 2
3+ 1.30 (1.25,1.35) 3
Resource intensity level
2 vs. 1 1.09 (1.07,1.12) 1 2
3 1.17 (1.12,1.21) 2
4 1.18 (1.12,1.24) 2
Index length of stay
3 to 7 days vs. 0 to 2 days 1.28 (1.25,1.31) 3 4
8 to 14 days 1.40 (1.36,1.45) 4
15 to 30 days 1.28 (1.23,1.33) 3
Over 30 days 1.10 (1.04,1.16) 1
Select CMG
(vs. all other CMG)
Seizure disorder, except status epilepticus 040
1.32 (1.20,1.45) 3 13
Aspiration pneumonia 135 1.34 (1.18,1.53) 3
Chronic obstructive pulmonary disease 139 2.14 (2.05,2.23) 8
Other lung disease 142 1.66 (1.45,1.90) 6
Disease of pleura 143 1.24 (1.08,1.43) 2
Myocardial infarction/shock/arrest without coronary angiogram 194
1.43 (1.33,1.53) 4
Heart failure without coronary angiogram 196
1.80 (1.72,1.89) 7
Unstable angina/atherosclerotic heart disease without coronary angiogram 204
1.37 (1.25,1.49) 3
Inflammatory bowel disease 253 1.92 (1.72,2.15) 7
Gastrointestinal obstruction 255 1.49 (1.39,1.59) 4
Esophagitis/gastritis/miscellaneous digestive disease 256
1.42 (1.28,1.59) 4
Symptom/sign of digestive system 257 1.38 (1.30,1.46) 4
Cirrhosis/alcoholic hepatitis 285 3.15 (2.79,3.55) 13
Disorder of pancreas except malignancy 287 1.49 (1.38,1.60) 4
Diabetes 437 1.61 (1.50,1.73) 5
Dehydration 438 1.26 (1.10,1.43) 3
Renal failure 477 1.42 (1.31,1.54) 4
Lymphoma 628 1.37 (1.15,1.65) 4
Other anemia 635 1.56 (1.42,1.71) 5 Notes The results are based on Ontario and Manitoba. R square: 0.1562. C statistic: 0.702. Hosmer and Lemeshow Goodness-of-fit test: chi-square 424.90, p<0.0001. Sources Discharge Abstract Database 2008-2009 to 2011-2012, and National Ambulatory Care Reporting System 2008-2009 to 2009-2010, Canadian Institute for Health Information.

Health Quality Ontario | Early Identification of People At-Risk of Hospitalization | Technical Appendix 11
Table 5: Simple algorithm for 30-day admission
50th percentile 75th percentile 90th percentile Event rate
Percentage of general population 1.5% 0.8% 0.3%
Sensitivity 75.28% 48.82% 24.12%
Specificity 45.71% 74.34% 91.39%
PV+ 17.08% 22.04% 29.38% 12.94%
PV- 92.56% 90.72% 89.02% 87.06%
Kappa 0.09 0.15 0.17 Notes The results are based on Ontario and Manitoba.
Sources Discharge Abstract Database 2008-2009 to 2011-2012, and National Ambulatory Care Reporting System 2008-2009 to 2009-2010, Canadian Institute for Health Information.
Table 6: Complex algorithm for 30-day admission
50th percentile 75th percentile 90th percentile Event rate
Percentage of general population 1.5% 0.8% 0.3%
Sensitivity 74.85% 50.65% 24.26%
Specificity 49.82% 74.63% 91.45%
PV+ 18.14% 22.88% 29.65% 12.94%
PV- 93.02% 91.05% 89.04% 87.06%
Kappa 0.11 0.17 0.17 Notes The results are based on Ontario and Manitoba.
Sources Discharge Abstract Database 2008-2009 to 2011-2012, and National Ambulatory Care Reporting System 2008-2009 to 2009-2010, Canadian Institute for Health Information.
Table 7: Simple algorithm for 15-month admission
50th percentile 75th percentile 90th percentile Event rate
Percentage of general population 1.5% 0.8% 0.3%
Sensitivity 67.55% 49.57% 20.19%
Specificity 58.46% 75.61% 93.69%
PV+ 51.48% 57.01% 67.62% 39.49%
PV- 73.41% 69.68% 64.27% 60.51%
Kappa 0.25 0.26 0.16 Notes The results are based on Ontario and Manitoba.
Sources Discharge Abstract Database 2008-2009 to 2011-2012, and National Ambulatory Care Reporting System 2008-2009 to 2009-2010, Canadian Institute for Health Information.

12 Health Quality Ontario | Early Identification of People At-Risk of Hospitalization | Technical Appendix
Table 8: Complex algorithm for 15-month admission
50th percentile 75th percentile 90th percentile Event rate
Percentage of general population 1.5% 0.8% 0.3%
Sensitivity 69.88% 42.52% 20.15%
Specificity 58.59% 81.93% 93.74%
PV+ 52.41% 60.55% 67.76% 39.49%
PV- 74.88% 68.59% 64.27% 60.51%
Kappa 0.27 0.26 0.16
Notes The results are based on Ontario and Manitoba.
Sources Discharge Abstract Database 2008-2009 to 2011-2012, and National Ambulatory Care Reporting System 2008-2009 to 2009-2010, Canadian Institute for Health Information.
The following tables display results for the initial Phase 1 analysis, which included all variables considered for inclusion in the HARP algorithms.
Table 9: The association of candidate predictors with one, six and 12 month(s) admission
Variable name Parameters Odds Ratios and 95% Confidence Intervals
One month Six months 12 months
Patient age group 25-34 vs. 18-24 1.08 (0.99,1.17) 1.07 (1.01,1.14) 1.08 (1.02,1.14)
35-44 1.09 (1.01,1.18) 1.11 (1.05,1.17) 1.14 (1.08,1.20)
45-54 1.16 (1.07,1.24) 1.20 (1.13,1.26) 1.24 (1.18,1.31)
55-64 1.25 (1.17,1.35) 1.33 (1.26,1.40) 1.40 (1.34,1.47)
65-74 1.39 (1.29,1.49) 1.54 (1.46,1.62) 1.69 (1.61,1.77)
75-84 1.48 (1.38,1.59) 1.78 (1.69,1.88) 2.06 (1.96,2.16)
85+ 1.51 (1.40,1.62) 1.95 (1.84,2.05) 2.33 (2.22,2.45)
Sex Male vs. female 1.05 (1.03,1.07) 1.05 (1.03,1.06) 1.03 (1.02,1.05)
Residence place Rural vs. urban 1.02 (0.99,1.05) 1.01 (0.99,1.03) 1.00 (0.98,1.03)
Neighbourhood Income
quintiles
Not assigned
vs. five most
affluent
0.99 (0.87,1.13) 0.98 (0.88,1.08) 0.98 (0.89,1.08)
1 1.01 (0.96,1.05) 1.02 (0.98,1.05) 1.05 (1.01,1.08)
2 1.02 (0.98,1.06) 1.01 (0.98,1.04) 1.02 (0.99,1.05)
3 1.02 (0.99,1.06) 1.01 (0.98,1.03) 1.01 (0.98,1.03)
4 1.02 (0.99,1.06) 1.02 (0.99,1.04) 1.01 (0.98,1.03)
Community admission rate
for medical patients (per 100
population)
5 to 7 vs. <5 1.01 (0.88,1.16) 0.98 (0.88,1.08) 0.95 (0.86,1.05)
8 to 9 1.16 (1.01,1.34) 1.17 (1.05,1.30) 1.16 (1.05,1.28)
10 + 1.22 (1.06,1.41) 1.27 (1.14,1.41) 1.30 (1.18,1.44)
Ethnic concentration 2 vs. 1 least
marginalized
0.99 (0.95,1.02) 0.98 (0.96,1.01) 0.97 (0.95,1.00)

Health Quality Ontario | Early Identification of People At-Risk of Hospitalization | Technical Appendix 13
Variable name Parameters Odds Ratios and 95% Confidence Intervals
One month Six months 12 months
3 1.01 (0.97,1.04) 1.00 (0.97,1.02) 1.01 (0.98,1.03)
4 1.04 (1.00,1.08) 1.03 (1.00,1.06) 1.02 (1.00,1.05)
5 1.07 (1.03,1.11) 1.04 (1.01,1.07) 1.03 (1.00,1.06)
Not assigned
vs. 1
1.07 (1.00,1.15) 1.12 (1.06,1.18) 1.13 (1.08,1.19)
Dependency 2 vs. 1 least
marginalized
0.99 (0.96,1.03) 1.01 (0.99,1.04) 1.02 (0.99,1.04)
3 1.01 (0.98,1.05) 1.00 (0.97,1.03) 1.00 (0.97,1.03)
4 1.02 (0.98,1.06) 1.01 (0.98,1.04) 1.01 (0.98,1.04)
5 1.00 (0.96,1.04) 0.98 (0.96,1.01) 0.98 (0.95,1.01)
Material deprivation 2 vs. 1 least
marginalized
0.97 (0.94,1.00) 1.01 (0.98,1.03) 1.01 (0.99,1.04)
3 0.98 (0.95,1.02) 1.02 (0.99,1.05) 1.03 (1.00,1.05)
4 0.99 (0.95,1.03) 1.02 (0.99,1.05) 1.04 (1.01,1.07)
5 1.00 (0.95,1.04) 1.05 (1.02,1.09) 1.06 (1.02,1.09)
Residential instability 2 vs. 1 least
marginalized
0.98 (0.95,1.02) 1.02 (0.99,1.04) 1.03 (1.00,1.05)
3 1.04 (1.00,1.08) 1.05 (1.02,1.08) 1.06 (1.03,1.09)
4 1.02 (0.99,1.06) 1.07 (1.04,1.10) 1.09 (1.06,1.11)
5 1.06 (1.02,1.10) 1.11 (1.08,1.15) 1.14 (1.11,1.17)
Admission via emergency
department
Yes vs. No 1.09 (1.05,1.13) 1.13 (1.10,1.16) 1.14 (1.11,1.17)
Resource intensity level 2 vs. 1 1.09 (1.06,1.12) 1.09 (1.07,1.11) 1.09 (1.07,1.11)
3 1.16 (1.11,1.20) 1.14 (1.10,1.18) 1.11 (1.08,1.15)
4+ 1.23 (1.17,1.30) 1.18 (1.13,1.23) 1.14 (1.10,1.19)
Discharge disposition Transfer to acute
care 01 vs.
discharge home
05
1.82 (1.64,2.02) 1.19 (1.08,1.30) 1.00 (0.92,1.10)
Transfer
continuing care
02
0.74 (0.72,0.77) 0.77 (0.75,0.79) 0.75 (0.73,0.77)
Transfer to
others 03
0.89 (0.78,1.01) 0.65 (0.58,0.72) 0.61 (0.55,0.67)
Discharge to
home with
support 04
1.20 (1.17,1.23) 1.25 (1.23,1.28) 1.26 (1.24,1.29)
Acute care admission six 1 vs. 0 1.40 (1.36,1.43) 1.45 (1.42,1.48) 1.43 (1.40,1.45)
months prior 2 1.81 (1.75,1.88) 2.01 (1.95,2.07) 1.93 (1.88,1.99)
3+ 3.00 (2.88,3.12) 3.34 (3.22,3.46) 3.03 (2.92,3.14)

14 Health Quality Ontario | Early Identification of People At-Risk of Hospitalization | Technical Appendix
Variable name Parameters Odds Ratios and 95% Confidence Intervals
One month Six months 12 months
Emergency department visit
six months prior
1 vs. 0 1.15 (1.08,1.23) 1.12 (1.07,1.17) 1.14 (1.09,1.19)
2 1.42 (1.33,1.52) 1.41 (1.34,1.47) 1.43 (1.37,1.50)
3 1.56 (1.46,1.67) 1.59 (1.51,1.67) 1.65 (1.57,1.72)
4+ 1.95 (1.82,2.08) 2.14 (2.03,2.25) 2.22 (2.12,2.32)
Missing
(Manitoba
patients)
1.42 (1.32,1.52) 1.42 (1.35,1.50) 1.42 (1.36,1.49)
Total length of stay three to seven
days vs. 0 to
two days
1.12 (1.09,1.15) 1.20 (1.18,1.22) 1.23 (1.20,1.25)
eight to 14 days 1.21 (1.17,1.25) 1.33 (1.29,1.36) 1.36 (1.32,1.39)
15 to 30 days 1.15 (1.10,1.20) 1.29 (1.25,1.33) 1.32 (1.28,1.36)
over 30 days 0.95 (0.90,1.01) 1.10 (1.05,1.15) 1.11 (1.07,1.16)
SCU admission Yes vs. No 1.07 (1.04,1.11) 1.08 (1.05,1.11) 1.07 (1.04,1.09)
Select intervention
(Yes vs. No)
Cardioversion 1.16 (0.97,1.37) 1.02 (0.89,1.18) 1.01 (0.88,1.15)
Chemotherapy 1.45 (1.30,1.62) 1.25 (1.13,1.37) 1.22 (1.11,1.34)
Dialysis 1.07 (1.00,1.15) 1.44 (1.36,1.52) 1.62 (1.53,1.71)
Heart
resuscitation
1.55 (1.06,2.27) 1.41 (1.02,1.95) 1.17 (0.85,1.61)
Mechanical
ventilation no
less than 96
hours
0.84 (0.72,0.98) 0.81 (0.72,0.91) 0.92 (0.83,1.03)
Mechanical
ventilation less
than 96 hours
0.90 (0.80,1.00) 0.97 (0.89,1.05) 0.98 (0.90,1.06)
Feeding tubes 0.99 (0.87,1.12) 1.14 (1.04,1.26) 1.13 (1.03,1.24)
Paracentesis 1.34 (1.23,1.46) 1.24 (1.14,1.34) 1.14 (1.06,1.23)
Parenteral
nutrition
1.07 (0.94,1.22) 1.00 (0.89,1.11) 0.96 (0.86,1.07)
Pleurocentesis 1.08 (1.00,1.17) 0.95 (0.89,1.01) 0.90 (0.85,0.96)
Radiotherapy 0.93 (0.82,1.04) 0.95 (0.86,1.05) 0.89 (0.80,0.98)
Tracheostomy 1.22 (0.95,1.56) 1.20 (1.00,1.45) 1.12 (0.94,1.34)
Vascular access
device
1.07 (1.01,1.14) 1.11 (1.05,1.16) 1.12 (1.07,1.18)

Health Quality Ontario | Early Identification of People At-Risk of Hospitalization | Technical Appendix 15
Variable name Parameters Odds Ratios and 95% Confidence Intervals
One month Six months 12 months
Top 80% CMG with high
volume of readmission
(vs. leftover 20% CMG)
Ischemic event
of central
nervous system
026
0.74 (0.67,0.82) 0.75 (0.71,0.81) 0.82 (0.77,0.87)
Unspecified
stroke 028
0.73 (0.64,0.83) 0.83 (0.77,0.91) 0.87 (0.81,0.94)
Transient
ischemic attack
029
0.81 (0.71,0.92) 0.86 (0.78,0.94) 0.90 (0.83,0.98)
Neoplasm of
central nervous
system 038
1.31 (1.11,1.55) 1.13 (0.99,1.29) 0.91 (0.80,1.03)
Seizure disorder,
except status
epilepticus 040
0.91 (0.82,1.02) 1.24 (1.15,1.34) 1.38 (1.29,1.48)
Malignant
neoplasm of
respiratory
system 132
1.54 (1.39,1.69) 1.39 (1.28,1.50) 1.20 (1.11,1.30)
Aspiration
pneumonia 135
1.42 (1.26,1.60) 1.49 (1.36,1.64) 1.47 (1.34,1.61)
Bacterial
pneumonia 136
1.11 (0.94,1.31) 1.12 (0.98,1.27) 1.09 (0.97,1.23)
Viral/
Unspecified
pneumonia 138
1.07 (1.01,1.13) 1.13 (1.08,1.18) 1.17 (1.13,1.22)
Chronic
obstructive
pulmonary
disease 139
1.42 (1.36,1.48) 1.83 (1.77,1.89) 2.05 (1.98,2.11)
Other lung
disease 142
1.33 (1.17,1.51) 1.57 (1.42,1.73) 1.55 (1.41,1.71)
Disease of
pleura 143
1.42 (1.24,1.62) 1.43 (1.27,1.59) 1.36 (1.22,1.52)
Symptom/sign
of respiratory
system 149
1.10 (0.95,1.26) 1.27 (1.14,1.41) 1.27 (1.15,1.40)
Myocardial
infarction/
shock/arrest
with coronary
angiogram 193
1.08 (0.96,1.20) 0.95 (0.87,1.03) 0.90 (0.83,0.98)

16 Health Quality Ontario | Early Identification of People At-Risk of Hospitalization | Technical Appendix
Variable name Parameters Odds Ratios and 95% Confidence Intervals
One month Six months 12 months
Top 80% CMG with high
volume of readmission
(vs. leftover 20% CMG)
Myocardial
infarction/shock/
arrest without
coronary
angiogram 194
1.48 (1.38,1.58) 1.46 (1.38,1.54) 1.39 (1.32,1.46)
Heart failure
without
coronary
angiogram 196
1.49 (1.43,1.56) 1.81 (1.75,1.88) 1.85 (1.78,1.91)
Pulmonary
embolism 200
0.85 (0.75,0.96) 0.83 (0.76,0.91) 0.78 (0.71,0.85)
Arrhythmia
without
coronary
angiogram 202
1.13 (1.06,1.20) 1.11 (1.06,1.17) 1.10 (1.05,1.15)
Unstable
angina/
atherosclerotic
heart disease
with coronary
angiogram 203
0.68 (0.59,0.79) 0.67 (0.61,0.75) 0.68 (0.62,0.75)
Unstable
angina/
atherosclerotic
heart disease
without
coronary
angiogram 204
1.20 (1.09,1.30) 1.25 (1.16,1.33) 1.32 (1.23,1.40)
Syncope 205 0.71 (0.64,0.80) 0.86 (0.80,0.93) 0.90 (0.85,0.97)
Angina (except
unstable)/chest
pain without
coronary
angiogram 208
0.77 (0.71,0.83) 0.86 (0.81,0.90) 0.94 (0.90,0.99)
Other/
miscellaneous
cardiac disorder
209
1.09 (1.01,1.19) 1.12 (1.05,1.19) 1.12 (1.05,1.19)
Severe enteritis
248
1.41 (1.28,1.55) 1.15 (1.06,1.24) 1.05 (0.98,1.14)
Digestive
malignancy 250
1.77 (1.58,1.99) 1.30 (1.17,1.43) 1.02 (0.92,1.12)

Health Quality Ontario | Early Identification of People At-Risk of Hospitalization | Technical Appendix 17
Variable name Parameters Odds Ratios and 95% Confidence Intervals
One month Six months 12 months
Top 80% CMG with high
volume of readmission
(vs. leftover 20% CMG)
Inflammatory
bowel disease
253
1.67 (1.49,1.86) 1.82 (1.67,1.99) 1.93 (1.78,2.09)
Gastrointestinal
hemorrhage 254
1.09 (1.01,1.17) 1.08 (1.02,1.14) 1.10 (1.04,1.16)
Gastrointestinal
obstruction 255
1.33 (1.24,1.42) 1.49 (1.41,1.56) 1.53 (1.45,1.60)
Esophagitis/
gastritis/
miscellaneous
digestive
disease 256
1.23 (1.11,1.37) 1.35 (1.25,1.47) 1.33 (1.23,1.44)
Symptom/sign
of digestive
system 257
1.32 (1.25,1.40) 1.33 (1.27,1.39) 1.33 (1.27,1.39)
Other
gastrointestinal
disorder 258
1.31 (1.20,1.43) 1.31 (1.22,1.40) 1.24 (1.16,1.33)
Hepatobiliary/
pancreatic
malignancy 284
1.65 (1.44,1.90) 1.33 (1.18,1.50) 1.06 (0.94,1.19)
Cirrhosis/
alcoholic
hepatitis 285
2.51 (2.29,2.75) 2.85 (2.61,3.10) 2.91 (2.66,3.17)
Disorder of
pancreas except
malignancy 287
1.33 (1.23,1.44) 1.55 (1.46,1.64) 1.59 (1.51,1.68)
Disorder of
biliary tract 288
1.40 (1.28,1.52) 1.20 (1.12,1.29) 1.06 (0.99,1.13)
Osteoarthritis
362
0.92 (0.71,1.21) 1.10 (0.91,1.32) 1.13 (0.95,1.34)
Disorder of
fluid/electrolyte
balance 436
1.31 (1.20,1.43) 1.30 (1.21,1.39) 1.27 (1.19,1.36)
Diabetes 437 1.19 (1.11,1.28) 1.46 (1.39,1.55) 1.62 (1.54,1.70)
Dehydration
438
1.46 (1.30,1.64) 1.38 (1.25,1.51) 1.31 (1.19,1.43)
Renal failure 477 1.36 (1.26,1.47) 1.31 (1.23,1.39) 1.30 (1.22,1.38)
Symptom/
sign of urinary
system 484
1.38 (1.23,1.55) 1.06 (0.96,1.16) 0.99 (0.90,1.09)

18 Health Quality Ontario | Early Identification of People At-Risk of Hospitalization | Technical Appendix
Variable name Parameters Odds Ratios and 95% Confidence Intervals
One month Six months 12 months
Top 80% CMG with high
volume of readmission
(vs. leftover 20% CMG)
Urinary
obstruction
without
percutaneous
drainage 486
1.13 (0.98,1.31) 0.97 (0.87,1.08) 0.88 (0.79,0.97)
Lower urinary
tract infection
487
1.15 (1.08,1.22) 1.31 (1.25,1.37) 1.31 (1.25,1.36)
Upper Urinary
tract infection
488
0.85 (0.73,0.99) 0.89 (0.80,0.99) 0.89 (0.80,0.98)
Lymphoma 628 2.09 (1.79,2.43) 1.90 (1.66,2.17) 1.63 (1.42,1.86)
Agranulocytosis
633
1.17 (1.04,1.30) 1.28 (1.17,1.40) 1.21 (1.11,1.32)
Other anemia
635
1.35 (1.23,1.47) 1.50 (1.40,1.60) 1.53 (1.43,1.63)
Chemotherapy/
radiotherapy
admission for
neoplasm 638
0.55 (0.47,0.64) 0.40 (0.35,0.46) 0.38 (0.34,0.43)
Other/
unspecified
septicemia 654
1.11 (1.01,1.23) 1.15 (1.07,1.24) 1.14 (1.06,1.22)
Open wound/
other/
unspecified
minor injury 776
0.67 (0.58,0.79) 0.81 (0.73,0.90) 0.84 (0.77,0.92)
Poisoning/toxic
effect of drug
778
0.73 (0.65,0.81) 0.91 (0.84,0.97) 0.96 (0.90,1.03)
Post-operative
complication
except
hemorrhage 780
1.00 (0.90,1.10) 0.79 (0.73,0.85) 0.71 (0.66,0.77)
Convalescence
806
0.66 (0.60,0.73) 0.66 (0.62,0.71) 0.66 (0.62,0.70)
General
symptom/sign
811
0.97 (0.91,1.04) 1.09 (1.03,1.14) 1.12 (1.07,1.17)
Cancelled
intervention 815
0.51 (0.43,0.59) 0.34 (0.30,0.38) 0.29 (0.25,0.32)

Health Quality Ontario | Early Identification of People At-Risk of Hospitalization | Technical Appendix 19
Variable name Parameters Odds Ratios and 95% Confidence Intervals
One month Six months 12 months
Charlson index 1 vs. 0 1.30 (1.26,1.34) 1.44 (1.40,1.47) 1.52 (1.49,1.55)
2 1.30 (1.26,1.34) 1.30 (1.27,1.34) 1.25 (1.22,1.28)
3+ 1.44 (1.39,1.50) 1.44 (1.40,1.49) 1.36 (1.32,1.41)
Notes The results are based on Ontario and Manitoba. The model for 1 month: R square: 0.0916. C statistic: 0.688. Hosmer and Lemeshow Goodness-of-fit test: chi-square 245.87, p<0.0001.The model for 6 months: R square: 0.1513. C statistic: 0.707. Hosmer and Lemeshow Goodness-of-fit test: chi-square 596.60, p<0.0001.The model for 12 months: R square: 0.1653. C statistic: 0.710. Hosmer and Lemeshow Goodness-of-fit test: chi-square 669.33, p<0.0001.
Sources Discharge Abstract Database 2008-2009 to 2010-2011, and National Ambulatory Care Reporting System 2008-2009 to 2009-2010, Canadian Institute for Health Information.

ISBN 978-1-4606-2934-5 a (PDF)
© Queen’s Printer for Ontario, 2013
Health Quality Ontario
130 Bloor Street West, 10th Floor
Toronto, ON M5S 1N5
Tel: 416-323-6868 | 1-866-623-6868
Fax: 416-323-9261 www.hqontario.ca