Embed Size (px)
Citation preview


TECHNICAL AND POTENTIAL ANALYSIS OF THERMAL COOLING DISTRICTS IN
COLOMBIA
M.Sc. Carlos Mario Ceballos Marín
Ph.D. Candidate
Graz, Austria
2018

Hydro 70%
Thermal 29,51%
Others 0,68%
Energy mix for electricity in Colombia
Location of Colombia
Dat
a ta
ken
fro
m X
M
Energy balance of Colombia (primary resource)
5%
15%
18%
10% 7%
43%
0%
2%
Bagasse Coal Natural gas Hydro Wood Crude Oil Residues Renewables
Dat
a ta
ken
fro
m U
PM
E, 2
01
8

Energy consumption by sector
Dat
a ta
ken
fro
m U
PM
E, 2
01
6
Transport 41%
Industry 30%
Mining 1%
Housing 17%
Agro 0%
No ID 6%
Public & Commerce
5%
Building 0%
Industry and Public & Commercial sectors are the ones where the highest consumption of cold is
observed
Demand considerations:
Cities > 200.000 inhabitants
Average annual temp > 20° C (68 °F)
Selected cities
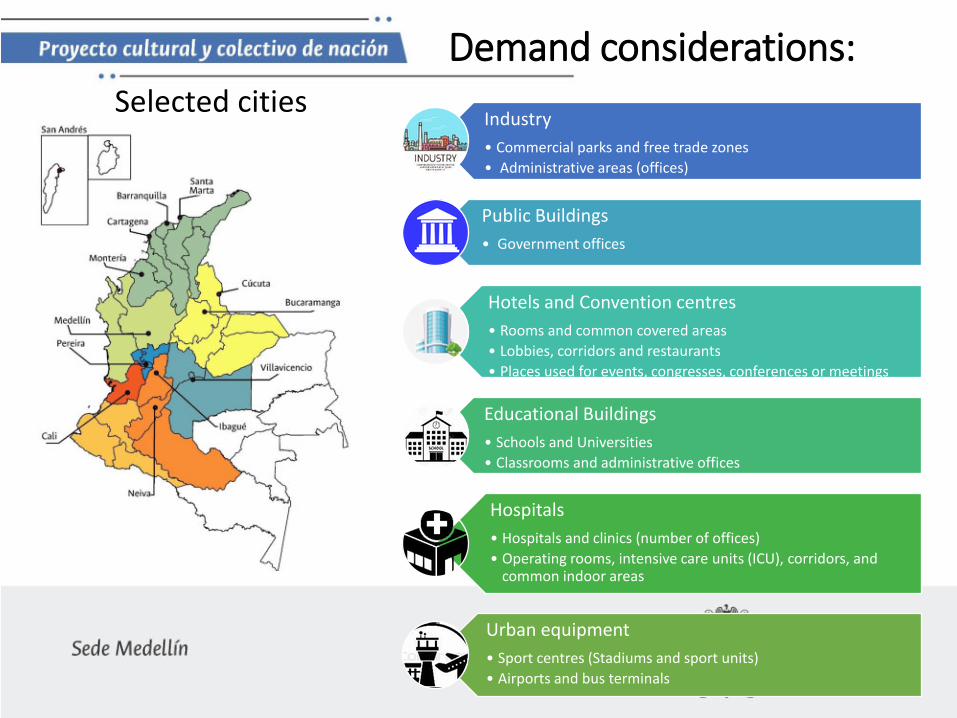
Demand considerations:
Industry
• Commercial parks and free trade zones
• Administrative areas (offices)
Public Buildings
• Government offices
Hotels and Convention centres
• Rooms and common covered areas
• Lobbies, corridors and restaurants
• Places used for events, congresses, conferences or meetings
Educational Buildings
• Schools and Universities
• Classrooms and administrative offices
Hospitals
• Hospitals and clinics (number of offices)
• Operating rooms, intensive care units (ICU), corridors, and common indoor areas
Urban equipment
• Sport centres (Stadiums and sport units)
• Airports and bus terminals

Demand estimations:
𝑃𝑇𝑜𝑡𝑎𝑙 = 𝑃 𝑇 × 𝐴 + 𝐶
𝑷𝑻𝒐𝒕𝒂𝒍 : total energy that must be supplied to a space per unit of time 𝐵𝑇𝑈 ℎ . 𝑷(𝑻) : cooling power that must be supplied to a space per unit of area and time
𝐵𝑇𝑈 ℎ𝑚2 . 𝑨 : area to be cooled in 𝑚2 C : 𝐵𝑇𝑈 ℎ is the thermal load. Additional power that must be supplied to the space to be cooled due to the presence of people or objects in it.
Demand estimations:
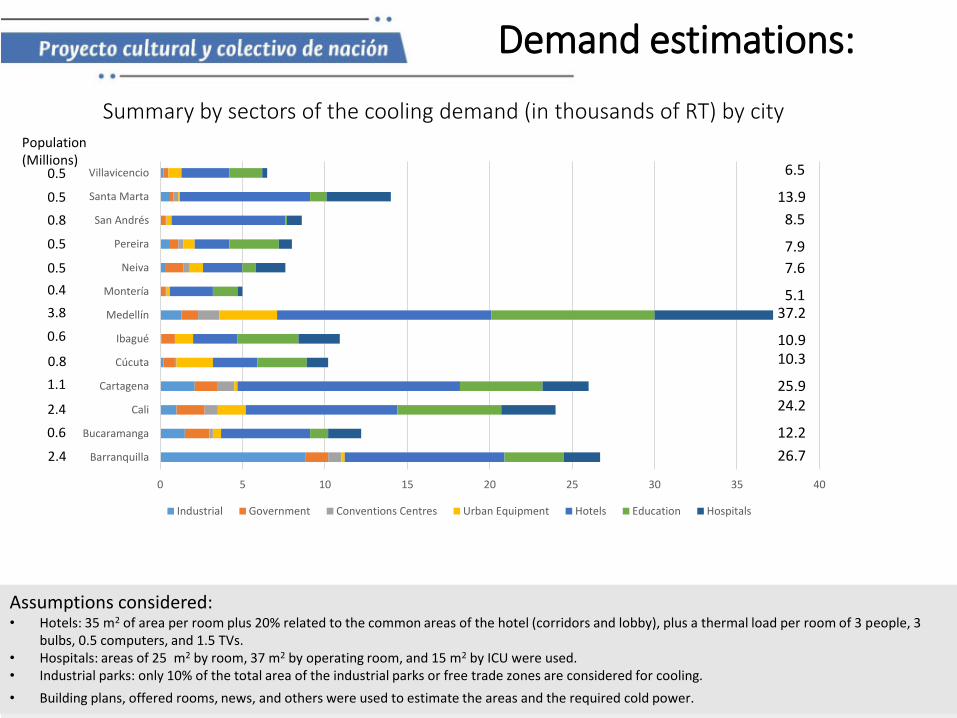
Assumptions considered: • Hotels: 35 m2 of area per room plus 20% related to the common areas of the hotel (corridors and lobby), plus a thermal load per room of 3 people, 3
bulbs, 0.5 computers, and 1.5 TVs. • Hospitals: areas of 25 m2 by room, 37 m2 by operating room, and 15 m2 by ICU were used. • Industrial parks: only 10% of the total area of the industrial parks or free trade zones are considered for cooling.
• Building plans, offered rooms, news, and others were used to estimate the areas and the required cold power.
Summary by sectors of the cooling demand (in thousands of RT) by city
6.5
13.9
8.5
7.9
7.6
5.1 37.2
10.9 10.3
25.9 24.2
12.2
26.7
0 5 10 15 20 25 30 35 40
Barranquilla
Bucaramanga
Cali
Cartagena
Cúcuta
Ibagué
Medellín
Montería
Neiva
Pereira
San Andrés
Santa Marta
Villavicencio
Industrial Government Conventions Centres Urban Equipment Hotels Education Hospitals
0.5
0.5
0.8
0.5
0.5
0.4
3.8
0.6
0.8
1.1
2.4
0.6
2.4
Population (Millions)

Modelling of the offer
Cooling technologies Two cooling technologies
Vapour compression refrigeration cycle
Electric engine
Compression technologies: screw type, positive displacement,
centrifugal type.
Absorption chiller
Allows to recover thermal energy
Industrial processes, exhaust gases, steam surplus and hot water

Modelling of the offer
Cooling district packages
1,200 RT (package 1)
SDMO GXC1200 (MTU Engine) 2 units of Carrier electric
compressor Chiller (Acquaforce)
6,800 RT (package 2)
Taurus T60 Solar turbine 8 units of Carrier electric
compressor Chiller (Acquaforce)
Conventional refrigeration systems use R11, R22 and HFC 134 as the
refrigerant. Model for CDs employ R134a

Modelling the offer
With LEAP tool
Cooling districts aggregated by geography
Rule: For a user to be profitable on a CD, he must demand at least 1 RT every 800 m from the CD
Bocagrande and historic centre
14,000 RT

Modelling of the offer
With LEAP tool
North and Puerto Colombia 19,000 RT

Modelling of the offer
With LEAP tool
Downtown and Industrial zone
10,000 RT
La Alpujarra (Government buildings)
3,600 RT

Modelling of the offer
With LEAP tool
North of the island 6,000 RT
Technologies analysis
Combining local energy resources and technological configurations:
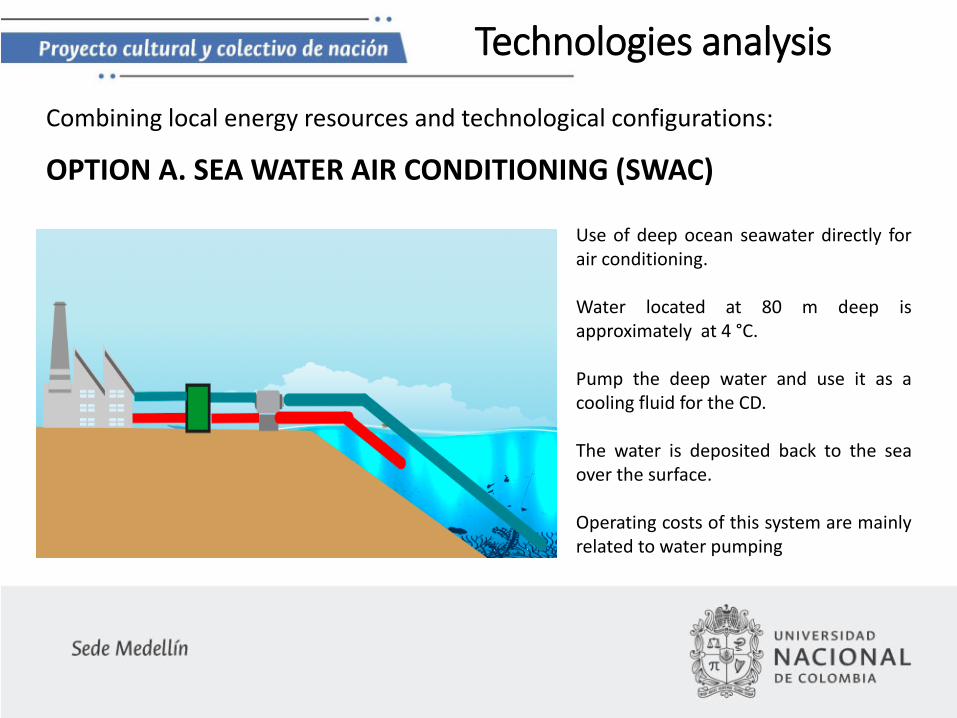
OPTION A. SEA WATER AIR CONDITIONING (SWAC)
Use of deep ocean seawater directly for air conditioning. Water located at 80 m deep is approximately at 4 °C. Pump the deep water and use it as a cooling fluid for the CD. The water is deposited back to the sea over the surface. Operating costs of this system are mainly related to water pumping

Technologies analysis
Combining local energy resources and technological configurations:
OPTION B. COOLING WITH RENEWABLE ENERGIES
Steam compression chillers and absorption chillers. Electricity from wind energy and solar PV, and with energy from SIN as the backup For absorption chillers, the use of hot water from thermal solar energy or hot water coming from industrial processes is proposed.

Technologies analysis
Combining local energy resources and technological configurations: OPTION C. NATURAL GAS COGENERATION AND SOLAR THERMAL/PV
OPTION D. NATURAL GAS OR FLARE GAS COGENERATION

Technologies analysis
Combining local energy resources and technological configurations: OPTION E. ELECTRIC CHILLERS (100%)

Energy resources by region Conventional resources
Non-conventional resources

Technological options by city
Combining local energy resources (conventional and non-conventional) and technological configurations:

Environmental analysis
With LEAP tool
the CD scenario presents a reduction in greenhouse gas emissions with respect to the BAU: an accumulated reduction of 1,500 kTon of CO2 equivalent for 2030 was estimated. By comparing both scenarios at the end of the simulation, it was found that the specific reduction for the last year of the CD scenario compared to the BAU scenario is larger than 50%.
CD scenario considers the use of cogeneration system with natural gas. Using of renewable resources would increase the environmental benefits.

Final report
Total potential of 196,900 RT for the implementation of CDs in Colombia. Medellín is recognised worldwide as the most innovator city, and the potential keeps being higher to install at least four CDs with about 24,000 RT. Tourism
Habitants

Final report
• More efficiency
• Distributed generation
Cogeneration
• Free resource
• Near to Zero emissions
• Distributed generation
Renewable energies
Technologies
Cooling District
Economies of scale
Money Emissions Savings

Acknowledgement
The authors which to thank to “Empresas Públicas de Medellín – EPM” who founded the project “Characterize the supply and demand of thermal energy services in Colombia; and evaluate the technical and economic substitution options from the perspective of implementing Thermal Districts projects” and to the project “Feasibility study of water heating through energy integration of solar energy and heating by submerged pipes in the National Chocolates Company” developed by U.T. INCOMBUSTION and financed by COLCIENCIAS, contract No. FOP44842-474-2016.

Facultad de Minas
Dirección: Carrera 80 Nro. 65 – 223 Bloque M3 – Oficina 214
Medellín, Colombia
(+57 4) 425 53 33
medellin.unal.edu.co
Thanks!!!