Embed Size (px)
Citation preview
1
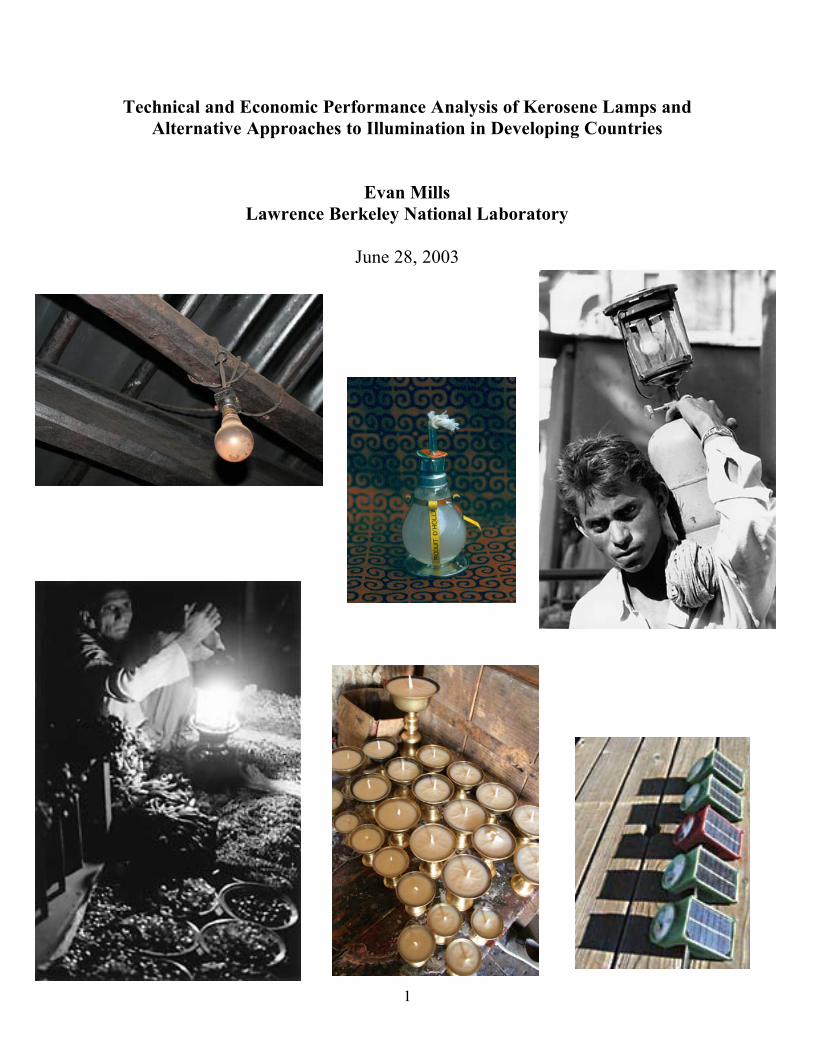
Technical and Economic Performance Analysis of Kerosene Lamps and Alternative Approaches to Illumination in Developing Countries
Evan Mills Lawrence Berkeley National Laboratory
June 28, 2003

2
Technical and Economic Performance Analysis of Kerosene Lamps and Alternative Approaches to Illumination in Developing Countries1
Evan Mills, Ph.D
Energy Analysis Department Lawrence Berkeley National Laboratory
University of California MS 90-4000
Berkeley, CA 94720 USA t: +1.510.486-6784 f: +1.510.486-6996 e: [email protected]
SUMMARY .......................................................................................................................................................... 3
ENERGY UTILIZATION IN TRADITIONAL KEROSENE LAMPS ..................................................... 4
EXPERIMENTAL APPROACH .............................................................................................................................. 4 FINDINGS............................................................................................................................................................ 4
LIGHT OUTPUT, DISTRIBUTION, AND EFFICACY .............................................................................. 5
EXPERIMENTAL APPROACH .............................................................................................................................. 5 FINDINGS............................................................................................................................................................ 6
PHOTOMETRICS OF ALTERNATIVE SYSTEMS BASED ON WHITE SOLID-STATE (LED) SOURCES ............................................................................................................................................................. 9
ENERGY SERVICES AND ENVIRONMENTAL CONSIDERATIONS ............................................... 10
COMPARATIVE ECONOMIC ANALYSIS................................................................................................ 12
SUMMARY AND CONCLUSIONS............................................................................................................... 16
1 Thanks to Akos Borbely, James Galvin, Kevin Gauna, Tomo Otsuka, Erik Page, and Michael Siminovitch
for making the LBNL lighting laboratories available for photometric tests. Robert Clear, Stephen Johnson, Art Rosenfeld, Robert Kostecki, Stephen Wiel, Stephen Selkowitz, and Mark Levine provided useful comments and suggestions. Special thanks to Bill Behrman and other collaborators from the Stanford University Social Entrepreneurship Course of 2003.
3
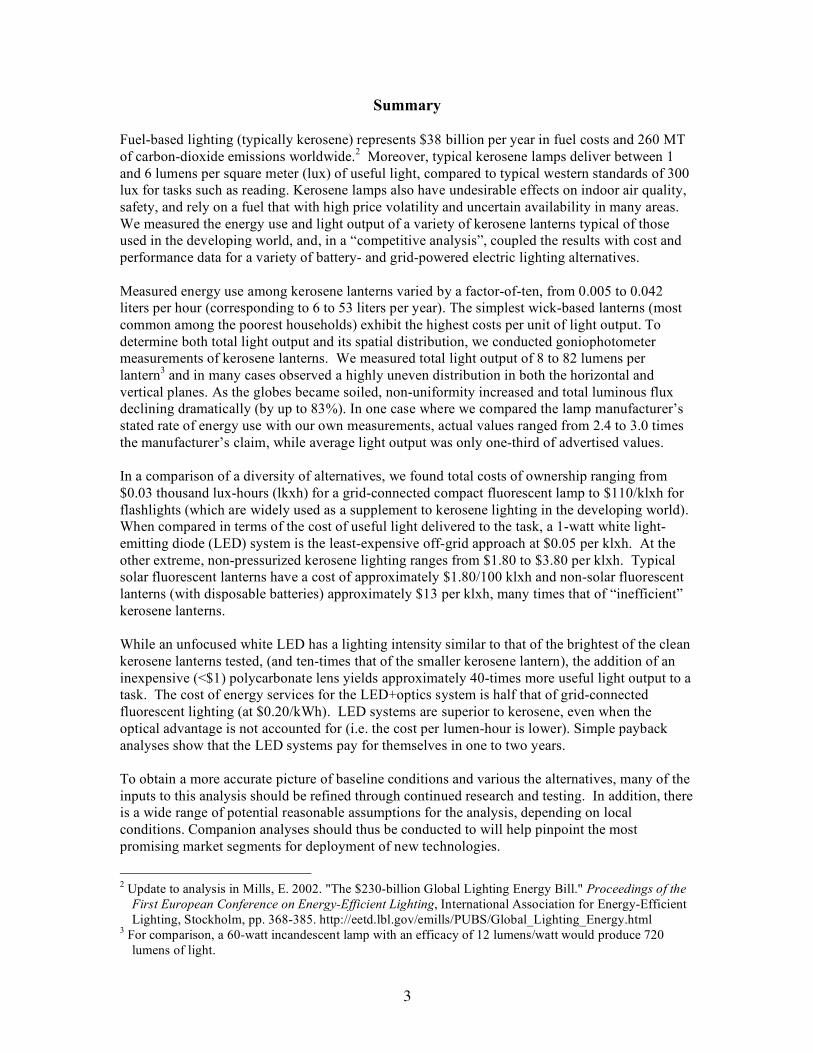
Summary Fuel-based lighting (typically kerosene) represents $38 billion per year in fuel costs and 260 MT of carbon-dioxide emissions worldwide.2 Moreover, typical kerosene lamps deliver between 1 and 6 lumens per square meter (lux) of useful light, compared to typical western standards of 300 lux for tasks such as reading. Kerosene lamps also have undesirable effects on indoor air quality, safety, and rely on a fuel that with high price volatility and uncertain availability in many areas. We measured the energy use and light output of a variety of kerosene lanterns typical of those used in the developing world, and, in a “competitive analysis”, coupled the results with cost and performance data for a variety of battery- and grid-powered electric lighting alternatives. Measured energy use among kerosene lanterns varied by a factor-of-ten, from 0.005 to 0.042 liters per hour (corresponding to 6 to 53 liters per year). The simplest wick-based lanterns (most common among the poorest households) exhibit the highest costs per unit of light output. To determine both total light output and its spatial distribution, we conducted goniophotometer measurements of kerosene lanterns. We measured total light output of 8 to 82 lumens per lantern3 and in many cases observed a highly uneven distribution in both the horizontal and vertical planes. As the globes became soiled, non-uniformity increased and total luminous flux declining dramatically (by up to 83%). In one case where we compared the lamp manufacturer’s stated rate of energy use with our own measurements, actual values ranged from 2.4 to 3.0 times the manufacturer’s claim, while average light output was only one-third of advertised values. In a comparison of a diversity of alternatives, we found total costs of ownership ranging from $0.03 thousand lux-hours (lkxh) for a grid-connected compact fluorescent lamp to $110/klxh for flashlights (which are widely used as a supplement to kerosene lighting in the developing world). When compared in terms of the cost of useful light delivered to the task, a 1-watt white light-emitting diode (LED) system is the least-expensive off-grid approach at $0.05 per klxh. At the other extreme, non-pressurized kerosene lighting ranges from $1.80 to $3.80 per klxh. Typical solar fluorescent lanterns have a cost of approximately $1.80/100 klxh and non-solar fluorescent lanterns (with disposable batteries) approximately $13 per klxh, many times that of “inefficient” kerosene lanterns. While an unfocused white LED has a lighting intensity similar to that of the brightest of the clean kerosene lanterns tested, (and ten-times that of the smaller kerosene lantern), the addition of an inexpensive (<$1) polycarbonate lens yields approximately 40-times more useful light output to a task. The cost of energy services for the LED+optics system is half that of grid-connected fluorescent lighting (at $0.20/kWh). LED systems are superior to kerosene, even when the optical advantage is not accounted for (i.e. the cost per lumen-hour is lower). Simple payback analyses show that the LED systems pay for themselves in one to two years. To obtain a more accurate picture of baseline conditions and various the alternatives, many of the inputs to this analysis should be refined through continued research and testing. In addition, there is a wide range of potential reasonable assumptions for the analysis, depending on local conditions. Companion analyses should thus be conducted to will help pinpoint the most promising market segments for deployment of new technologies.
2 Update to analysis in Mills, E. 2002. "The $230-billion Global Lighting Energy Bill." Proceedings of the
First European Conference on Energy-Efficient Lighting, International Association for Energy-Efficient Lighting, Stockholm, pp. 368-385. http://eetd.lbl.gov/emills/PUBS/Global_Lighting_Energy.html
3 For comparison, a 60-watt incandescent lamp with an efficacy of 12 lumens/watt would produce 720 lumens of light.
4
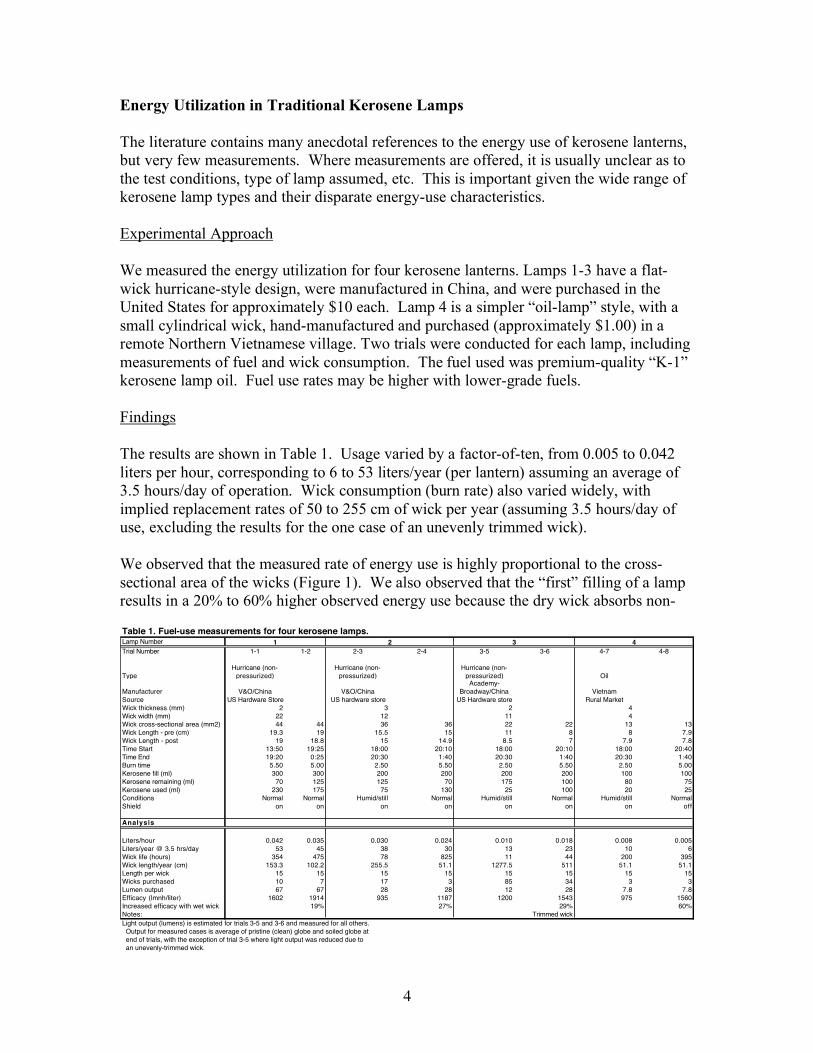
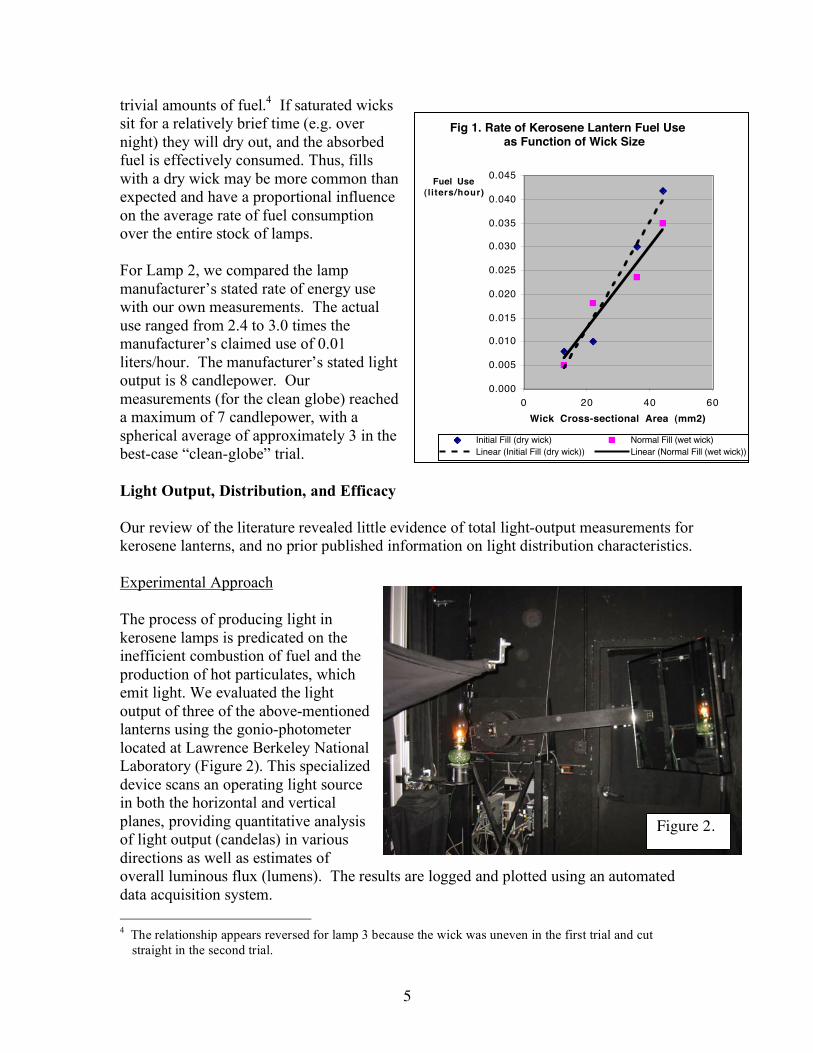
Energy Utilization in Traditional Kerosene Lamps The literature contains many anecdotal references to the energy use of kerosene lanterns, but very few measurements. Where measurements are offered, it is usually unclear as to the test conditions, type of lamp assumed, etc. This is important given the wide range of kerosene lamp types and their disparate energy-use characteristics. Experimental Approach We measured the energy utilization for four kerosene lanterns. Lamps 1-3 have a flat-wick hurricane-style design, were manufactured in China, and were purchased in the United States for approximately $10 each. Lamp 4 is a simpler “oil-lamp” style, with a small cylindrical wick, hand-manufactured and purchased (approximately $1.00) in a remote Northern Vietnamese village. Two trials were conducted for each lamp, including measurements of fuel and wick consumption. The fuel used was premium-quality “K-1” kerosene lamp oil. Fuel use rates may be higher with lower-grade fuels. Findings The results are shown in Table 1. Usage varied by a factor-of-ten, from 0.005 to 0.042 liters per hour, corresponding to 6 to 53 liters/year (per lantern) assuming an average of 3.5 hours/day of operation. Wick consumption (burn rate) also varied widely, with implied replacement rates of 50 to 255 cm of wick per year (assuming 3.5 hours/day of use, excluding the results for the one case of an unevenly trimmed wick). We observed that the measured rate of energy use is highly proportional to the cross-sectional area of the wicks (Figure 1). We also observed that the “first” filling of a lamp results in a 20% to 60% higher observed energy use because the dry wick absorbs non-
Table 1. Fuel-use measurements for four kerosene lamps.Lamp Number
Trial Number 1-1 1-2 2-3 2-4 3-5 3-6 4-7 4-8
Type
Hurricane (non-
pressurized)
Hurricane (non-
pressurized)
Hurricane (non-
pressurized) Oil
Manufacturer V&O/China V&O/China
Academy-
Broadway/China Vietnam
Source US Hardware Store US hardware store US Hardware store Rural Market
Wick thickness (mm) 2 3 2 4
Wick width (mm) 22 12 11 4
Wick cross-sectional area (mm2) 44 44 36 36 22 22 13 13
Wick Length - pre (cm) 19.3 19 15.5 15 11 8 8 7.9
Wick Length - post 19 18.8 15 14.9 8.5 7 7.9 7.8
Time Start 13:50 19:25 18:00 20:10 18:00 20:10 18:00 20:40
Time End 19:20 0:25 20:30 1:40 20:30 1:40 20:30 1:40
Burn time 5.50 5.00 2.50 5.50 2.50 5.50 2.50 5.00
Kerosene fill (ml) 300 300 200 200 200 200 100 100
Kerosene remaining (ml) 70 125 125 70 175 100 80 75
Kerosene used (ml) 230 175 75 130 25 100 20 25
Conditions Normal Normal Humid/still Normal Humid/still Normal Humid/still Normal
Shield on on on on on on on off
Analysis
Liters/hour 0.042 0.035 0.030 0.024 0.010 0.018 0.008 0.005
Liters/year @ 3.5 hrs/day 53 45 38 30 13 23 10 6
Wick life (hours) 354 475 78 825 11 44 200 395
Wick length/year (cm) 153.3 102.2 255.5 51.1 1277.5 511 51.1 51.1
Length per wick 15 15 15 15 15 15 15 15
Wicks purchased 10 7 17 3 85 34 3 3
Lumen output 67 67 28 28 12 28 7.8 7.8
Efficacy (lmnh/liter) 1602 1914 935 1187 1200 1543 975 1560
Increased efficacy with wet wick 19% 27% 29% 60%
Notes: Trimmed wick
Light output (lumens) is estimated for trials 3-5 and 3-6 and measured for all others.
Output for measured cases is average of pristine (clean) globe and soiled globe at
end of trials, with the exception of trial 3-5 where light output was reduced due to
an unevenly-trimmed wick.
1 2 3 4
5
Fig 1. Rate of Kerosene Lantern Fuel Use as Function of Wick Size
0.000
0.005
0.010
0.015
0.020
0.025
0.030
0.035
0.040
0.045
0 20 40 60
Wick Cross-sectional Area (mm2)
Fuel Use
(l iters/hour)
Initial Fill (dry wick) Normal Fill (wet wick)
Linear (Initial Fill (dry wick)) Linear (Normal Fill (wet wick))
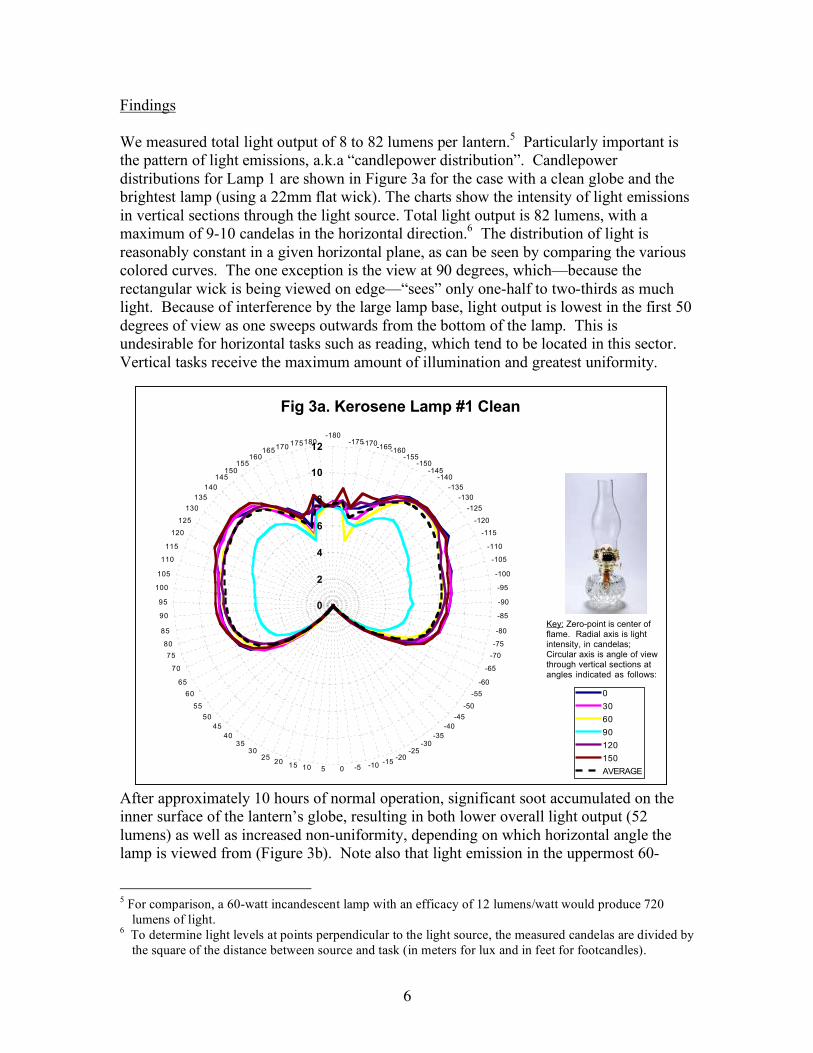
trivial amounts of fuel.4 If saturated wicks sit for a relatively brief time (e.g. over night) they will dry out, and the absorbed fuel is effectively consumed. Thus, fills with a dry wick may be more common than expected and have a proportional influence on the average rate of fuel consumption over the entire stock of lamps. For Lamp 2, we compared the lamp manufacturer’s stated rate of energy use with our own measurements. The actual use ranged from 2.4 to 3.0 times the manufacturer’s claimed use of 0.01 liters/hour. The manufacturer’s stated light output is 8 candlepower. Our measurements (for the clean globe) reached a maximum of 7 candlepower, with a spherical average of approximately 3 in the best-case “clean-globe” trial. Light Output, Distribution, and Efficacy Our review of the literature revealed little evidence of total light-output measurements for kerosene lanterns, and no prior published information on light distribution characteristics. Experimental Approach The process of producing light in kerosene lamps is predicated on the inefficient combustion of fuel and the production of hot particulates, which emit light. We evaluated the light output of three of the above-mentioned lanterns using the gonio-photometer located at Lawrence Berkeley National Laboratory (Figure 2). This specialized device scans an operating light source in both the horizontal and vertical planes, providing quantitative analysis of light output (candelas) in various directions as well as estimates of overall luminous flux (lumens). The results are logged and plotted using an automated data acquisition system. 4 The relationship appears reversed for lamp 3 because the wick was uneven in the first trial and cut
straight in the second trial.
Figure 2.
6
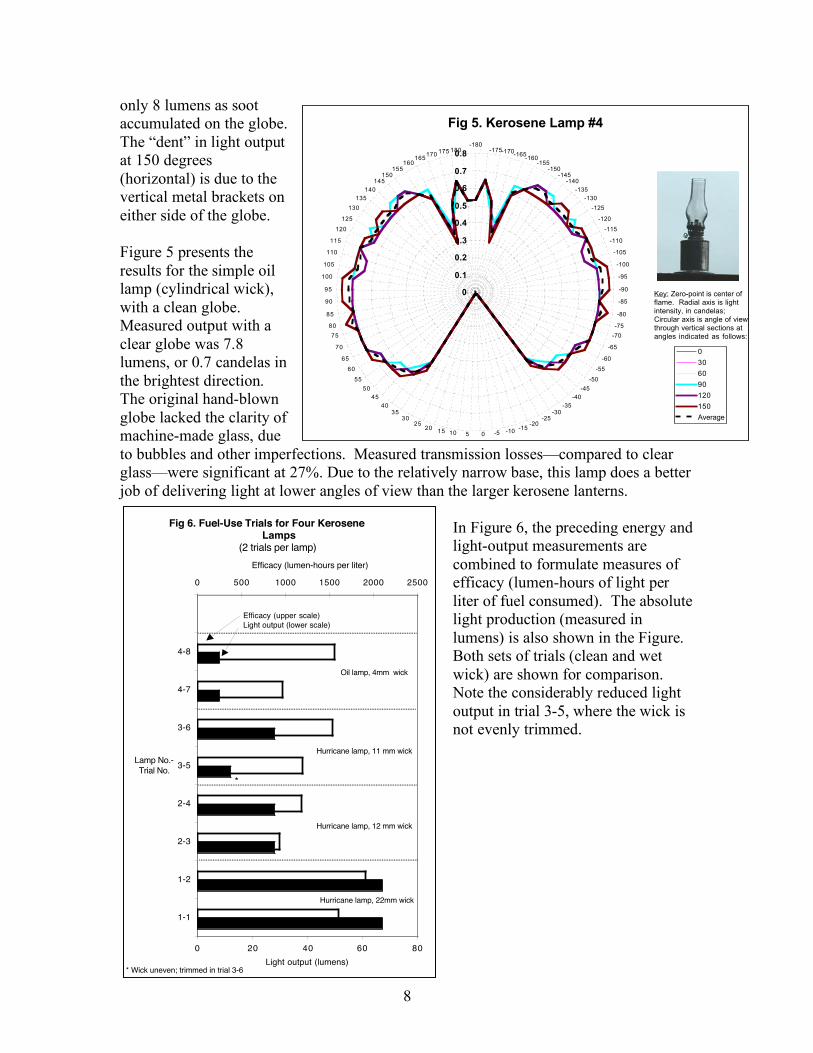
Findings We measured total light output of 8 to 82 lumens per lantern.5 Particularly important is the pattern of light emissions, a.k.a “candlepower distribution”. Candlepower distributions for Lamp 1 are shown in Figure 3a for the case with a clean globe and the brightest lamp (using a 22mm flat wick). The charts show the intensity of light emissions in vertical sections through the light source. Total light output is 82 lumens, with a maximum of 9-10 candelas in the horizontal direction.6 The distribution of light is reasonably constant in a given horizontal plane, as can be seen by comparing the various colored curves. The one exception is the view at 90 degrees, which—because the rectangular wick is being viewed on edge—“sees” only one-half to two-thirds as much light. Because of interference by the large lamp base, light output is lowest in the first 50 degrees of view as one sweeps outwards from the bottom of the lamp. This is undesirable for horizontal tasks such as reading, which tend to be located in this sector. Vertical tasks receive the maximum amount of illumination and greatest uniformity.
After approximately 10 hours of normal operation, significant soot accumulated on the inner surface of the lantern’s globe, resulting in both lower overall light output (52 lumens) as well as increased non-uniformity, depending on which horizontal angle the lamp is viewed from (Figure 3b). Note also that light emission in the uppermost 60-
5 For comparison, a 60-watt incandescent lamp with an efficacy of 12 lumens/watt would produce 720
lumens of light. 6 To determine light levels at points perpendicular to the light source, the measured candelas are divided by
the square of the distance between source and task (in meters for lux and in feet for footcandles).
Fig 3a. Kerosene Lamp #1 Clean
0
2
4
6
8
10
12
-180-175-170
-165-160
-155-150
-145-140
-135
-130
-125
-120
-115
-110
-105
-100
-95
-90
-85
-80
-75
-70
-65
-60
-55
-50
-45
-40
-35-30
-25-20
-15-10-5051015
2025
3035
40
45
50
55
60
65
70
75
80
85
90
95
100
105
110
115
120
125
130
135
140
145150
155160
165170
175180
0
30
60
90
120
150
AVERAGE
Key: Zero-point is center of flame. Radial axis is light intensity, in candelas; Circular axis is angle of view through vertical sections at angles indicated as follows:

7
Fig 4b. Kerosene Lamp #2 Dirty
0
0.5
1
1.5
2
2.5-180
-175-170-165
-160-155
-150-145
-140
-135
-130
-125
-120
-115
-110
-105
-100
-95
-90
-85
-80
-75
-70
-65
-60
-55
-50
-45
-40
-35-30
-25-20
-15-10-5051015
2025
3035
40
45
50
55
60
65
70
75
80
85
90
95
100
105
110
115
120
125
130
135
140
145150
155160
165170
175180
0
30
60
90
120
150
AVERAGE
Key: Zero-point is center of flame. Radial axis is light intensity, in candelas; Circular axis is angle of view through vertical sections at angles indicated as follows:
degree sector was reduced nearly to zero due to soot accumulation on the “shoulder” of the globe.
Figures 4a and b depict the clean-/dirty-globe performance as well as the lumen-depreciation problem for a more typical hurricane-style lantern (Lamp 2) with a smaller (12mm) and less-clean-burning wick after only eight hours of operation. Note the highly asymmetrical light distribution. Due to the large base below and metal cap above the globe, there is no light emission above approximately +/-140 degrees or below +/-60 degrees in the vertical plane, which reduces the overall optical efficiency of the system given that much of the light produced by the flame is absorbed as it strikes the inner surfaces of the base and cap. Light output was 48 lumens with a clean globe, falling to
Fig 3b. Kerosene Lamp #1 Dirty
0
1
2
3
4
5
6
7
8-180
-175-170-165-160
-155-150
-145-140
-135
-130
-125
-120
-115
-110
-105
-100
-95
-90
-85
-80
-75
-70
-65
-60
-55
-50
-45
-40
-35-30
-25-20
-15-10-5051015
2025
3035
40
45
50
55
60
65
70
75
80
85
90
95
100
105
110
115
120
125
130
135
140
145150
155160
165170 175180
0
30
60
90
120
150
AVERAGE
Key: Zero-point is center of flame. Radial axis is light intensity, in candelas; Circular axis is angle of view through vertical sections at angles indicated as follows:
Fig 4a. Kerosene Lamp #2 Clean
0
1
2
3
4
5
6
7
8-180
-175-170-165
-160-155
-150-145
-140
-135
-130
-125
-120
-115
-110
-105
-100
-95
-90
-85
-80
-75
-70
-65
-60
-55
-50
-45
-40
-35
-30-25
-20-15
-10-505101520
2530
35
40
45
50
55
60
65
70
75
80
85
90
95
100
105
110
115
120
125
130
135
140
145150
155160
165170
175180
0
30
60
90
120
150
Average
Key: Zero-point is center of flame. Radial axis is light intensity, in candelas; Circular axis is angle of view through vertical sections at angles indicated as follows:
8
only 8 lumens as soot accumulated on the globe. The “dent” in light output at 150 degrees (horizontal) is due to the vertical metal brackets on either side of the globe. Figure 5 presents the results for the simple oil lamp (cylindrical wick), with a clean globe. Measured output with a clear globe was 7.8 lumens, or 0.7 candelas in the brightest direction. The original hand-blown globe lacked the clarity of machine-made glass, due to bubbles and other imperfections. Measured transmission losses—compared to clear glass—were significant at 27%. Due to the relatively narrow base, this lamp does a better job of delivering light at lower angles of view than the larger kerosene lanterns.
In Figure 6, the preceding energy and light-output measurements are combined to formulate measures of efficacy (lumen-hours of light per liter of fuel consumed). The absolute light production (measured in lumens) is also shown in the Figure. Both sets of trials (clean and wet wick) are shown for comparison. Note the considerably reduced light output in trial 3-5, where the wick is not evenly trimmed.
Fig 5. Kerosene Lamp #4
0
0.1
0.2
0.3
0.4
0.5
0.6
0.7
0.8-180
-175-170-165
-160-155
-150-145
-140
-135
-130
-125
-120
-115
-110
-105
-100
-95
-90
-85
-80
-75
-70
-65
-60
-55
-50
-45
-40
-35-30
-25-20
-15-10-5051015
2025
3035
40
45
50
55
60
65
70
75
80
85
90
95
100
105
110
115
120
125
130
135
140
145150
155160
165170
175 180
0
30
60
90
120
150
Average
Key: Zero-point is center of flame. Radial axis is light intensity, in candelas; Circular axis is angle of view through vertical sections at angles indicated as follows:
Fig 6. Fuel-Use Trials for Four Kerosene Lamps
(2 trials per lamp)
0 20 40 60 80
1-1
1-2
2-3
2-4
3-5
3-6
4-7
4-8
Lamp No.-
Trial No.
Light output (lumens)
0 500 1000 1500 2000 2500
Efficacy (lumen-hours per liter)
Efficacy (upper scale)
Light output (lower scale)
Oil lamp, 4mm wick
Hurricane lamp, 11 mm wick
Hurricane lamp, 22mm wick
Hurricane lamp, 12 mm wick
*
* Wick uneven; trimmed in trial 3-6
9
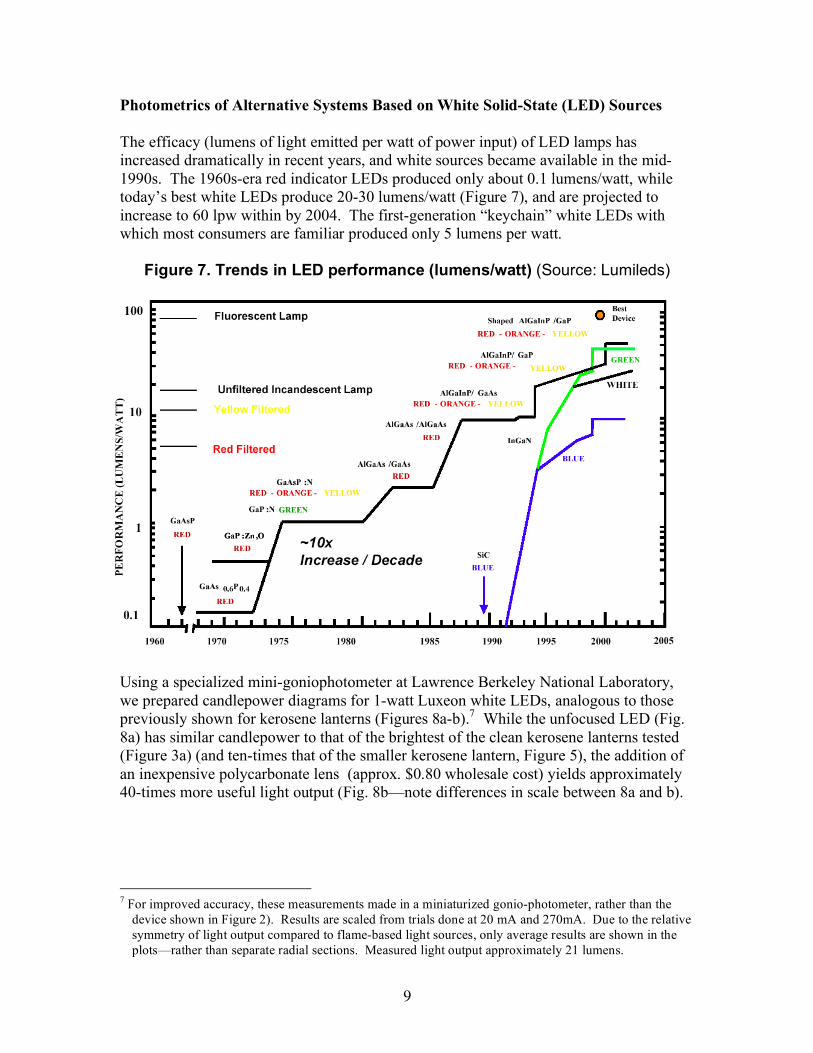
Photometrics of Alternative Systems Based on White Solid-State (LED) Sources The efficacy (lumens of light emitted per watt of power input) of LED lamps has increased dramatically in recent years, and white sources became available in the mid-1990s. The 1960s-era red indicator LEDs produced only about 0.1 lumens/watt, while today’s best white LEDs produce 20-30 lumens/watt (Figure 7), and are projected to increase to 60 lpw within by 2004. The first-generation “keychain” white LEDs with which most consumers are familiar produced only 5 lumens per watt.
Figure 7. Trends in LED performance (lumens/watt) (Source: Lumileds)
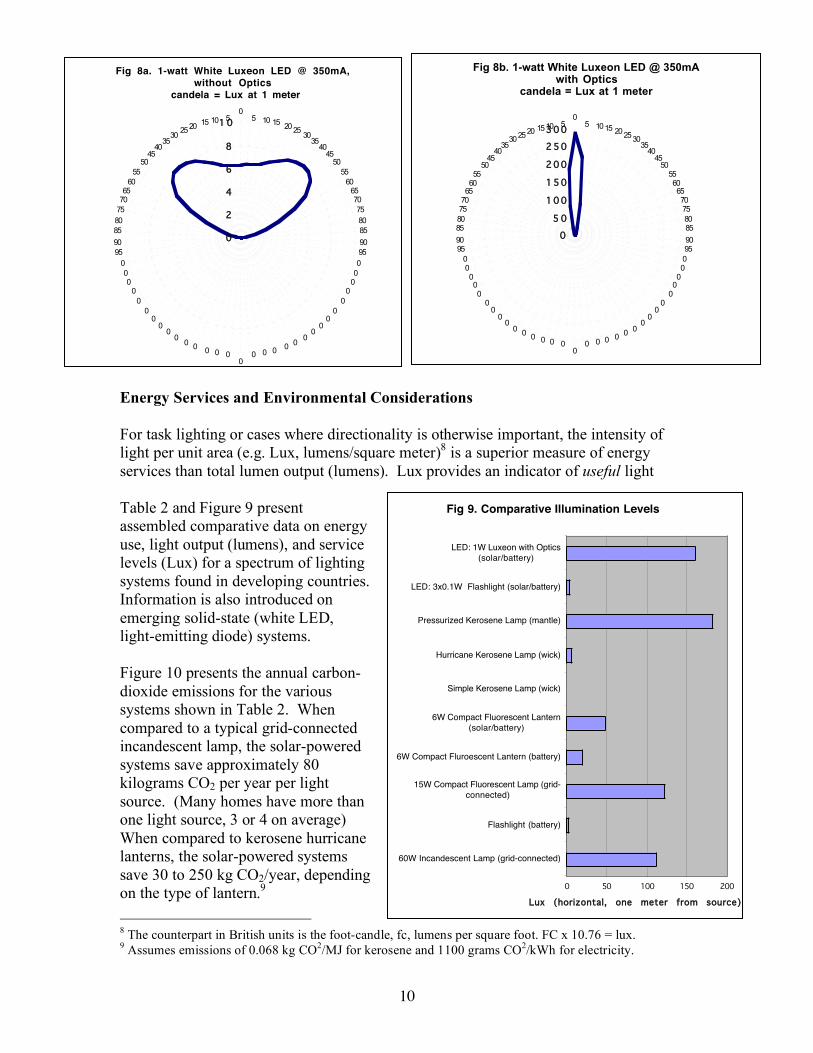
Using a specialized mini-goniophotometer at Lawrence Berkeley National Laboratory, we prepared candlepower diagrams for 1-watt Luxeon white LEDs, analogous to those previously shown for kerosene lanterns (Figures 8a-b).7 While the unfocused LED (Fig. 8a) has similar candlepower to that of the brightest of the clean kerosene lanterns tested (Figure 3a) (and ten-times that of the smaller kerosene lantern, Figure 5), the addition of an inexpensive polycarbonate lens (approx. $0.80 wholesale cost) yields approximately 40-times more useful light output (Fig. 8b—note differences in scale between 8a and b).
7 For improved accuracy, these measurements made in a miniaturized gonio-photometer, rather than the
device shown in Figure 2). Results are scaled from trials done at 20 mA and 270mA. Due to the relative symmetry of light output compared to flame-based light sources, only average results are shown in the plots—rather than separate radial sections. Measured light output approximately 21 lumens.
10
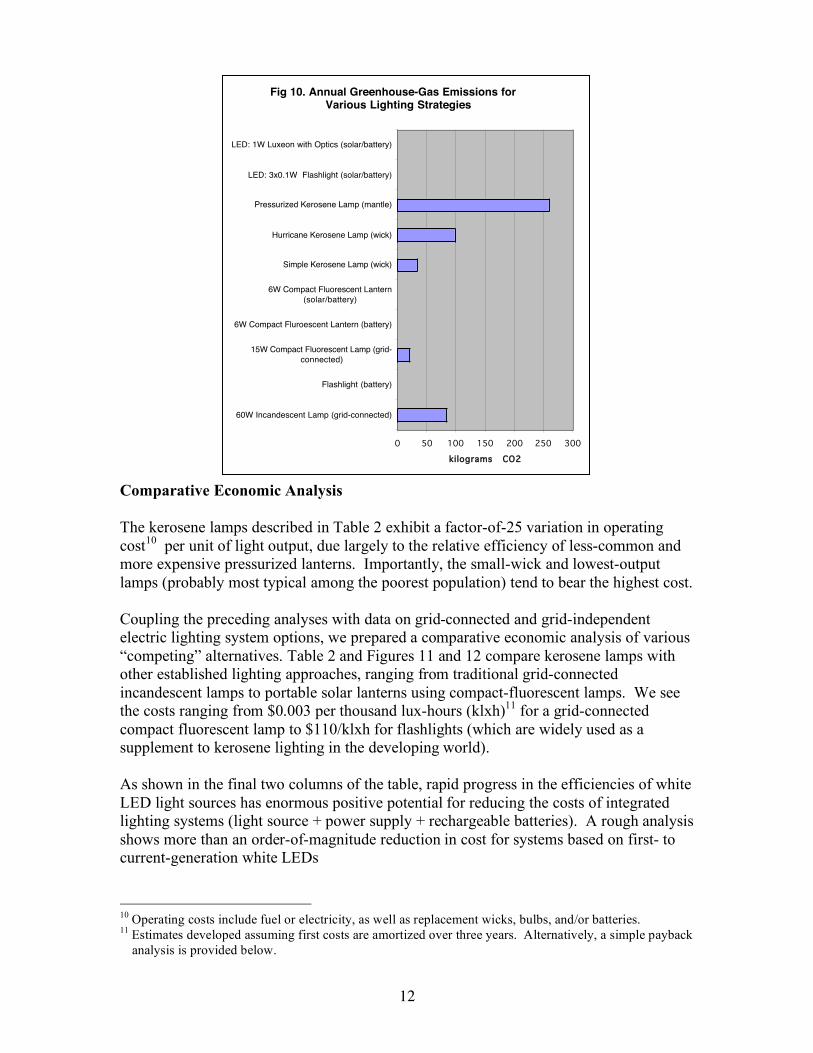
Energy Services and Environmental Considerations For task lighting or cases where directionality is otherwise important, the intensity of light per unit area (e.g. Lux, lumens/square meter)8 is a superior measure of energy services than total lumen output (lumens). Lux provides an indicator of useful light Table 2 and Figure 9 present assembled comparative data on energy use, light output (lumens), and service levels (Lux) for a spectrum of lighting systems found in developing countries. Information is also introduced on emerging solid-state (white LED, light-emitting diode) systems. Figure 10 presents the annual carbon-dioxide emissions for the various systems shown in Table 2. When compared to a typical grid-connected incandescent lamp, the solar-powered systems save approximately 80 kilograms CO2 per year per light source. (Many homes have more than one light source, 3 or 4 on average) When compared to kerosene hurricane lanterns, the solar-powered systems save 30 to 250 kg CO2/year, depending on the type of lantern.9 8 The counterpart in British units is the foot-candle, fc, lumens per square foot. FC x 10.76 = lux. 9 Assumes emissions of 0.068 kg CO2/MJ for kerosene and 1100 grams CO2/kWh for electricity.
Fig 8a. 1-watt White Luxeon LED @ 350mA,without Optics
candela = Lux at 1 meter
0
2
4
6
8
1 0
05 10 15
202530354045
50
55
60
65
70
75
80
85
90
95
0
0
0
0
0
0
00
00
00
0000
0000
00
00
0
0
0
0
0
0
0
95
90
85
80
75
70
65
60
55
50
45403530252015 10
5
Fig 8b. 1-watt White Luxeon LED @ 350mAwith Optics
candela = Lux at 1 meter
0
5 0
100
150
200
250
300
05 1015
20253035404550
55
60
65
70
75
80
85
90
95
0
0
0
0
0
00
00
00
0000
0000
00
00
000
0
0
0
0
0
95
90
85
80
75
70
65
60
55
504540353025201510
5
Fig 9. Comparative Illumination Levels
0 50 100 150 200
60W Incandescent Lamp (grid-connected)
Flashlight (battery)
15W Compact Fluorescent Lamp (grid-
connected)
6W Compact Fluroescent Lantern (battery)
6W Compact Fluorescent Lantern
(solar/battery)
Simple Kerosene Lamp (wick)
Hurricane Kerosene Lamp (wick)
Pressurized Kerosene Lamp (mantle)
LED: 3x0.1W Flashlight (solar/battery)
LED: 1W Luxeon with Optics
(solar/battery)
Lux (horizontal, one meter from source)

11
Table 2. Comparative analysis of lighting systems for developing countries.
60W
Incandescent
Lamp (grid-
connected)
Flashlight
(alkaline
battery)
15W
Compact
Fluorescent
Lamp (grid-
connected)
6W Compact
Fluroescent
Lantern
(alkaline
battery)
6W Compact
Fluorescent
Lantern
(solar/NiMh
battery)
Simple
Kerosene Lamp
(wick)
Hurricane
Kerosene
Lamp (wick)
Pressurized
Kerosene
Lamp
(mantle)
LED: 3x0.1W
Flashlight
(solar/NiMh
battery)
LED: 1W
Luxeon with
Optics
(solar/NiMh
battery)
Pe r fo rmance
Rate of energy use (Watts or liters/hour) 60 0.74 15 6 6 0.01 0.03 0.08 0.30 1
Lamp, wick, or mantle service life (hours) 1000 50 10000 8000 5000 200 400 1000 50000 50000
Replacement bulbs, wicks, or mantles (number per year) 1.3 25.6 0.13 0.16 0.26 6.4 3.2 1.3 0.00 0.00
Batteries none 2 D Alkaline none 4 D Alkaline 1 NiMh none none none 1 AA NiMh 2 AA NiMh
Replacement batteries (number per year) 0 315 0 319 0.73 0 0 0 0.730 1.460
Energy services provided
Light output (lumens--lamp only) 792 3.8 873 135 340 7.8 45 1300 10 40
Useful illumination (lux, including optical losses at
typical working distance)
111 2.4 122 19 48 1.1 6.3 182 4 160
First cost 5 5 5 15 169 1 3 10 10 20
Annual Energy Consumption
Electricity from grid (kWh) 77 0 19 0 0 0 0 0 0 0
Kerosene (liters) 0 0 0 0 0 13 38 101 0 0
Annual Operating Costs
Energy 15.33$ -$ 3.83$ -$ -$ 3.83$ 11.50$ 30.38$ -$ -$
Replacement batteries, wicks or mantles -$ 315.12$ -$ 319.38$ 47.45$ 1.42$ 3.19$ 1.92$ 1.46$ 2.92$
Replacement bulbs 0.38$ 25.55$ 0.51$ 0.64$ 3.83$ -$ -$ -$ -$ -$
Total 15.71$ 340.67$ 4.34$ 320.01$ 51.28$ 5.25$ 14.69$ 32.30$ 1.46$ 2.92$
Operating cost per unit of service
Light production ($/1000-lumen hours) 0.016$ 70.18$ 0.004$ 1.86$ 0.12$ 0.53$ 0.26$ 0.019$ 0.114$ 0.057$
Index: CFL (grid) = 1.00 4 18019 1 476 30 135 66 5 29 15
Index: Incandescent (grid) = 1.00 1 4519 0.3 119.5 8 34 16 1 7 4
Illuminance ($/1000 lux-hours) 0.11$ 110.23$ 0.03$ 13.25$ 0.84$ 3.76$ 1.83$ 0.14$ 0.29$ 0.01$
Index: CFL (grid) = 1.00 4 3962 1.0 476 30 135 66 5 10.3 0.5
Index: Incandescent (grid) = 1.00 1 994 0.3 119 8 34 16 1.3 2.6 0.13
Total cost per unit of service (1st cost amortized over three years)
Cost of light ($/1000-lumen hours) 0.016$ 70.52$ 0.004$ 1.856$ 0.25$ 0.56$ 0.27$ 0.021$ 0.38$ 0.19$
Cost of illumination ($/1000 lux-hours) 0.11$ 110.23$ 0.028$ 13.25$ 1.77$ 3.76$ 1.83$ 0.15$ 0.94$ 0.05$
Index: CFL (grid) = 1.00 4 3,962 1 476 64 135 66 6 34 2
Index: Incandescent (grid) = 1.00 1 994 0.3 119.5 16 34 16 1.4 8.5 0.4
Carbon Emissions per year (kg) 84 0 21 0.0 0 33 98 259 0.0 0.0
Assumpt ions:
Lamp usage 3.5 hours/day
Electricity price (from grid; non-urban) 0.20 $/kWh (assuming diesel set in rural location; varies widely depending on local conditions)
D-cell Alkaline price 1.00 $ per battery (non-rechargable)
D-cell capacity 3.00 wh (range 1.5-6)
AA-cell NiMh Battery cost 2.00 $ per battery (rechargable)
AA NiMh Battery life 500 cycles
Large NiMh Solar Lantern Battery Life 500 cycles
CFL Solar Lantern NiMh Battery price 65 $ per battery,
Incandescent lamp price 0.30 $ (60-watt)
Kerosene wick price 0.22 (10Rs reported in SES India survey)
Hurricane lamp wick price 1.00 est.
Kerosene tie-on mantle price 1.50 est.
Flashlight lamp ("bulb") wattage 0.74 2 D ind. cell flashlight; PR6; Philips
Flashlight lamp ("bulb") price 1.00 est.
Fixture price for grid-connected CFL or incandescent 5.00 ($) simple hard-wired connection or plug-in lamp
Compact fluorescent lamp price (grid-based) 4.00 $
CFL price for solar lantern 15.00 $ per lamp
Kerosene Price 0.30 avg, $/liter
Kerosene Energy 37.6 MJ/liter
Kerosene w/v 0.82 kg/liter
Kerosene emissions factor 0.068 kg CO2/MJ
Electricity emissions factor 1100 grams CO2/kWh
Notes & Sources:
• Most assumptions for electric light sources reflect high-quality western manufacturing (e.g. lamp life, efficacy); performance of Asian-made product can be much lower.
• 0.1W LEDs are Nichia; 1.0W Lumileds Luxeon Star. Efficacies projected for end of 2003.
• Lumen output values for standard electric sources are average mid-life values (including depreciation "maintenance factors" based on IESNA Handbook Values for kerosene lamps are averages of tested levels.
• Solar Lantern first cost est $50: based on manufacturers projection of costs at high volume, http://195.178.164.205/IAEEL/iaeel/newsl/1998/tva1998/LiRen_a_2_98.html
• Derivation of lux values: for general electric sources, assumes even radiation in all directions from source 0.3 m high and 0.5
m from task (lux = 12% lumens). Room contributes another 2% from inter-reflections (3x3x2.5 m room with 50% surfaces). LED
values are measurements of SES prototypes. Kerosene measurements by LBNL in reading plane.
• Cost values shown are estimated retail prices. "Manufactured costs" estimated for the LED systems developed by Stanford are multiplied by a
factor of two to approximate retail price.
• Wick-based kerosene lamp performance are estimates of typical values (averaging across a range of types of lamps within each category, rather than lamp-specific results such as those
shown in Table 1); mantle values from "Rural Lighting", by Louineau, Dicko, Fraenkel, Barlow & Bokalders, The Stockholm Environment Institute 1994.
• Solaris Lantern: One vendor's website says $65 for replacement lantern battery and 1000 cycles (http://www.carebridge.info/servlet/display/product/detail/17932). All other vendors say 500 cycles.
See article in Home Power for more data. http://www.solarsense.com/Info_Center/PDF/Homepower-Solaris%20Article.pdf
• Mills, E. 1999. "Fuel-based Light: Large CO2 Source". Newsletter of the International Association for Energy-Efficient Lighting (2/98), pp. 1-9.
http://195.178.164.205/IAEEL/iaeel/newsl/1999/tva1999/ett299.html
12
Comparative Economic Analysis The kerosene lamps described in Table 2 exhibit a factor-of-25 variation in operating cost10 per unit of light output, due largely to the relative efficiency of less-common and more expensive pressurized lanterns. Importantly, the small-wick and lowest-output lamps (probably most typical among the poorest population) tend to bear the highest cost. Coupling the preceding analyses with data on grid-connected and grid-independent electric lighting system options, we prepared a comparative economic analysis of various “competing” alternatives. Table 2 and Figures 11 and 12 compare kerosene lamps with other established lighting approaches, ranging from traditional grid-connected incandescent lamps to portable solar lanterns using compact-fluorescent lamps. We see the costs ranging from $0.003 per thousand lux-hours (klxh)11 for a grid-connected compact fluorescent lamp to $110/klxh for flashlights (which are widely used as a supplement to kerosene lighting in the developing world). As shown in the final two columns of the table, rapid progress in the efficiencies of white LED light sources has enormous positive potential for reducing the costs of integrated lighting systems (light source + power supply + rechargeable batteries). A rough analysis shows more than an order-of-magnitude reduction in cost for systems based on first- to current-generation white LEDs
10 Operating costs include fuel or electricity, as well as replacement wicks, bulbs, and/or batteries. 11 Estimates developed assuming first costs are amortized over three years. Alternatively, a simple payback
analysis is provided below.
Fig 10. Annual Greenhouse-Gas Emissions for Various Lighting Strategies
0 50 100 150 200 250 300
60W Incandescent Lamp (grid-connected)
Flashlight (battery)
15W Compact Fluorescent Lamp (grid-
connected)
6W Compact Fluroescent Lantern (battery)
6W Compact Fluorescent Lantern
(solar/battery)
Simple Kerosene Lamp (wick)
Hurricane Kerosene Lamp (wick)
Pressurized Kerosene Lamp (mantle)
LED: 3x0.1W Flashlight (solar/battery)
LED: 1W Luxeon with Optics (solar/battery)
kilograms CO2

13
Fig 11. Ownership Cost Comparison(No amortization of first cost)
$0 $50 $100 $150 $200 $250 $300 $350
60W Incandescent Lamp (grid-connected)
Flashlight (battery)
15W Compact Fluorescent Lamp (grid-connected)
6W Compact Fluroescent Lantern (battery)
6W Compact Fluorescent Lantern (solar/battery)
Simple Kerosene Lamp (wick)
Hurricane Kerosene Lamp (wick)
Pressurized Kerosene Lamp (mantle)
LED: 3x0.1W Flashlight (solar/battery)
LED: 1W Luxeon with Optics (solar/battery)
US Dollars
First Cost ($)
Operating Cost($/year)
Fig 12. Competitive Analysis of Lighting Strategies for Developing Countries
$0 $1 $2 $3 $4
60W Incandescent Lamp (grid-connected)
Flashlight (battery)
15W Compact Fluorescent Lamp (grid-connected)
6W Compact Fluroescent Lantern (battery)
6W Compact Fluorescent Lantern (solar/battery)
Simple Kerosene Lamp (wick)
Hurricane Kerosene Lamp (wick)
Pressurized Kerosene Lamp (mantle)
LED: 3x0.1W Flashlight (solar/battery)
LED: 1W Luxeon with Optics (solar/battery)
Cost per 1000 lumen-hours or1000 lux-hours (US$)
Cost of illumination ($/1000 lux-hours)
Cost of light ($/1000-lumen hours)
Flashlight and CFL with battery off-scale

14
(from approximately $100 to $10/system) (Figure 13). Prototypes under development in a collaborative effort with Stanford University, Light Up The World, Ideo, Solectron, LBNL, and others use the 1W Luxeon LED systems with estimated manufactured costs of $5-$10, and perhaps twice that at retail pricing12.
As seen in Table 2, the 1-watt white LED system is the least-expensive off-grid approach at $0.05/klxh. This is thanks to the superior energy efficiency and optical control of LED light sources. At the other extreme, non-pressurized kerosene lighting ranges from $1.70 to $3.80 per klxh. Typical solar lanterns have a cost of approximately $1.70/100 klxh and non-rechargable fluorescent lanterns, come in at approximately $13 per klxh, many times that of kerosene lanterns. The cost of energy services for the LED system is half that of grid-connected incandescent lighting (at an electricity price of $0.20/kWh, representative of small diesel generating systems in rural areas). Also seen in Table 2, LED
systems are superior to kerosene, even when their optical advantage is
not accounted for (i.e. the cost per lumen-hour is lower). Thus, while the current analysis focuses on task-oriented lighting, LED systems may also prove superior for ambient lighting applications. Aside from their intrinsic energy efficiency, other advantages of LEDs include the ease of optically controlling light distribution, ruggedness, extraordinarily long service life, low-voltage operating mode, and minimal battery requirements (and hence weight).
12 Retail markup depends on distribution model.. See http://ses.stanford.edu for more information.
2001 (5lpw)2003
(LumiLed,25lpw)
2004 (40lpw) 2005
(60lpw)
LED
Battery (NiMh)
PV
Total
$-
$25
$50
$75
$100
Cost for 100-lumen Output
( $ )
LED Technology
Component
Fig 13. LED System Component Costs: 50 lumens / 2-day charge
2001(5lpw) 2003
(LumiLed,
25lpw)
2004 (40lpw) 2005
(60lpw)
1 day
2 days
3 days
4 days
$-
$25
$50
$75
$100
$125
$150
$175
$200
System Cost( $ )
LED Technology
PV Size(Days of Light
per Charge)
LED System Costs as Function of Light Output: 50 lumens
175-200
150-175
125-150
100-125
75-100
50-75
25-50
0-25
Assumptions: target light output: 30 lumens, voltage: 6V, utilization: 3.5h/day, insolation: 650W/m2, PV system efficiency: 8%, PV cost: $3/W, battery cost: $1/watt-hour
15
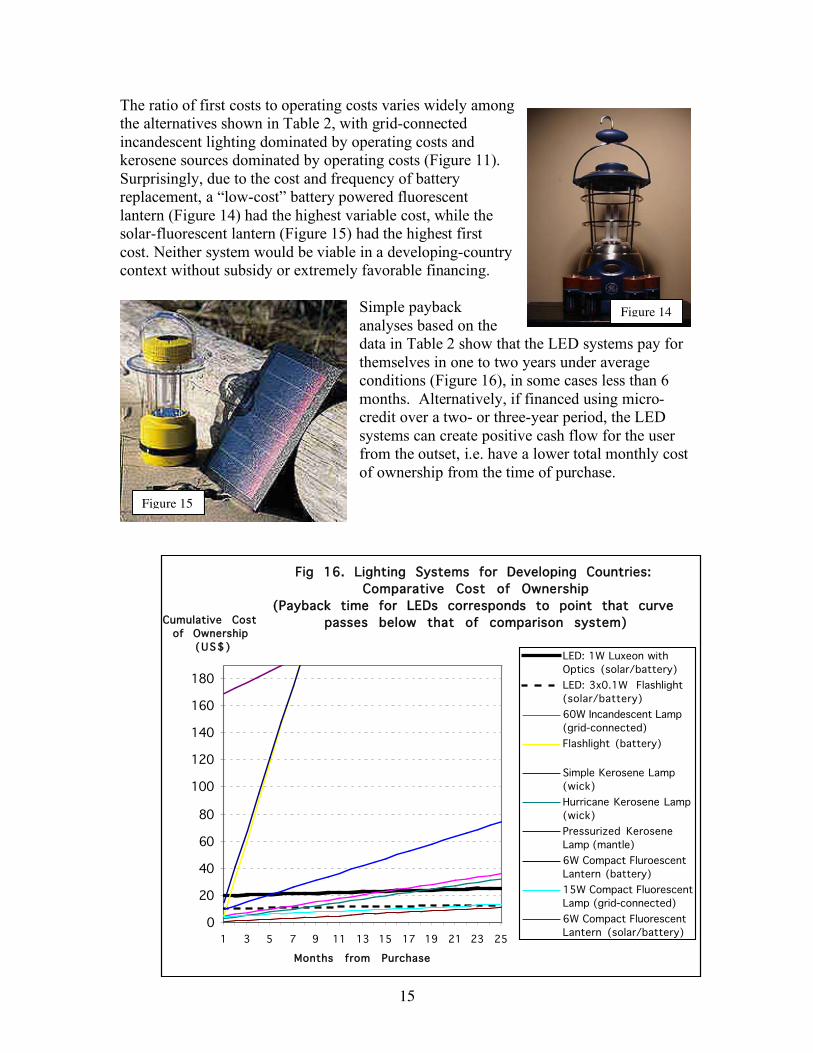
The ratio of first costs to operating costs varies widely among the alternatives shown in Table 2, with grid-connected incandescent lighting dominated by operating costs and kerosene sources dominated by operating costs (Figure 11). Surprisingly, due to the cost and frequency of battery replacement, a “low-cost” battery powered fluorescent lantern (Figure 14) had the highest variable cost, while the solar-fluorescent lantern (Figure 15) had the highest first cost. Neither system would be viable in a developing-country context without subsidy or extremely favorable financing.
Simple payback analyses based on the data in Table 2 show that the LED systems pay for themselves in one to two years under average conditions (Figure 16), in some cases less than 6 months. Alternatively, if financed using micro-credit over a two- or three-year period, the LED systems can create positive cash flow for the user from the outset, i.e. have a lower total monthly cost of ownership from the time of purchase.
Figure xx
Figure 15
Figure 14
Fig 16. Lighting Systems for Developing Countries:
Comparative Cost of Ownership
(Payback time for LEDs corresponds to point that curve
passes below that of comparison system)
0
20
40
60
80
100
120
140
160
180
1 3 5 7 9 11 13 15 17 19 21 23 25
Months from Purchase
Cumulative Cost
of Ownership
(US$)LED: 1W Luxeon with
Optics (solar/battery)
LED: 3x0.1W Flashlight
(solar/battery)
60W Incandescent Lamp
(grid-connected)
Flashlight (battery)
Simple Kerosene Lamp
(wick)
Hurricane Kerosene Lamp
(wick)
Pressurized Kerosene
Lamp (mantle)
6W Compact Fluroescent
Lantern (battery)
15W Compact Fluorescent
Lamp (grid-connected)
6W Compact Fluorescent
Lantern (solar/battery)

16
Summary and Conclusions The energy use and light output of kerosene lamps vary widely depending on the type of lantern used, maintenance of the wick, and the cleanliness of the “globe”. Moreover, our measurements indicate that light distribution is very uneven in both the horizontal and vertical planes, i.e. depending on the angle of view. Kerosene-based light is poor for reading and many other tasks, particularly on horizontal surfaces. Our estimates of useful illuminance on typical tasks show that the kerosene lamps deliver between 1 and 6 lux (lumens per square meter), compared to typical western standards of 300 lux for reading. Light output deteriorates considerably from these already inadequate levels within a few hours of operation (by up to 83% in our tests) as the globe becomes soiled, requiring frequent cleaning. In contrast, “lumen depreciation” in electric lighting systems is typically in the single-digit range after years of operation. A competitive analysis of kerosene lanterns versus conventional electric alternatives (both grid-based and grid-independent) and emerging white-LED alternatives shows considerable potential for economic and environmental benefits. When evaluated in terms of total cost of ownership (fixed and variable), the LED systems emerge as the most cost-effective solution, with payback times from several months to two years. Many of the inputs to this analysis should be refined through continued testing and research, yielding a more accurate characterization of baseline conditions and the various alternatives. In addition, there is a wide range of potential reasonable assumptions for the analysis, depending in part on local conditions (e.g. kerosene price and lamp type). We have observed prices ranging from $0.10 to $2.00 per liter, with variations caused by local taxation/subsidy policy, distance from market, etc. Companion analyses should thus be conducted to determine both the uncertainties and real-world variance in the relative costs and suitability of various alternatives to kerosene lighting. Such analyses will help pinpoint the most promising market segments for deployment of new technologies. The following topics are among those meriting further work:
1. Obtain more comprehensive field data, e.g. numbers and types of lamps per household, hours of daily use, and kerosene prices paid. There is a particular need for improved understanding of usage in non-residential settings.
2. Develop better estimates of the size, needs, and economics of specific target markets (e.g. night vendors)
3. Perform additional laboratory measurements of energy utilization and light output, covering a broader array of lamp types, including mantel and pressurized systems, as well as usage scenarios (e.g. distance of lamp from task).
4. Test new LED prototypes to determine how effective they are at delivering illumination to a task.
5. Perform measurements of combustion products and develop estimates of indoor air concentrations under various utilization scenarios.


![MURDOCH RESEARCH REPOSITORY...the average American family, yet only receive around 0.2% of the lumen-hours [3]. Typical household kerosene lamps consume around 0.05L hr-1 with a light](https://img.dokumen.tips/doc/110x75/5e615262fc560375f27abe85/murdoch-research-repository-the-average-american-family-yet-only-receive-around.jpg)