Embed Size (px)
Citation preview

Graduate Theses, Dissertations, and Problem Reports
2006
Technical and economic effectiveness for repair with FRP of Technical and economic effectiveness for repair with FRP of
concrete T-beam bridges: Case study for PennDOT-District 3 concrete T-beam bridges: Case study for PennDOT-District 3
Daniel A. Brayack West Virginia University
Follow this and additional works at: https://researchrepository.wvu.edu/etd
Recommended Citation Recommended Citation Brayack, Daniel A., "Technical and economic effectiveness for repair with FRP of concrete T-beam bridges: Case study for PennDOT-District 3" (2006). Graduate Theses, Dissertations, and Problem Reports. 3243. https://researchrepository.wvu.edu/etd/3243
This Thesis is protected by copyright and/or related rights. It has been brought to you by the The Research Repository @ WVU with permission from the rights-holder(s). You are free to use this Thesis in any way that is permitted by the copyright and related rights legislation that applies to your use. For other uses you must obtain permission from the rights-holder(s) directly, unless additional rights are indicated by a Creative Commons license in the record and/ or on the work itself. This Thesis has been accepted for inclusion in WVU Graduate Theses, Dissertations, and Problem Reports collection by an authorized administrator of The Research Repository @ WVU. For more information, please contact [email protected].

Technical and Economic Effectiveness for Repair with FRP of Concrete T-Beam Bridges: Case Study for
PennDOT-District 3
Daniel A. Brayack
Thesis submitted to the College of Engineering and Mineral Resources
at West Virginia University
in partial fulfillment of the requirements for the degree of
Master of Science
in Civil and Environmental Engineering
Julio F. Davalos, Ph D., Chair Karl E. Barth, Ph D., Co-Chair
Indrajit Ray, Ph. D.
Department of Civil and Environmental Engineering
Morgantown, West Virginia
2006
Keywords: fiber reinforced polymer (FRP), concrete t-beam bridge, cost-benefit, economic feasibility

Technical and Economic Effectiveness for Repair with FRP of Concrete T-Beam Bridges: Case Study for PennDOT-District 3
Daniel Brayack
Advisor: Dr. Julio F. Davalos
Abstract:
The bridge inventory of the Pennsylvania Department of Transportation – District
3 (PennDOT-D3) includes 128 concrete T-Beam bridges built in 1920 to 1960. Due to
deterioration over time, a significant number of these bridges are in need of repair or
replacement. Traditional methods of repair require temporary bridge-closures and do not
provide long-term effective solutions. Moreover, the cost of replacement is not
financially viable. Thus, PennDOT D-3 sponsored this project to investigate the technical
and economic suitability of a relatively new technology, widely used for seismic retrofit,
consisting of externally bonded Fiber-Reinforce Polymer (FRP) for repair and retrofit of
concrete T-Beam bridges in particular, but applicable to other bridge structures in PA.
This thesis discusses a case-study project for innovative rehabilitation of cast-in-
place concrete T-Beam bridges in PennDOT-D3. The 128 bridges considered are simply-
supported structures of 20 to 60-ft span that provide much needed service throughout the
District. Although specific to PennDOT-D3 this study presents a general prescription for
the possible adoption of FRP for bridge repair and retrofit.
This study describes a method for cataloging candidate bridges from an inventory
based on suitability and favorability for repair with externally bonded FRP composites.
The rationale for the classification of a set of characteristics is described. This
classification is based on inspection data (photographical indication of damage and field
verification for representative bridges) and age, span, and ADT/ADTT. From these
characteristics, three suitable levels are identified: Class 1 (high), Class 2 (moderate) and
Class 3 (low). Correspondingly, 3 repair protocols are recommended: Major (repair
contracted out through competitive bid), Moderate (repair performed as a joint effort

between state engineers and contractors), and Minor (repair performed entirely by an in-
house crew). Comparisons are given for both cost-benefit (future worth) and construction
methods for both FRP and conventional repair for these 3 levels. Also, from a synthesis
of classification characteristics and repair levels, a prescription for the selection of
candidate bridges for trial repair is presented, to implement the technology on Phase II of
this project currently underway.

iv
Acknowledgements First of all, I would like to express my dear thanks to my Advisor Dr. Julio F. Davalos for
his continuing support and guidance throughout my time here at WVU. I really enjoyed
my time here and am glad that I could have been a part of all of the projects that we
worked on together. Also, I really enjoyed all of your classes. Because of my Junior
level Structural Analysis class, I am pursing structures for my life-long career. Also,
from the connections that I have gained through my experiences as a graduate student, I
have been able to land my dream job, working for the DOH main office in Charleston.
My sincere appreciation also goes to Dr. Karl Barth for the encouragement, the difficult
classes and all of the fun and exciting balderdash discussions we had together. Also,
thanks to Dr. Indrajit Ray. I really enjoyed working with you and have learned quite a lot
from my classes with you. To Dr. Chunfu Lin, thanks for helping me and providing me
with excellent knowledge in class and throughout the projects.
I would like to thank Lauren, Andy, Lora, Jennifer, Yi, and Zhiguo for the time we spent
together in the graduate office and the fun that we had together in classes.
I gratefully acknowledge the financial support from West Virginia University and my
advisor, Dr. Davalos.
Also, I would like to thank my Dad, my Grandpa and my Grandma for their endless
support. Finally, I would like to thank the Campus Lutheran Ministry, and my Pastor,
Matthew Riegel, for providing a healthy and moral environment from which I was able to
grow into a responsible and well-manner person.

v
Table of Contents Abstract……………………………………………………………………………...... ii
Acknowledgements…………………………………………………………………... iv
Table of Contents………………………………………………………….………..... v
List of Figures……………………………………………………………………….. viii
List of Tables………………………………………………………………………… x
Chapter 1 Introduction…………………………………………………………… 1
1.1 Background………………………………………….….……………… 1
1.2 Development of FRP for Rehabilitation…………….…….…………… 2
1.3 Advantages of Repair with FRP……………………….………….…… 3
1.3.1 Applicability of FRP for Repair……………….….…………… 3
1.3.2 Versatility of FRP……………………………………………… 3
1.4 Objectives and Scope of Work………………………………………… 4
Chapter 2 Overview of Conventional and FRP Repair Methods..………….… 7
2.1 Overview of Conventional Repair Methods…………………………… 7
2.2 Overview of Repair using the FRP technology……………………...… 7
2.3 Example Repair from Missouri Department of Transportation……...… 9
2.4 Summary and Conclusions…………………………………………… 10
Chapter 3 Classifications of Bridges…………………………………………… 15
3.1 Defining Characteristics Classifications……………………………… 15
3.2 Application of Characteristics Classifications to PennDOT D-3…….. 17
3.2.1 Overview of Inventory of PennDOT-D3……………………... 18
3.2.2 Application of Characteristics Classification………………… 18
3.2.3 Examples of Classification…………………………………… 20
3.2.4 Weight Values for Characteristics Classification…………….. 20

vi
3.2.5 Overall Classification of the PennDOT-D3 Inventory……….. 21
3.3 Recommendations for General Classification………………………... 22
3.3.1 General Characteristic Classifications………………………... 22
3.3.2 Localized Damage Classifications………………………........ 23
3.3.3 Weighted Averages…………………………………………… 23
3.4 Grouping based on Overall Damage……………………………….….. 24
3.4.1 Repair Level-1 (Major)………………………………….…..... 24
3.4.2 Repair Level-2 (Moderate)…………………………………… 25
3.4.3 Repair Level-3 (Minor)……………………………………….. 25
3.5 Conclusions…………………………………………………………… 26
Chapter 4 Recommendations for Selecting Ideal Candidate Bridges….…….. 41
4.1 Considerations for Selection of Candidate Bridges…………………... 41
4.1.1 Suitable Candidates…………………………………………… 41
4.1.2 Preliminary Analysis………………………………………….. 42
4.1.3 Detailed Analysis……………………………………………... 43
4.2 Selection of Candidate Bridges for Different Levels of Repair………. 44
4.2.1 Major Candidate Bridges (Repair - Level 1)…………………. 45
4.2.2 Moderate Candidate Bridges (Repair - Level-2)……………... 45
4.2.3 Minor Candidate Bridges (Repair - Level 3)…………………. 46
4.3 Suggested Implementation Strategy………………………………….. 47
4.4 Conclusions…………………………………………………………… 47
Chapter 5 Comparison of Methods Based on Costs & Construction………… 51
5.1 Design Assumptions………………………………………………….. 51
5.2 Repair-Example 1: Cost Comparison for Level 1 repair……………. 52
5.2.1 Design and Cost Assumptions for Repair-Example 1………... 52
5.2.2 Cost Assumptions for Replacement………………………….. 53
5.2.3 Comparison of Costs for Repair-Example 1………………..... 54

vii
5.3 Repair-Example 2: Cost comparison for Level 2 repair……………... 54
5.3.1 Cost-Benefit Comparison for Repair-Example 2……………... 55
5.3.2 Repair Scenarios Repair-Example 2………………………….. 55
5.3.3 Design and Cost Estimate for Repair-Example 2…………….. 56
5.3.4 Present Worth of Scenario 1 for Repair-Example 2………….. 58
5.3.5 Cost Comparison for Repair-Example 2……………………… 58
5.4 Repair-Example 3: Cost Comparison for a Level 3 repair…………... 58
5.4.1 Design and Cost Estimate for Repair-Example 3…………….. 59
5.5 Learning Curve Approach…………………………………………….. 61
5.6 Comparison of Construction Methods………………………………... 61
5.7 Detour-Driving Mileage Costs for Repair Example 2 ………………... 62
Chapter 6 Recommendations for Implementation…………………………….. 72
6.1 Various Approaches to Implementation……………………………… 72
6.2 PennDOT-D3 Implementation……………………………………….. 72
6.3.1 Castlewood Canyon Arch Bridge…………………………….. 73
Chapter 7 Conclusions and Recommendations………………………………… 80 7.1 Concluding Remarks………………………………………………….. 80
7.2 Recommendations for Future Work…………………………………... 82
References………………………………………………………………..……......… 84
Appendix A Details of Characteristics Classifications……….……...………..… 85
Appendix B Classification Based on Local Damage…………………………….. 91

viii
List of Figures Figure 1.1 Typical damage to a Reinforced Concrete T-beam. PennDOT-D3:
Bridge#12-54-2013-0010-0000………………………………………... 6
Figure 2.1 A Typical Formwork Diagram for Repair Using the Conventional
Method, Provided by PennDOT-D3………………………………….. 11
Figure 2.2 Bridge X-0596 of MODOT (Galati et al., 2004)……………………... 11
Figure 2.3 Condition of Exterior Girder of Bridge X-0596-MDOT
(Galati et al., 2004)…………………………………………………… 12
Figure 2.4 Cutting of FRP sheets (Galati et al., 2004)…………………………… 12
Figure 2.5 Manual Lay-up FRP Sheet Installation (Galati et al., 2004)………….. 13
Figure 3.1 An example of Damage Class-3 local damage. Damaged area
extends above the rebar……………………………………………….. 28
Figure 3.2 Another example of Damage Class-3 local damage. Damaged
area extends above the rebar………………………………………….. 28
Figure 3.3 Examples of Damage Class-2 local damage. ………………………... 29
Figure 3.4 Example of a Damage-Class 1 local damage.………………………... 29
Figure 3.5 Bradford County #08-4034-0140-1580……………………………….. 30 Figure 3.6 Union County #59-0045-0310-2011………………………………….. 31 Figure 3.7 Bradford County #08-4013-0250-1496………………………………... 32 Figure 3.8 Union County #59-1001-0110-2058…………………………………… 33 Figure 3.9 Snyder County #54-0522-0090-1932………………………………….. 34 Figure 3.10 Columbia County #19-3008-0100-0039………………………………. 35 Figure 3.11 Tioga County #58-1002-0050-0000……………………………………. 36 Figure 3.12 Visual Damage Score 10/10……………………………………………. 37 Figure 3.13 Visual Damage Score 6.67/10…………………………………………. 38 Figure 3.14 Visual Damage Score 3.33/10…………………………………………. 39 Figure 3.15 Visual Damage Score 0/10……………………………………………. . 40

ix
Figure 4.1 Major Candidate Bridge (Repair Level-1)…………………………….. 48 Figure 4.2 Moderate Candidate Bridge (Repair Level- 2)………………………… 49 Figure 4.3 Minor Candidate Bridge (Repair Level-3)…………………………….. 50
Figure 5.1 Standard T-Beam Section for Design Assumptions
for the FRP Repair……………………………………………………. 65
Figure 5.2 Standard T-Beam Section for Design Assumptions for
the Conventional Repair……………………………………………… 65
Figure 5.3 Bridge #41-0118-0230-0644, PennDOT-D3 Inventory………………. 66
Figure 5.4 Photographical Indication of Damage to the Center Pier of
Repair-Example 1…………………………………………………….. 66
Figure 5.5 Bridge #59-0045-0310-2011………………………………….……….. 67
Figure 5.6 A Cross-Sectional Diagram of the Bridge #59-0045-0310-2011,
Provided by PennDOT-D3……………………………………………. 67
Figure 5.7 Cost Comparisons Between Conventional and FRP
Methods for Example 2, Scenarios 1 and 2…………………………... 68
Figure 5.8 Bridge #41-0118-0020-1109………………………………………….. 69
Figure 5.9 Typical Learning Curve (Xanthakos, 1995)………………………….. 70
Figure 5.10 Gantt Chart for Conventional Repair (obtained with
Microsoft Project)…………………………………………………….. 70
Figure 5.11 Gantt Chart for Surface-Bonded FRP Technology
(obtained with Microsoft Project)…………………………………….. 70
Figure 5.12 Open Traffic Plans for Example Bridge 2 (distance = 600 yards)……. 71
Figure 6.1 Castlewood Canyon Arch Bridge FRP Repair. (ASCE)……………… 77
Figure 6.2 Typical Damage to the Castlewood Canyon Arch
Bridge. (Fafach, Shing, Chang and Xi, 2004)………………………… 78
Figure 6.3 FRP repair applied by (Hag-Elsafi, Alampalli, Kunin, 2001)
and (Hag-Elsafi, Alampallil, Kunin, 2003)…………………………… 79
Figure 6.4 Damaged Beam-Cap repaired by (Hag-Elsafi, Lund,
Alampalli, 2002)……………………………………………………… 79

x
List of Tables Table 2.1. Summary of Information of Repair of Bridge X-0596
(Galati et al., 2004)…………………………………………………….14
Table 3.1: Classification of Bridges in PennDOT D-3…………………………...22
Table 3.2: Local Damage Levels of Bridges in PennDOT D-3…………………..22
Table 3.3: Example of Application of an Importance Factor to Bridge
Classification for Bridge #49-1039-0020-0000………………………..27

1
Chapter 1
Introduction
This thesis ties closely to a portion of a report presented to PennDOT District 3
(PennDOT D-3) as part of a project to investigate an alternative method for the
rehabilitation of deteriorating concrete T-Beam bridges. This report (Davalos, Barth,
Ray, et al. 2005), as well as this thesis, answer a series of questions posed by PennDOT
D-3. This thesis expands upon the project report by proposing a general scheme for the
selection of bridges for rehabilitation; the PennDOT D-3 project is used to develop this
scheme and then is presented as an example. This Chapter reviews the background for
the repair of deteriorating concrete structures with externally bonded Fiber-Reinforced
Polymer (FRP) Composites. Concrete deterioration is first discussed, followed by FRP
repair as an alternative to conventional rehabilitation methods. An “under-water”
example repair is presented to demonstrate the versatility and advantages of FRP.
Finally, the scope of work for this thesis is presented.
1.1 Background
Concrete structures and particularly concrete highway bridges are continuously exposed
to the deleterious effects of environmental attacks, leading to degradation of the material
and corrosion of the reinforcing steel. Such degradation is exacerbated by the application
of deicing salts on highway bridges as well as the freeze-thaw and dry-wet cyclic
exposures causing accelerated ageing of structures over time. In the United Sates nearly
one-third of the highway bridges are in need of repair or replacement, and a significant
percentage of these bridges include concrete either partially or totally. Figure 1.1 shows a
common result of these deteriorating mechanisms. The US infrastructure rehabilitation
cost is estimated at 1.3 trillion dollars over the next five years, with corrosion
deterioration costs due to deicing and sea salts effects estimated at $150 billion (Davalos,
Barth, Ray, et al. 2005.) Similarly in the United Kingdom over 10,000 concrete bridges
are in need of structural strengthening. In Europe, the cost of the repair of reinforced
concrete structures because of steel corrosion is estimated to be over $600 million

2
annually. In Canada, it is estimated that the required repair costs for parking garages
alone is about $6 billion (Neville, 1996).
As an illustration of structural deterioration of concrete highway bridges, consider a
recent bridge collapse in Washington Pennsylvania that has roused concerns about the
condition of concrete bridges in PA and the United States of America. A paraphrase
(Time, 29 December 2005): “On 27 December, 2005 a 45-year old overpass (SR-1014)
that had been rated ‘structurally deficient’ and has been hit repeatedly by trucks collapsed
under its own weight. PennDOT inspects bridges every two years; this bridge was due
for inspection in two months. Its deck and superstructure had been rated a 4 out of 10,
with 10 being the best in March 2004. Still the bridge was not posted with load limits. It
would have been categorized as ‘structurally deficient’ along with 25 percent of all
25,000 bridges the state owns. Three people were injured, a 45-year old woman, her 6-
month old daughter and her 22-month old son.” Several weeks later, several other
bridges were closed; a paraphrase (Time, 29 December 2005): “Two bridges over I-70 in
Washington County were closed. The bridges that were closed were similar in design to
the one that collapsed. ‘We are applying lessons learned from the recent incident and
looking even more intently at bridges of this type that span the highways’ said PennDOT
Secretary Allen D. Biehler. The cause of failure was sited as deterioration of reinforced
strands.”
1.2 Development of Fiber-Reinforced Polymer/Plastic for Rehabilitation
Concrete deterioration worldwide has motivated the development of new and innovative
materials and methods for structural rehabilitation, since replacement of structures would
be very costly. One solution to overcome steel corrosion in concrete for new
construction is to use Fiber-Reinforced Polymer or Plastic (FRP) materials instead of
steel. More importantly is the beneficial application of FRP for structural rehabilitation
of deteriorated concrete structures. FRP composite materials in the form of fabrics and
laminates have been externally bonded to concrete structures to increase structural
capacity and provide longer service-life. The application of this technology in practice
has been highly successful (Davalos, Barth, Ray, et al. 2005).

3
1.3 Advantages of Repair with FRP
This Section discusses the advantages and applications of FRP repair, specifically
applicability and versatility. An example is presented to demonstrate these advantages.
1.3.1 Applicability of FRP for Repair
FRP repair is a simple way to increase both the strength and design life of a structure.
Because of its high strength to weight ratio and resistance to corrosion, this repair method
is ideal for deteriorated concrete structures due to exposure to de-icing salts and other
environmental factors. By encasing concrete members, FRP protects existing steel and
concrete from deleterious effects. It was noted that in many bridges the majority of
corrosive damage occurred on exterior girders. This indicates that deleterious effects
may be a direct result of surface exposure to spray of water and de-icing agents.
Encasement of these girders not only increases design life, but also protects the members
from surface attacks.
1.3.2 Versatility of FRP
FRP is a versatile material. Though this thesis focuses on concrete T-Beam bridges, FRP
can be applied to a wide range of structures. FRP sheets can be cut and easily bonded to
any concrete member. The next Section presents an example of a wide-scale repair of
pier structures where due to site conditions and cost, FRP repair was well suited.
1.3.3 Example: Issues Related to FRP Wrap of Corroded Piers
Sen and Mullin’s, (2004) investigated the application of FRP to piers in a harsh, corrosive
environment, and demonstrated the cost-effectiveness and versatility of FRP. The 2.6-
mile Friendship Trails Bridge is the world’s longest over-the-water recreational trail.
Located in Florida, this bridge contains 254 piers. About seventy percent of these piers
needed to be repaired; hence, an inexpensive means was sought. Through this project, it
was found that FRP was an easy and cost-effective method for rehabilitation. “The
research team was pleasantly surprised at the ease with which the underwater wrapping
was carried out.” Figure 1.2 shows piers and application of the FRP.

4
1.4 Objectives and Scope of Work
The specific objective of this thesis is to investigate the technical and economical
feasibility of using “surface-bonded FRP-wrap repair” (FRP repair/method) for wide-
scale bridge rehabilitation. This thesis uses a project performed with PennDOT D-3 as
case study to present bridge-classification and the selection of candidate bridges from an
inventory for FPR repair. An interesting note is that most applications of FRP in the past
have been concerned with only one or several large repairs to “highlight” or
“demonstrate” FRP innovation. In contrast, the scope of the PennDOT D-3 project
includes a District-wide “and possibly State-wide” replacement of a conventional repair
method with the FRP repair. Specifically this thesis intends to answer a serious of
questions posed by PennDOT D-3.
Chapter 2 poses an answer to the question: “Is FRP a valid repair method for bridges in
the PennDOT D-3 inventory?” This Chapter presents both the conventional and FRP
methods for repair of reinforced concrete T-Beam bridges. The repair procedure for the
FRP method is presented in detail using both a repair protocol from a materials provider
and an example repair from the Missouri Department of Transportation (MODOT).
From this example repair, it is shown that MODOT has successfully implemented FRP
repair on bridges similar to those in the PennDOT D-3 inventory. Also, a typical
formwork diagram is used to illustrate the conventional method and to provide a contrast
between these two repair methods.
To answer the following question: “Which bridges are suitable and favorable for repair
using FRP?” and “Which bridges are ideal candidates for a trial repair program?”,
Chapter 3 groups bridges in two ways. The first group involves classification based on
bridge characteristics (3.1). These characteristics include type and extent of local damage
(Damage-Class), and bridge data such as age, span-length, and traffic levels. This
classification is designed to rank bridges accordingly for suitability and favorability for
repair with FRP.

5
The second grouping includes classification based on overall damage (3.2). Three levels
of repair are defined and presented to indicate the overall level of repair. This is
important for a transition from conventional repair methods to FRP repair. We
recommended that first, a large-scale (Repair-Level 1) project be carried out, which
would be contracted out through competitive bid. This would provide PennDOT D-3
with a good training experience. The end-goal of this technology transfer is to allow
PennDOT D-3 to implement FRP autonomously with a blend of “in-house” forces and
competitive bids based on the required level of repair.
The characteristic classifications described above are applied to the PennDOT D-3
inventory in 3.3 as an example. Using the classifications developed for PennDOT D-3, a
prescription for general classifications is suggested in 3.4.
To answer the question posed in Chapter 3: “Which bridges are ideal candidates for a
trial repair program?”, a synthesis of the two groupings from Chapter 3 is used to define
“ideal candidate bridges” in Chapter 4. These bridges are later used in Chapter 5 to
answer the question: “Is the FRP technology economically feasible and competitive with
the conventional repair method?” In Chapter 5, comparisons are given for both costs and
construction requirements for both methods.
After answering technical and economic questions and selecting candidate bridges, the
final question posed is: “What are the implementation steps for FRP repair of the
selected bridge(s)?” This question is answered in Chapter 6 by a series of suggested
steps. Several selected examples are presented from numerous of projects to illustrate the
implementation steps. Finally, conclusions and recommendations for future work are
presented in Chapter 7.

6
Figure 1.1: Typical damage of a Reinforced Concrete T-beam. PennDOT-D3: Bridge#12-54-2013-0010-0000.
Figure 1.2: Corroded piers and application of FRP (Sen and Mullins, 2004).

7
Chapter 2
Overview of Conventional and FRP Repair Methods
This Chapter answers the question: “Is FRP a valid repair method for bridges in the
PennDOT D-3 inventory?” To provide background on the existing method, an overview
of the conventional repair method employed by PennDOT D-3 is presented (2.1). To
provide insight, an overview of the application of surface-bonded FRP to concrete
bridges is provided in (2.2). The FRP repair method is discussed by using both a typical
installation procedure from Fyfe CO, a technology provider (2.2), and a sample repair
performed in Missouri (2.3). An answer to the posed question and a summary of this
chapter are provided in (2.4).
2.1 Overview of Conventional Repair Methods
In an effort to prevent further corrosion of steel rebar and deterioration of reinforced
concrete T-Beam bridges, a conventional repair technique has been developed and
employed by PennDOT D-3. This method involves: removal of all loose and unsound
concrete, replacement and/or additional placement of rebar, and placement of formwork
to cast a concrete cover or “jacket.” Though this process seems quite simple, formwork
and repair of rebar requires significant effort. Figure 2.1 shows an example of suggested
formwork for a conventional T-Beam repair. This figure was provided by PennDOT-D3.
2.2 Overview of Repair using the FRP technology
The behavior of concrete members retrofitted with FRP systems is highly dependent on a
sound concrete substrate, as well as proper preparation and profiling of the concrete
surface. Surface preparation of the substrate is essential to achieve a good bond. The
surface must be clean of all laitance, dust, dirt, oil, curing compound and existing
coatings by appropriate means (Davalos, Lin, Ray, et al. 2005). Other irregularities
should be filled or ground smooth in order to provide an acceptable surface. Once the
surface is prepared, the FRP is applied using the manufacture’s specifications. To

8
provide an overview of the FRP surface-bonded repair process, a typical installation
procedure prescribed by Fyfe Co., a supplier of this technology, is as follows:
1. Prepare surface to receive the composite laminate strips by abrasive blasting or
grinding to achieve a 1/16” minimum aggregate amplitude (International Concrete
Repair Institute CSP 5 – Guideline No.03732).
2. Broom or air-clean surface per specification.
3. Apply primer coat of TYFO® S or TYFO® WS (propriety designation for carbon
composite laminate strips) to the prepared substrate.
4. Apply a thick coat (approximately 1/16”) of TYFO® TC to the primed substrate
for bond.
5. Clean the abraded side of the laminate (side without lettering) with acetone or
other similar solvent to remove all foreign materials – allow complete evaporation
of solvents prior to proceeding with the installation.
6. Apply TYFO® TC epoxy adhesive (approximately 1/16”) to the cleaned
laminate surface using a trowel or by similar method. Note – The TYFO® TC is
not to be applied to the cleaned strip for a minimum of 30 minutes to allow
complete evaporation of the Acetone or other solvent.
7. Allow sufficient time for the epoxy adhesive to become tacky as required.
8. Apply strips to surface by hand placement. The laminate shall then be pressed to
the substrate using a hard roller (rubber or steel) to assure both proper bond and
uniform elevation. Excess extruded epoxy may be removed by trowel or similar
method.
9. Clean excess epoxy from installed laminate and adjacent areas.
10. Finish: Refer to architectural specification for final finish. Use system as
directed by manufacturer.
11. Cure: The composite shall be protected from contact by moisture for a period of a
minimum of three days. Curing is complete after seven days.
An example repair from the Missouri Department of Transportation is presented next to
illustrate surface preparation and the installation of eternally bonded FRP.

9
2.3 Example Repair from Missouri Department of Transportation
To illustrate the application and process of FRP repair, an example repair of two bridges
is provided. The repairs were performed by the Missouri Department of Transportation
(MODOT) in conjunction with the University of Missouri-Rolla (UMR), and under the
direction of Dr. Nestore Galati (Galati et al., 2004). These bridges (Bridge X-0596 and
Bridge T-0530) are similar in design and have experience a similar level and type of
damage as the bridges in the PennDOT-D3 inventory. Figures 2.2, 2.3 and Table 2.1
show photos of Bridge X-0596 and a summary of information. The MODOT repairs
were targeted for both rehabilitation and strengthening. Although strength gain may not
be a primary objective in projects, it is an added benefit of repair using FRP. The
implementation steps of MODOT’s FRP repair are summarized next, and include: (1)
substrate repair, (2) surface preparation, (3) application of FRP, and (4) traffic control.
1. Substrate Repair: The performance of the composite system not only
depends on the strength and quality of the concrete substrate, but also on the
bond between the composite and substrate. Unsound concrete was removed
and patched. Also, holes were filled (Galati et al., 2004).
2. Surface Preparation: To promote continuous and intimate contact
between the substrate and FRP, concrete irregularities were removed and
smoothed to less than 1 mm. Also, all corners were rounded to reduce stress
concentrations. Finally, abrasive sandblasting was used to clean the concrete
surfaces of dust, dirt, laitance, oil and any curing substances. Concrete
surface roughness was equivalent to CSP 3 (Concrete Surface Profile number
3) as defined by the “International Concrete Repair Institute” (Galati et al.,
2004).
3. External Bonding of Composite Reinforcement: Three spans of Bridge
X-0596 were bonded with manual lay-up laminates. The installation process
is described next.

10
Epoxy primer was used to fill voids in the concrete surface. All surfaces,
which were to be bonded with FRP, were primed with a penetrating primer.
Primer was mixed in accordance with the manufacturer’s specified ratio and
applied using brushes and rollers.
The carbon fiber sheets were cut (see Figure 2.4, photos from Bridge T-0530)
before placement into prescribed sizes. Next, the sheets were installed by
manual lay-up methods. The sheets were saturated using rollers (Figure 2.5).
After appropriate time (10 minutes), a second saturant application was applied
to complete impregnation. The saturant was applied in strict accordance with
the manufacturer’s recommendations. (Galati et al., 2004)
4. Traffic Control: One of the benefits of the application of this technology
is that the bridge does not need to be closed during installation. However, in
order to avoid vibrations on Bridge T-0530 during the installation, traffic
control was used. Speed of vehicles was limited to 15 mph.
2.4 Summary and Conclusions
This chapter has presented an overview of both the conventional repair method employed
by PennDOT D-3 and the innovative FRP repair method. Specifications from Fyfe Co.
were summarized to show the steps for performing an FRP repair. Also, an example for
MODOT brides in collaboration with UMR was provided to show details of FRP repair.
From these specifications and example repairs from MODOT (for bridges similar to those
in the PennDOT D-3 inventory), it is inferred that the FRP method is potentially
applicable to the repair of PennDOT D-3’s bridges.

11
Figure 2.1: A Typical Formwork Diagram for Repair Using the Conventional Method,
Provided by PennDOT-D3.
Figures 2.2. Bridge X-0596 of MODOT (Galati et al., 2004).

12
Figure 2.3. Condition of Exterior Girder of Bridge X-0596-MDOT (Galati et al., 2004).
Figure 2.4. Cutting of FRP sheets (Galati et al., 2004).

13
Figure 2.5. Manual Lay-up FRP Sheet Installation (Galati et al., 2004).

14
Table 2.1. Summary of Information of Repair of Bridge X-0596 (Galati et al., 2004). Bridge X-0596 - MODOT
District: 5, Missouri County: Morgan
Year Built: 1946 Featured Intersection: Lander Fork Creek Main Spans Construction: RC T-Beams Number of Main Spans: 3
Total Length: 137.5 feet Bridge Features
Geometry • Roadway width is 20 ft • Alignment is tangential • Three-span deck • Three RC T-Beams spaced 9 ft on centers • Slab thickness is 6 in.
Concrete Conditions Prior to Application • Cracks in exterior girders, some reinforcement exposed and some concrete
deteriorated • Cracks and deterioration of beams in intermediate bents • Cracks and deterioration of the ends of the girders at intermediate bents • End Bents in better condition (but with rusty steel bearing plates)

15
Chapter 3
Classifications of Bridges
This chapter answers the question: “Which bridges are suitable and favorable for repair
using FRP?” and addresses the question: “Which bridges are ideal candidates for a trial
repair program” which is answered in Chapter 4. A set of groupings is proposed to select
bridges that are good candidates for FRP repair. Using a weighted average of bridge
characteristics (characteristics classifications as defined in Section 3.1), three classes are
proposed: Class 1 (high favorability), Class 2 (moderate favorability), and Class 3 (low
favorability). Bridges from the PennDOT D-3 inventory are used as an example to
illustrate this grouping. Details of individual characteristic classifications, respective
scores and overall bridge classifications of PennDOT D-3 bridges are found in 3.2.
Though these classifications were developed for PennDOT D-3 (as shown in 3.2), general
classifications can be extrapolated to fit any inventory. Details of this are presented in
(3.3).
To select candidate bridges for a trial repair program, three overall damage levels are
defined (3.4). These levels allow grouping of bridges according to the overall project
size. This ranges from: Repair Level-1 (Major repair effort, contracted out through
competitive bid) to Repair Level-3 (Minor repair effort, performed entirely by
“in-house” employees), with a Repair Level-2 being a middle ground (combination of
both contractors and “in-house” forces). These repair levels will be used later to suggest
a trial program to train state employees (Chapter 4). Also, these repair levels will be used
in Chapter 5 to compare cost-benefit between conventional and FRP repair. Finally, in
section (3.5), conclusions are presented.
3.1 Defining Characteristics Classifications
The purpose of this and the next section is to calculate weighted averages to classify
bridges in the PennDOT D-3 inventory according to favorability for repair.

16
Characteristic classifications are first defined (this Section). Next (Section 3.3), these
classifications are applied to the PennDOT D-3 inventory
To identify bridges which would most benefit from the FRP repair, the PennDOT D-3
inventory is classified based on a weighted average of the four characteristics and scores
presented next. Other factors may be included to tailor this classification to a partial
inventory or other inventories.
1. Age (1-10) 2. Span Length (1-10) 3. ADT/ADTT (1-10) 4. Localized Damage-Class (Initially photographical indications from inspection
teams) (Class 0 to 3; Score for each corresponding class 0 to 10)
For the first three characteristics, 10 represents most favorable for repair. For Localized
Damage-Class, 0 represents least suitable for repair whereas 3 represents most suitable
for repair. In order to classify bridges based on the above characteristics, a weighted
average is calculated from these for ranking the bridges according to favorability for
repair. Details of this can be found in (3.3). An explanation of each characteristic and
rationale for scoring is presented next.
1. Age of Bridge: Older bridges received a lower score because these bridges are
generally closer to their design life. Also, due to global deterioration,
replacement may be the most economical alternative. Newer bridges are scored
higher.
2. Span Length: Because of general similarities in cross-sections and beam
spacing in the inventory, span length is an important category. Because bridges
with larger spans will likely experience more critical loads, these are scored
higher.
3. ADT/ADTT: A bridge that carries more traffic is more favorable for repair
than bridges that do not carry much traffic at all. Because of limited resources, it
is more sensible to repair bridges that are used more frequently. Also, with

17
increased truck traffic, bridges are likely to experience more critical stresses and
fatigue loads.
4. Localized Damage-Class (Visual Inspection/Photographical Indication):
Visual indication of damage is the most subjective characteristic. Classification
in this category is based on past experience with repair and/or comparison to
damage repaired by others. This Section will provide several figures to illustrate
the type/extent of local damage most prevalent in T-Beam bridges and their
respective class.
Bridges with more extensive local damage are rated higher because repair of these
bridges is more critical.
Damage classes are as follows:
• Damage-Class-3: First layer of reinforcement completely exposed.
Damage generally extends above the rebar. (Figure 3.1 and 3.2)
• Damage Class-2: Broader, this level of damage encompasses most
levels of partial rebar exposure. (Figure 3.3)
• Damage Class-1: Minor exposure of rebar (Figure 3.4)
• Damage Class-0: No visible damage
3.2 Application of Characteristics Classifications to PennDOT D-3
This Section provides examples of the application of the classifications presented in the
previous Section. This classification was performed on an inventory of 128 Reinforced
Concrete T-Beam bridges in District 3, Pennsylvania. First, (3.2.1) reviews the inventory
of District 3’s bridges. Then, (3.2.2) tailors the characteristic classifications (defined in
3.1) to these bridges and provides scorings based on general characteristics (Age, Span
Length, ADT and ADTT) as well as the local damage-class.

18
Section (3.2.3) goes further to explain and provide examples of each local damage-class
scoring, whereas Section (3.2.4) explains and applies weighted averages, placing each
bridge in a specific characteristic category which is provided in (3.2.5).
3.2.1 Overview of Inventory of PennDOT-D3
Shown next is the range of characteristics of PennDOT-D3’s 128-bridge inventory.
Specific details for each bridge can be found in Appendix A.
Year Built 1919 to 1973
Span Length (ft) 15 to 174 ADT 70 to 12300
ADTT 2 to 2100
From Appendix A, it is evident that most bridges are single-span (non-continuous multi-
spans are specifically noted), short bridges (20-60ft), built between 1920-1960. The
ADT and ADTT vary greatly amongst the population.
3.2.2 Application of Characteristics Classification
The following tables show the characteristic classifications described in (2.1) applied to
the PennDOT-D3 inventory.
Age:
Age Category Score Bridges in Category 1955-1973 10 12 1950-1954 9 8 1944-1949 8 3 1942-1945 7 8 1940-1941 6 14 1935-1939 5 21 1930-1934 4 29 1925-1929 3 21 1920-1924 2 9
Older than 1920 1 3 Total = 128

19
Span Length:
Span (ft) Score Bridges in Category 80+ 10 5
60-79 9 5 50-59 8 7 45-49 7 9 40-44 6 10 35-39 5 16 30-34 4 24 25-29 3 33 20-24 2 15
Less than 20 1 4 Total = 128
ADT/ADTT:
ADT Score Bridges in Category 10,000 + 10 6
5,000-9,999 9 14 3,000-4,999 8 19 2,500-2,999 7 9 1,500-2,499 6 14 1,000-1,499 5 13
500-999 4 11 300-499 3 17 150-299 2 11
Less than 150 1 14 Total = 128
ADTT Score Bridges in Category 1,000 + 10 3 500-999 9 7 400-499 8 7 300-399 7 11 200-299 6 8 100-199 5 18 75-99 4 14 50-74 3 15 25-49 2 13
Less than 25 1 32 Total = 128

20
Local Damage-Class:
Class Score Bridges in Category 3 10 30 2 6.67 36 1 3.33 17 0 0 45
Total = 128
3.2.3 Examples of Classification
Bridges in the PennDOT-D3 inventory showed similar damage. Generally the exterior
beams experienced a wide range of damage while the interior beams and deck experience
less or not damage. The classification based on localized damage does not consider the
overall damage, but rather the extent of damage indicated by photographical evidence.
Sample bridges and their corresponding classifications are provided in Figures 3.5-3.11.
Also, Figures 3.12-3.15 show photographical indication of local damage and respective
local damage-class ratings.
3.2.4 Weight Values for Characteristics Classification
In order to aid in the selection of bridges for further evaluation, the scores assigned for
each characteristic are tabulated and averaged based on weighted averages. These
weighted averages can be tailored to meet the specific goals of any DOT.
The age of the bridge is considered because of both economic and repair concerns. Older
bridges are more likely to reach their design life sooner. Also, older bridges will generally
have concrete of lesser quality (due to deterioration), which will be important in the
implementation of the FRP technology.
The span length of the bridges is an important parameter. Because most of these bridges in
the inventory are of similar designs, longer spans will equate to more critical load conditions.
Hence, it will likely be more economical to apply the technology to bridges with longer span
lengths.

21
An important factor in the classification of bridges is the ADT and ADTT. Larger traffic
volumes will result in increased probability of critical loading, and it is more cost effective to
repair bridges that are used more often.
Finally, the most important classification is based on the type and extent of local damage.
The PennDOT D-3 inventory is scored based on visitation of a small sample of bridges and
primarily existing photographical inspection data.
For the PennDOT-D3 inventory, characteristics were weighted as follows:
1. Age (15%) 2. Span Length (10%) 3. ADT/ADTT (35%) (17.5% & 17.5%) 4. Local Damage Class (40%)
Note: These weighted averages are subjective. Engineering judgment or a statistical
approach may be used to determine the best weighted averages for a particular inventory.
3.2.5 Overall Classification of the PennDOT-D3 Inventory
Based on the weighted averages and scores provided in this chapter, the following classes
have been defined for the PennDOT-D3 inventory:
Class 1: Prime Candidate for Repair (Score of 68-100%). This set of bridges is likely
a prime candidate for the FRP technology. Field investigation is suggested for the
following purpose: On some of these bridges, the damage may be so severe that the
most economical course of action may be to replace these structures.
Class 2: Moderate Candidate for Repair (Score of 50-68%). These bridges are likely
candidates for repair. However, field investigation of these bridges is suggested to
closely examine the type and extent of damage, as well as the cost-benefit of applying
the FRP technology to these bridges.
Class 3: Low Candidate for Repair (Score of 0-50%). Because of age, size, level of
traffic, damage type or lack of damage, these bridges are not the prime focus for the

22
FRP technology. Some of these bridges may benefit from FRP-repair technology,
but other bridges may be better candidates for conventional repair.
Table 3.1 shows the rating class, score, number of bridges, and percentage of total inventory.
It should be noted that many of the bridges in the inventory have no visual damage. Table
3.2 shows local damage level scoring and the number of bridges in each of these categories.
Characteristic classification and details of the inventory are found in Appendix A.
Classification of bridges based solely on damage is found in Appendix B.
Table 3.1: Classification of Bridges in PennDOT D-3
Rating Class Score No of Bridges Percentage of Total 1 68-100 13 10.2 2 50-67 44 34.4 3 0-49 71 55.5
Table 3.2: Local Damage Levels of Bridges in PennDOT D-3
Damage Ranking
No of Bridges
Percentage of Total
3 15 11.7 2 44 34.4 1 29 22.7 0 40 31.3
3.3 Recommendations for General Classification
This section prescribes general guidelines for the classification of bridges. These
guidelines, as well as engineering judgment, can help determine which bridges in an
inventory are most suitable for FRP repair. From these “suitable” bridges, a candidate
bridge can be selected for a trial program.
3.3.1 General Characteristics Classification
Because of limited resources, one must rank an inventory based on favorability for repair.
For bridges in a particular inventory that are generally similar in design, distinguishing
characteristic factors such as: age, span length, ADT, and ADTT can be used to rank the
structures considered.

23
Though each inventory is different and should be evaluated accordingly, ADT&ADTT
are good factors to consider while ranking bridges for favorability. It makes sense to
repair bridges that are used more often. Also, these bridges have a higher probability of
experiencing critical design loads. Though this factor is given a higher importance level
than age/span-length, etc., the suggested approach can be modified and tailored to
classify any inventory.
Actual data, however, may not be exclusively used to classify bridges. Other social
factors may play a significant role in the importance of a bridge. Though a particular
bridge may have a low ADT or ADTT, a school bus may pass over this bridge every day;
or perhaps a bridge may provide an essential connection for a community. To account
for this, an optional importance factor can be applied to the characteristic classifications.
Naturally, this importance factor is independent of damage classification. This
importance factor can be applied while calculating weighted averages as illustrated in
(3.4.3).
3.3.2 Localized Damage Classification
Type and extent of damage is generally the most important factor in the classification of a
bridge. Many State DOTs perform yearly/bi-yearly inspection which includes
photographical documentation. From these photographs, an inventory can be classified
without visitation. It is, however, strongly suggested that a sample of the inventory be
physically examined to gauge photographical evidence and assess suitability for repair.
An effective method of damage classification is to first examine the type of damage in
the inventory and then compare this type of damage to samples from PennDOT-D3
(Figures 3.12-3.15)
3.3.3 Weighted Averages
Based on the particular goals of a DOT and distinguishing characteristics of an inventory,
a weighted average of each characteristic and damage score can be calculated to rank
bridges according to favorability for repair. From this classification, candidate bridges

24
can be selected for a trial repair program. If accepted, the FRP method can then be
applied to the rest of the suited bridges in the inventory.
Presented in Table 3.3 is an example from PennDOT D-3 with an applied importance
factor. Without the importance factor, this bridge is considered a moderate candidate for
repair (Class 2). However, if this bridge was identified as an “important” bridge as
discussed in (3.4.1), an importance factor of “2” can be applied to this bridge. From
Table 3.3, it is shown that, with this importance factor, this bridge moves from Class 2 to
Class 1 (prime candidate for repair). Note: this importance factor does not affect the
visual damage score.
3.4 Grouping based on Overall Damage
The purpose of this section is to group bridges based on overall repair-levels. This
classification will indicate the overall project size. A large scale repair (Repair Level-1)
is most likely contracted out to a 3rd party company, whereas a smaller repair (Repair
Level-3) could be performed by a trained, “in-house” work force. Bridges that fall
between these two ranges (Repair Level-2) could be repaired via a joint effort between a
contractor and state employees. This grouping will help identify a candidate or several
candidates which are suitable for an introductory repair/training experience for state
employees. Once trained, state employees could continue the implementation of the FRP
technology independently.
Also, these repair levels are used later in Chapter 5 to compare cost-benefit for the FRP
and conventional repair methods.
3.4.1 Repair Level-1 (Major)
This level requires extensive repair, including most or all of the beams along the entire
length. At this level, the engineering work is most likely performed by a consultant and
the actual repair is contracted out through competitive bid.
At this level, all of the preparatory concrete work and application of surface bonded FRP
would be performed per project specifications and construction drawings. It is expected

25
that the overall scope of work may include other pay items such as abutment repair,
bearing repair, and possibly expansion joint repair. While the application of the FRP may
represent a smaller portion of the overall project cost, the scale of the project can offer
sufficient opportunities for developing expertise with FRP technology (Davalos, Barth,
Ray, et al. 2005).
3.4.2 Repair Level-2 (Moderate)
This level of repair requires a significant effort; however, this level of damage is not as
extensive as a Level 1 repair. Typically, this level of repair will include several beams,
including generally the entire length of exterior girders.
At this level, some field activities can be accomplished by state employees. However,
because of technical complexities and scope of work, some aspects of the project would
be performed by outside contractors. Several possibilities could be explored, such as: (1)
retaining a consultant for the engineering portion and using state forces for labor
(possibly in phases); (2) performing the engineering in-house and contracting out the
specialty items (crack injection or application of the FRP), with state forces acting as a
general contractor; finally (3), performing the engineering in-house and contracting out
all of the field work (Davalos, Barth, Ray, et al. 2005).
3.4.3 Repair Level-3 (Minor)
This level of repair requires a less effort compared to levels 1 and 2. Typically, this level
of repairs includes either one or several partial beams. This type of repair can be
completed entirely by a trained “in-house” work force.
From a field assessment, the expected scope of work could include removing loose
concrete, cleaning existing reinforcing steel, measuring the current area of steel,
estimating the compressive strength of the concrete, forming and casting new concrete or
mortar to re-establish the beam section, then application of surface bonded FRP after
appropriate surface preparation. To expedite the project, final design to determine the
quantities of the FRP can be performed while preparatory work is being completed. At
this level the anticipated scope of work, although detailed, is small and it is realistic to

26
assume that the state could accomplish this using in-house engineering and state forces.
Funding for this type of maintenance construction is realistically within the limits of a
state force account.
3.5 Conclusions
In this chapter, we discussed a set of characteristics classifications to determine which
bridges in the PennDOT D-3 inventory are suitable and favorable for repair using FRP.
These classifications were based on distinguishing bridge characteristics such as age,
span length, traffic level, and type of damage. Also, a grouping based on overall damage,
or repair levels, was presented. This grouping will be used in Chapter 4 to suggest
candidate bridges and a trial repair program. Also, this grouping will be used in Chapter
5 to compare cost-benefit for three repair examples.
From classifications developed for PennDOT D-3, a set of general classifications is
prescribed. The intent of these prescriptions is to propose general guidelines for the
adoption of FRP for any bridge inventory.

27
Table 3.3: Example of Application of an Importance Factor to Bridge Classification for Bridge #49-1039-0020-0000
Span
Span SC Yr
Age SC ADT
ADT SC ADTT
ADTT SC Visual V SC Imp. Rank
30 4 30 4 500 4 50 3 3 10 1 62.25
30 4 30 4 500 4 50 3 3 10 2 84.5
Note: each score is out of 10, characteristic classes are in yellow
and damage classifications are in green.
Sample Calculation:
5.8410
)40*102*)5.17*35.17*415*410*4(
**)*
***(
=++++=
++
++=
Rank
WisualWVSCIMPADTTWADTTSC
ADTWADTSCAgeWAgeSCSpanWSpanSCRank
Note: Span SC = Span-Score (=4); Span W = Span-Weight (=10). Similar rotation of
other parameters
Weighted Values PercentSpan 10Age 15ADT 17.5ADTT 17.5Visual 40Sum 100

28
Figure 3.1: An example of Damage Class-3 local damage. Damaged area extends above
the rebar.
Figure 3.2: Another example of Damage Class-3 local damage. Damaged area extends
above the rebar.

29
Figure 3.3: Examples of Damage Class-2 local damage. Partial exposure of rebar.
Figure 3.4: Example of a Damage-Class 1 local damage. Minor exposure of rebar.

Figure 3.5. Bradford County #08-4034-0140-1580. Class #1: Overall Score (70.3/100).
Details:
Span(ft): 50Ranking: 8/10
Year Built: 1952Ranking: 9/10
ADT: 354Ranking: 3/10
ADTT: 35Ranking: 2/10
Visual Damage:Ranking 10/10
Number of Spans: 1
Status: Open
Road: SR 4034
Photos 1 and 3: NCHRP Report 514, examplesof a T-beam suitable for FRP repair techonology
Photo 2: Provided by PennDOT for bridge#08-4034-0140-1580
Note: This bridge carries low traffic volume. But thecombination of span, age and visual damage resultedin a ranking of about 70 out of 100, or the lower endof the population of Class #1 bridges.
1. 2.
30
3.

Details:
Span (ft): 30Ranking: 4/10
Year Built: 1938Ranking: 5/10
ADT: 10310Ranking: 10/10
ADTT: 648Ranking: 9/10
Visual Damage:Ranking: 10/10
Number of Spans: 1
Status: Open
Road: SR 45
Figure 3.6. Union County #59-0045-0310-2011. Class #1: Overall Score (84.8/100).
Photo on left: NCHRP Report 514, an exampleof a T-beam suitable for FRP repair techonology
Photo on right: Provided by PennDOT for bridge#59-0045-0310-2011
Note: This is a likely candidate for repair. This bridge scored high because of its large trafficvolume and its similarities in damage to the NCHRP Report 514. This bridge ranked high eventhough it scored relatively low in the span and age category.
31

Details:
Span(ft): 25Rank: 3/10
Year Built: 1927Ranking: 3/10
ADT: 1606Ranking: 6/10
ADTT: 161Ranking: 5/10
Visual Damage:Ranking: 10/10
Number of Spans: 1
Status: Open
Road: SR 4013
Figure 3.7. Bradford County #08-4013-0250-1496. Class #2: Overall Score (66.8/100).
Photo on left: NCHRP Report 514, an ex-ample of a T-beam suitable for FRP repairtechonology
Photo on right: Provided by PennDOT forbridge#08-4013-0250-1496
Note: Though this bridge scored low in the span andage category, this may be a good candidate bridge dueto the traffic volume. Also, the bridge shows similardamage to that illustrated in the NCHRP Report 514.This bridge scores high in Class #2 (score 50-70).
32

Details:
Span (ft): 32Ranking: 4/10
Year Built: 1921Ranking: 2/10
ADT: 1379Ranking: 5/10
ADTT: 81Ranking: 4/10
Visual Damage:Ranking: 10/10
Number of Spans: 1
Status: Open
Road: SR 1001
Figure 3.8. Union County #59-1001-0110-2058. Class #2: Overall Score (62.8/100).
Photo on left: NCHRP Report 514, anexample of a T-beam suitable for FRPrepair techonology
Photo on right: Provided by PennDOTfor bridge #59-1001-0110-2058
Note: This bridge scores moderately in all of the catergories except the visual category. In thevisual category, the bridge scores very high, because the damage shown is very similar to thatdescribed in the NCHRP Report 514. This bridge scores in the middle of the Class #3 range
33

Figure 3.9. Snyder County #54-0522-0090-1932. Class #2: Overall Score (65.4/100)
Details:
Span (ft): 55Ranking: 8/10
Year Built: 1929Ranking: 3/10
ADT: 4195Ranking: 8/10
ADTT: 299Ranking: 7/10
Visual Damage:Ranking: 6.67/10
Number of Spans: 2
Status: Open
Road: SR 522
Photo on left: NCHRP Report 514, an exampleof a T-beam suitable for FRP repair techonology.
Photo on right: Provided by PennDOT for bridge#54-0522-0090-1932
Note: Though this bridge carries a lot of traffic, andranks high in the span category, it is ranked into Class#2 because of the extent of the visual damage. Thisbridge would be suitable for repair by FRP technololgy.
34

Figure 3.10. Columbia County #19-3008-0100-0039. Class #3: Overall Score (39.9/100)
Details:
Span(ft): 23Ranking: 2/10
Year Built: 1933Ranking: 4/10
ADT: 265Ranking: 2/10
ADTT: 20Ranking: 1/10
Visual Damage:Ranking: 3.33/10
Number of Spans: 1
Status: Open
Road: SR 3008Photo on left: NCHRP Report 514, anexample of a T-beam suitable for FRP repairtechonology.
Photo on right: Provided by PennDOT forbridge #19-3008-0100-0039. Note: This bridge ranked low overall because of low traffic volume,
short span, and age. Also, the visual damage was not as severe as manyof the other bridges. This is an example of a bridge which may not be agood candidate for the FRP technology.
35

Figure 3.11. Tioga County #58-1002-0050-0000. Class #3: Overall Score (30.1/100).
Details:
Span (ft): 27Ranking: 3/10
Year Built: 1917Ranking: 1/10
ADT: 568Ranking: 4/10
ADTT: 57Ranking: 3/10
Visual Damage:Ranking: 3.33/10
Number of Spans: 1
Status: Open
Road: SR 1002Photo on left: NCHRP Report 514, anexample of a T-beam suitable for FRP repairtechonology.
Photo on right: Provided by PennDOT forbridge#58-1002-0050-0000
Note: This is a very old bridge which does not carrie much traffic. Also, the damage tothis bridge seems to be extensive. However, this damange does not seem to closelyresemble the damange described in NCHRP Report 514. Replacement of this bridgemay be a better alternative to the FRP technology.
36

Figure 3.12. Visual Damage Score 10/10.
Photo on left: Provided by PennDOT for bridge#08-4013-0250-1496
Photo on right: Provided by PennDOT for bridge#59-1001-0110-2058
Note: The photos provided show extensive damage tothe concrete T-beams. This type and extent of damage issuitable for FRP technology. Bridges with damage typeand severity similar to this received a score of 10 out of10 for visual damage.
37

Photo on left: Provided by PennDOT for bridge#19-0239-0060-0511
Photo on right: Provided by PennDOT for bridge#19-3008-0100-0039
Figure 3.13. Visual Damage Score 6.67/10.
Note: The damage level shown in these photosindicated that these bridges are moderate candidatesfor repair using the FRP technology. Bridges withdamage severity similar to these examples werescored 6.67 out of 10.
38

Photo on left: Provided by PennDOT for bridge#58-1002-0050-0000
Photo on right: Provided by PennDOT for bridge#56-0220-0530-0988
Figure 3.14. Visual Damage Score 3.33/10.
Note: Some of the photograps as shown aboveindicated low level of damage. Damage of this typemay be suited for repair by either FRP technology orcoventional methods, but these bridges are not likelycandidates for the FRP technology.
39

Figure 3.15. Visual Damage Score 0/10.
Photo on left: Provided by PennDOT for bridge#59-1003-0140-0921
Photo on right: Provided by PennDOT for bridge#59-0045-0440-1302
Note: Some of the photographs showed very little or nodamage. Bridges of this type were scored 0/10 in thevisual damage category, because these bridges in generalprobably do not require repair.
40

41
Chapter 4
Recommendations for Selecting Ideal Candidate Bridges
This chapter answers the posed question: “Which bridges are ideal candidates for
repair?” The PennDOT D-3 project is presented as an example to recommend a process
for the selection of candidate bridges that have the greatest potential for demonstrating
the benefits of surface applied FRP.
The selection of candidate bridges for FRP-repair can be based on the following two
aspects: (1) considerations for selection (4.1), and (2) selection for different levels of
repair efforts (4.2). Therefore, Section (4.3) suggests an educational program to allow
PennDOT D-3 to adopt and continue the use of FRP repairs, both with outside
contractors autonomously.
4.1 Considerations for Selection of Candidate Bridges
The considerations for selecting candidate bridges should include: (1) a rational
procedure for identifying suitable candidate bridges, (2) a preliminary analysis method
for performance and cost effectiveness, and (3) a detailed structural analysis and
implementation plan.
4.1.1 Suitable Candidates
The rating methodology presented and applied in Chapter 3 identifies the list of potential
candidate bridges from the general PennDOT D-3 inventory. In general, a significant
portion of the structures targeted for repair include the following approximate range of
characteristics:
• Age: Built between the 1920’s and 1960’s
• Span: Single span structures between 20 and 50 feet
• ADT: Any currently level
• ADTT: Any level with a large number of bridges carrying 1000 trucks per day
• Local Damage-Level 3 or Level 2

42
Based on the classification shown in Table 3.2, approximately half of the PennDOT D-3
T-Beam concrete bridge inventory scored 50% or greater, indicating that they can be
considered suitable candidates for FRP-repair technology. In the classification, 13 Prime
Candidate Class-1 bridges had a rating of 68% to 100%, and 44 Moderate Candidate
Class-2 bridges had a score ranging between 50% and 68%. The remaining 71 Low
Candidate Class-3 bridges scored between 0% and 50%. This indicates that about half of
the bridges are classified as being prime or likely candidates for FRP repair, and they can
be further inspected for visual condition assessments to select appropriate structures for
implementation of FRP repair.
Out of a total of 128, initially 61 bridges were identified as suitable candidates for FRP
repair, and out of these 16 were further selected for visual inspection. During the visual
inspection, a few of the structures in PennDOT D-3 inventory were immediately
considered to be better suited for replacement than for repair. The anticipated scope of
repair for all 128 bridges ranges from simple maintenance to possible replacement, and
includes the following scenarios:
1. General cleaning and maintenance
2. Simple patching
3. Patching and use of surface bonded FRP
4. Moderate rehabilitation including concrete chipping, forming and casting, plus the
use of surface bonded FRP
5. Extensive rehabilitation including chipping, forming and casting, with use of
surface bonded FRP
6. Complete replacement
In summary, the candidate bridges for FRP repair should be selected from those listed in
Appendix A either as Class 1 (Prime) or Class 2 (Moderate).
4.1.2 Preliminary Analysis
After a review of the bridges that were ranked either as Prime or Moderate candidates for
FRP-repair, a preliminary analysis of selected candidate bridges should be conducted.

43
The first and most fundamental consideration is the design loads. Current and future
anticipated loads need to be considered to verify design assumptions. The two primary
assumptions are:
• Loads are within the elastic range of the structure
• Existing section properties are known (area of steel, yield point of steel, concrete
strength and dimensions of the beam)
For a likely candidate bridge, a preliminary design can be performed to estimate the
quantities of required FRP. The preliminary design will also yield sufficient knowledge
of the scope of repair using conventional materials. As-built drawings, original design
sheets or further field surveys can be used to ascertain the initial data for analysis.
Ultimately, field surveys to determine the actual area of steel, in-situ concrete strength,
and knowledge of the damaged condition of the structure will be required for a detailed
analysis.
The overall cost of repair can be determined and a cost comparison with conventional
materials can be made. It is recommended that all factors be included in the cost
comparison. Factors including labor, equipment, cost of lane closures, economic impact
caused by detours, and future cost of replacement should be considered in addition to the
acquisition cost of FRP materials.
In summary, for a given bridge selected from the recommended list of Prime or Moderate
candidate bridges (Appendix A), a preliminary analysis should be performed. Also, this
preliminary assessment should include a cost-benefit analysis as presented in Chapter 5.
4.1.3 Detailed Analysis
After a candidate structure is identified for repair using surface bonded FRP, and
following a preliminary analysis, a detailed analysis of the structure should be conducted.
Currently there is no analysis or design standard in any AASHTO documents to
determine the type and amount of FRP required. In lieu of an AASHTO standard or
guide, it is recommended that the methodology presented by the American Concrete

44
Institute in 440.2R - Guide for the Design and Construction of Externally Bonded FRP
Systems for Strengthening Concrete Structures - be used as a basis for design.
This ACI document can guide the designer through the process of analyzing and detailing
surface bonded FRP. Some of the highlights include analysis of existing structural
conditions, analysis of section properties, computation and checks for applied loads,
computation and checks for allowable strain, and consideration of deflection for
serviceability.
One of the limitations of this approach is the lack of certainty of the actual existing
conditions of the structure. It is important to determine the failure mode that will control
the behavior of the repaired structural component. Three possible flexural failure modes
are as follows:
1. Crushing of concrete prior to yielding of the reinforcing steel 2. Yielding of tension reinforcing steel followed by rupture of FRP 3. Yielding of steel prior to crushing of concrete
The knowledge of the failure mode is important to ensure that the structure is within the
elastic range, that the behavior is ductile, and that full structural benefit of the FRP is
realized.
In summary, a detailed analysis is required for the effective implementation of FRP-
repair in a selected bridge project.
4.2 Selection of Candidate Bridges for Different Levels of Repair
Analysis, design and specification of the repair can be performed either by an outside
consultant/contractor, or in-house personnel. Depending on the overall scope of work, the
FRP-repair for candidate bridges may be defined at three levels: Repair Level-1 Major,
with all work contracted out; Repair Level-2 Moderate, with combined outside consultant
and in-house personnel; and Repair Level-3 Minor, with all work accomplished in-house.

45
This Section describes the three proposed levels of FRP-repair, and identifies
correspondingly suitable bridge examples from the recommended lists of Class 1 and
Class 2 bridges, given in Appendix A.
4.2.1 Major Candidate Bridges (Repair - Level 1)
The first level should address a candidate bridge requiring extensive repair. At this level
the engineering is performed by a consultant and the actual repair is contracted out
through competitive bid. An example of a bridge that can be addressed by this level of
repair is Bridge #41-0118-0230-0644, as show in Figure 4.1.
At this level all of the preparatory concrete work and application of the surface bonded
FRP would be performed per project specifications and construction drawings. It is
expected that the overall scope of work may include other pay items such as abutment
repair, bearing repair, and possibly expansion joint repair. While the application of the
FRP may represent a smaller portion of the overall project cost, the scale of the project
can offer sufficient opportunities for developing expertise with FRP technology.
Because of the extensive damage in such structures, as shown in this bridge, the use of
FRP for additional strengthening is possible, such as in areas deficient in shear or areas
that require confinement of reinforcing steel due to low cover or inadequate splice length.
A typical project at this scale, used as a prototype demonstration structure for gaining
experience with FRP technology, can include the following primary tasks: (1) field
assessment of the structure, (2) structural analysis and load testing, (3) evaluation of in-
situ material properties from field samples, (4) design of FRP repair and other work, (5)
repair implementation and evaluations, (6) testing of repaired structure, and (7)
supporting lab-scale studies, and (8) development of draft specifications and standard
drawings.
4.2.2 Moderate Candidate Bridges (Repair - Level-2)
The next level of repair should address a candidate bridge showing moderate level of
damage. A combination of work performed by in-house forces and some contracting

46
through specialty trades or engineering by a consultant is suggested. An example of a
structure that could be addressed by this level of repair is Bridge #59-0045-0310-2011, as
show in Figuree 4.2.
At this level most field activities can be accomplished by in-house forces. However,
because there may be a need for injecting cracks with either epoxy or urethane, or the
overall cost may exceed allocated state project limits, it may be necessary to advertise
portions of the project for competitive bids. Several possibilities could be explored, such
as: (1) retaining a consultant for the engineering portion and using in-house forces for
labor (possibly in phases); (2) performing the engineering in-house and contracting out
the specialty items (crack injection or application of the FRP), with in-house forces acting
as a general contractor; finally (3), performing the engineering in-house and contracting
out all of the field work.
At this level of repair, the client would realize the benefits of competitive bidding while
retaining overall design control and providing training opportunities.
4.2.3 Minor Candidate Bridges (Repair - Level 3)
The third level should be addressed for a candidate bridge with minor to moderate level
of damage. This level can be described as a trial or test program to evaluate the
implementation of repair techniques by in-house forces on a relatively small scale. A
structure that could be addressed by this level of repair is Bridge #41-0118-0020-1109, as
shown in Figure 4.3. In general a structure with moderate and localized damage is a
likely candidate for a trial program.
From a field assessment, the expected scope of work could include removing loose
concrete, cleaning existing reinforcing steel, measuring the current area of steel,
estimating the compressive strength of the concrete, forming and casting new concrete or
mortar to re-establish the beam section, then application of surface bonded FRP after
appropriate surface preparation. To expedite the project, final design to determine the
quantities of the FRP can be performed while preparatory work is being completed. At

47
this level the anticipated scope of work, although detailed, is small and it is realistic to
assume that the client’s forces could accomplish this using in-house engineering and
forces. Funding for this type of maintenance construction is realistically within the limits
of a state project account.
4.3 Suggested Implementation Strategy
The selection of candidate bridges should conform to the descending scale of FRP-repair
work complexity, from Major to Moderate to Minor. This approach offers great potential
for providing an efficient learning and training environment for in-house personnel, so
that eventually, a Minor FRP-repair work of a candidate bridge can be accomplished
entirely by in-house forces. Moreover, this approach provides an opportunity to develop
more specific design and construction guidelines, leading to training seminars for State
personnel.
4.4 Conclusions
This chapter answered the question: “Which bridges are ideal candidates for repair?” by
presenting recommendations for the selection of ideal candidate bridges from the
PennDOT D-3 inventory. Suitable characteristics for candidates have been presented and
discussed. Also, the scope of repairs for this inventory has been presented. It was found
that about 50 percent of bridges from the PennDOT D-3 inventory were suitable
candidates for repair. From this set of bridges, a preliminary and detailed analysis was
suggested to determine specific suitability.
From the characteristics classifications and repair-levels presented in Chapter 3, three
candidate bridges have been selected. It has been suggested that, to train state
employees, first the Repair - Level 1 (Major) project be performed. After this repair, a
more detailed cost-benefit analysis can be performed and PennDOT D-3 can continue
with more “hands-on” involvement on the Repair - Level 2 and 3 projects.

Figure 4.1. Major Candidate Bridge (Repair Level-1). Lycoming County #41-0118-0230-0644. Class #1: Overall Score (71.7/100).
Details:
Span (ft): 80Ranking: 10/10
Year Built: 1943Ranking: 7/10
ADT: 2641Ranking: 7/10
ADTT: 291Ranking: 7/10
Visual Damage:Ranking: 6.67/10
Number of Spans: 2
Status: Open
Road: SR 118
48

Details:
Span (ft): 30Ranking: 4/10
Year Built: 1938Ranking: 5/10
ADT: 10310Ranking: 10/10
ADTT: 648Ranking: 9/10
Visual Damage:Ranking: 10/10
Number of Spans: 1
Status: Open
Road: SR 45
Figure 4.2. Moderate Candidate Bridge (Repair Level- 2). Union County #59-0045-0310-2011. Class #1: Overall Score (84.8/100).
49

Details:
Span (ft): 31Ranking: 4/10
Year Built: 1930Ranking: 4/10
ADT: 5570Ranking: 9/10
ADTT: 408Ranking: 8/10
Visual Score:Ranking: 10/10
Number of Spans: 1
Status: Open
Road: SR 118
Figure 4.3. Minor Candidate Bridge (Repair Level-3). Lycoming County #41-0118-0020-1109. Class #2: Overall Score (66.4/100)
50

51
Chapter 5
Comparison of Methods Based on Costs & Construction for PennDOT D-3 Bridges
This chapter answers the question: “Is the FRP technology economically feasible and
competitive with the conventional repair method?” by investigating sample repair
scenarios for three bridges in the PennDOT-D3 inventory. These bridges correspond to
the examples suggested in Chapter 4 and include sample repairs from each of the three
repair levels.
First design assumptions are presented (5.1). Next examples of FRP repair for Repair-
Level 1, 2, and 3 (Repair-Examples 1, 2 and 3 respectively) are presented and compared
to traditional methods (5.2, 5.3 and 5.4 respectively). Section (5.5) provides an insight on
the “Learning Curve” Approach. Section (5.6) compares the two methods based on
construction and section (5.7) discusses traffic control issues for each method. Finally,
conclusions are presented in section (5.8).
5.1 Design Assumptions
Surface-Bonded FRP Technology:
From insight provided by PennDOT-D3, an approximate geometry for a standard
concrete T-Beam was used to estimate the amount of FRP to be used per linear foot of T-
Beam to be repair (along the beam). From this approximate geometry, a standard T-
Beam section was designed. Figure 5.1 is the standard T-Beam section for the design
assumptions.
Conventional Technique:
For repair using the conventional technique, an approximate geometry for a standard
concrete T-Beam (insight provided by PennDOT-D3) was used to estimate the amount of
concrete to be used per linear foot of T-Beam to be repaired (along the beam). From this
approximate geometry, a standard T-Beam section was designed. Figure 5.2 is the
standard T-Beam section for the design assumptions.

52
5.2 Repair-Example 1: Cost Comparison for Level 1 (Major) repair.
Bridge #41-0118-0230-0644 (Figure 5.3) was selected as a Repair-Level 1 because this
bridge shows extensive overall damage. This bridge has the following characteristics:
Total Span = 80 ft (two span); Year Built = 1943; Number of beams = 7; ADT/ADTT =
2600/300; Overall Classification = 71.7 - Class 1; Visual Rating = 2 (moderately
favorable for repair). Though this bridge was originally rated “2” in the visual category,
additional photographical evidence justifies high favorability for repair of this structure.
Because of the type and extent of damage, repair using the conventional method may not
be possible; hence the repair will be compared to replacement cost. The total span length
of this bridge is 80 feet and there are 7 beams. For complete repair, about 560 feet of
beam will be repaired using the FRP technology. Though not considered in the analysis,
the damaged center pier may also be a candidate for repair using FRP technology (Figure
5.4). For this example repair, only one design scenario will be considered and the “first-
cost” value will be used. This design and repair will require a significant endeavor and
will likely be contracted out completely. Next, design and cost assumptions for FRP
(5.2.1) and replacement (5.2.2), as well as a cost comparison (5.2.3) are presented for
Repair-Example 1.
5.2.1 Design and Cost Assumptions for Repair-Example 1
Design Assumptions for FRP Repair:
From designs and drawings provided by PennDOT-D3, an approximate geometry for a
standard concrete T-Beam was used to estimate the amount of FRP to be used per linear
foot of T-Beam to be repair (along the beam). From this approximate geometry, a
standard T-Beam section was designed (for details, See 5.1).
Assuming two layers of FRP, and the standard design assumptions 2 x (16 in + 2x4 in), a
total of 48-in or 4 ft of FRP per unit length of beam (ft) is required. For this example,

53
560 feet of beam is to be repaired using FRP technology. Multiplying 560 feet of beam
by 4 ft per unit thickness yields a required cross-sectional area of FRP to be 2240 ft2.
Cost Assumptions for FRP repair:
Using information provided by Mr. Steve Tysl, a consultant from Proto Composites, the
cost estimate for a single repair of this bridge using the FRP technology is about $40,000
“first cost”. Details of this estimate are as follows.
Using the design assumptions, 2240 square feet of FRP will be required for repairs. FRP
is about $6.50-8.00 per square foot. For this estimate the cost of FRP is assumed to be $7
per square foot. Multiplying the amount of material by the material cost yields $15,700.
To account for the cost of patching mortar and labor (for most projects this includes
mobilization, small tools, and incidentals) as well as designing and contracting fees, an
increase of 2.5 times will be assumed. By multiplying 2.5 by $15,700, we estimate about
$40,000 for the repair cost. This cost estimate does not include cost of lane closure.
A parallel study from the University of Missouri-Rolla (URM) is in the process of
developing a similar cost analysis. Due to the confidentiality of pricing details shared by
manufacturers, no direct information can officially be provided. However, information
from the ongoing study at UMR supports the overall cost estimate given in this chapter.
It should be noted that none of the costs described can be generalized or estimated with a
great level of precision. Because the application of the FRP technologies to bridges is in
its introductory phase of the product life cycle, practices and related costs vary
significantly. Also, bidding prices may vary.
5.2.2 Cost Assumptions for Replacement
Replacement of this bridge would cost an estimated $1.1 million “first cost”. Details of
this cost are as follows.

54
An Engineer from PennDOT-D3 quoted the cost of a new bridge to be about $250-300
per square foot of bridge. In order to account for removal of the existing structure, an
assumed cost of $275 per square foot will be used. This new bridge will have a span
length of 80 feet and will be 50 feet wide. Multiplying 80 feet by 50 feet, the total bridge
area is 4000 square feet. Multiplying this by $275 per square foot yields an estimate of
about $1.1 million.
5.2.3 Comparison of Costs for Repair-Example 1
Savings of FRP repair over replacement based on first cost is significant. Though the
life-span of FRP repair is generally less than the life-span of a new structure, this repair
would be a good example to illustrate the implementation of the FRP technology.
5.3 Repair-Example 2: Cost comparison for Level 2 (Moderate) repair.
Bridge #59-0045-0310-2011 (Figure 5.5) has the following overall characteristics: Span
= 30 ft, width = 43.0 ft; Year built = 1938; Number of beams = 9 (exterior beams = 20-in
x 15.5-in, interior beams = 15-in x 15.25-in); Slab thickness = 8.5-in; ADT/ADTT =
10,300/650; Overall Classification = 84.8-Class 1;Visual Rating = 3 (most favorable for
repair). See Figure 5.6 for a cross-sectional diagram of this bridge. This example bridge
has 3 damaged beams. The extent of damage on one beam is the entire length (30 feet).
Another beam is damaged in two places for about 4 feet and about 5 feet in lengths. The
third beam is damaged for about 15 feet. Thus, the total length of beam to be repaired is
about 54 feet. The damage lengths are estimates based on photos and actual inspection of
the bridge. The application of the composites will likely require more length of beam.
Due to assumed lengths and unknown underlying conditions, the repair length will be
increased by 25 percent, or a total repair length of about 60 feet.
Next, a cost-benefit “future-worth” comparison (5.3.1) is presented for Repair Example
2. This includes two design scenarios (5.3.2), a design and cost estimate (5.3.3), a
present worth calculation for one of the scenarios (5.3.4), and a cost comparison for both
scenarios (5.3.5).

55
5.3.1 Cost-Benefit Comparison for Repair-Example 2
According to Nystrom et al. (2003): “First cost is the simplest and most frequently used
analysis, and includes only the initial capital costs. It does not attempt to place a dollar
value on future expenditures. This format of analysis is suitable for comparing
alternatives with equivalent life expectancy, performance and maintenance. If significant
differences are expected in one of these factors, first cost analysis will not give a true
comparison of cost effectiveness of the various alternatives. Life cycle cost analysis is
similar to first cost analysis except that future costs are also considered. Typically, future
costs include maintenance, future rehabilitation expenditures, and probable replacement
costs. In life cycle cost analysis, future costs must be discounted to present worth before
they are combined with present (immediate) costs.”
When evaluating first-cost in relation to traditional methods, bonded FRP technology can
be more expensive, but the key advantages of FRP repair are often overlooked in relation
to their high material and manufacturing costs. FRP repairs can be cost-effective in the
long run if their use leads to fewer re-repairs (Davalos, Barth, Ray, et al. 2005). A direct
comparison of the unit price basis may not be appropriate, but rather an overall project
and life-cycle cost. A present-worth projection analysis will be conducted on the
example bridge with estimates for material cost, installation, traffic detour cost and future
maintenance. This analysis will be based on two scenarios of bridge maintenance, as
discussed in the next section.
5.3.2 Repair Scenarios Repair-Example 2
These scenarios will analyze the future-worth of both the conventional method and the
surface-bonded FRP technology. The scenarios are as follows:

56
Scenario 1 (Design Life = 30 years) FRP Repair Conventional Repair 30 year design life 15 year design life, repair twice Replace or re-repair after 30 years Replace or re-repair after 30 years
Scenario 2 (Design Life = 30 years) FRP Repair Conventional Repair 30 year design life 20 year design life Replace or re-repair after 30 years Allow bridge to degrade, post bridge Replace or re-repair after 30 years
It should be noted that the 30 year design life for FRP technology is a conservative
estimate. Sources have quoted a design life of FRP repairs up to 50 years.
5.3.3 Design and Cost Estimate for Repair-Example 2
For Bridge # 59-0045-0310-2011, 60 feet of repair will be assumed. The cost of FRP
repair and the conventional repair are both about $3400 “first cost”. Details of this
calculation are as presented next.
Design Assumptions for FRP repair:
From designs and drawings provided by PennDOT-D3, an approximate geometry for a
standard concrete T-Beam (5.1) was used to estimate the amount of FRP to be used per
linear foot of T-Beam to be repair (along the beam). From this approximate geometry, a
standard T-Beam section was designed.
Assuming two layers of FRP, and the standard design assumptions 2 x (16 in + 2x4 in), a
total of 48-in or 4 ft of FRP per unit length of beam (ft) is required. For this example, 60
feet of beam is to be repaired using FRP technology. Multiplying 60 feet of beam by 4 ft
per unit length yields a required cross-sectional area of FRP to be 240 ft2.
Cost Assumptions for FRP repair:
Using information provided by Mr. Steve Tysl, a consultant from Proto Composites, the
cost estimate for a single repair of this example using the FRP technology is about $3400
“first cost.” Details of this estimate are given next.

57
Using the design assumptions (5.1), 240 square feet of FRP will be required for repairs.
FRP is about $6.50-8.00 per square foot. For this estimate the cost of FRP is assumed to
be $7 per square foot. Multiplying the amount of material by the unit cost yields a total
of $1680. To account for the cost of patching mortar and labor (for most projects this
includes mobilization, small tools, and incidentals), an increase of 2 times will be
assumed. Multiplying 1680 by two, we obtain $3360 or about $3400 for the repair. This
cost estimate does not include cost of lane closure, but does include labor and other costs
associated with a contracted project.
A parallel study from the University of Missouri-Rolla (URM) is in the process of
developing a similar cost analysis. Due to the confidentiality of pricing details shared by
manufacturers, no direct information can officially be provided. However, information
from the ongoing study at UMR supports the overall cost estimate given in this chapter.
It should be noted that none of the costs described can be generalized or estimated with a
great level of precision. Because the application of the FRP technologies to bridges is in
its introductory phase of the product life cycle, practices and related costs vary
significantly.
Design Assumptions for Conventional repair:
With the assumed dimension from (5.1), a total cross-sectional area of 160 in2 or 1.11 ft2
per unit length of beam (ft) is required. A length of 60 ft of T-beam is to be repaired for
this example. Multiplying 60 ft by 1.11 ft2 yields a total volume of concrete of about 70
ft3 for the repair.
Cost Assumptions for Conventional Repair:
Using information provide by PennDOT-D3, the cost estimate for a single repair of the
example bridge is about $3400 “first cost.” Details of this estimate are as follows.

58
Using the designs assumptions, about 70 ft3 of concrete will be required for repairs. A
State Engineer from PennDOT-D3 has estimated the conventional repairs to cost $22-30
per ft3 of concrete in place for materials and construction, and an additional $25 per ft3 for
labor. Assuming a price of $50 per ft3 of concrete and multiplying the amount of
material by the material cost yields an estimate of about $3400. This does not include
cost of detours or traffic control.
5.3.4 Present Worth of Scenario 1 for Repair-Example 2
In order to compare initial and life-cycle costs for the conventional and FRP techniques, a
present worth analysis will be conducted for Scenario 1, which includes a re-repair at n =
15 years. An interest rate of 5% is used, with a future cost of $3400 for the re-repairs.
The present worth formula from (Au T. and Au T.P., 1993) is as follows:
P = F(1+i)-n (1)
Where: P = Present Worth (dollars) i = interest rate (decimal) n = number of periods (years)
Using the above equation (1), the present worth of a future repair ($3400) is $1635 or
about $1600. Adding this cost to the initial cost, the present worth cost of Scenario 1 is
$5000 ($1600 + $3400) for the conventional method. A present worth analysis does not
apply to Scenario 2 because it does not include a future re-repair.
5.3.5 Cost Comparison for Scenarios 1 and 2 for Repair-Example 2
From present worth calculations, design assumptions, and cost assumptions, a
comparison of costs for Scenarios 1 and 2 is as follows: For both Scenarios, the cost of
the FRP repair is $3400 for an assumed 30 year design life. For Scenario 1, the present
worth cost of the conventional repair is $5000. For Scenario 2, the cost of the repair
using the conventional technique is $3400. Figure 5.7 shows a cost comparison between
methods for both Scenarios 1 and 2. The estimates for the FRP technology includes

59
contracting costs (profit, overhead, etc), however once the FRP technology can be
implemented by district forces, costs may decrease significantly.
5.4 Repair-Example 3: Cost Comparison for a Level 3 (Minor) repair.
From the inventory, Bridge # 41-0118-0020-1109, which shows extensive but localized
damage (one beam only), was selected as a Repair-Level 3 project (Fig. 5.8). This bridge
has the following characteristics: Total Span = 31 ft; Year Built = 1930; Number of
beams = 7; ADT/ADTT = 5600/410; Overall Classification = 79.8 - Class 1; Visual
Rating = 3 (high desire for repair).
This bridge is relatively small and has experienced localized damage typical of the
PennDOT-D3 inventory (extensive localized damage on exterior beam(s) only.) This
bridge is a good candidate for repair using a trained, in-house state crew. Once trained
(such as by participating in the implementation of repair of Examples 1 or 2), state “in-
house” forces can repair this and many other typical bridges in the inventory using FRP
technology. A generalized “first-cost” estimate is provided in this chapter using design
and cost assumptions from (5.1). Next, a design and cost estimate (5.4.1) is presented for
this example.
5.4.1 Design and Cost Estimate for Repair-Example 3
For Bridge # 41-0118-0020-1109, 30 feet of repair will be assumed. The cost of FRP
repair is about $1700, and the cost of conventional repair is about $1800. Details of this
calculation are presented next.
Design Assumptions for Surface-Bonded FRP Technology:
Assuming two layers of FRP, and the standard design assumptions (5.1), 2 x (16 in + 2x4
in), a total of 48-in or 4 ft of FRP per unit length of beam (ft) is required. For this
example, 30 feet of beam is to be repaired using FRP technology. Multiplying 30 feet of
beam by 4 ft per unit length yields a required cross-sectional area of FRP to be 120 ft2.

60
Cost Assumptions for FRP repair:
Using information provided by Mr. Steve Tysl, a consultant from Proto Composites, the
cost estimate for a single repair of the example bridge using the FRP technology is about
$1700 “first cost.” Details of this estimate are given next.
Using the design assumptions (5.1), 120 square feet of FRP will be required for repairs.
FRP is about $6.50-8.00 per square foot. For this estimate the cost of FRP is assumed to
be $7 per square foot. Multiplying the amount of material by the unit cost yields a total
of $840. To account for the cost of patching mortar and labor (for most projects this
includes mobilization, small tools, and incidentals), an increase of 2 times will be
assumed. Multiplying $840 by two yields $1680 or about $1700 for the repair. This cost
estimate does not include cost of lane closure, but does include labor and other costs
associated with a contracted project.
A parallel study from the University of Missouri-Rolla (URM) is in the process of
developing a similar cost analysis. Due to the confidentiality of pricing details shared by
manufacturers, no direct information can officially be provided. However, information
from the ongoing study at UMR supports the overall cost estimate given in this chapter.
It should be noted that none of the costs described can be generalized or estimated with a
great level of precision. Because the application of the FRP technologies to bridges is in
its introductory phase of the product life cycle, practices and related costs vary
significantly.
Design Assumptions for Conventional Technique:
Using assumed dimensions (5.1), a total cross-sectional area of 160 in2 or 1.11 ft2 per unit
length of beam (ft) is required. For the sample bridge, 30 ft of T-beam is to be repaired.
Multiplying 30 ft by 1.11 ft2 yields a total volume of concrete of about 35 ft3 for the
repaired.

61
Cost Assumptions for Conventional Repair:
Using information provide by PennDOT-D3, the cost estimate for a single repair of this
example is about $1800 “first cost.” Details of this estimate are as follows.
Using the design assumptions, about 35 ft3 of concrete will be required for repairs. A
State Engineer from PennDOT-D3 has estimated the conventional repairs to cost $22-30
per ft3 of concrete in place for materials and construction, and an additional $25 per ft3 for
labor. Assuming a cost of $50 per ft3 of concrete and multiplying the amount of material
by the material cost yields a cost of about $1800. This does not include cost of detours or
traffic control.
5.5 Learning Curve Approach
There are arguments that initial costs of new technologies decrease with time, as their use
become more extensive and accepted. According to Xanthakos (1995), “Bridges that use
FRP are expected to have higher initial costs than traditional reinforced concrete bridges,
due to high cost of fiber and resins. However, this initial cost will decrease as more
bridges are repaired according to the Learning Curve theory. The Learning Curve theory
predicts that, as experience builds up, the cost will decrease in an exponential manner.
Typical costs start high, but drop steeply when methods and materials become more cost
effective as the product matures (Figure 5.9). Over time, the large inefficiencies are
removed from the process and the costs stabilize.”
5.6 Comparison of Construction Methods
For both repairing methods, the initial surface preparation is similar. However, due to the
importance of bonding with FRP, quality control for surface preparation is stricter. The
two repair methods are quite different after the initial surface preparation. Figures 5.10
and 5.11 show sample Gantt charts for repair of a typical 3 beam system (Repair-
Example 2, Section 5.3) using both conventional and the FRP technologies respectively.
Microsoft Project, which is a project-management software, allows the user to input
tasks, task durations, and task dependencies. This software was used to produce general

62
Gantt charts, comparing construction processes for both the conventional method and the
FRP technology.
These charts show an overview of the construction tasks, task dependencies, as well as
the critical path (shown in red). These charts are provided to illustrate the general
construction process of the conventional and FRP methods. Also, Figures 5.10, and 5.11
illustrate one key advantage of the FRP technology: traffic maintenance (bridge closure)
is dependant on cure time for the conventional repair and is a critical path. However,
traffic maintenance (lane closure) is not a critical path for the surface-bonded FRP
technology. During the application of the FRP technology one lane of the bridge can
remain open resulting in less traffic delay. Also, using FRP, this bridge is opened 8 days
sooner. The economic effect of this is shown in the next section.
5.7 Detour-Driving Mileage Costs for Repair-Example 2
A key advantage of the FRP technology is that, for a typical Repair Level-2, this method
allows opening the bridge about 8 days sooner than conventional repair (see Figures 5.10
and 5.11). Also, during construction using the FRP technology, one lane may remain
open to traffic. Because of high traffic volumes on this bridge, a detour-driving cost
analysis was performed. Using information provided by PennDOT-D3, the software
package Microsoft Streets and Trips, and maps provided by PennDOT-D3, a detour
scenario was created. Figures 5.12 and 5.13 show the original route and the shortest
detour.
Microsoft Streets and Trips is a general driving and distance mapping program, which
was used to estimate driving distances for the detour scenario presented in this chapter.
The un-detoured length of highway is 600 yards or 0.35 miles. The proposed detour is
1.5 miles, with a difference of 1.15 miles per vehicle. From information provided by
PennDOT-D3, the ADT plus ADTT for this bridge is 10,950 (10,300 ADT, and 650
ADTT), resulting in a total of about 12,600 vehicle miles per day. Using the typical IRS
rate of $0.485 per mile, this cost is about $6000 per day.
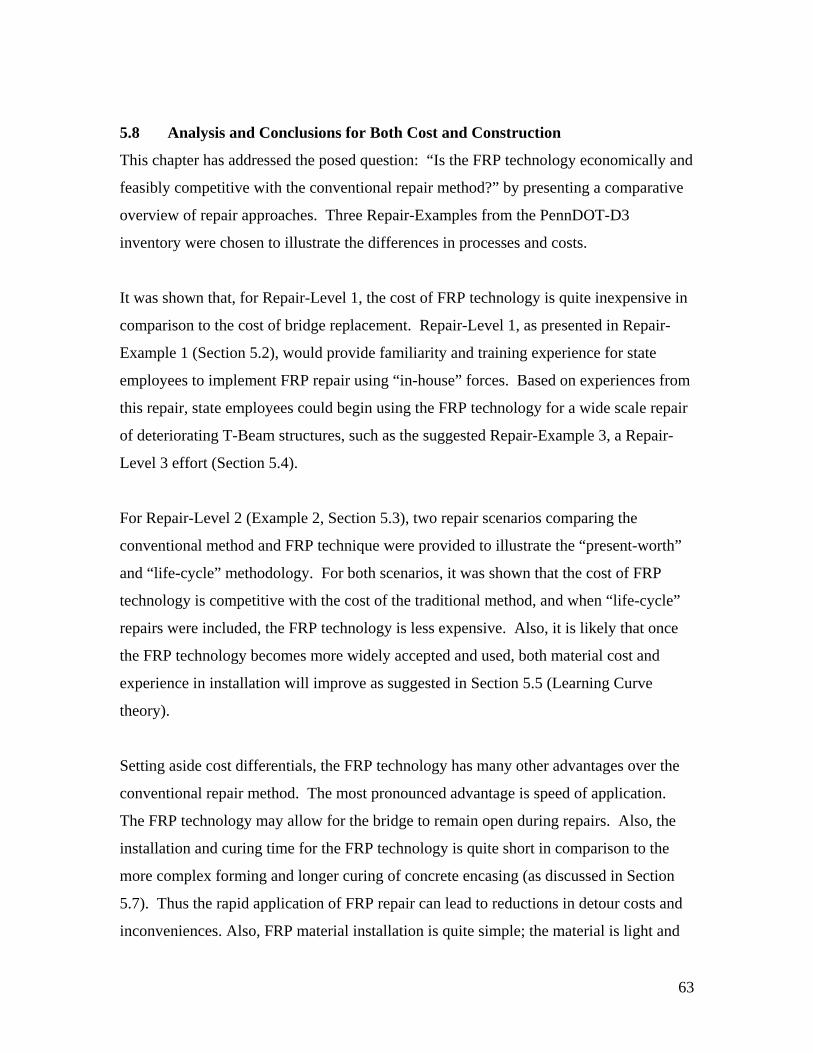
63
5.8 Analysis and Conclusions for Both Cost and Construction
This chapter has addressed the posed question: “Is the FRP technology economically and
feasibly competitive with the conventional repair method?” by presenting a comparative
overview of repair approaches. Three Repair-Examples from the PennDOT-D3
inventory were chosen to illustrate the differences in processes and costs.
It was shown that, for Repair-Level 1, the cost of FRP technology is quite inexpensive in
comparison to the cost of bridge replacement. Repair-Level 1, as presented in Repair-
Example 1 (Section 5.2), would provide familiarity and training experience for state
employees to implement FRP repair using “in-house” forces. Based on experiences from
this repair, state employees could begin using the FRP technology for a wide scale repair
of deteriorating T-Beam structures, such as the suggested Repair-Example 3, a Repair-
Level 3 effort (Section 5.4).
For Repair-Level 2 (Example 2, Section 5.3), two repair scenarios comparing the
conventional method and FRP technique were provided to illustrate the “present-worth”
and “life-cycle” methodology. For both scenarios, it was shown that the cost of FRP
technology is competitive with the cost of the traditional method, and when “life-cycle”
repairs were included, the FRP technology is less expensive. Also, it is likely that once
the FRP technology becomes more widely accepted and used, both material cost and
experience in installation will improve as suggested in Section 5.5 (Learning Curve
theory).
Setting aside cost differentials, the FRP technology has many other advantages over the
conventional repair method. The most pronounced advantage is speed of application.
The FRP technology may allow for the bridge to remain open during repairs. Also, the
installation and curing time for the FRP technology is quite short in comparison to the
more complex forming and longer curing of concrete encasing (as discussed in Section
5.7). Thus the rapid application of FRP repair can lead to reductions in detour costs and
inconveniences. Also, FRP material installation is quite simple; the material is light and

64
can be installed using hand tools. There is a high likelihood that, once trained, the
technology can be applied by state employees. Though gains in structural strength may
not be a concern for rehabilitation, bridges repaired using the FRP technology will
experience increases in strength and therefore have higher capacities. Since the costs of
the FRP technology included contracting fees (profit, overhead, etc.), the application of
the FRP technology may become significantly less expensive once this repair is
performed exclusively by state “in-house” forces.
It has been shown that the FRP technology is being applied and working satisfactorily in
several state DOTs, such as Missouri. Repairs using this technique are easier and faster
to implement. Also, these repairs tend to be more durable than those using conventional
techniques, allowing for less frequent re-repairs.

65
Figure 5.1. Standard T-Beam Section for Design Assumptions for the FRP Repair.
Figure 5.2. Standard T-Beam Section for Design Assumptions for the Conventional
Repair.

66
Figure 5.3. Bridge #41-0118-0230-0644, PennDOT-D3 Inventory.
Figure 5.4. Photographical Indication of Damage to the Pier of Repair-Example 1.

67
Figure 5.5. Bridge #59-0045-0310-2011.
Figure 5.6. A Cross-Sectional Diagram of the Bridge #59-0045-0310-2011, Provided by
PennDOT-D3.
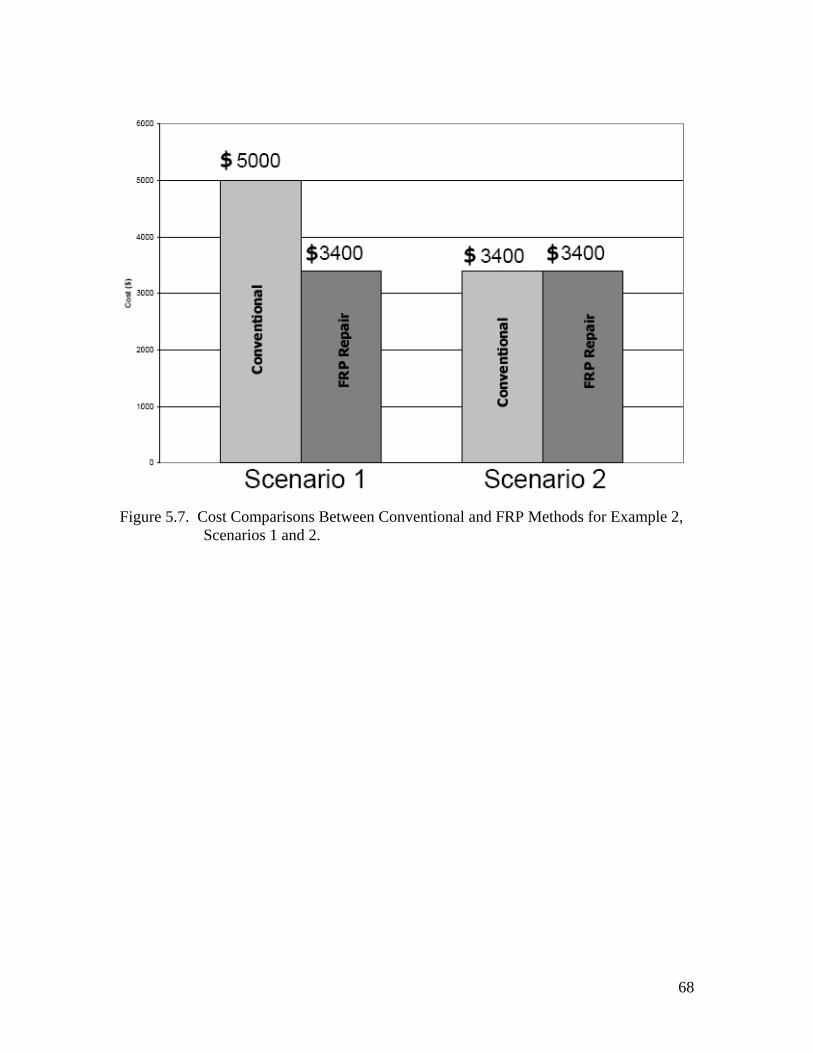
68
Figure 5.7. Cost Comparisons Between Conventional and FRP Methods for Example 2,
Scenarios 1 and 2.

69
Figure 5.8. Bridge #41-0118-0020-1109.

70
Figure 5.9. Typical Learning Curve (Xanthakos, 1995)
Figure 5.10. Gantt Chart for Conventional Repair (obtained with Microsoft Project).
Figure 5.11. Gantt Chart for Surface-Bonded FRP Technology (obtained with Microsoft
Project).

71
Figure 5.12. Open Traffic Plans for Example Bridge 2 (distance = 600 yards).
Figure 5.13. Proposed Detour Plan for Example Bridge 2 (distance = 1.5 miles).

72
Chapter 6
Recommendations for Implementation
This Chapter addresses the question: “What are the implementation steps for FRP repair
of the selected bridge(s)?” by discussing alternative approaches for adoption (Section
6.1); presenting Phase 2 of the PennDOT-D3 Project as an example (Section 6.2); and
showing three other repair examples (Section 6.3). Conclusions are presented in Section
(6.4).
6.1 Various Approaches to Implementation
Once FRP repair has been chosen, several implementation methods can be practiced.
Because this technology is still in its infancy, outside consulting is strongly
recommended. A good approach is to engage a local University. This will promote
education and further development of the technology. A second approach is to contact a
materials supplier. FRP suppliers generally are specialized in this technology and can
provide assistance from the classification stage to design, all the way through
construction. An example of this is Fyfe Co: “The Fyfe Company staff of in-house
engineers, material specialists and installation technicians has the combined expertise that
comes with over a decade of experience and thousands of completed projects in every
region of the world. Our engineers are ready to assist you, at no cost, with advanced
composite system information” (Fyfe Co. LLC.) The best approach may to be to engage
a collaboration between both a University and a supplier. This will not only promote
education, but allow for an intimate involvement of a contractor from the start of the
project to completion.
6.2 PennDOT-D3 Implementation This Section describes the proposed steps of implementation to be performed by
PennDOT D-3 with West Virginia University as a consultant. Bridges in PennDOT D-
3’s inventory have been classification and sample bridges have been presented. Phase 2

73
will begin tentatively in Summer/Fall 2006. The implementation may include, but not be
limited to:
• Sampling and testing to determine quality of substrate
• Developing a plan for repair (Example: see section 6.3.1)
• Designing of the FRP
• Checking of failure modes (Example: see section 6.3.1)
• Application of the FRP (Example: see section 4)
• Load testing before and after application (Example: see section 6.3.2)
• Long-term monitoring (Example: see section 6.3.2)
• Cost-benefit analysis after implementation (Example: see section 6.3.3)
• Evaluation of technology as a replacement for conventional methods
6.3 Other Example of FRP Repair
This Section provides examples of the implementation procedures presented in 6.2.
6.3.1 Castlewood Canyon Arch Bridge.
Fafach, et al. (2004) investigates the repair of the Castlewood Canyon Arch Bridge
Retrofit (Figure 6.1). This was performed in summer 2003 by the Colorado Department
of Transportation (CDOT) in conjunction with Peter Milligan of Fyfe Co., and the
University of Colorado-Boulder. This project represents a wide-scale FRP rehabilitation
project. Typical damage to this bridge is shown in Figure 6.2. “The arches were repaired
and strengthened with Fiberwrap, an FRP product manufactured by Fyfe Co. The plan
for repair was as follows:
1) Loose materials and debris were removed from the surfaces and from around
the reinforcing. 2) Exposed reinforcing bars were sandblasted clean from rust. 3) Penetrating corrosion inhibitor was applied to the surface of concrete arches
and struts to address hidden damage.

74
4) Leadline CFRP rods manufactured by Mitsubishi were anchored into the footings with epoxy around the bases of the arches to strengthen the arch-foundation connection.
5) The surfaces of the arches were finished to the original surfaces using hand and
machine applied mortar. Cracks were sealed using epoxy injection. 6) New pedestals were constructed for new spandrel columns. 7) Fiberwrap, an externally bonded CFRP, was applied to arch ribs to confine
concrete and to reinforce and strengthen the arch. 8) The arches were then painted to appear like concrete. (Fafach, et al. 2004)
Fafach, et al. (2004) continues with the evaluation and strength testing of scale models. It
was found (using scale test specimens) that during failure, the FRP sheets first de-bonded
from the concrete substrate. Next, due to stress concentrations, the FRP sheets rupture.
This is the intended failure mode for reinforced concrete members (tension zone yielding
instead of concrete crushing). Further details of this load test can be found in Fafach et
al. (2004).
A similar analysis and sample testing is suggested for any failure critical member
retrofitted with FRP.
6.3.2 Application and In-Service Evaluation of FRP Repair
The following two sources: (Hag-Elsafi, Alampalli, and Kunin, 2001) and (Hag-Elsafi,
Alampalli, and Kunin, 2003) investigate an FRP repair in New York. These sources
discuss the repair and load testing of a Reinforced Concrete T-Beam bridge in Rensselaer
County, New York. The geometry of these bridges is similar to that of the PennDOT D-3
inventory: short-span, older bridges which have an average length to width ratio
approximately equal to 1. Damage to this bridge is similar to a local-damage Level-2
PennDOT bridge. The New York State Department of Transportation (NYSDOT)
elected to rehabilitate the structure using the FRP method. The entire project was
implemented between August-November 1999. Figure 6.3 shows photos of the FRP
application. The work cited in these sources was to load test the bridge before and after
application of FRP and to monitor the quality of the FRP-substrate bond.

75
In (Hag-Elsafi, Alampalli, Kunin, and 2001), using various loadings, and strain gauges, it
was determined that “after installation of laminates, main rebar stresses were moderately
reduced, concrete stresses (flexural and shear) moderately increased, and transverse live-
load distribution to the beams slightly improved under service loads. Various similar
studies have concluded significant increase in ultimate capacities of concrete members
strengthened using FRP laminates.”
In (Hag-Elsafi, Alampalli, and Kunin, 2003), the same bridge repair described in (Hag-
Elsafi, Alampalli, and Kunin, 2001) was evaluated two years later. This evaluation
included NDE/NDT techniques and load tests to monitor and assess the effectiveness of
the FRP-substrate bond. “The 2001 load test indicated that recorded strains were
generally lower than those measured during the 1999 test. The results also indicated that
the quality of the bond between the FRP laminates and concrete and effectiveness of the
retrofit system have not changed after two years in service. Thermographic imaging
using an infrared camera provided images which supported this conclusion.”
6.3.3 Strengthening of a Bridge Cap-Beam using FRP
Hag-Elsafi, Lund, and Alampalli, (2002) investigated the strengthening of the cap-beam
of Pier 3 of East Church Street Bridge in Elmira, New York using FRP (see Figure 6.4).
This source analyzed this repair and discussed cost-benefit compared to conventional
repair. Using FRP as shear reinforcement, it was found that the FRP sheets were
effective in reducing live load stresses in the cap-beam. “Compared to conventional
methods, the FRP retrofit system used in this project proved to be a cost-effective
solution ($18,000 compared to about $150,000). The FRP system was relatively easy to
install and caused minimal interruption to traffic. These are important features, which
make FRP an attractive alternative.

76
6.4 Conclusions
Several recommendations for implementation were presented in this chapter. However, a
collaboration between a University and a materials supplier is suggested to both promote
education and include industry and research views throughout the project. A proposed
implementation procedure for the PennDOT D-3 project was presented, and examples of
the suggested steps were illustrated using repairs from various sources.

77
Figure 6.1. Castlewood Canyon Arch Bridge FRP Repair. (ASCE Website)

78
Figure 6.2. Typical Damage to the Castlewood Canyon Arch Bridge. (Fafach, et al.,
2004)

79
Figure 6.3. FRP repair described by (Hag-Elsafi, Alampalli, Kunin, 2001) and (Hag-
Elsafi, Alampallil, Kunin, 2003).
Figure 6.4. Damaged Beam-Cap repaired described by (Hag-Elsafi, Lund, Alampalli,
2002)

80
Chapter 7
Conclusions and Recommendations
This thesis has presented a component of an overall project performed for PennDOT D-3
by a research team at West Virginia University. The interest of PennDOT D-3 was to
investigate the practical and economic feasibility of FRP repair, in relation to
conventional methods.
The scope of this thesis included: (1) An overview of the conventional repair method
employed by PennDOT D-3 and FRP repair methods (Chapter 2); (2) Classification of
PennDOT D-3 bridges based on both characteristics and levels of damage, as well as a
prescription for general classifications for any inventory (Chapter 3); (3) Suggested steps
for the selection of ideal candidate bridges (Chapter 4); (4) A cost-benefit and
construction comparison between both the conventional and FRP repair methods
(Chapter 5); and (5) Suggested steps for implementation (Chapter 6).
Detailed conclusions have been given in each Chapter. In this Chapter, brief answers to
the questions posed in Chapter 1 are presented (7.1), and recommendations for future
work are given (7.2).
7.1 Concluding Remarks
This Section answers the six questions posed in Chapter 1.
1. “Is FRP a valid repair method for bridges in the PennDOT D-3 inventory?”
It is apparent from Chapter 2 that the FRP method is indeed applicable to the
PennDOT D-3 inventory. An example specification from a materials provider
and a sample repair from MODOT both illustrate repair with FRP for bridges
which are similar to those in the PennDOT D-3 inventory.

81
2. “Which bridges are suitable and favorable for repair using FRP?”
Chapter 3 proposes a set of classifications to determine which bridges in the
PennDOT D-3 are suitable and favorable for FRP repair. It was found that about
50 percent of the 128 bridges in the PennDOT D-3 are applicable and favorable
for FRP repair.
3. “Which bridges are ideal candidates for a trial repair program?”
Chapter 3 classifies bridges from the PennDOT D-3 inventory into three classes
for favorability of repair: Class 1 (Prime), Class 2 (Moderate) and Class 3 (Low).
In Chapter 4, using bridges from the Class 1 (Prime) category, 3 candidates are
chosen from each Repair-Level (also defined in Chapter 3). A repair scheme is
suggested, proposing, first, a Repair-Level 1 (major) project that will provide a
training experience for the PennDOT D-3 inventory. Once trained, state
employees can continue with more “hands-on” involvement in Repair-Level 2
(moderate) and 3 (minor) projects.
4. “Is the FRP technology economically feasible and competitive with the
conventional repair method?”
Chapter 5 presented three examples to show that FRP is a cost-effective
alternative to conventional repair methods and replacement. Also, FRP is still a
new material. Once FRP has been adopted for wide-scale applications, costs may
be reduced significantly.
5. “What are the implementation steps for FRP repair of the selected bridge(s)?”
Though it is still a “new” and “innovative” material, FRP has been implemented
in many projects. Chapter 7 discussed various steps of implementation for FRP
repair and suggested an implementation plan for the PennDOT D-3 Project.
Several examples have also been presented to demonstrate these steps.

82
7.2 Recommendations for Future Work
Now that the PennDOT D-3 inventory has been classified and candidate bridges have
been suggested. The next step is to implement the repair procedure. This will range from
materials testing, to design of FRP, repair implementation, and finally monitoring. In
order to determine failure modes for the PennDOT inventory, testing of scale models is
suggested. Also, load rating before and after the repair is suggested to determine the
overall effect of the FRP retrofit. A cost-benefit analysis is suggested after the repair to
determine the feasibility of a wide-scale repair compared to conventional methods.
Finally, long-term monitoring is suggested to evaluate the FRP-substrate bond.

83
Reference
American Society of Civil Engineers (ACSE)
http://sections.asce.org/colorado/images/castlewood.jpg
Au T., and Au T. P. “Engineering Economics for Capital Investment Analysis.” Allyn
and Bacon, Inc: 1993.
Davalos J.F., Lin C., Ray I., and Brayack D. “Applications of Externally Bonded
Composites for Concrete Repair and Rehabilitation.” American Society for Composites,
20th Annual Technical Conference. September 7-9, 2005. Drexel University,
Philadelphia, Pa.
Davalos, J.F., Barth, K.E., Ray, I., Lin, C, Brayack, D.A., Matzzie, D., and Tysl, S.
“District 3-0 Investigation of Fiber-Wrap Technology for Bridge Repair and
Rehabilitation (Phase-I).” August 25th, 2005.
Fafach, D., Shing, B., Chang, S., and Xi, Y. “Evaluation of the FRP-Retrofitted Arches in
the Castlewood Canyon Bridge.” Report No. CDOT-DTD-R-2005-01. Department of
Transportation Research, December 2004.
Fyfe CO LLC. “http://www.fyfeco.com/”
Fyfe Co. LLC, “Carbon Composite Laminate Strengthening.” Specifications,
Hag-Elsafi, Lund, R.,O., and Alampalli, A. “Strengthening of a Bridge Pier Capbeam
Using Bonded FRP Composite Plates”. Composite Structures. 2002.
Hag-Elsafi, O., Alampalli, S., and Kunin, J. “Application of FRP Laminates for
Strengthening of a Reinforced Concrete T-Beam Bridge Structure”. Composite
Structures. 2001.

84
Hag-Elsafi, O., Alampalli, S., and Kunin, J. “In-Service Evaluation of a Reinforced
Concrete T-Beam Bridge FRP Strengthening System”. Composite Structures. 2003.
Microsoft Corporation. “Microsoft Office Project 2003.”
Microsoft Corporation. “Microsoft Streets and Maps.”
Neville, A.M. (1996). Properties of Concrete, 4th ed., John Wiley & Sons, Inc., London, England.
Nystrom Halvard E., Watkins Steve E., Nanni Antonio, and Murray Susan. 2003.
“Financial Viability of Fiber-Reinforced Polymer (FRP) Bridges.” Journal of
Management in Engineering, 19(1): 2-8.
Sen, R., and Mullins, G. “Issues Related to the FRP Wrap of Corroded Pilings.”
Composites 2004 Convention and Trade Show. Tampa, Florida, October 6-8th, 2004.
The Times: Beaver Newspaper Inc. Pennsylvania. Thursday, 29 December 2005.
UMR University. 2004. “Strengthening of Bridge T-0530, Crawford County, MO,”
Volume 2. (http://campus.umr.edu/utc/research/r098/reports/vol2/T-0530.pdf)
UMR University. 2004. “Strengthening of Bridge X-0596, Morgan County, MO,”
Volume 2. (http://campus.umr.edu/utc/research/r098/reports/vol2/X-0596.pdf)
Xanthakos Petros P. “Bridge Strengthening and Rehabilitation.” Prentice Hall PTR; 1st
edition: 1995.

85
Appendix A Details of Characteristics Classifications
Class 1 Prime Candidate for Repair: (Total = 13) Listing Bridge Span Span SC Yr Age SC ADT ADT SC ADTT ADTT SC Visual V SC Rank 1 59-0045-0310-2011 30 4 38 5 10300 10 650 9 3 10.0 84.82 59-0045-0430-1068 29 3 37 5 10300 10 650 9 3 10.0 83.83 41-0220-0131-1268 45 7 41 6 11000 10 1100 10 2 6.7 77.74 41-2014-0380-0000 23 2 36 5 6900 9 340 7 3 10.0 77.55 49-0405-0260-0942 27 3 30 4 5700 9 110 5 3 10.0 73.56 19-1014-0052-0442 29 3 38 5 3300 8 100 5 3 10.0 73.37 49-4012-0250-1032 48 7 34 4 2200 6 100 5 3 10.0 72.38 41-0118-0230-0644 80a 10 43 7 2600 7 300 7 2 6.7 71.79 41-0042-0050-1036 41 6 40 6 1700 6 62 3 3 10.0 70.810 41-2005-0052-0000 39 5 25 3 2400 6 210 6 3 10.0 70.511 41-2001-0130-0652 27 3 37 5 2600 7 80 4 3 10.0 69.812 19-4003-0010-0082 174b 10 23 2 1200 5 80 4 3 10.0 68.813 58-4024-0110-0000 46 7 34 4 650 4 110 5 3 10.0 68.8
a. Two-span bridge, with overall span of 80 feet. b. Three-span bridge, with overall span of 174 feet.

86
Appendix A (Continued)
Class 2 Moderate Candidate for Repair: (Total = 44) Listing Bridge Span Span SC Yr Age SC ADT ADT SC ADTT ADTT SC Visual V SC Rank 1 41-0118-0290-0000 41 6 43 7 2600 7 300 7 2 6.7 67.72 41-0118-0030-1331 39 5 30 4 5600 9 410 8 2 6.7 67.43 41-0118-0020-1109 31 4 30 4 5600 9 410 8 2 6.7 66.44 49-0061-0016-1066 62a 9 34 4 5400 9 160 5 2 6.7 66.25 41-0654-0210-1810 48 7 34 4 6900 9 200 6 2 6.7 65.96 54-0522-0210-0000 39 5 29 3 6200 9 400 8 2 6.7 65.97 41-0014-0220-0000 27 3 30 4 3200 8 600 9 2 6.7 65.48 54-0522-0090-1932 55b 8 29 3 4200 8 300 7 2 6.7 65.49 41-0014-0260-0368 34 4 28 3 3200 8 600 9 2 6.7 64.910 49-0225-0180-0000 66 9 27 3 3000 8 200 6 2 6.7 64.711 19-1025-0050-0000 41 6 41 6 3700 8 110 5 2 6.7 64.412 58-0414-0350-0000 31 4 41 6 2500 7 300 7 2 6.7 64.213 41-0442-0160-0000 97c 10 27 3 3800 8 130 5 2 6.7 63.914 59-0304-0060-1859 45 7 41 6 3011 8 90 4 2 6.7 63.715 54-0522-0230-1430 24 2 27 3 6300 9 400 8 2 6.7 62.916 19-0239-0060-0511 33 4 26 3 1800 6 40 2 3 10.0 62.517 49-1039-0020-0000 30 4 30 4 500 4 50 3 3 10.0 62.318 56-0220-0550-0000 30 4 25 3 3400 8 340 7 2 6.7 61.419 58-4002-0020-0000 33 4 35 5 3700 8 120 5 2 6.7 60.920 59-0015-0091-1230 50 8 30 4 9900 9 1300 10 1 3.3 60.621 19-0042-0690-1821 29 3 55 10 5400 9 350 7 1 3.3 59.3
a. Two-span bridge with overall span length of 62 feet. b. Two-span bridge with overall span length of 55 feet. c. Two-span bridge with overall span length of 97 feet.

87
Appendix A (Continued)
Class 2 (continued) Listing Bridge Span Span SC Yr Age SC ADT ADT SC ADTT ADTT SC Visual V SC Rank 22 59-0045-0350-0000 27 3 40 6 10300 10 650 9 1 3.3 58.623 58-0249-0322-0000 51 8 36 5 1260 5 80 4 2 6.7 57.924 19-4006-0082-0000 48a 7 34 4 1000 5 150 5 2 6.7 57.225 58-0249-0062-0000 48 7 32 4 1500 6 90 4 2 6.7 57.226 08-4034-0140-1580 50 8 52 9 350 3 35 2 2 6.7 56.927 19-0442-0050-0264 37 5 31 4 2100 6 100 5 2 6.7 56.928 08-0414-0200-0000 30 4 26 3 1500 6 200 6 2 6.7 56.229 19-2009-0010-0594 41 6 30 4 2500 7 70 3 2 6.7 56.230 58-2014-0152-0000 34 4 37 5 100 1 7 1 3 10.0 55.031 49-0225-0380-0000 29 3 34 4 1500 6 130 5 2 6.7 54.932 08-0014-0580-0000 27 3 57 10 2500 7 250 6 1 3.3 54.133 41-0014-0100-0000 43 6 28 3 4000 8 600 9 1 3.3 53.634 08-4013-0250-1496 25 3 27 3 1600 6 160 5 2 6.7 53.435 54-0522-0140-0000 67b 9 29 3 4200 8 300 7 1 3.3 53.136 19-0093-0110-1085 27 3 73 10 3900 8 75 4 1 3.3 52.337 49-0054-0090-0835 25 3 59 10 3000 8 90 4 1 3.3 52.338 49-3010-0110-0000 48 7 31 4 636 4 60 3 2 6.7 51.939 49-0642-0130-0000 29 3 30 4 2200 6 70 3 2 6.7 51.440 49-2002-0010-1145 44 6 35 5 740 4 40 2 2 6.7 50.741 58-0015-0820-2041 37 5 42 7 12300 10 2100 10 0 0.0 50.542 19-4036-0012-0000 48 7 26 3 500 4 60 3 2 6.7 50.443 54-2013-0010-0000 23 2 22 2 200 2 20 1 3 10.0 50.344 49-4018-0010-0649 27 3 22 2 3400 8 40 2 2 6.7 50.2
a. Two-span bridge with overall span length of 48 feet. b. Two-span bridge with overall span length of 67 feet.

88
Appendix A (Continued)
Class 3 Low Candidate for Repair: (Total = 71) Listing Bridge Span Span SC Yr Age SC ADT ADT SC ADTT ADTT SC Visual V SC Rank 1 59-1001-0110-2058 32 4 21 2 1400 5 80 4 2 6.7 49.42 54-0522-0040-0000 35 5 27 3 3000 8 360 7 1 3.3 49.13 56-0220-0530-0988 33 4 25 3 4300 8 340 7 1 3.3 48.14 41-1005-0130-0000 39 5 40 6 300 3 4 1 2 6.7 47.75 58-0249-0112-2535 23 2 52 9 1500 6 90 4 1 3.3 46.36 41-0414-0080-0000 25 3 37 5 300 3 30 2 2 6.7 45.97 54-2004-0030-1543 33 4 41 6 160 2 13 1 2 6.7 44.98 59-0045-0440-1302 33 4 38 5 10300 10 650 9 0 0.0 44.89 54-2016-0050-0000 29 3 42 7 1100 5 100 5 1 3.3 44.310 19-0042-0090-0000 33 4 40 6 2200 6 75 4 1 3.3 43.811 19-1025-0050-1308 33 4 41 6 2900 7 70 3 1 3.3 43.812 59-2001-0020-0000 33 4 32 4 440 3 20 1 2 6.7 43.713 58-1002-0050-0000 27 3 17 1 600 4 60 3 2 6.7 43.414 19-4045-0030-1814 35 5 34 4 220 2 20 1 2 6.7 42.915 59-3006-0050-0282 23 2 45 7 120 1 12 1 2 6.7 42.716 59-2009-0040-0000 23 2 30 4 1500 6 200 6 1 3.3 42.317 08-4031-0200-0000 23 2 29 3 360 3 35 2 2 6.7 41.918 58-2005-0220-0320 33 4 42 7 950 4 80 4 1 3.3 41.819 49-3018-0120-1195 35 5 38 5 1000 5 90 4 1 3.3 41.620 41-2019-0080-0000 27 3 37 5 140 1 10 1 2 6.7 40.721 54-0522-0150-1440 40 6 28 3 5200 9 400 8 0 0 40.2522 19-3008-0100-0039 23 2 33 4 270 2 20 1 2 6.7 39.923 56-0154-0050-0000 50 8 35 5 360 3 70 3 1 3.3 39.324 08-0414-0230-1008 26 3 19 1 1500 6 200 6 1 3.3 38.825 54-0104-0120-2462 29 3 30 4 5200 9 450 8 0 0.0 38.826 54-0104-0230-0000 27 3 30 4 5600 9 450 8 0 0.0 38.8

89
Class 3 (continued) Listing Bridge Span Span SC Yr Age SC ADT ADT SC ADTT ADTT SC Visual V SC Rank 27 54-0522-0110-0469 55a 8 29 3 4200 8 300 7 0 0.0 38.828 58-0549-0020-0000 32 4 53 9 2700 7 160 5 0 0.0 38.529 54-4012-0130-0000 35 5 39 5 560 4 50 3 1 3.3 38.130 58-0006-0610-0000 19 1 42 7 6500 9 260 6 0 0.0 37.831 58-2016-0260-0543 38 5 42 7 900 4 20 1 1 3.3 37.632 58-1022-0090-0000 31 4 38 5 300 3 30 2 1 3.3 33.633 54-0235-0150-0000 94b 10 30 4 1100 5 100 5 0 0.0 33.534 49-4001-0090-0066 25 3 41 6 2700 7 160 5 0 0.0 33.035 54-4012-0020-0000 25 3 38 5 460 3 40 2 1 3.3 32.636 54-0235-0140-0239 78c 9 30 4 1100 5 100 5 0 0.0 32.537 58-2014-0040-0946 38 5 59 10 1200 5 40 2 0 0.0 32.338 58-2014-0050-0815 38 5 59 10 1200 5 40 2 0 0.0 32.339 54-4003-0030-0254 44 6 48 8 1100 5 50 3 0 0.0 32.040 58-0414-0430-0190 42 6 57 10 330 3 50 3 0 0.0 31.541 49-3010-0160-0263 84d 10 40 6 750 4 70 3 0 0.0 31.342 58-2014-0092-0000 50 8 34 4 100 1 7 1 1 3.3 30.843 54-0235-0120-0094 43 6 30 4 1100 5 100 5 0 0.0 29.544 58-0006-0020-0000 67e 9 24 2 3500 8 32 2 0 0.0 29.545 58-0414-0110-0261 36 5 57 10 310 3 40 2 0 0.0 28.846 54-2010-0040-1803 25 3 37 5 120 1 10 1 1 3.3 27.347 59-3001-0010-1018 30 4 25 3 200 2 15 1 1 3.3 27.148 58-1026-0040-0304 35 5 59 10 300 3 15 1 0 0.0 27.049 58-3014-0120-0000 27 3 57 10 350 3 35 2 0 0 26.7550 41-2083-0040-1285 26 3 34 4 140 1 10 1 1 3.3 25.851 49-4006-0160-0589 27 3 60 10 480 3 5 1 0 0.0 25.0
a. Two-span bridge with overall span length of 55 feet. b. Two-span bridge with overall span length of 94 feet. c. Two-span bridge with overall span length of 78 feet. d. Two-span bridge with overall span length of 84 feet. e. Two-span bridge with overall span length of 67 feet.

90
Appendix A (Continued)
Class 3 (continued) Listing Bridge Span Span SC Yr Age SC ADT ADT SC ADTT ADTT SC Visual V SC Rank 52 58-0414-0540-1036 19 1 54 9 330 3 50 3 0 0.0 25.053 54-3012-0080-0000 27 3 37 5 520 4 80 4 0 0.0 24.554 49-4022-0010-1591 23 2 22 2 230 2 10 1 1 3.3 23.655 49-2001-0020-0000 23 2 28 3 120 1 10 1 1 3.3 23.356 58-3006-0060-3546 33 4 50 9 150 2 15 1 0 0.0 22.857 54-2012-0090-0091 29 3 51 9 210 2 2 1 0 0.0 21.858 49-3011-0010-0238 27 3 57 10 70 1 6 1 0 0.0 21.559 56-0154-0150-1564 26 3 35 5 360 3 70 3 0 0.0 21.060 56-4008-0080-0000 30 4 50 9 120 1 10 1 0 0.0 21.061 49-3003-0020-0645 24 2 22 2 1000 5 90 4 0 0.0 20.862 59-1003-0140-0921 35 5 36 5 385 3 10 1 0 0.0 19.563 54-2003-0020-0000 23 2 49 8 150 2 6 1 0 0.0 19.364 56-4020-0010-0000 26 3 49 8 140 1 10 1 0 0.0 18.565 56-1010-0030-0980 19 1 51 9 110 1 10 1 0 0.0 18.066 56-1002-0110-0000 22 2 41 6 100 1 10 1 0 0.0 14.567 56-1002-0140-0000 15 1 40 6 100 1 10 1 0 0.0 13.568 49-4020-0010-1014 31 4 21 2 230 2 20 1 0 0.0 12.369 49-2005-0040-1415 24 2 30 4 130 1 10 1 0 0.0 11.570 58-1004-0120-1913 27 3 19 1 300 3 9 1 0 0 11.571 54-2004-0020-0000 23 2 22 2 160 2 13 1 0 0 10.25

91
Appendix B Classification Based on Local Damage
Bridge Damage Ranking of 3: Severe Local Damage (Total = 15) Bridge Visual V SC Description
41-2014-0380-0000 3 10.0 Extensive and moderate damage 59-0045-0310-2011 3 10.0 Extensive damage 59-0045-0430-1068 3 10.0 Extensive damage 49-0405-0260-0942 3 10.0 Extensive damage 19-1014-0052-0442 3 10.0 Extensive damage 49-4012-0250-1032 3 10.0 Extensive to moderate damage. 41-2005-0052-0000 3 10.0 Extensive damage 41-2001-0130-0652 3 10.0 Extensive damage 19-4003-0010-0082 3 10.0 Extensive damage to rebars, replace? 58-4024-0110-0000 3 10.0 Extensive damage 19-0239-0060-0511 3 10.0 Extensive damage 49-1039-0020-0000 3 10.0 Extensive damage 58-2014-0152-0000 3 10.0 Extensive damage 54-2013-0010-0000 3 10.0 Extensive damage 41-0042-0050-1036 3 10.0 Extensive damage
Bridge Damage Ranking of 2: Moderate Local Damage (Total = 44)
Bridge Visual V
SC Description 41-0118-0230-0644 2 6.7 Severe overall damage, minor local damage, replace? 58-0414-0350-0000 2 6.7 Minor local damage 49-3010-0110-0000 2 6.7 Extensive local damage 41-0220-0131-1268 2 6.7 Extensive local damage 41-0118-0290-0000 2 6.7 Extensive local damage 41-0118-0030-1331 2 6.7 Extensive local damage 41-0118-0020-1109 2 6.7 Extensive local damage 49-0061-0016-1066 2 6.7 Extensive local damage 41-0654-0210-1810 2 6.7 Extensive local damage 54-0522-0210-0000 2 6.7 Extensive local damage 41-0014-0220-0000 2 6.7 Moderate overall damage 54-0522-0090-1932 2 6.7 Moderate local damage 41-0014-0260-0368 2 6.7 Moderate local damage 49-0225-0180-0000 2 6.7 Moderate local damage 19-1025-0050-0000 2 6.7 Extensive local damage 41-0442-0160-0000 2 6.7 Extensive local damage 59-0304-0060-1859 2 6.7 Moderate local damage 54-0522-0230-1430 2 6.7 Extensive local damage 56-0220-0550-0000 2 6.7 Moderate local damage 58-4002-0020-0000 2 6.7 Extensive local damage 58-0249-0322-0000 2 6.7 Moderate local damage 19-4006-0082-0000 2 6.7 Extensive local damage

92
Appendix B (continued) Bridge Damage Ranking of 2 (continued)
Bridge Visual V
SC Description 58-0249-0062-0000 2 6.7 Extensive local damage 08-4034-0140-1580 2 6.7 Extensive local damage 19-0442-0050-0264 2 6.7 Extensive local damage 08-0414-0200-0000 2 6.7 Extensive damage to ext beam, damage to deck 19-2009-0010-0594 2 6.7 Extensive local damage 49-0225-0380-0000 2 6.7 Moderate local damage 08-4013-0250-1496 2 6.7 Extensive local damage 49-0642-0130-0000 2 6.7 Moderate local damage 49-2002-0010-1145 2 6.7 Extensive local damage 19-4036-0012-0000 2 6.7 Extensive local damage 49-4018-0010-0649 2 6.7 Extensive local damage 59-1001-0110-2058 2 6.7 Extensive local damage 41-1005-0130-0000 2 6.7 Extensive local damage 41-0414-0080-0000 2 6.7 Extensive local damage 54-2004-0030-1543 2 6.7 Moderate local damage 59-2001-0020-0000 2 6.7 Moderate local damage 58-1002-0050-0000 2 6.7 Moderate overall damage 19-4045-0030-1814 2 6.7 Extensive local damage 59-3006-0050-0282 2 6.7 Moderate local damage 08-4031-0200-0000 2 6.7 Extensive local damage 41-2019-0080-0000 2 6.7 Moderate local damage 19-3008-0100-0039 2 6.7 Minor but global damage

93
Appendix B (continued)
Bridge Damage Ranking of 1: Minimal Damage (Total = 29)
Bridge Visual V
SC Description 59-0015-0091-1230 1 3.3 Minor overall damage 19-0042-0690-1821 1 3.3 Minor local damage 59-0045-0350-0000 1 3.3 Minor overall damage 08-0014-0580-0000 1 3.3 Minor damages 41-0014-0100-0000 1 3.3 Minor damages 54-0522-0140-0000 1 3.3 Minor damages to deck 19-0093-0110-1085 1 3.3 Extensive narrowly local damage 49-0054-0090-0835 1 3.3 Minor damages 54-0522-0040-0000 1 3.3 Minor local damage 56-0220-0530-0988 1 3.3 Minor local damage 58-0249-0112-2535 1 3.3 Minor local damage 19-0042-0090-0000 1 3.3 General overall damage, should investigate 19-1025-0050-1308 1 3.3 Minor local damage 59-2009-0040-0000 1 3.3 Minor local damage 58-2005-0220-0320 1 3.3 Minor local damage 49-3018-0120-1195 1 3.3 Minor local damage 56-0154-0050-0000 1 3.3 Minor local damage 08-0414-0230-1008 1 3.3 Minor damages 54-4012-0130-0000 1 3.3 Minor local damage 58-2016-0260-0543 1 3.3 Minor overall damage 58-1022-0090-0000 1 3.3 Moderate local damage 54-4012-0020-0000 1 3.3 Minor local damage 58-2014-0092-0000 1 3.3 Minor overall damage 54-2010-0040-1803 1 3.3 Minor local damage 59-3001-0010-1018 1 3.3 Minor local damage 41-2083-0040-1285 1 3.3 Minor damages 49-4022-0010-1591 1 3.3 Minor local damage 49-2001-0020-0000 1 3.3 Minor damages 54-2016-0050-0000 1 3.3 Extensive local damage

94
Appendix B (continued)
Bridges with No Visual Damage (Total = 40)
Bridge Visual V
SC Description 58-0015-0820-2041 0 0.0 No visible damage 59-0045-0440-1302 0 0.0 No visible damage 54-0522-0150-1440 0 0.0 No visible damage 54-0104-0120-2462 0 0.0 No visible damage 54-0104-0230-0000 0 0.0 No visible damage 54-0522-0110-0469 0 0.0 Minor damages 58-0549-0020-0000 0 0.0 Abutment failure not applicable 58-0006-0610-0000 0 0.0 No visible damage 54-0235-0150-0000 0 0.0 No visible damage 49-4001-0090-0066 0 0.0 No visible damage 54-0235-0140-0239 0 0.0 No visible damage 58-2014-0040-0946 0 0.0 No visible damage 58-2014-0050-0815 0 0.0 No visible damage 54-4003-0030-0254 0 0.0 No visible damage 58-0414-0430-0190 0 0.0 No visible damage 49-3010-0160-0263 0 0.0 No visible damage 54-0235-0120-0094 0 0.0 No visible damage 58-0006-0020-0000 0 0.0 No visible damage 58-0414-0110-0261 0 0.0 No visible damage 58-1026-0040-0304 0 0.0 No visible damage 58-3014-0120-0000 0 0.0 No visible damage 49-4006-0160-0589 0 0.0 No visible damage 58-0414-0540-1036 0 0.0 No visible damage

95
Appendix B (continued)
Bridges with No Visual Damage (continued)
Bridge Visual V
SC Description 54-3012-0080-0000 0 0.0 No visible damage 58-3006-0060-3546 0 0.0 No visible damage 54-2012-0090-0091 0 0.0 No visible damage 49-3011-0010-0238 0 0.0 Minor damages 56-0154-0150-1564 0 0.0 No visible damage 56-4008-0080-0000 0 0.0 No visible damage 49-3003-0020-0645 0 0.0 No visible damage 59-1003-0140-0921 0 0.0 No visible damage 54-2003-0020-0000 0 0.0 Minor local damage 56-4020-0010-0000 0 0.0 No visible damage 56-1010-0030-0980 0 0.0 No visible damage 56-1002-0110-0000 0 0.0 No visible damage 56-1002-0140-0000 0 0.0 No visible damage 49-4020-0010-1014 0 0.0 No visible damage 49-2005-0040-1415 0 0.0 No visible damage 58-1004-0120-1913 0 0.0 No visible damage 54-2004-0020-0000 0 0.0 No visible damage
![JPDUDVOLV#LVPHQJHQKDULD FRP EU LJRUSXII#JPDLO FRP€¦ · hjdyd#lvphqjhqkduld frp eu hysurmhwrv hqj#jpdlo frp hgx ]lool#krwpdlo frp ilolsh#edvhdpelhqwdo frp eu jerued#fdvdq frp eu](https://img.dokumen.tips/doc/110x75/5fa5bbc4c11b4c37f05fd0f4/jpdudvolvlvphqjhqkduld-frp-eu-ljrusxiijpdlo-hjdydlvphqjhqkduld-frp-eu-hysurmhwrv.jpg)