Embed Size (px)
Citation preview
AAII Journal/May 1999 29
TECHNICAL ANALYSIS
Pick up any text on technical analysis and charting and you are likely tocome across some discussion of price patterns and their potential use intrading. One pattern that appears quite frequently is the triangle.
TRIANGLE TYPES
In general terms, a triangle is formed by the convergence of two trendlinesdrawn on a price chart. One trendline connects the price peaks and oneconnects the price troughs of a security. Therefore, at least two points (peaksor troughs) are needed between which the trendline is drawn. Over time thesepeaks and troughs narrow and, depending on the price behavior, the trianglepattern may or may not be confirmed. Triangles come in several forms andcan take on different names, but the most common are right triangles andsymmetrical triangles.
RIGHT TRIANGLES
For any triangle, there are two sides that are important—the upper andlower boundaries. With the right triangle, one side or boundary, either the topor bottom, is roughly horizontal while the other slopes either upward ordownward. Whether the slope is upward or downward gives an indication asto the type of right triangle—ascending or descending.
ASCENDING TRIANGLES
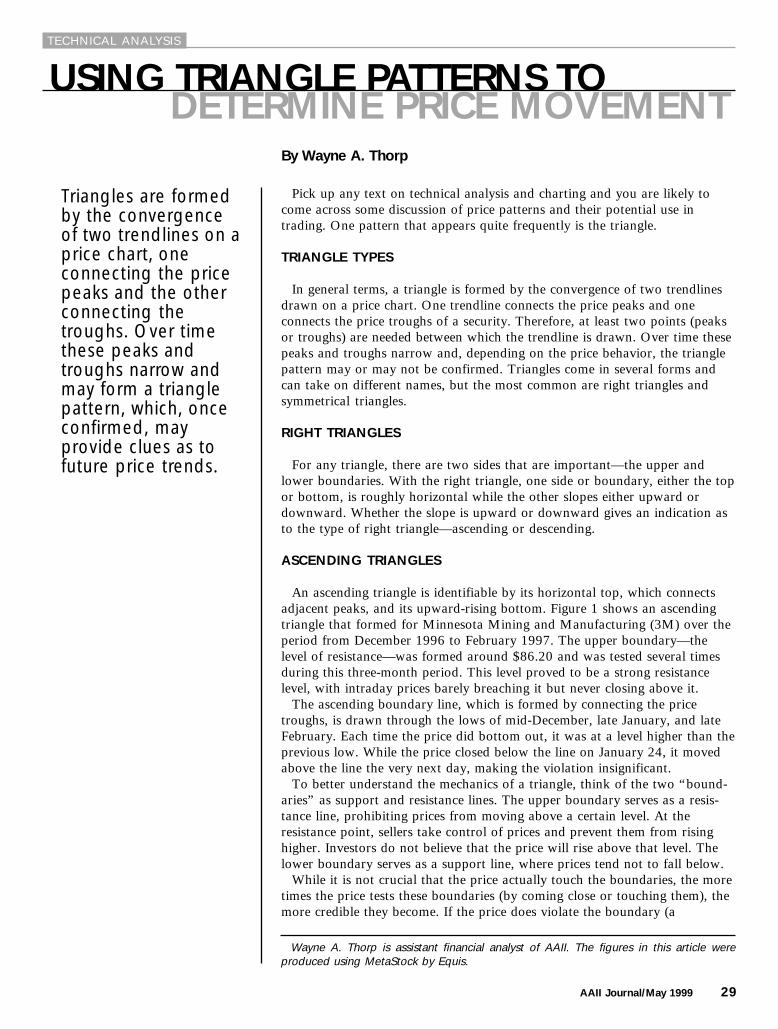
An ascending triangle is identifiable by its horizontal top, which connectsadjacent peaks, and its upward-rising bottom. Figure 1 shows an ascendingtriangle that formed for Minnesota Mining and Manufacturing (3M) over theperiod from December 1996 to February 1997. The upper boundary—thelevel of resistance—was formed around $86.20 and was tested several timesduring this three-month period. This level proved to be a strong resistancelevel, with intraday prices barely breaching it but never closing above it.
The ascending boundary line, which is formed by connecting the pricetroughs, is drawn through the lows of mid-December, late January, and lateFebruary. Each time the price did bottom out, it was at a level higher than theprevious low. While the price closed below the line on January 24, it movedabove the line the very next day, making the violation insignificant.
To better understand the mechanics of a triangle, think of the two “bound-aries” as support and resistance lines. The upper boundary serves as a resis-tance line, prohibiting prices from moving above a certain level. At theresistance point, sellers take control of prices and prevent them from risinghigher. Investors do not believe that the price will rise above that level. Thelower boundary serves as a support line, where prices tend not to fall below.
While it is not crucial that the price actually touch the boundaries, the moretimes the price tests these boundaries (by coming close or touching them), themore credible they become. If the price does violate the boundary (a
By Wayne A. Thorp
Triangles are formedby the convergenceof two trendlines on aprice chart, oneconnecting the pricepeaks and the otherconnecting thetroughs. Over timethese peaks andtroughs narrow andmay form a trianglepattern, which, onceconfirmed, mayprovide clues as tofuture price trends.
Wayne A. Thorp is assistant financial analyst of AAII. The figures in this article wereproduced using MetaStock by Equis.
USING TRIANGLE PATTERNS TODETERMINE PRICE MOVEMENT
30 AAII Journal/May 1999
TECHNICAL ANALYSIS
FIGURE 1. AN ASCENDING TRIANGLE: 3M
breakout) before the pattern hasfully developed, these violationsshould be small and short-lived.
The decision of which points touse in drawing your trendlines isextremely subjective. Given the sameprice chart, a group of people couldcome up with several differentpatterns. Some people may drawtheir boundaries so that the pricenever violates them until thebreakout, while others may allowintraday breaks. Short-term traderswould tend to watch for intradaybreaks, while longer-term investorsmay look for closing prices outsidethe pattern. The key is to develop astrategy with which you are com-fortable.
Over time, these boundariesconstrict prices to a tighter andtighter trading range until, typically,the price breaks through one of thetrendlines and makes a “consider-able” move either on the upside ordownside. It is the anticipation ofthis breakout and subsequent pricemove that makes triangle patternsuseful in trading.
With right triangles, it is thebreaking of the horizontal boundaryand subsequent “sustained” move-ment in that direction that confirmsthe pattern. If the sloping trendlineis broken, the resulting movetypically has less significance.
In the case of 3M, its closing priceon February 24 was just above thehorizontal boundary. Any time atriangle boundary is broken, espe-cially when the closing price isoutside the triangle, you should payclose attention to the subsequentmovement. On the two trading daysimmediately following the closeabove the boundary, 3M rose 3.5and 3 points, respectively.
VOLUME CONFIRMATION
In addition to the behavior pricesexhibited during the formation of atriangle, trading volume plays a rolein confirming both the formationand confirmation of triangles.During the formation of a triangle,trading volume tends to fall. At thebeginning of the pattern, you canexpect heavy or at least averagevolume and you can expect lowvolume prior to the price breakout.Patterns that have this volumeconfirmation tend to be morereliable than those that do not.
The bottom portion of Figure 1shows the trading volume for 3M.Over the period the triangle patterndeveloped—mid-December 1996 tolate February 1997—daily tradingvolume steadily dropped fromroughly 17 million shares to justover five million a few days before
the breakout occurred. The trendlineillustrates this fall in volume, withonly a few days in that time periodregistering trading volume above theline.
Shortly before the price brokeabove the upper boundary, therewas an increase in volume. Once theprice closed above the boundary,volume jumped to over 17 millionshares for three consecutive tradingdays, until the demand subsided. Atthat point, prices leveled out andvolume declined.
This increase in volume at thebreakout solidifies the pattern. In thecase of both ascending and sym-metrical triangles, where thebreakout is to the upside, theincrease in volume is vital. If such abreakout is not supported byvolume, you should not be surprisedif the rally falters.
For descending triangles andsymmetrical triangles with thebreakout to the downside, anincrease in volume is not as impor-tant. However, if volume doesincrease, the price movement is morecredible.
DESCENDING TRIANGLES
Descending triangles look andbehave the opposite of ascendingtriangles. The lower boundary isbasically horizontal and connects theadjacent valleys, while the upperboundary is downward sloping.
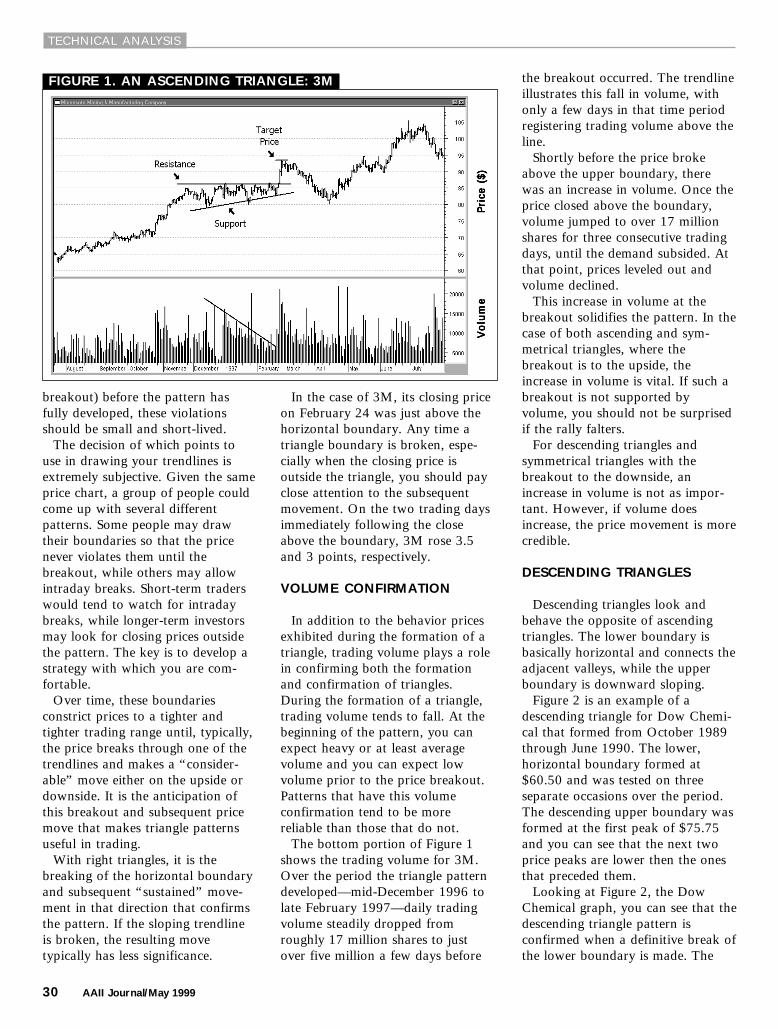
Figure 2 is an example of adescending triangle for Dow Chemi-cal that formed from October 1989through June 1990. The lower,horizontal boundary formed at$60.50 and was tested on threeseparate occasions over the period.The descending upper boundary wasformed at the first peak of $75.75and you can see that the next twoprice peaks are lower then the onesthat preceded them.
Looking at Figure 2, the DowChemical graph, you can see that thedescending triangle pattern isconfirmed when a definitive break ofthe lower boundary is made. The
Pri
ce (
$)P
rice
($)
Pri
ce (
$)P
rice
($)
Pri
ce (
$)V
olu
me
Vo
lum
eV
olu
me
Vo
lum
eV
olu
me
AAII Journal/May 1999 31
TECHNICAL ANALYSIS
price stabilizes for a couple of days,at which point a common “post-breakout” pattern develops. Thispattern—called a snapback—isformed when the price retests thefirst boundary after the breakout. Inthis case, Dow Chemical’s pricemoves back to the lower boundarybefore continuing downward. Inorder for the triangle pattern to beconfirmed, the price should not re-enter the triangle during thesnapback, except on an intradaybasis. Re-entering the triangle couldbe a warning that the pattern willnot be confirmed.
SYMMETRICAL TRIANGLES
Symmetrical triangles tend to bethe most common triangle pattern;they typically form during periods ofconsolidation or during a period ofrest amid a trend. Unlike righttriangles, where one of the bound-aries is relatively horizontal, sym-metrical triangles are made up oftwo sloping trendlines that converge.Prices will fluctuate between the twolines, with each move being smallerthan the previous one.
An example of a symmetricaltriangle is shown in Figure 3. Theupper, downward-sloping boundaryfor Men’s Wearhouse is drawnthrough the major price peaks at
$25.67, $24.67, and $23.33. Pricetroughs at $19.67, $20.17, and$20.50 form the upward-sloping,lower boundary.
Unlike the descending and ascend-ing patterns, which give you anindication of the direction in whichthe price breakout will be, symmetri-cal triangles do not give you that“clue.” In order to trade a symmetri-cal triangle, you will have to waituntil the breakout has occurred. ForMen’s Wearhouse, the breakout wasto the downside as the price violatedthe lower boundary at $20.40 and
made a sharp decline thereafter.Note also that there is the accom-
panying volume confirmation of thetriangle pattern (see the bottom ofFigure 3). In the middle of May,when the symmetrical triangle wasjust forming, volume topped out at660,000 shares. Over time, as theprice neared the breakout point,volume dropped to just 28,000shares traded a day. In confirmationof the pattern, the day of thebreakout volume rose to over400,000 shares.
PRICE TARGETS
How can triangles be used as partof a trading system?
Many technical analysts believethat once a triangle pattern has beenidentified and confirmed, prices tendto behave predictably and you canreasonably predict the level to whichprices will rise or fall once thebreakout occurs.
A typical rule of thumb forcalculating a price target is to base iton the height of the triangle at itswidest point—the vertical distancebetween the two trendlines. As anexample, refer again to Figure 1.The upper boundary is easy todetermine since it is a horizontalline. In this case it is $86.20. For
FIGURE 2. A DESCENDING TRIANGLE: DOW CHEMICAL
FIGURE 3. A SYMMETRICAL TRIANGLE: MEN’S WEARHOUSE
Pri
ce (
$)P
rice
($)
Pri
ce (
$)P
rice
($)
Pri
ce (
$)V
olu
me
Vo
lum
eV
olu
me
Vo
lum
eV
olu
me
Pri
ce (
$)P
rice
($)
Pri
ce (
$)P
rice
($)
Pri
ce (
$)V
olu
me
Vo
lum
eV
olu
me
Vo
lum
eV
olu
me

32 AAII Journal/May 1999
TECHNICAL ANALYSIS
right triangles, the sloping boundarygives us a little more trouble (for 3Mthe lower boundary). The price weuse is the first point used whendrawing the trendline—$79.00 for3M. Knowing the high and lowprices for the triangle, you thensubtract the values to find its height($86.20 – $79.00 = $7.20). Thisrange is then added to or subtractedfrom the price at which the breakoutoccurs. Therefore we can reasonablyassume, if the pattern is confirmedfor 3M, that the price will rise to atleast $93.40 ($86.20 + $7.20),remembering, of course, that sincethis is an ascending triangle, weexpect the prices to break the upperboundary and continue to rise. Thetarget price for Dow Chemical usingthis rule of thumb is also shown inFigure 2. The technique is the samehere, but since this is a descendingtriangle, we expect the price to fallbelow the lower boundary.
The measuring technique forsymmetrical triangles is similar tothat used for right triangles. We arestill interested in finding the verticalheight, but we need to use the firstpoint used to draw both trendlines,since there is no horizontal bound-ary. Referring to Figure 3, the highpoint is where the price reverseditself to create the first peak, at$25.67. The low point is where the
price first bottomed out to create thefirst trough, at $19.67. Again, youtake the difference ($25.67 – $19.67= $6.00) to estimate how much theprice will move. However, with asymmetrical triangle you do notknow the direction in which thebreakout will occur. You typicallyhave to wait until the breakoutactually occurs because it is not inthe nature of these triangles toprovide you with a hint as to whichway prices will go. Once thebreakout happens, in this case, forMen’s Wearhouse to the downsideat $20.40, we can then calculate theminimum price target by deductingthe range from the breakout point($20.40 – $6.00 = $14.40).
TOO GOOD TO BE TRUE?
While triangles, like many otherprice patterns, may provide you withan indication of an impendingmovement, technical analysis or anytype of investment analysis is not anexact science. The example in Figure4 proves this point. Here we seewhat appears to be a textbookexample of a descending triangleforming for Consolidated NaturalGas. From late December 1987 untilMay 1988, prices tested but neverfell below the $35.25 support level.Each time prices rose off this
bottom, the subsequent high wasalways lower than the one thatpreceded it. This allowed for adownward-sloping upper boundaryto be drawn, above which pricesnever rose. Over this same period,volume provided the classic confir-mation, with most volume spikesbeing lower than the one prior.Volume above the trendline wasshort-term in nature.
Prices eventually did fall and closebelow the lower boundary on May11. Since this is the first violation ofthe boundary, we should focus ourattention on what happens next. Thevery next day the price rises andcloses above the lower boundary—not an uncommon occurrence duringthe development of a triangle.However, as mentioned earlier, weshould begin to question thepattern’s validity. The price flirtswith the line for a few days until it,again, falls below it. This time,however, it continues to fall and, atthis point, we are led to believe thatthe pattern has been confirmed andwe can look to prices potentiallyfalling to the target of $28.75 (usingthe same technique outlined earlier).However, within two weeks pricesfirst stabilize and then reverse. Overthe next couple of days, the pricerises above both the lower and upperboundaries, thereby voiding thepattern. This shows how importantit is to use other techniques inconjunction with technical analysis.
CONCLUSION
This discussion was meant to addsome useful tools to your technicalanalysis toolbox. But it is importantto remember that these techniquesare not foolproof, and the perceivedpattern may not develop accordingto your expectations.
In the end, no matter what type oftrading strategy you follow over theshort term, other forms of analysis,particularly a fundamental look atthe position of the company, iscrucial for long-term investmentsuccess.✦✦✦✦✦
FIGURE 4. A “FAILED” TRIANGLE: CONSOLIDATED NATURAL GAS
Pri
ce (
$)P
rice
($)
Pri
ce (
$)P
rice
($)
Pri
ce (
$)V
olu
me
Vo
lum
eV
olu
me
Vo
lum
eV
olu
me