Embed Size (px)
Citation preview

EU-MERCI
EU coordinated MEthods and procedures based on Real Cases for the effective
implementation of policies and measures supporting energy efficiency in the Industry
HORIZON 2020 Project Nr. 693845
Technical analysis – Chemical sector
(NACE C20)
WP4: Picture of efficiency projects implemented by the Industry sector-by-sector and process-by-process

EU coordinated MEthods and procedures based on Real Cases for the effective
implementation of policies and measures supporting energy efficiency in the Industry
D4.2 - Picture of efficiency projects implemented by the
Industry sector-by-sector and process-by-process
Page 1
Table of Contents
1 Introduction ......................................................................................................................... 2
2 Subsector share of energy consumption ................................................................................ 3
3 Key products ........................................................................................................................ 4
4 Main processes .................................................................................................................... 7
4.1 Cracking: ...................................................................................................................... 7
4.1.1 Catalytic cracking ................................................................................................................ 7
4.1.2 Steam cracking .................................................................................................................... 8
4.2 Reforming: ................................................................................................................. 11
4.2.1 Catalytic reforming ........................................................................................................... 11
4.2.2 Continuous catalytic regeneration (CCR) reforming process ........................................... 12
4.3 Haber-Bosch process: ................................................................................................. 12
4.4 Chlorine production through electrolysis .................................................................... 13
4.4.1 Membrane cell process ..................................................................................................... 14
4.4.2 Mercury cell process ......................................................................................................... 15
4.4.3 Diaphragm cell process ..................................................................................................... 16
5 Energy intensity of key processes ........................................................................................ 17
6 EU final energy consumption for chemical and pharmaceutical production .......................... 18

EU coordinated MEthods and procedures based on Real Cases for the effective
implementation of policies and measures supporting energy efficiency in the Industry
D4.2 - Picture of efficiency projects implemented by the
Industry sector-by-sector and process-by-process
Page 2
1 Introduction
NACE C20 Manufacture of chemicals and chemical products includes the transformation of organic
and inorganic raw materials by a chemical process and the formation of products. It distinguishes the
production of basic chemicals that constitute the first industry group from the production of
intermediate and end products produced by further processing of basic chemicals that make up the
remaining industry classes. It contains the following sub-catagories:
20.1 Manufacture of basic chemicals, fertilisers and nitrogen compounds, plastics and
synthetic rubber in primary forms: this group includes the manufacture of basic chemical
products, fertilisers and associated nitrogen compounds, as well as plastics and synthetic
rubber in primary forms.
20.2 Manufacture of pesticides and other agrochemical products
20.3 Manufacture of paints, varnishes and similar coatings, printing ink and mastics
20.4 Manufacture of soap and detergents, cleaning and polishing preparations, perfumes
and toilet preparations
20.5 Manufacture of other chemical products: this group includes the manufacture of
explosives and pyrotechnic products, glues, essential oils and chemical products n.e.c., e.g.
photographic chemical material (including film and sensitised paper), composite diagnostic
preparations etc.
20.6 Manufacture of man-made fibres
The chemicals and pharmaceutical sector contributed to 5% of the EU’s GDP (gross domestic
product) in 2011 (Eurostat; 2013). Key economic contributions are delivered by 2 key groups:
Manufacture of basic chemicals, fertilisers and nitrogen compounds, plastics and synthetic rubber in
primary forms (NACE C20.1) and Manufacture of pharmaceutical preparations (NACE C21.2), which
accounted for 70% of total production value. The pharmaceutical sector is not considered further
within this technical paper due to the lack of efficiency measures within the EU-Merci project.
Key economic indicators for the chemicals sector are summarised in next paragraph.

EU coordinated MEthods and procedures based on Real Cases for the effective
implementation of policies and measures supporting energy efficiency in the Industry
D4.2 - Picture of efficiency projects implemented by the
Industry sector-by-sector and process-by-process
Page 3
2 Subsector share of energy consumption
The following table provides an estimated overview of the share of energy consumption between
subsectors in the manufacture of chemicals and chemical products (NACE C20) in EU28. The
petrochemicals and basic inorganic subsectors account for 72% of the energy use in the chemicals
sector and reflect the high energy requirements to produce the primary feedstock for the
downstream subsectors (polymers, specialty and consumer chemicals).
Table 1: Subsectors energy consumption share in chemical industry.
Subsector Description NACE (Group) Category Estimated share of final energy demand
Petrochemicals C20.1 Energy intensive 26,596 47%
Basic inorganic C20.1; 20.5 Energy intensive 14,147 25%
Polymers C20.1; 20.6 Non-energy intensive 6,791 12%
Specialty chemicals C20.2; 20.3 Non-energy intensive 4,527 8%
Consumer chemicals C20.4 Non-energy intensive 1,132 2%
Pharmaceutical products C21 Non-energy intensive 3,39566 6%
Total energy demand for chemicals and pharmaceuticals sector for EU28 (2011):
56,588 100%
EU coordinated MEthods and procedures based on Real Cases for the effective
implementation of policies and measures supporting energy efficiency in the Industry
D4.2 - Picture of efficiency projects implemented by the
Industry sector-by-sector and process-by-process
Page 4
3 Key products
The following table shows the main products according to the chemical sectors:
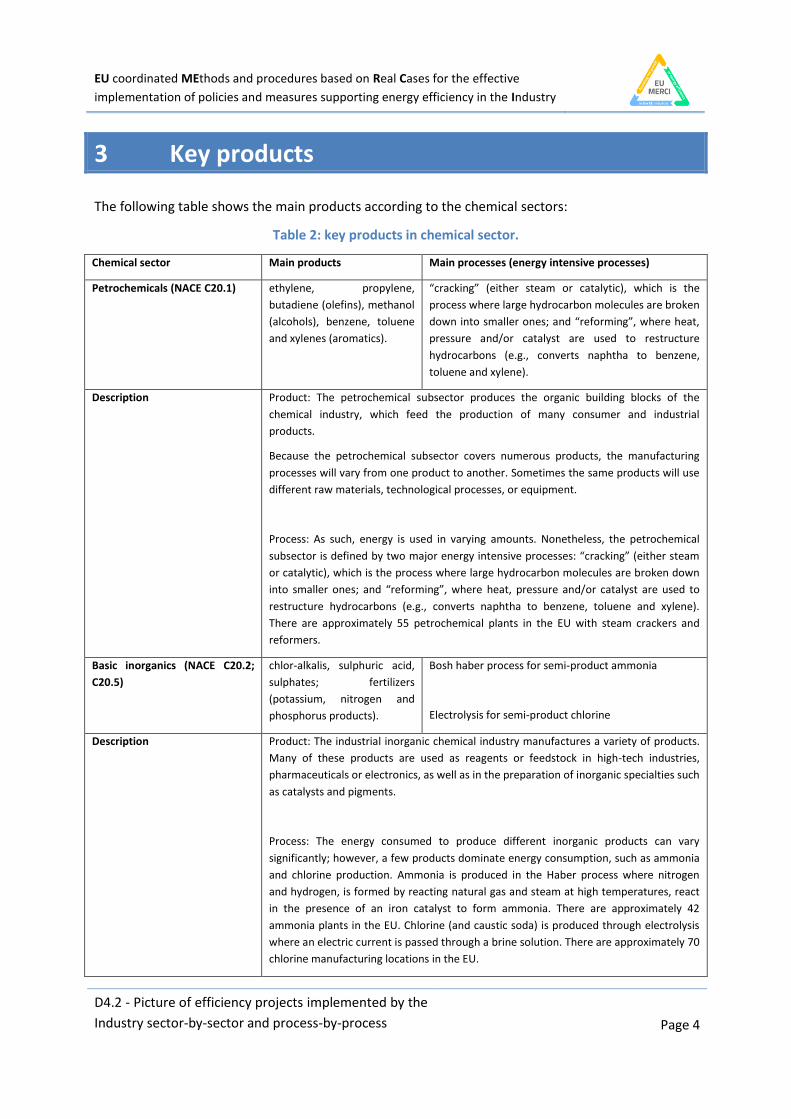
Table 2: key products in chemical sector.
Chemical sector Main products Main processes (energy intensive processes)
Petrochemicals (NACE C20.1) ethylene, propylene,
butadiene (olefins), methanol
(alcohols), benzene, toluene
and xylenes (aromatics).
“cracking” (either steam or catalytic), which is the
process where large hydrocarbon molecules are broken
down into smaller ones; and “reforming”, where heat,
pressure and/or catalyst are used to restructure
hydrocarbons (e.g., converts naphtha to benzene,
toluene and xylene).
Description Product: The petrochemical subsector produces the organic building blocks of the
chemical industry, which feed the production of many consumer and industrial
products.
Because the petrochemical subsector covers numerous products, the manufacturing
processes will vary from one product to another. Sometimes the same products will use
different raw materials, technological processes, or equipment.
Process: As such, energy is used in varying amounts. Nonetheless, the petrochemical
subsector is defined by two major energy intensive processes: “cracking” (either steam
or catalytic), which is the process where large hydrocarbon molecules are broken down
into smaller ones; and “reforming”, where heat, pressure and/or catalyst are used to
restructure hydrocarbons (e.g., converts naphtha to benzene, toluene and xylene).
There are approximately 55 petrochemical plants in the EU with steam crackers and
reformers.
Basic inorganics (NACE C20.2;
C20.5)
chlor-alkalis, sulphuric acid,
sulphates; fertilizers
(potassium, nitrogen and
phosphorus products).
Bosh haber process for semi-product ammonia
Electrolysis for semi-product chlorine
Description Product: The industrial inorganic chemical industry manufactures a variety of products.
Many of these products are used as reagents or feedstock in high-tech industries,
pharmaceuticals or electronics, as well as in the preparation of inorganic specialties such
as catalysts and pigments.
Process: The energy consumed to produce different inorganic products can vary
significantly; however, a few products dominate energy consumption, such as ammonia
and chlorine production. Ammonia is produced in the Haber process where nitrogen
and hydrogen, is formed by reacting natural gas and steam at high temperatures, react
in the presence of an iron catalyst to form ammonia. There are approximately 42
ammonia plants in the EU. Chlorine (and caustic soda) is produced through electrolysis
where an electric current is passed through a brine solution. There are approximately 70
chlorine manufacturing locations in the EU.
EU coordinated MEthods and procedures based on Real Cases for the effective
implementation of policies and measures supporting energy efficiency in the Industry
D4.2 - Picture of efficiency projects implemented by the
Industry sector-by-sector and process-by-process
Page 5
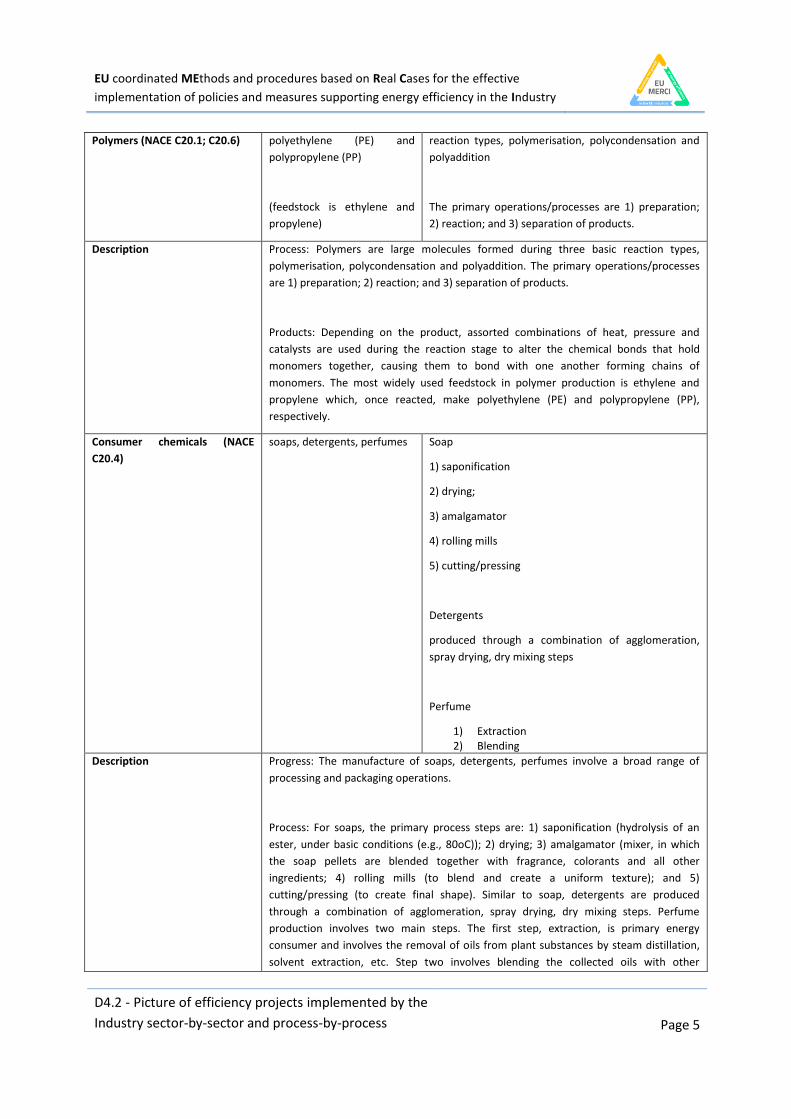
Polymers (NACE C20.1; C20.6) polyethylene (PE) and
polypropylene (PP)
(feedstock is ethylene and
propylene)
reaction types, polymerisation, polycondensation and
polyaddition
The primary operations/processes are 1) preparation;
2) reaction; and 3) separation of products.
Description Process: Polymers are large molecules formed during three basic reaction types,
polymerisation, polycondensation and polyaddition. The primary operations/processes
are 1) preparation; 2) reaction; and 3) separation of products.
Products: Depending on the product, assorted combinations of heat, pressure and
catalysts are used during the reaction stage to alter the chemical bonds that hold
monomers together, causing them to bond with one another forming chains of
monomers. The most widely used feedstock in polymer production is ethylene and
propylene which, once reacted, make polyethylene (PE) and polypropylene (PP),
respectively.
Consumer chemicals (NACE
C20.4)
soaps, detergents, perfumes Soap
1) saponification
2) drying;
3) amalgamator
4) rolling mills
5) cutting/pressing
Detergents
produced through a combination of agglomeration,
spray drying, dry mixing steps
Perfume
1) Extraction 2) Blending
Description Progress: The manufacture of soaps, detergents, perfumes involve a broad range of
processing and packaging operations.
Process: For soaps, the primary process steps are: 1) saponification (hydrolysis of an
ester, under basic conditions (e.g., 80oC)); 2) drying; 3) amalgamator (mixer, in which
the soap pellets are blended together with fragrance, colorants and all other
ingredients; 4) rolling mills (to blend and create a uniform texture); and 5)
cutting/pressing (to create final shape). Similar to soap, detergents are produced
through a combination of agglomeration, spray drying, dry mixing steps. Perfume
production involves two main steps. The first step, extraction, is primary energy
consumer and involves the removal of oils from plant substances by steam distillation,
solvent extraction, etc. Step two involves blending the collected oils with other
EU coordinated MEthods and procedures based on Real Cases for the effective
implementation of policies and measures supporting energy efficiency in the Industry
D4.2 - Picture of efficiency projects implemented by the
Industry sector-by-sector and process-by-process
Page 6
substances based on predetermined formulas.
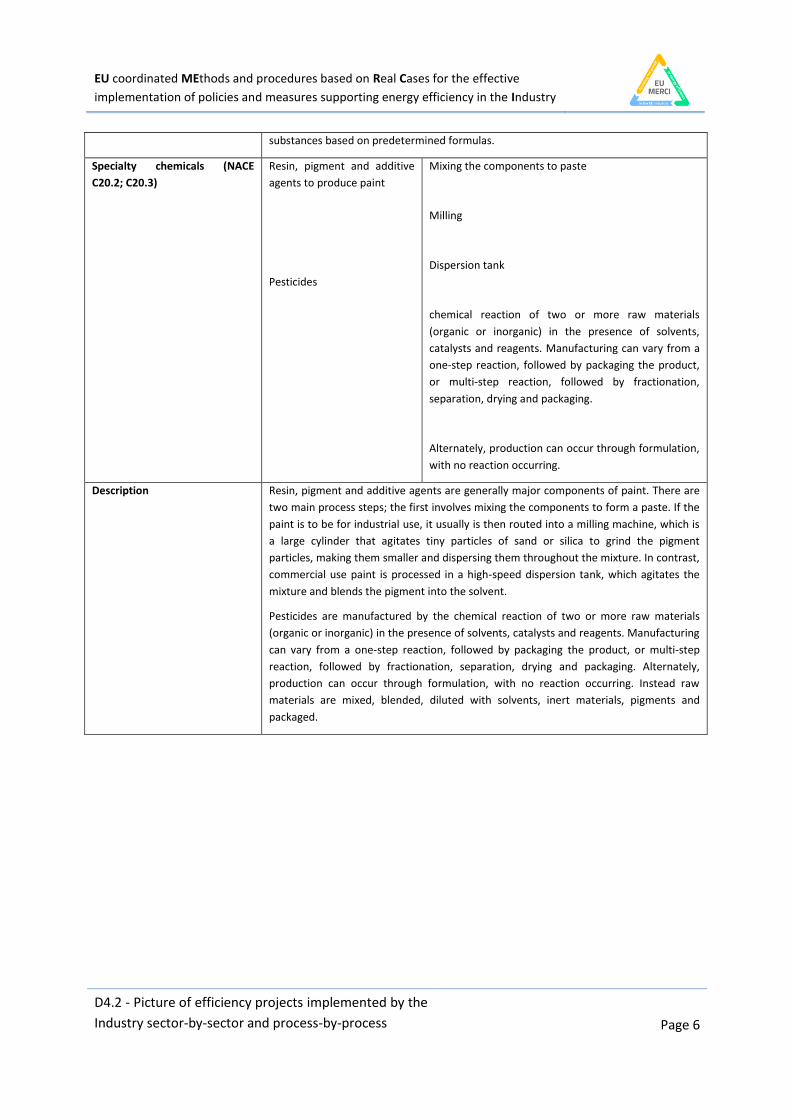
Specialty chemicals (NACE
C20.2; C20.3)
Resin, pigment and additive
agents to produce paint
Pesticides
Mixing the components to paste
Milling
Dispersion tank
chemical reaction of two or more raw materials
(organic or inorganic) in the presence of solvents,
catalysts and reagents. Manufacturing can vary from a
one-step reaction, followed by packaging the product,
or multi-step reaction, followed by fractionation,
separation, drying and packaging.
Alternately, production can occur through formulation,
with no reaction occurring.
Description Resin, pigment and additive agents are generally major components of paint. There are
two main process steps; the first involves mixing the components to form a paste. If the
paint is to be for industrial use, it usually is then routed into a milling machine, which is
a large cylinder that agitates tiny particles of sand or silica to grind the pigment
particles, making them smaller and dispersing them throughout the mixture. In contrast,
commercial use paint is processed in a high-speed dispersion tank, which agitates the
mixture and blends the pigment into the solvent.
Pesticides are manufactured by the chemical reaction of two or more raw materials
(organic or inorganic) in the presence of solvents, catalysts and reagents. Manufacturing
can vary from a one-step reaction, followed by packaging the product, or multi-step
reaction, followed by fractionation, separation, drying and packaging. Alternately,
production can occur through formulation, with no reaction occurring. Instead raw
materials are mixed, blended, diluted with solvents, inert materials, pigments and
packaged.

EU coordinated MEthods and procedures based on Real Cases for the effective
implementation of policies and measures supporting energy efficiency in the Industry
D4.2 - Picture of efficiency projects implemented by the
Industry sector-by-sector and process-by-process
Page 7
4 Main processes
The most energy intensive processes are related to the manufacturing of petrochemicals and basic
inorganics. The processes are cracking, reforming, Haber-process and electrolysis for chlorine.
Considering that the sector comprises a large number of different products (thus, different
processes), for the purpose of this analysis the focus has been on the most energy-intensive
processes and technologies.
4.1 Cracking:
Cracking is the process by which saturated hydrocarbons are converted into more sought after
unsaturated species. This is a dehydrogenation reaction that can be effected either catalytically or
thermally. In Western Europe, the steam cracking process accounts for more than 95% of ethylene
and butadiene production and 75% of propylene production. Propylene is also recovered from
refining operations, in particular from Fluidised Catalytic Cracker off-gas and through the
dehydrogenation of propane.
4.1.1 Catalytic cracking
Figure 1: Simplified process flow of catalytic cracker.
EU coordinated MEthods and procedures based on Real Cases for the effective
implementation of policies and measures supporting energy efficiency in the Industry
D4.2 - Picture of efficiency projects implemented by the
Industry sector-by-sector and process-by-process
Page 8
Catalytic cracking is the most widely used conversion process for upgrading heavier hydrocarbons
into more valuable lower boiling hydrocarbons. In 2008, 56 fluid catalytic cracking (FCC) units were
installed in the EU-27. It uses heat and a catalyst to break larger hydrocarbon molecules into smaller,
lighter molecules.
A number of different catalytic cracking designs are currently in use worldwide, including fixed bed
reactors, moving bed reactors, fluidised bed reactors and once-through units. The fluidised and
moving bed reactors are by far the most prevalent in world refineries.
Fluid catalytic cracking (FCC) units are by far the most common catalytic cracking units. The FCC unit
consists of three distinct sections: the reactor-regenerator section including the air blower and the
waste heat boiler, the main fractionator section including the wet gas compressor and the
unsaturated gas plant section.
In the FCC process, oil and oil vapour preheated to 250–425 °C come into contact with hot catalyst at
about 680–730 °C in the riser reactor. To enhance vaporisation and subsequent cracking, the feed is
atomised with steam. The fluidised catalyst and the reacted hydrocarbon vapour are separated
mechanically in a (two-stage) cyclone system and any hydrocarbon remaining on the catalyst is
removed by steam stripping. The catalytic cracking processes produce coke, which collects on the
catalyst surface and diminishes its catalytic properties. The catalyst therefore needs to be
regenerated continuously essentially by burning the coke off the catalyst at high temperatures.
The cracked hydrocarbon vapours are then fed to a fractionation tower where the various desired
fractions are separated and collected. The streams are steam stripped to remove volatile
hydrocarbons prior to cooling and sending to storage. The fractionator overhead gas is partly
condensed and accumulated in the overhead drum to separate it into three phases: gas, liquid and
sour water streams. The liquid and gas streams are both fed to the gas plant for further separation
and the sour water stream is sent to the sour water stripper for purification.
Various types of equipment are usually used for recovering energy from this process. The hot flue-
gases from the regenerator are cooled by means of steam generation in a waste heat boiler or, in
case of partial CO combustion, in a CO boiler. Prior to steam generation, electricity can also be
produced by expansion of the flue-gases in a turbo-expander. And, in particular for units processing
large quantities of residue, additional heat removal from the regenerator can be achieved with
catalyst coolers for steam generation.
4.1.2 Steam cracking
Almost the entire world demand for ethylene and butadiene and the majority of propylene, is
produced using the steam cracking process. In this process, suitable hydrocarbons are heated to very
high temperatures, in the presence of steam, to split or ‘crack’ the molecules into the desired lower
olefin products. Most proprietary designs concern the furnace, but there may also be variations in
the pressure and temperature of the fractionation columns; refrigeration systems (open versus
closed loop); and the use of turbo expanders. Regardless of contractor or feedstock, a cracker can be

EU coordinated MEthods and procedures based on Real Cases for the effective
implementation of policies and measures supporting energy efficiency in the Industry
D4.2 - Picture of efficiency projects implemented by the
Industry sector-by-sector and process-by-process
Page 9
broken down into three separate sections: pyrolysis; primary fractionation/compression; and
product fractionation. The following Figure gives an overview:
Figure 2: Steam cracking process flowchart.
4.1.2.1 Pyrolysis section
The hydrocarbon feedstock is preheated in heat exchangers and then vaporised with superheated
steam before passing into tubes arranged in a cracking furnace. The tubes are externally heated to
750-875 °C by oil or gas fired burners. The conversion of saturated hydrocarbons to unsaturated
compounds is highly endothermic and therefore requires a high-energy input. Steam is injected to
reduce the partial pressure of the hydrocarbon mixture and also to minimise coke formation. The
transfer line exchangers (TLEs) are used to quickly quench the product gases to 550 - 650 ºC (to
prevent degradation by secondary reactions) and to generate high-pressure steam for plant re-use.
Gas feedstocks usually have secondary TLEs to maximise the heat recovery.
4.1.2.2 Primary fractionation and compression
The primary fractionation and compression section consists of the primary fractionator (naphtha and
gas oil feed only), quench tower, gas compressor and gas cleanup facilities. The latter may include an
amine unit or caustic unit and drying facilities. The primary fractionator is used to condense out and
fractionate fuel oil streams produced from naphtha and gas oil fed crackers. The gases are de-
superheated in the quench tower by a circulating oil or water stream. The circulating oil or water

EU coordinated MEthods and procedures based on Real Cases for the effective
implementation of policies and measures supporting energy efficiency in the Industry
D4.2 - Picture of efficiency projects implemented by the
Industry sector-by-sector and process-by-process
Page 10
stream is used as a medium level heat source for the rest of the plant. Some plants have no quench
water tower and use direct cooling of the cracked gas with air coolers and/or cooling water. Tarry
bottoms are removed from the system as product, which mostly fuels non-steam cracking furnaces
and boilers. Most of the dilution steam is condensed. Dilution steam is generally recovered and
recycled back to the front end of the plant. During the start-up of the recovery and fractionation
areas gases may be flared whilst the correct operating conditions are established and gas recycles
may be used to reduce the need for flaring.
Figure 3: Typical cracking furnace configuration.
Gas compression: Product gases from the quench tower are condensed by four or five stages of gas
compression. The gas is cooled after each stage and passed through a liquid knock-out drum. Large
centrifugal compressors are used and are usually driven by high-pressure condensing steam turbines,
or occasionally by electric motors.
4.1.2.3 Product fractionation
The chilling train usually consists of four or five successive stages of chilling, incorporating ethylene
and propylene refrigeration, as well as an elaborate self-refrigeration system. The methane stream
from the chilling unit is used as fuel gas, mostly internally in the plant’s furnaces and boilers. The
exact process flow sequence varies according to the feedstock and the design arrangement, but

EU coordinated MEthods and procedures based on Real Cases for the effective
implementation of policies and measures supporting energy efficiency in the Industry
D4.2 - Picture of efficiency projects implemented by the
Industry sector-by-sector and process-by-process
Page 11
various fractionation towers are used to separate the desired products. This may include a sequence
of de-methaniser (to further remove methane), followed by a de-ethaniser (to remove ethane,
ethylene and a small quantity of acetylene). Bottoms from the de-ethaniser are directed to the de-
propaniser and then to a de-butaniser. The lighter the feedstock, the less need for the later
separation systems. After separation, the ethylene still contains undesirable acetylene and ethane.
Acetylene is either removed by selective catalytic hydrogenation or by extractive distillation. The
separation of ethylene and ethane requires a particularly effective column due to the close proximity
of their boiling points. The ethane component may be recycled back to the cracker for re-working.
Similarly, the C3 fraction still contains methyl acetylene and propadiene after separation. Selective
hydrogenation is used to convert this into propylene and propane prior to separation in a C3 splitter.
4.2 Reforming:
4.2.1 Catalytic reforming
Figure 4: Simplified process flow scheme for a continuous catalytic reformer.
The heavy naphtha leaving the hydrotreating units is a very poor gasoline blend component due to
its low octane. The purpose of a catalytic reformer is to upgrade the octane of these streams for use
as a gasoline blendstock. The burning characteristics (octane number) of heavy naphtha are
improved significantly by catalytic reforming. The most important characteristic of the reformate
product is the octane number.
There are several catalytic reforming processes in use today. In general, they can be classified into
three categories: continuous, cyclic or semi-regenerative, depending upon the frequency of the

EU coordinated MEthods and procedures based on Real Cases for the effective
implementation of policies and measures supporting energy efficiency in the Industry
D4.2 - Picture of efficiency projects implemented by the
Industry sector-by-sector and process-by-process
Page 12
catalyst regeneration. The fixed bed or moving bed processes are used in a series of three to six
reactors.
4.2.2 Continuous catalytic regeneration (CCR) reforming process
Interheaters are needed between the reactors to provide the heat required for the endothermic
dehydrogenation reaction. As the naphtha feed charge proceeds through the reactors, the reaction
rates decrease and the reheat needed lessens. Freshly regenerated catalyst is introduced at the top
of the first reactor and flows by gravity from top to bottom. From here it is passed on to the next
reactor.
The reaction mixture from the last reactor is used to preheat the fresh feed and further cooled down
prior to being fed to the low-pressure separator. There the hydrogen-rich gas is separated from the
liquid phase. The gas is compressed and partially recycled to the naphtha feed. The remaining vapour
is then further compressed, recontacted with the liquid from the low-pressure separator, cooled and
fed to the high-pressure separator. The recompression and recontacting is included to maximise
recovery of the C3/C4 fraction from the hydrogen-rich gas stream. Any excess of this hydrogen-rich
gas is routed to the refinery hydrogen system to be used in hydrogen-consuming units like
hydrotreaters.
The CCR reforming process has a higher energy efficiency per tonne of desired product than the
semi-regenerative process, due to better yields and improved heat recovery from the products.
As the CCR process is the latest and most modern type of catalytic reformer process, it has generally
a design with a higher heat integration than the semi-regenerative process and leads to a higher
energy efficiency. Appropriate revamping of semi-regenerative units can also achieve higher energy
efficiency through the same recovery from products, from pump arounds and from integration with
the topping and vacuum.
4.3 Haber-Bosch process:
Figure 5: Schematic of the Haber-Bosch process.
EU coordinated MEthods and procedures based on Real Cases for the effective
implementation of policies and measures supporting energy efficiency in the Industry
D4.2 - Picture of efficiency projects implemented by the
Industry sector-by-sector and process-by-process
Page 13
Basically, in simple steps:
1) Hydrogen and Nitrogen are extracted and purified with all impurities removed for
the process.
2) Both gases are mixed and the mixture is pumped into a compressor. The compressor
has extreme conditions, with a pressure of 200 atm. The high pressure causes the
particles to gain kinetic energy and makes the temperature rise up to about 300
degrees Celsius. This causes the covalent bonds in the hydrogen and nitrogen
molecules to split up.
3) The compressed molecules now enter a converter (reactor). The converter is a tank
heated up to a temperature of 400-450 degrees Celsius and is pressurized at 200atm.
Inside the compressor, there are shelves of hot iron (Fe3+) to act as the catalyst.
Aluminum oxide (Al2O3) and potassium oxide (K2O) are used as promoters to increase
the catalyst's efficiency.
4) The gaseous hydrogen and nitrogen reacts on the surface of the hot iron to form
gaseous ammonia. However, some of the gases remain unreacted. In addition to the
above, the production of ammonia is a reversible reaction and so some of the
ammonia formed will decompose back to hydrogen and nitrogen gas. As a result, the
final yield is only about 12-15% of its original reactants.
5) The mixture of hydrogen, nitrogen and ammonia is then removed and cooled, where
under the right pressure, the ammonia liquiefies and is collected.
6) The unreacted hydrogen and nitrogen gases is sent back into the converter and steps
3, 4 and 5 are repeated.
4.4 Chlorine production through electrolysis
Chlorine is produced by passing an electric current through a solution of brine (common salt
dissolved in water). This process is called electrolysis. The chemical term for salt is sodium chloride
(NaCl).
In industry, elemental chlorine is usually produced by the electrolysis of sodium chloride dissolved in
water. This method, the chloralkali process industrialized in 1892, now provides most industrial
chlorine gas. The production of chlorine results in the co-products caustic soda (sodium hydroxide,
NaOH) and hydrogen gas (H2). These two products, as well as chlorine itself, are highly reactive.
Chlorine can also be produced by the electrolysis of a solution of potassium chloride, in which case
the co-products are hydrogen and caustic potash (potassium hydroxide). There are three industrial
methods for the extraction of chlorine by electrolysis of chloride solutions:
the membrane cell process, nowadays most widely used in Europe (64%),

EU coordinated MEthods and procedures based on Real Cases for the effective
implementation of policies and measures supporting energy efficiency in the Industry
D4.2 - Picture of efficiency projects implemented by the
Industry sector-by-sector and process-by-process
Page 14
the mercury cell process, being phased out worldwide because of the toxic character of
mercury (use today less than 20%) and
the diaphragm cell process (used for nearly 14% of installed capacity)
4.4.1 Membrane cell process
Figure 6: Chlorine production through membrane cell process.
The consumption of electric energy is the lowest of the three processes and the amount of steam
needed for concentration of the caustic is relatively small (less than one tonne per tonne of caustic
soda). Chlorine producers across Europe are progressively moving towards this method of making
their product as the membrane cell process is the most environmentally sound way of manufacturing
chlorine. By the end of 2015, membrane cell capacity accounted for 64% of total installed chlorine
production capacity in Europe.

EU coordinated MEthods and procedures based on Real Cases for the effective
implementation of policies and measures supporting energy efficiency in the Industry
D4.2 - Picture of efficiency projects implemented by the
Industry sector-by-sector and process-by-process
Page 15
4.4.2 Mercury cell process
In the mercury cell process, sodium forms an amalgam (a 'mixture' of two metals) with the mercury
at the cathode. The amalgam reacts with the water in a separate reactor called a decomposer where
hydrogen gas and caustic soda solution at 50% are produced.
Figure 7: Chlorine production through mercury cell process.
Of the three processes, the mercury process uses the most electricity, but no steam is required to
concentrate the caustic solution. The use of mercury demands measures to prevent environmental
contamination. Also, mercury must be removed from the hydrogen gas and caustic soda solution.
Mercury losses have been considerably reduced over the years. Increasingly, chlorine producers are
moving towards membrane technology, which has much less impact on the environment.

EU coordinated MEthods and procedures based on Real Cases for the effective
implementation of policies and measures supporting energy efficiency in the Industry
D4.2 - Picture of efficiency projects implemented by the
Industry sector-by-sector and process-by-process
Page 16
In 2015, emissions for all mercury cells across Western Europe reached 0.68 grammes per tonne of
chlorine capacity, slightly higher than the all-time low of 0.74 grammes per tonne of chlorine capacity
in 2014.
Today, twenty-three mercury-based chlorine plants remain to be phased out or converted to non-
mercury technology at a cost of more than 3,000 million €. These plants account for an ever
decreasing part (less than 20% in 2015) of European chlorine capacity.
4.4.3 Diaphragm cell process
In the diaphragm cell process the anode area is separated from the cathode area by a permeable
diaphragm. The brine is introduced into the anode compartment and flows through the diaphragm
into the cathode compartment.
Figure 8: Chlorine production through diaphgram cell process.
In 2015, the diaphragm process accounted for less than 14% of total installed European chlorine
production capacity.
EU coordinated MEthods and procedures based on Real Cases for the effective
implementation of policies and measures supporting energy efficiency in the Industry
D4.2 - Picture of efficiency projects implemented by the
Industry sector-by-sector and process-by-process
Page 17
5 Energy intensity of key processes
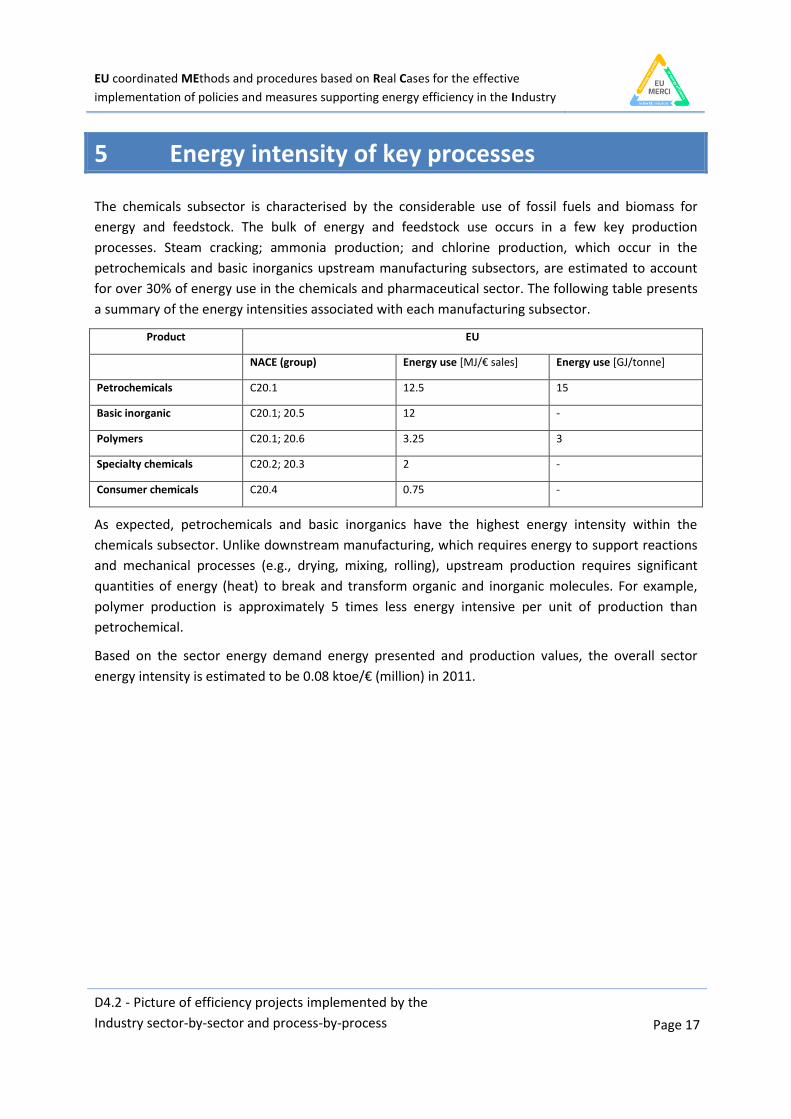
The chemicals subsector is characterised by the considerable use of fossil fuels and biomass for
energy and feedstock. The bulk of energy and feedstock use occurs in a few key production
processes. Steam cracking; ammonia production; and chlorine production, which occur in the
petrochemicals and basic inorganics upstream manufacturing subsectors, are estimated to account
for over 30% of energy use in the chemicals and pharmaceutical sector. The following table presents
a summary of the energy intensities associated with each manufacturing subsector.
Product EU
NACE (group) Energy use [MJ/€ sales] Energy use [GJ/tonne]
Petrochemicals C20.1 12.5 15
Basic inorganic C20.1; 20.5 12 -
Polymers C20.1; 20.6 3.25 3
Specialty chemicals C20.2; 20.3 2 -
Consumer chemicals C20.4 0.75 -
As expected, petrochemicals and basic inorganics have the highest energy intensity within the
chemicals subsector. Unlike downstream manufacturing, which requires energy to support reactions
and mechanical processes (e.g., drying, mixing, rolling), upstream production requires significant
quantities of energy (heat) to break and transform organic and inorganic molecules. For example,
polymer production is approximately 5 times less energy intensive per unit of production than
petrochemical.
Based on the sector energy demand energy presented and production values, the overall sector
energy intensity is estimated to be 0.08 ktoe/€ (million) in 2011.
EU coordinated MEthods and procedures based on Real Cases for the effective
implementation of policies and measures supporting energy efficiency in the Industry
D4.2 - Picture of efficiency projects implemented by the
Industry sector-by-sector and process-by-process
Page 18
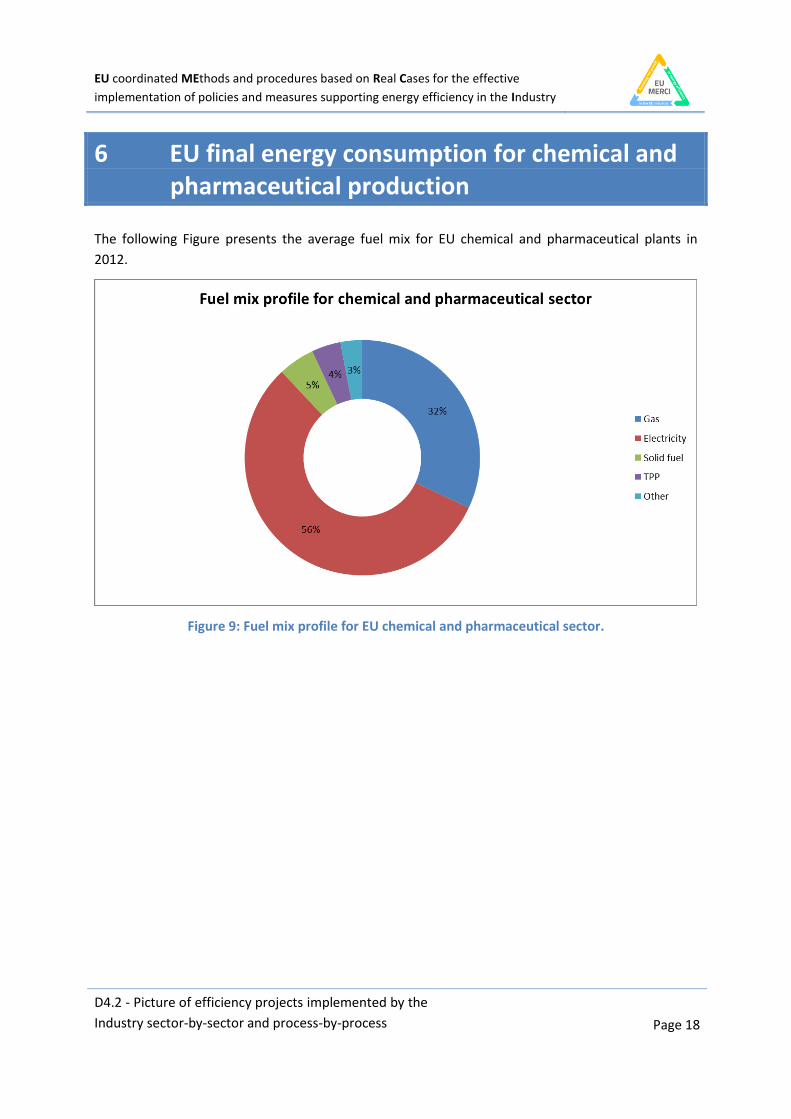
6 EU final energy consumption for chemical and pharmaceutical production
The following Figure presents the average fuel mix for EU chemical and pharmaceutical plants in
2012.
Figure 9: Fuel mix profile for EU chemical and pharmaceutical sector.

EU coordinated MEthods and procedures based on Real Cases for the effective
implementation of policies and measures supporting energy efficiency in the Industry
D4.2 - Picture of efficiency projects implemented by the
Industry sector-by-sector and process-by-process
Page 19
Figure 10: Electricity use profile in chemical and pharmaceutical sector.
Figure 11: Natural gas use profile in chemical and pharmaceutical sector.

EU coordinated MEthods and procedures based on Real Cases for the effective
implementation of policies and measures supporting energy efficiency in the Industry
D4.2 - Picture of efficiency projects implemented by the
Industry sector-by-sector and process-by-process
Page 20
Figure 12: Petroleum products use profile in chemical and pharmaceutical sector.
Figure 13: Coal use profile in chemical and pharmaceutical sector.

EU coordinated MEthods and procedures based on Real Cases for the effective
implementation of policies and measures supporting energy efficiency in the Industry
D4.2 - Picture of efficiency projects implemented by the
Industry sector-by-sector and process-by-process
Page 21
Figure 14: Energy use profile for other sources (i.e., biomass) in chemical and pharmaceutical
sector.