Embed Size (px)
Citation preview
Understanding the market Technical Analysis Approach: part I
Xiaoguang Wang President, Purdue Quantitative Finance Club
PhD Candidate, Department of Statistics
Purdue University

Outline
• Why Technical Analysis? • Philosophy of technical analysis • Fundamental assumptions • Definitions of trend, support and resistance • Different Charting styles • Reversal and Continuation patterns • Principle of Confirmation and Divergence • MetaTrader4 introduction • Conclusion

Question: How to trade successfully in the market?
• Profits significantly out-beat risk-free rate or the return of market index
• Statistically stable performance in a long run
• The “worst” loss is still affordable
“Trading formula”
• Expected profits = (Target price – entry price)*P{success} – (Entry price – stop price)*P{failure}
• Decision making:
Determine (Entry price, Target price, Stop Price) such that the expected profits can be maximized.
The role of Technical Analysis
• Help you make the selection among the three choices at any fixed time t:
1. Open a position
2. Close a position
3. Do nothing

The history of Technical Analysis
• Dow Theory: Charles H. Dow published the first stock market average on July 3, 1884.
The ABC of Stock Speculation, S.A. Nelson, 1903. (The first book the term “Dow Theory” was used.) Dow Theory, Robert Rhea, 1932. • Elliott Wave Theory: The wave principle was published in 1938 by Charles J. Collins, which was based on the original work of Ralph Nelson Elliott. • William D. Gann: Geometric angels and percentages. Most
work was published during the 1950s and ’60s. • For more information:
http://history.technicalanalysis.org.uk/

Philosophy of Technical Analysis
• Market action discounts everything.
• Prices move in trends: A trend in motion is more likely to continue than to reverse. (An adaptation of Newton’s first law of motion.)
• History repeats itself.
Basic foundations behind technical analysis
• Price discounts everything
• Price movements are not totally random
• The market has Three trends (Dow)
• Major trends have three phase (Dow)
• Volume must confirm the trend
• A trend is assumed to be in effect until it gives definite signals that it has reversed
• The market is more psychological than logical
Doubts and Criticisms
• The doubts and criticisms have a history as long as that of the theory:
Can the past be used to predict the future?
Signals are always too late?
Analyst Bias: subjective interpretation; art vs. science
Trader’s Remorse: Not all signals and patterns work
Always another level: Bullish or Bearish?

Description vs. Prediction
• “What” is more important than “why”!
• Technical analysis at least is an effective description of the market prices. It helps us know what the market is saying at the moment.
• It is a popular language used by traders to describe the market.

Definitions
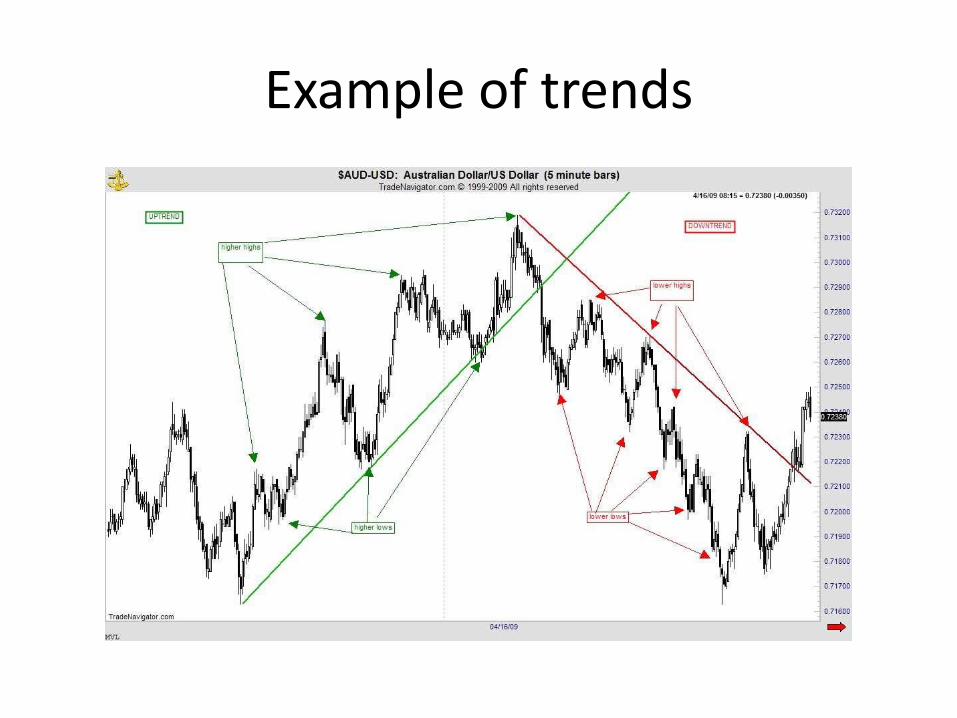
• Trend: An upper trend is a series of successively higher peaks and troughs; a downtrend is just the opposite, while horizontal peaks and troughs would identify a sideways price trend (trendless).
Remark: It is the direction of those peaks and troughs that constitutes market trend.
Example of trends
Support and resistance
• Support is a level or area on the chart under the market where buying interest is sufficiently strong to overcome selling pressure and a decline is halted and prices turn back up.
• Resistance is a level or area over the market where selling pressure overcomes buying pressure and a price advance is turned back.
• Tested support and resistance are more reliable. • Previous peaks and troughs are potential supports and
resistances. Some other candidates can be those levels or areas indicated by indicators such as MA, trend channels, percentages and so on.
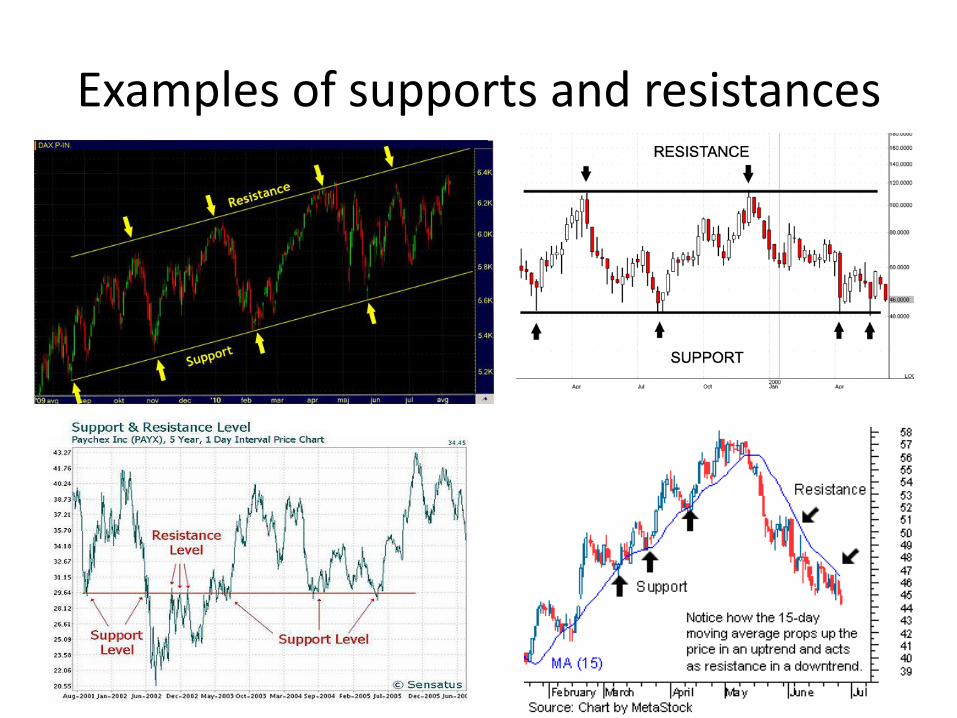
Examples of supports and resistances
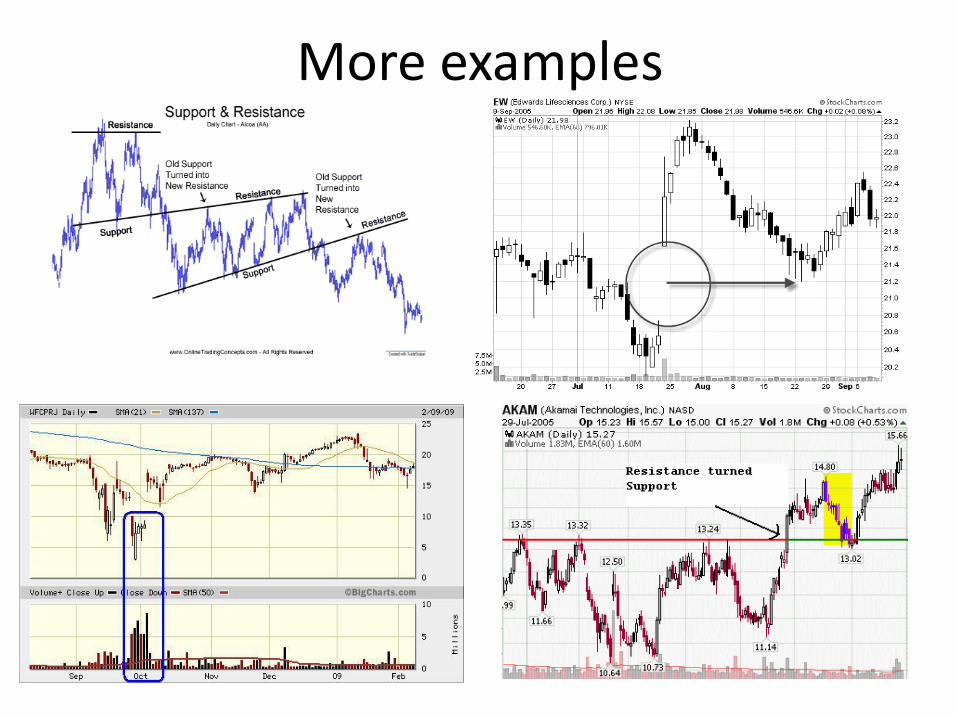
More examples
Remarks on supports and resistance
• Finding supports and resistance plays the key role of technical analysis. This is the hardest part in developing a trading strategy based on technical analysis.
• All the indicators and tools are to help you in two perspectives:
1. evaluate the strength of potential supports and resistances.
2. evaluate the spot probability of price going up vs. going down at the moment.
• Good trading opportunities are those levels that satisfy the 3:1 rule and have a high odds ratio.
Charting
• Ways to describe or plot the market prices. • Different types of charts: Bar Chart Candle-stick Chart Point and Figure (OX chart) Market profile Pro-Sticks chart • Goal: keep the basic trend or shape of historical
prices while omit most prices that not “important” in technical analysis perspective.
Good references
• Candlestick: http://www.blackswanfx.blogspot.com/
• OX Chart:
http://stockcharts.com/school/doku.php?id=chart_school:chart_analysis:pnf_charts
• Market Profile
http://www.trading-naked.com/MarketProfile.htm
• ProStick
http://www.prosticks.com

Bar Chart and Candlestick Chart

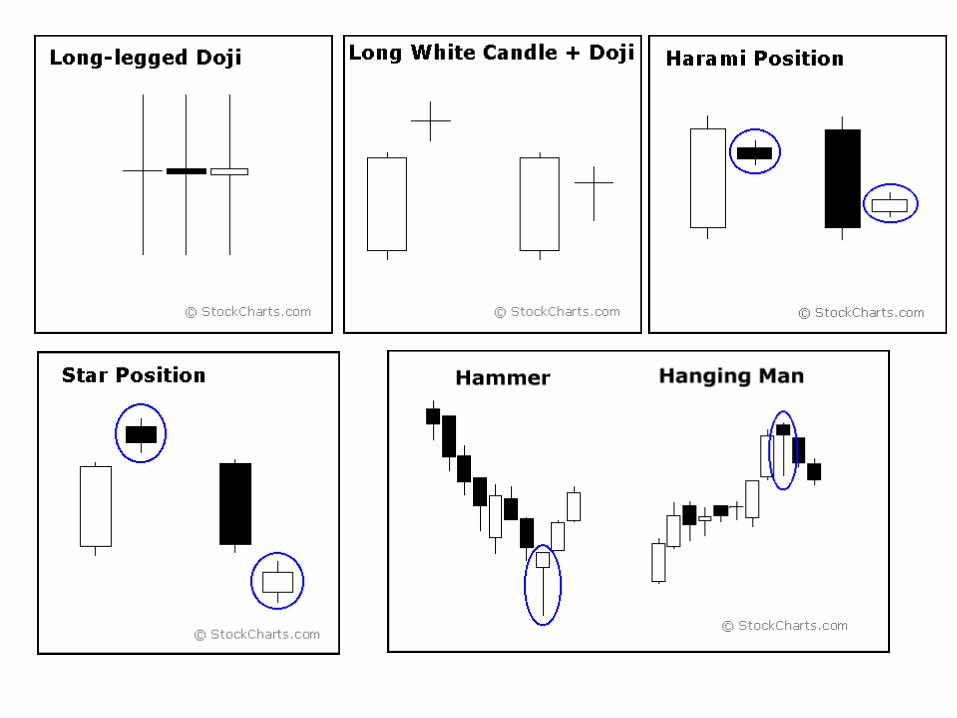
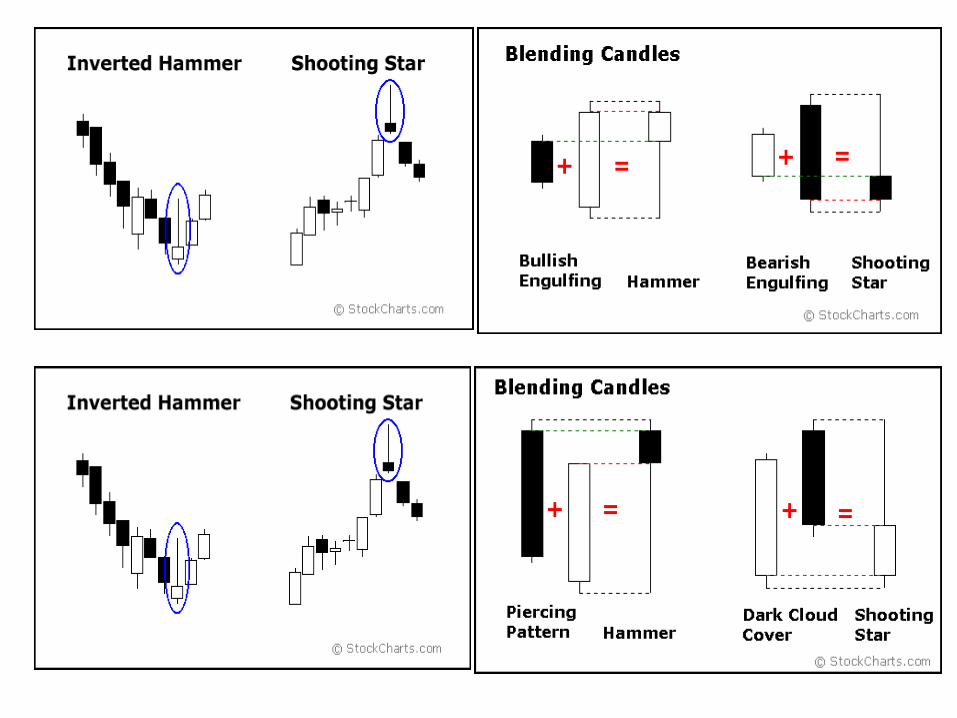
Candle types
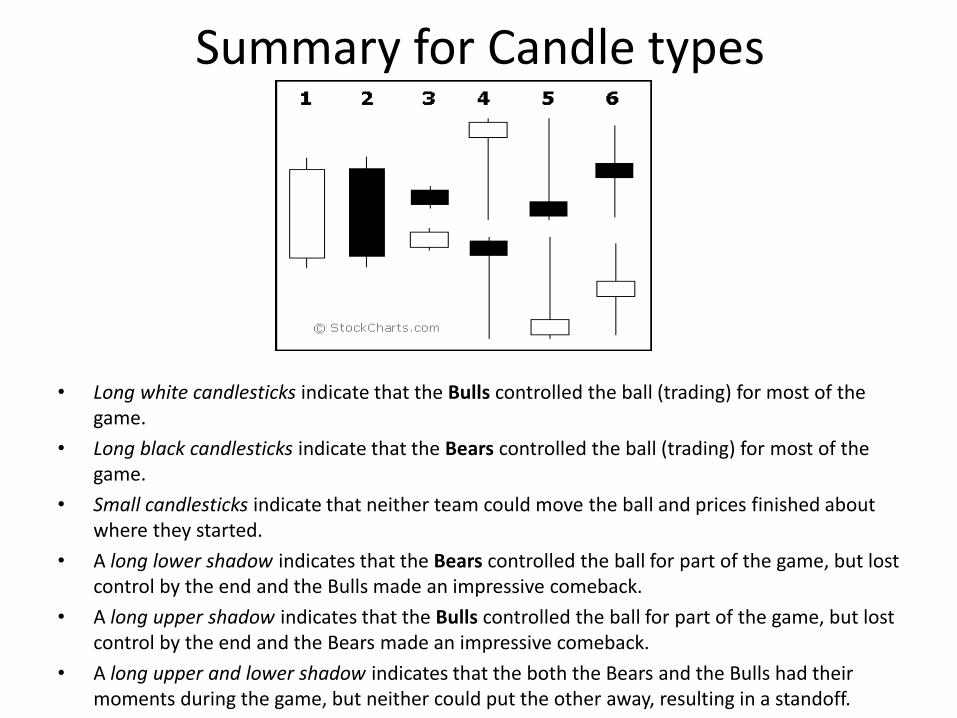
Summary for Candle types
• Long white candlesticks indicate that the Bulls controlled the ball (trading) for most of the game.
• Long black candlesticks indicate that the Bears controlled the ball (trading) for most of the game.
• Small candlesticks indicate that neither team could move the ball and prices finished about where they started.
• A long lower shadow indicates that the Bears controlled the ball for part of the game, but lost control by the end and the Bulls made an impressive comeback.
• A long upper shadow indicates that the Bulls controlled the ball for part of the game, but lost control by the end and the Bears made an impressive comeback.
• A long upper and lower shadow indicates that the both the Bears and the Bulls had their moments during the game, but neither could put the other away, resulting in a standoff.
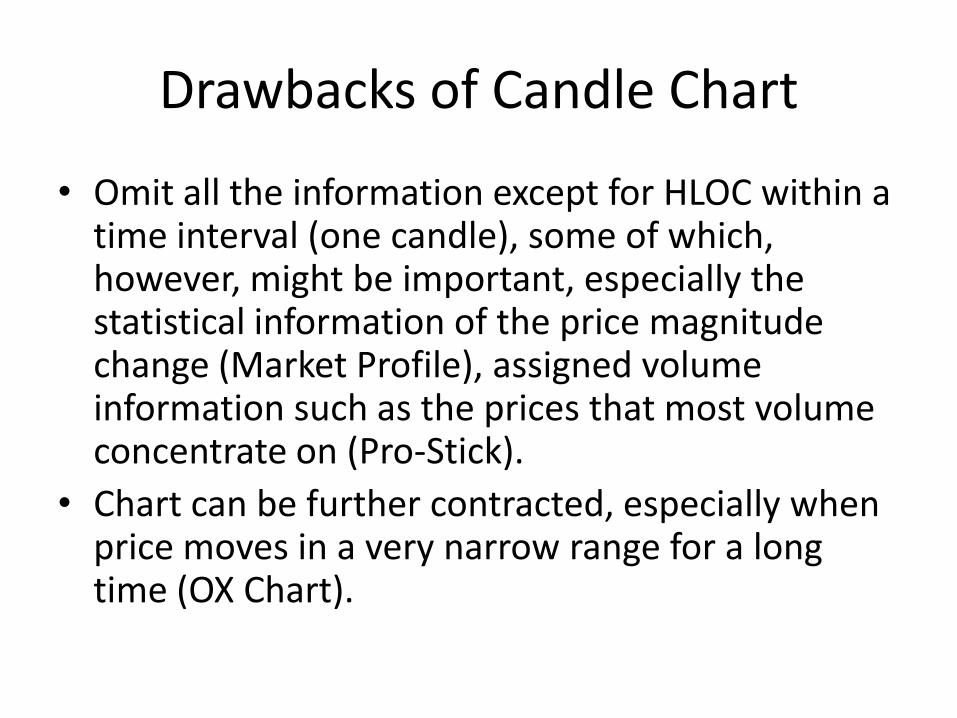
Drawbacks of Candle Chart
• Omit all the information except for HLOC within a time interval (one candle), some of which, however, might be important, especially the statistical information of the price magnitude change (Market Profile), assigned volume information such as the prices that most volume concentrate on (Pro-Stick).
• Chart can be further contracted, especially when price moves in a very narrow range for a long time (OX Chart).
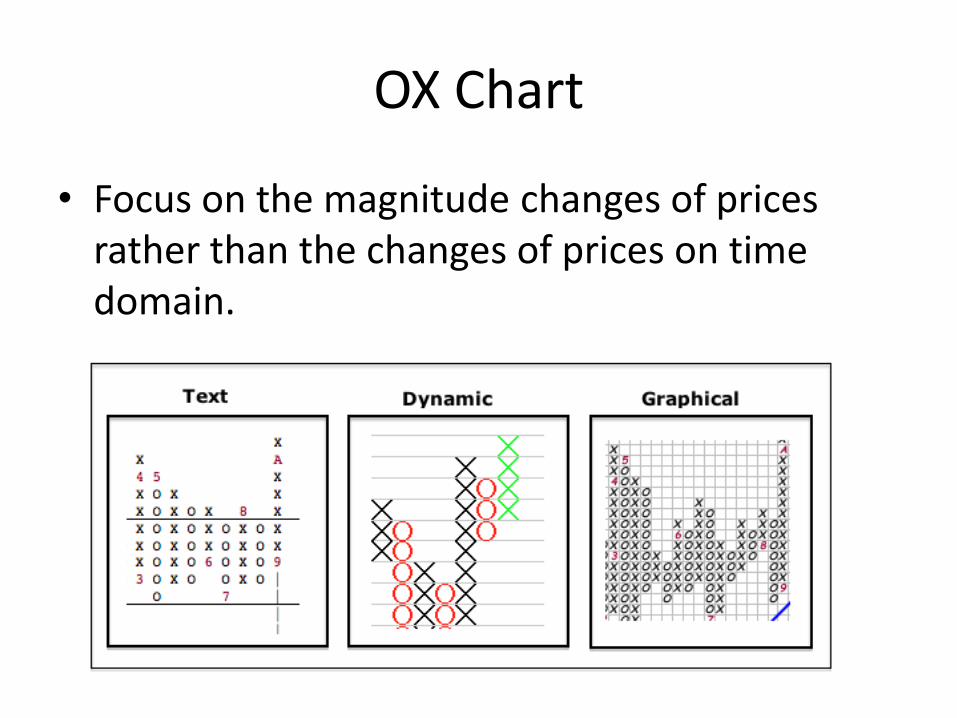
OX Chart
• Focus on the magnitude changes of prices rather than the changes of prices on time domain.

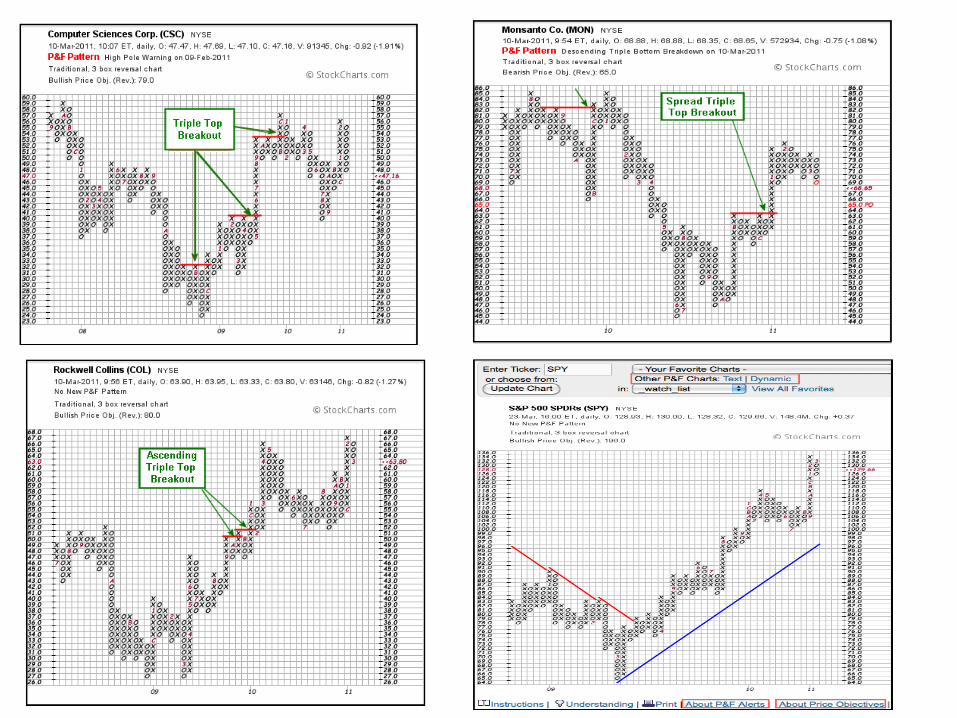
More on OX Chart • You can apply similar patterns used in
candlesticks chart to the OX chart
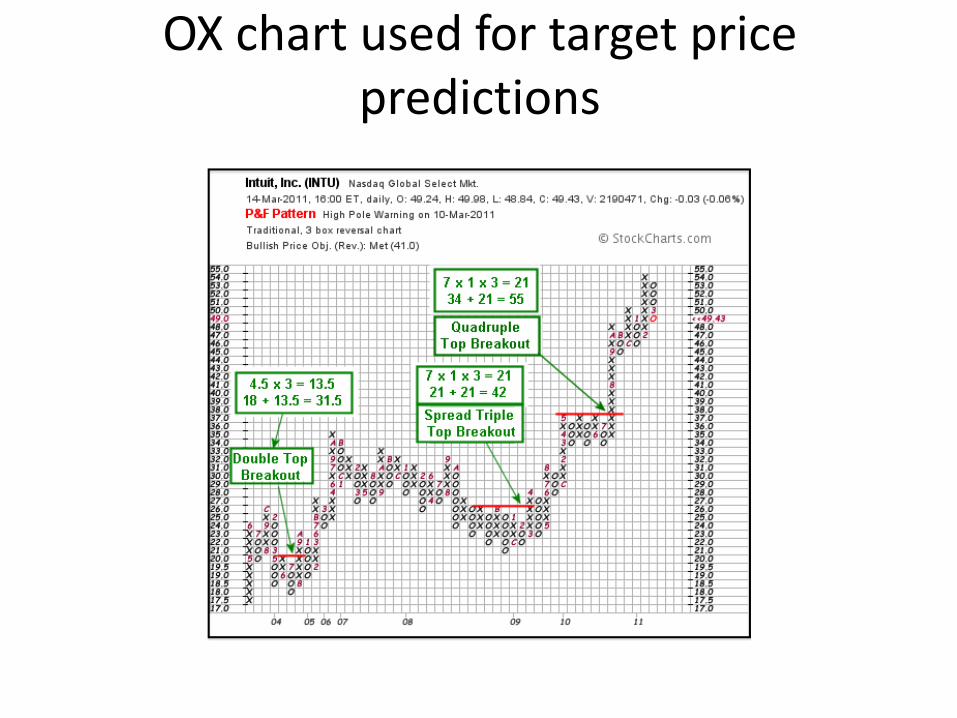
OX chart used for target price predictions
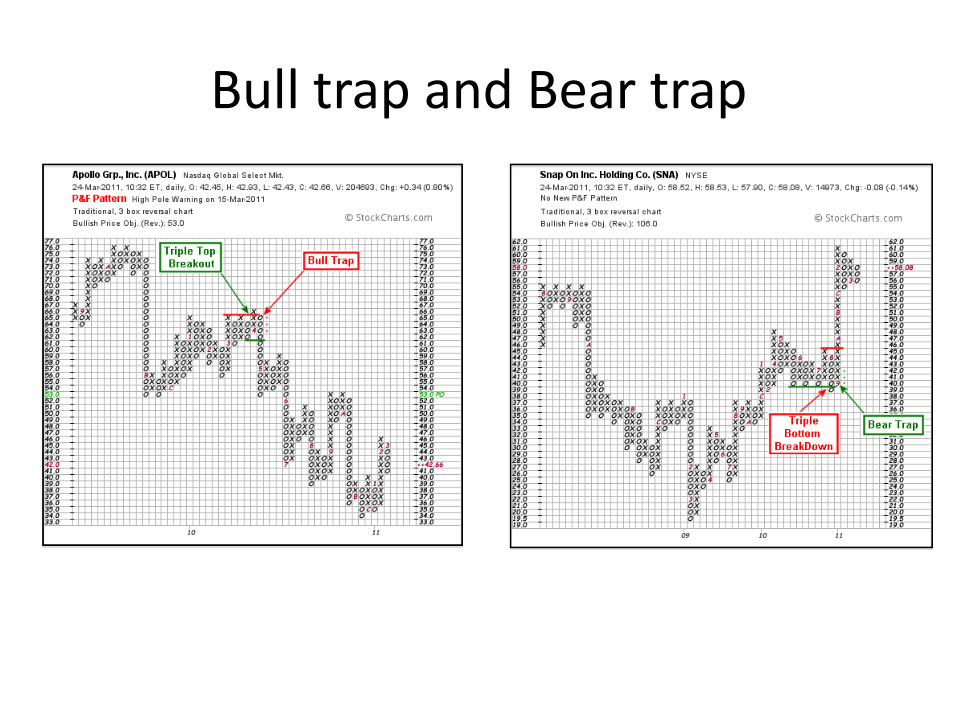
Bull trap and Bear trap
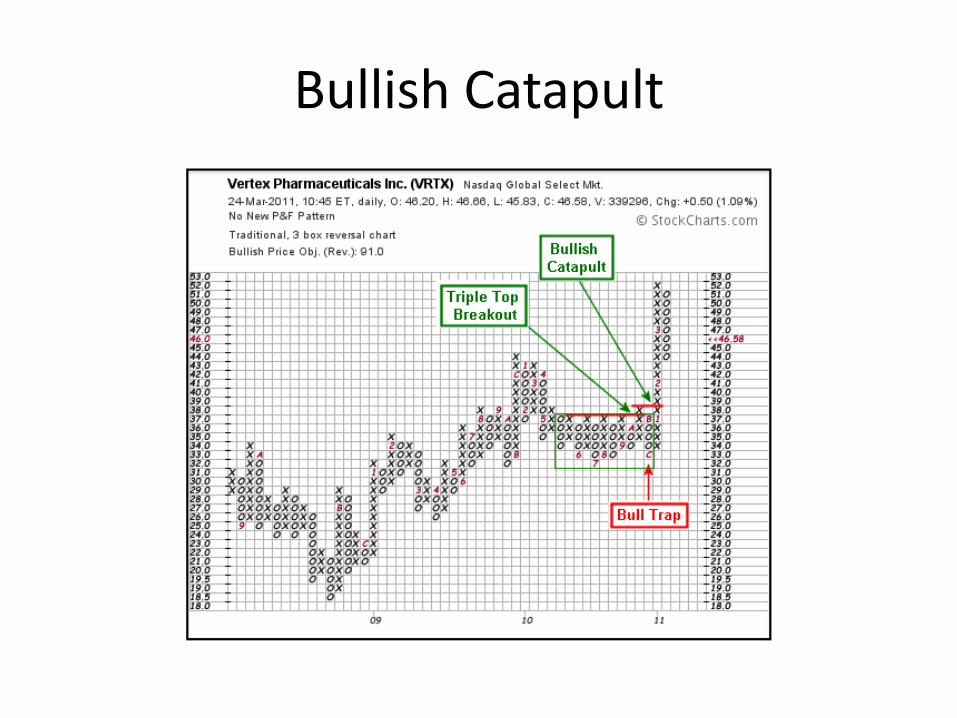
Bullish Catapult

Summary for OX Chart
• Filter insignificant price movements and noise
• Focus on important price movements
• Remove the time aspect from the analysis process
• Make support/resistance levels much easier to identify
• Provide automatic and subjective trendlines

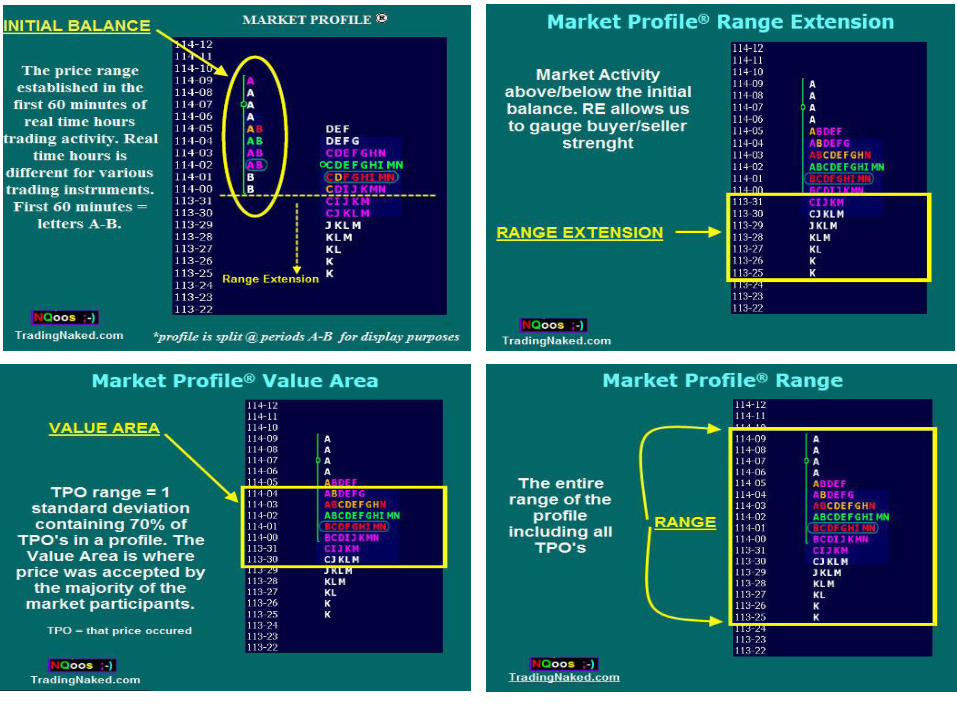
Market Profile
• A chart that displays market data using Time Price Opportunities (TPOs). A TPO is a price that the market traded at during a specific period. The typical market profile chart splits the trading day into thirty minute segments or periods. The market data for each period is displayed on the basis of a normal distribution.
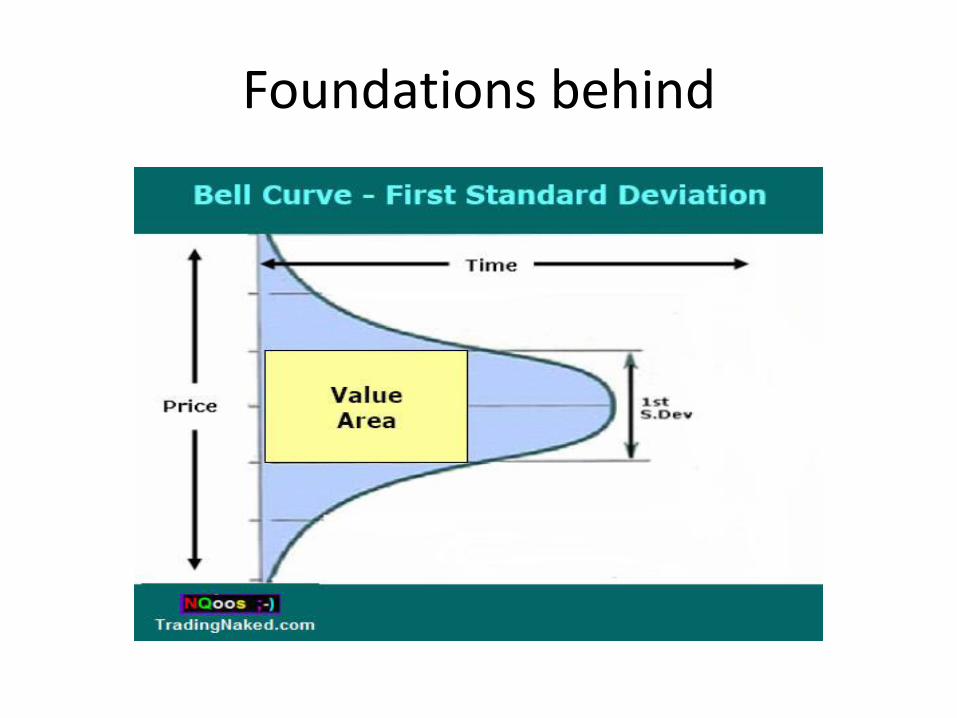
Foundations behind
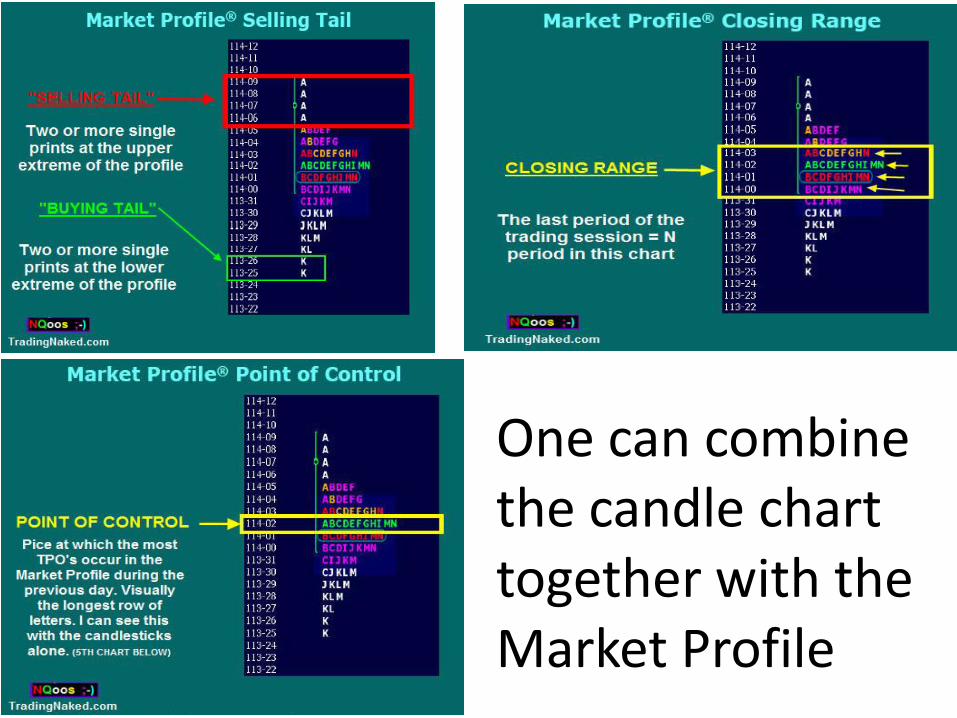
One can combine the candle chart together with the Market Profile

Combination

Summary on Market Profile
• Focus on the time-based distributional information of price changes within a time interval
• More detailed version of Candle chart
• Still not directly reflect much on the assigned volume information of the price changes
Pro-Stick
• The introduction of ProSticks attempts to reduce the limitations of Market Profile and other technical analysis and charting tools while, at the same time, integrates the elements of volume and time into traditional technical analysis and charting.
• ProSticks has two variations: ProSticks-By-Time and ProSticks-By-Volume

ProStick-by-Time & ProStick-by-Volume
• The Modal Point in a ProStick bar represents the most heavily transacted price for the particular time interval.
• ProSticks-By-Time calculates the Modal Point similar to the way Market Profile builds its bell-curve distribution. The Modal Point is then simply the price with the most number of transacted 5-minute intervals for all transacted prices in the trading interval
• ProSticks-By-Volume calculates the Modal Point simply by taking the most heavily traded price for the trading day (or other trading intervals). The Modal Point is thus the price that had the most shares traded for that particular day.
• The Active Range for both ProSticks-By-Time and ProSticks-By-Volume is computed by first calculating the mean of the entire distribution. Then the first standard deviation away from the mean in either direction is added together to form the Active Range. The Active Range equals approximately 68 percent of the entire distribution
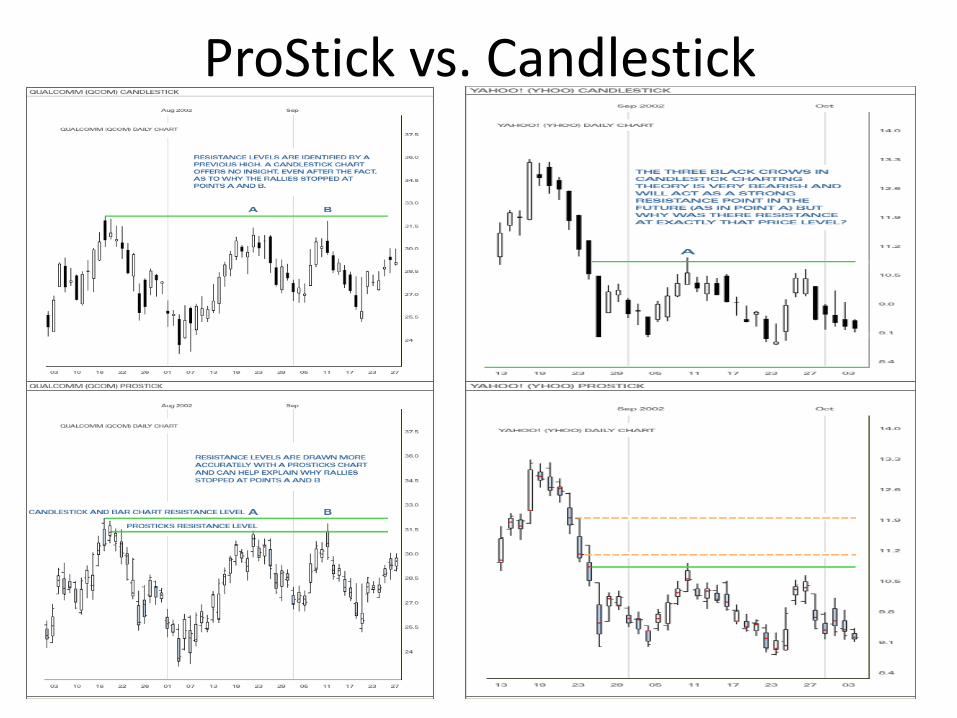
ProStick vs. Candlestick


Summary for ProStick
• Combine the advantages of both Candlestick and Market Profile
• Help to more accurately find support and resistant points
• Can be used to confirm or deny signals indicated by candlestick theories
• It is more reasonable to take Modal Point as reference compared to close price or H/L price when do technical analysis.
Price Patterns
• Classification and description of sideways market movements
• Market price curve = trend_1 + pattern_1 + trend_2 + pattern_2 +…+ trend_i + pattern_i +….
• Reversal Patterns & Continuation Patterns • Volume often plays an important role in
determining the reliability of patterns • Most price patterns also have certain measuring
techniques that help determine the minimum price objectives.
Reversal Patterns
• A prerequisite for any reversal pattern is the existence of a prior trend
• The first signal of an impending trend reversal is often the breaking of an important trendlines
• The larger the pattern, the greater the subsequent move
• Topping patterns are usually shorter in duration and more volatile than bottoms
• Bottoms usually have smaller price ranges and take longer to build
• Volume is usually more important on the upside
Major reversal patterns
• The Head and Shoulder (H&S)
• Triple tops and bottoms
• Double tops and bottoms
• Spike (V) tops and bottoms
• Rounding pattern
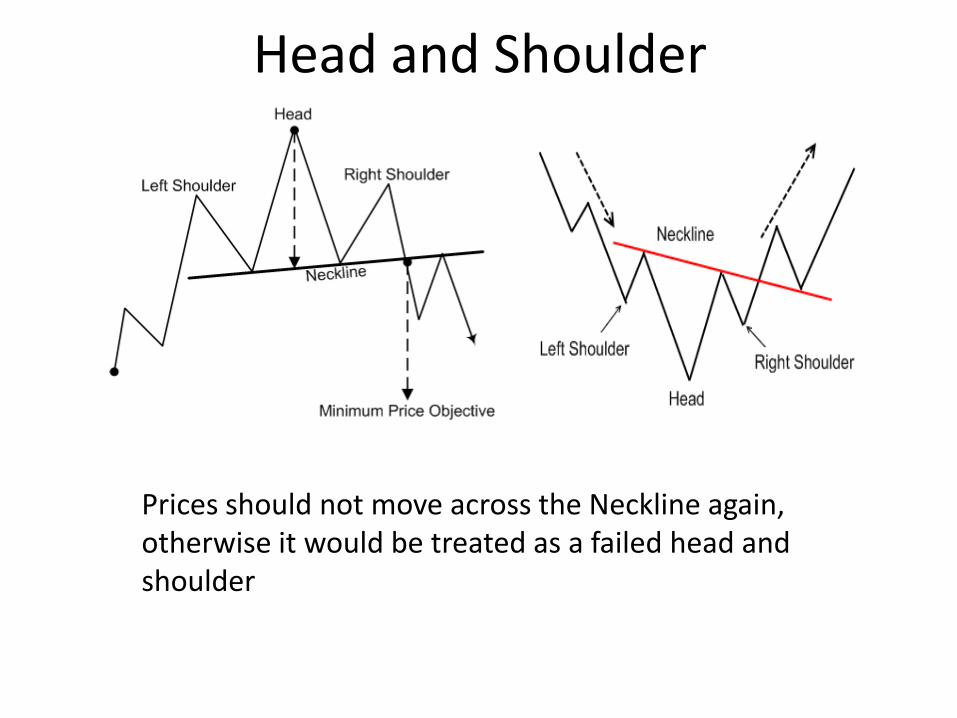
Head and Shoulder
Prices should not move across the Neckline again, otherwise it would be treated as a failed head and shoulder
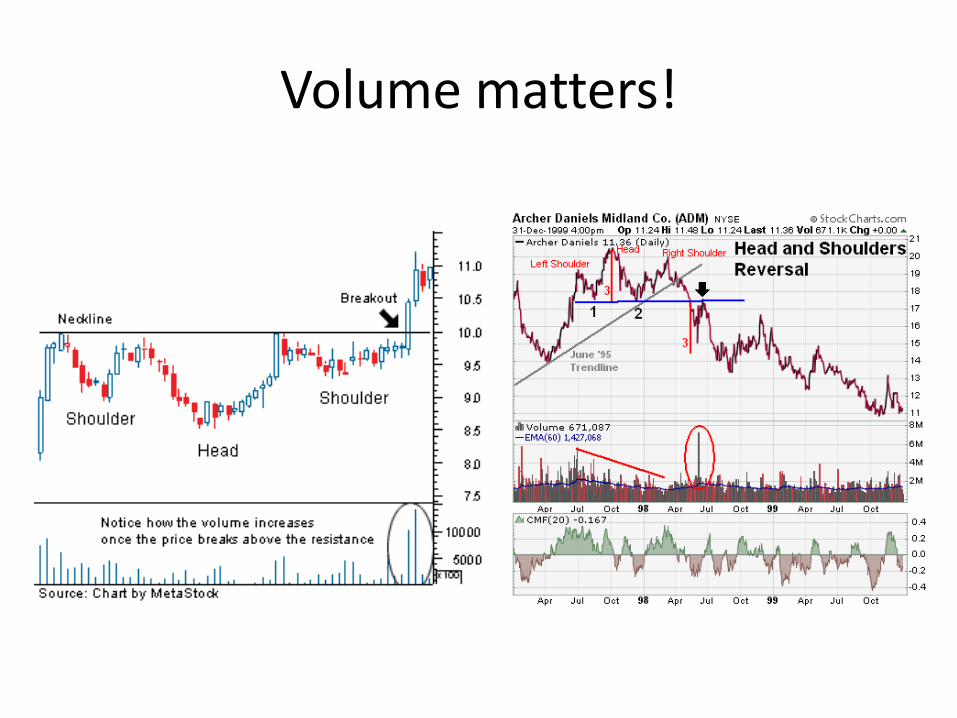
Volume matters!
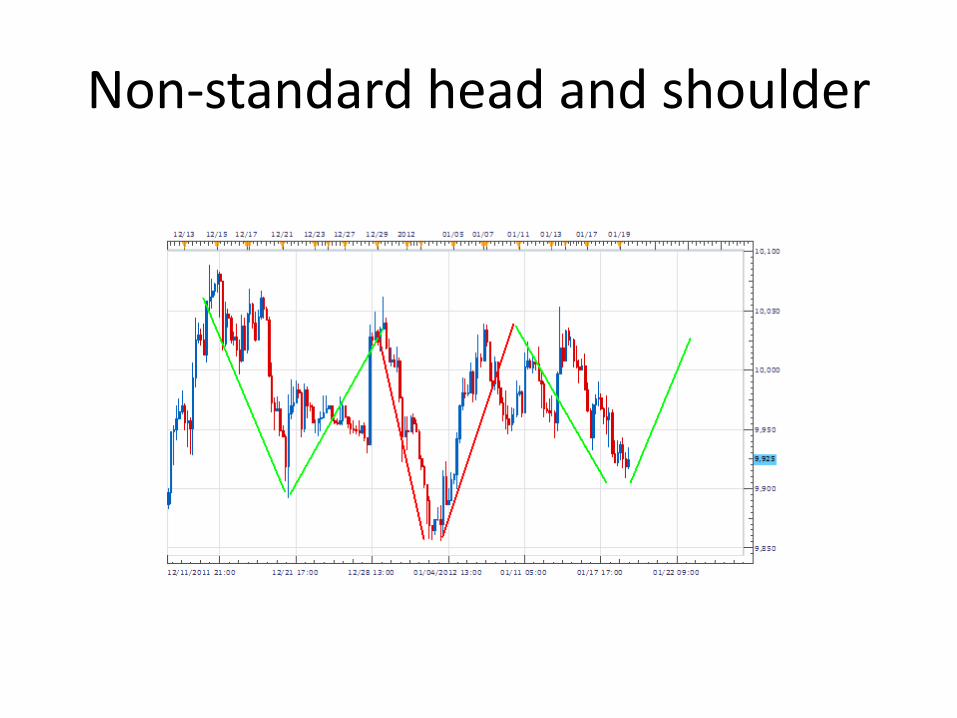
Non-standard head and shoulder

Triple Tops and Bottoms
• A slight variation of “head and shoulder”
• The volume tends to decline with each successive peak at the top and should increase at the breakdown point.
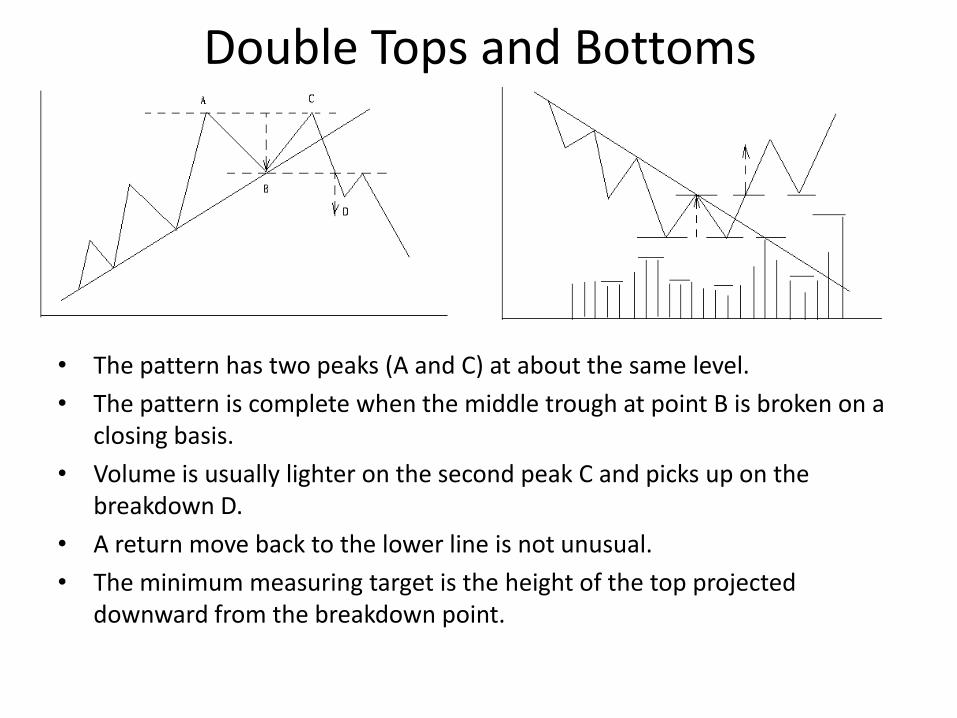
Double Tops and Bottoms
• The pattern has two peaks (A and C) at about the same level.
• The pattern is complete when the middle trough at point B is broken on a closing basis.
• Volume is usually lighter on the second peak C and picks up on the breakdown D.
• A return move back to the lower line is not unusual.
• The minimum measuring target is the height of the top projected downward from the breakdown point.

Extensions: Divergence
• Sometimes the second or third peak can be significantly higher than the previous peak, thus a “double or triple top pattern” fails.
• But this still can be treated as a reversal pattern as there is obvious evidence of “divergence” between the price curve and some indicator such as MACD.
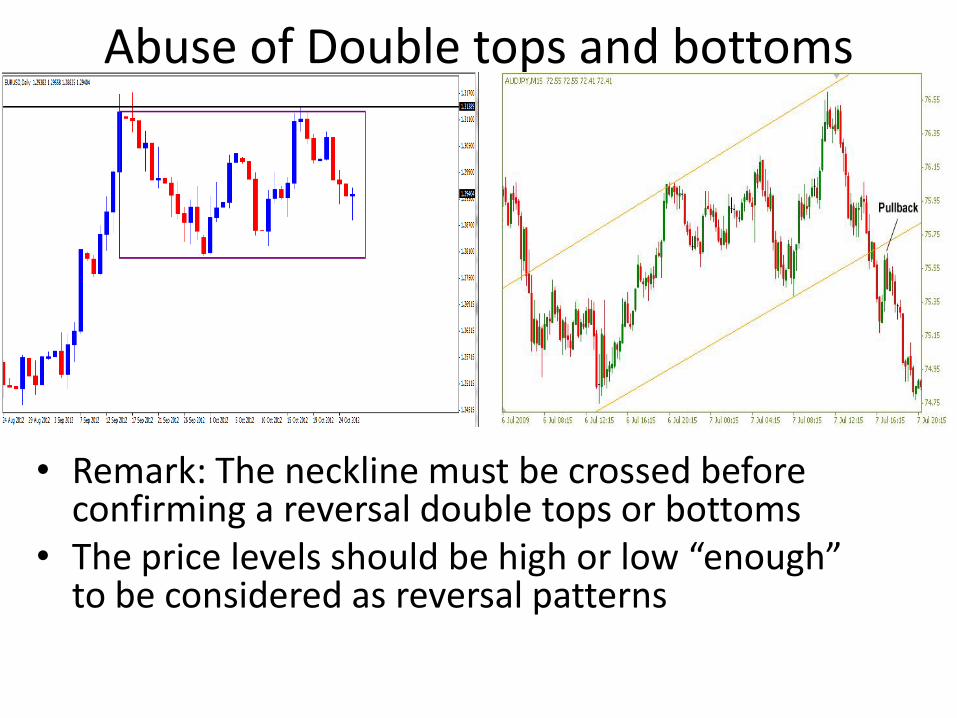
Abuse of Double tops and bottoms
• Remark: The neckline must be crossed before confirming a reversal double tops or bottoms
• The price levels should be high or low “enough” to be considered as reversal patterns
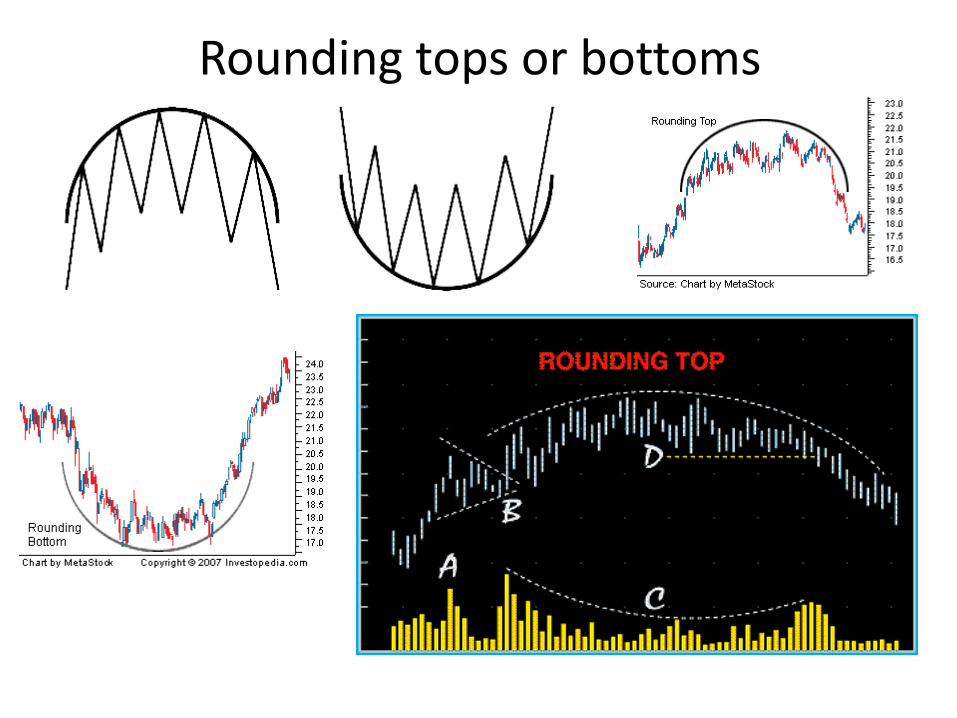
Rounding tops or bottoms

Spike (V) Tops and Bottoms

Continuation patterns
• These patterns usually indicate that the sideways price action on the chart in nothing more than a pause in the prevailing trend and the next move will be in the same direction as the trend that preceded the formation.
• Continuation patterns are usually shorter-term in duration and are more accurately classified as near-term or intermediate patterns.

Triangles
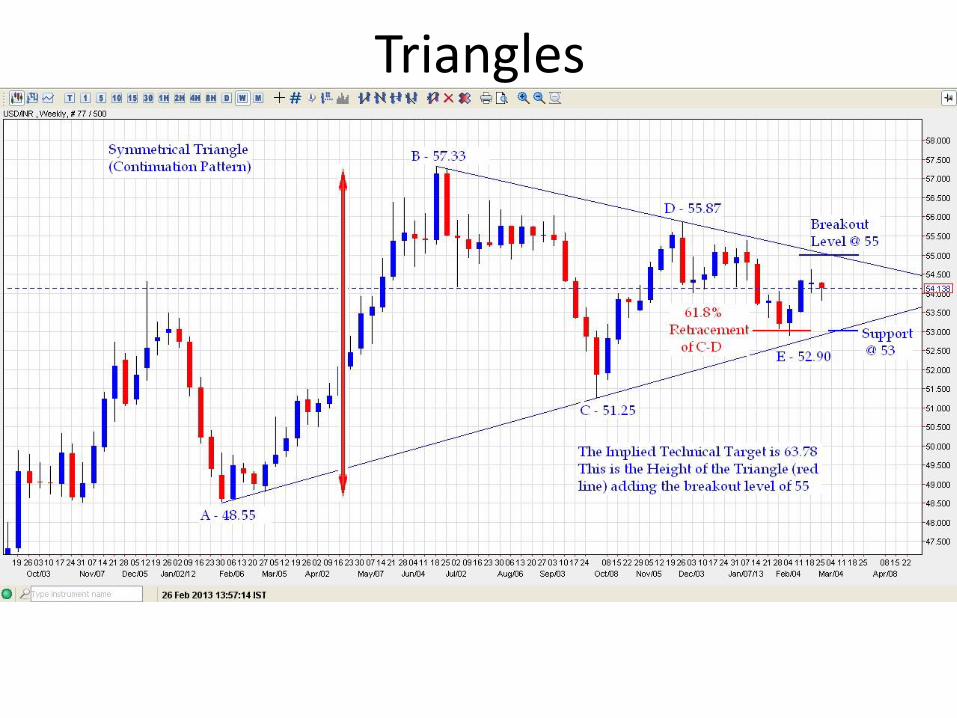
Triangles
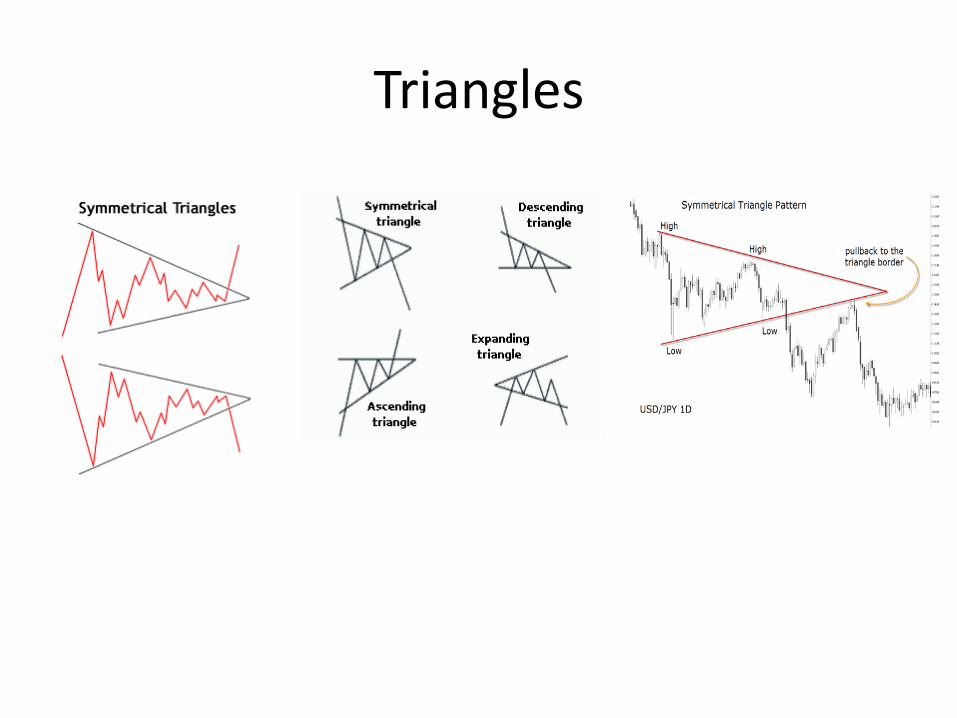
Triangles
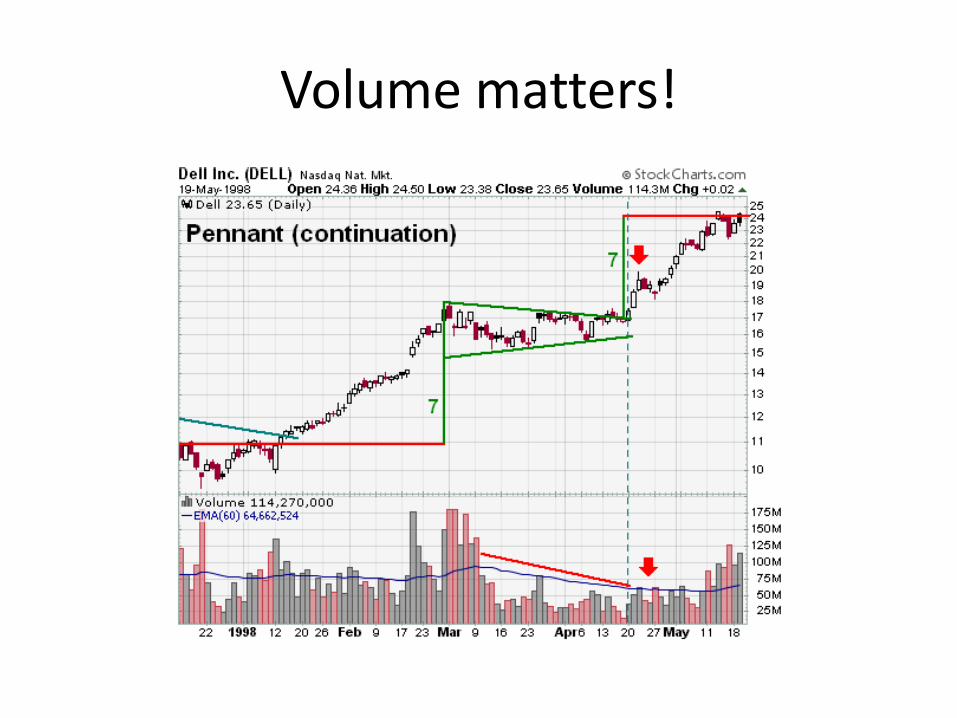
Volume matters!

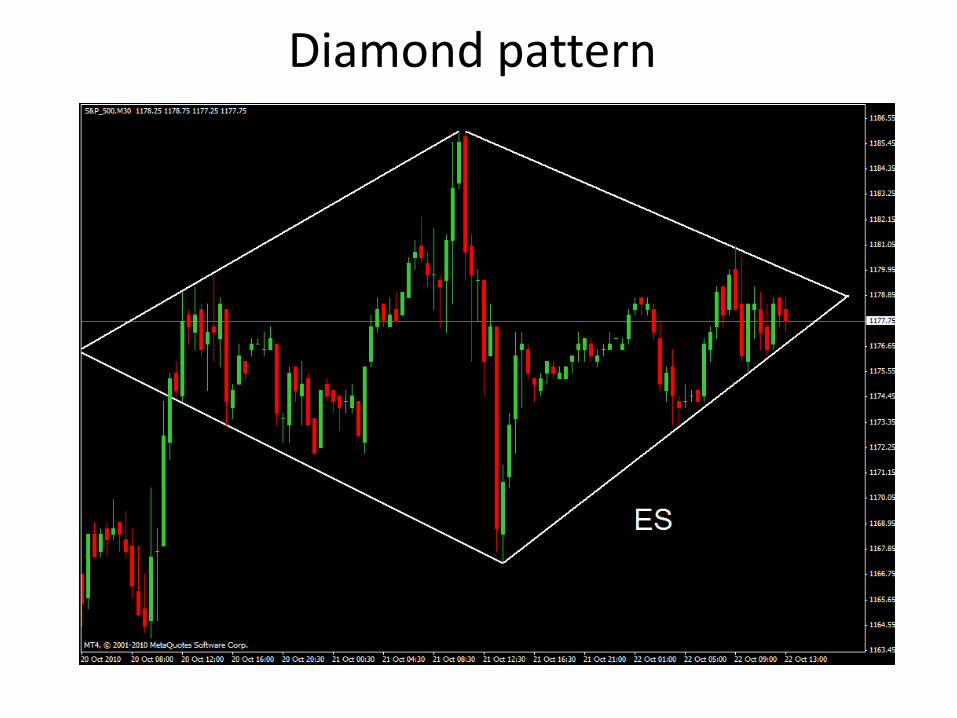
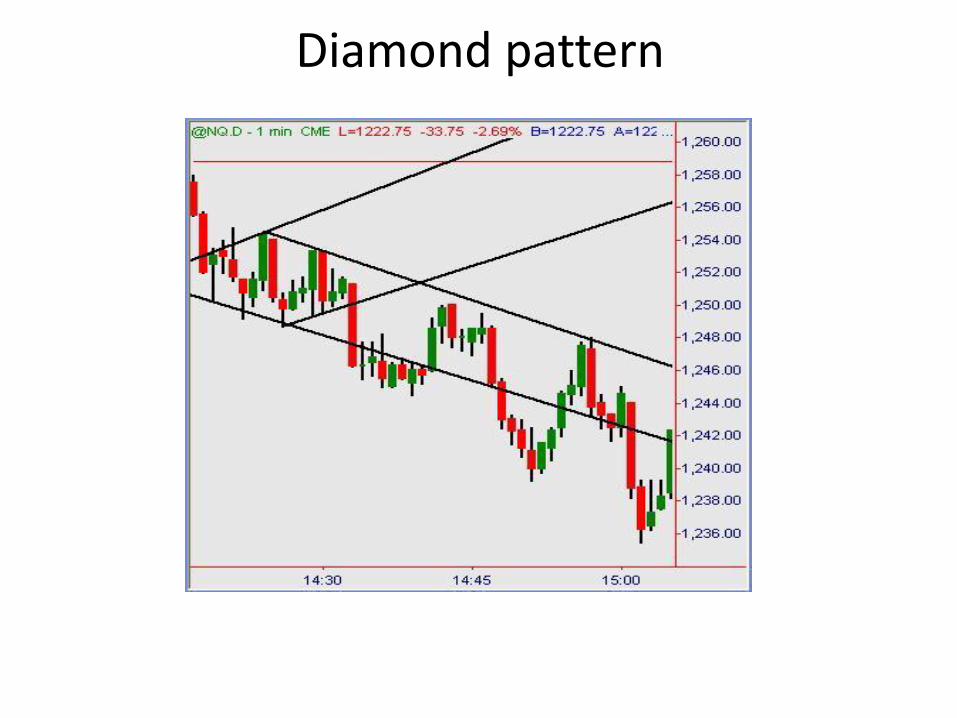
Diamond pattern
• Broadening pattern + Triangle
• Mainly considered as continuation pattern, but can show up at the bottom or top
• Bullish or Bearish prediction depends on the breakout direction
• Profit target is the height of the diamond

Diamond pattern
Diamond pattern
Diamond pattern
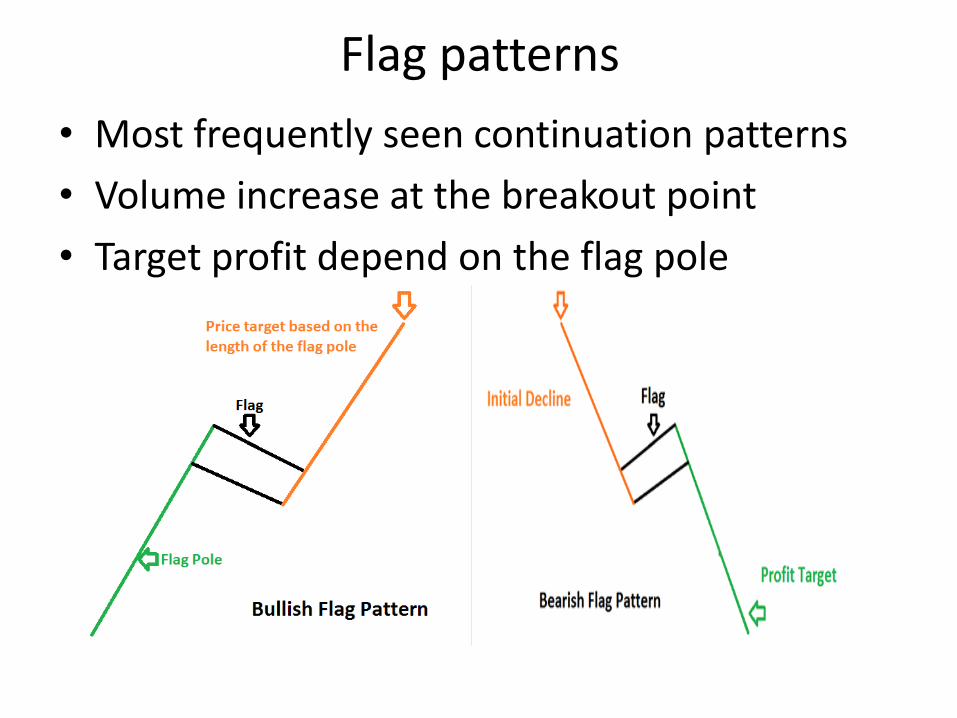
Flag patterns
• Most frequently seen continuation patterns
• Volume increase at the breakout point
• Target profit depend on the flag pole
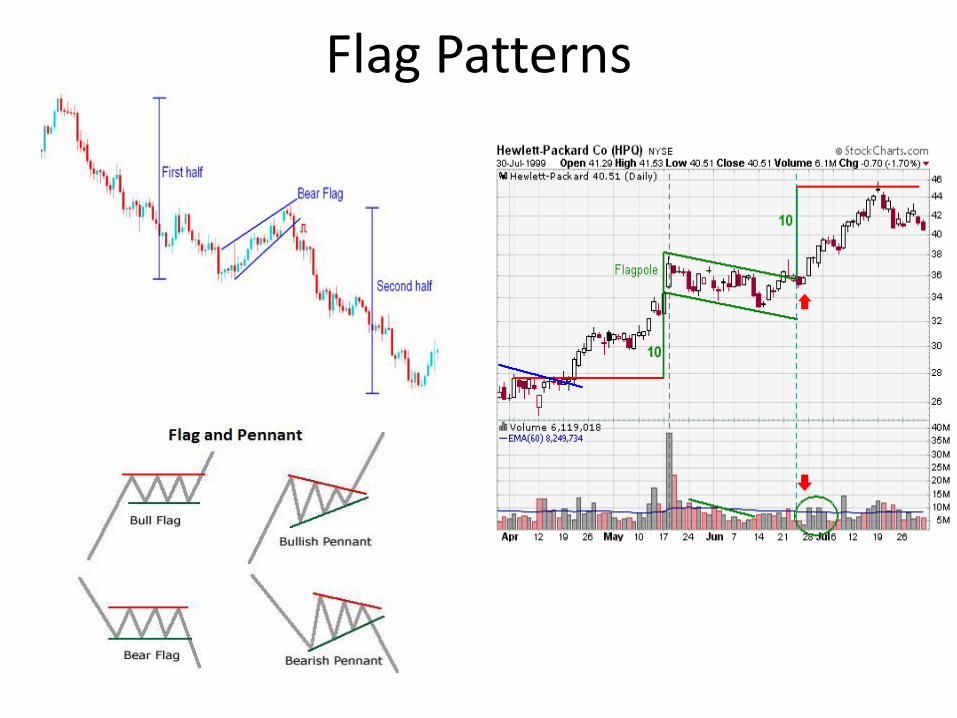
Flag Patterns
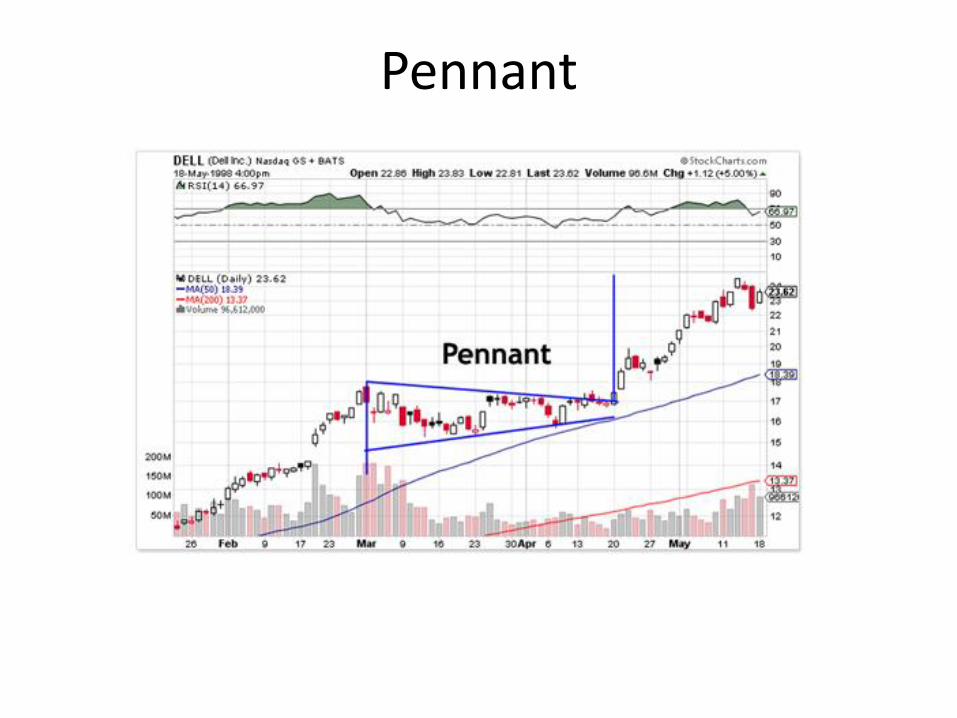
Pennant
Rectangle
• A flat flag sometimes can be treated as a rectangle pattern.
• The rectangle pattern usually shows up on long term chart (daily or monthly chart).
• The volume pattern of rectangle is different from other continuation patterns since rectangle usually have wider price swings.
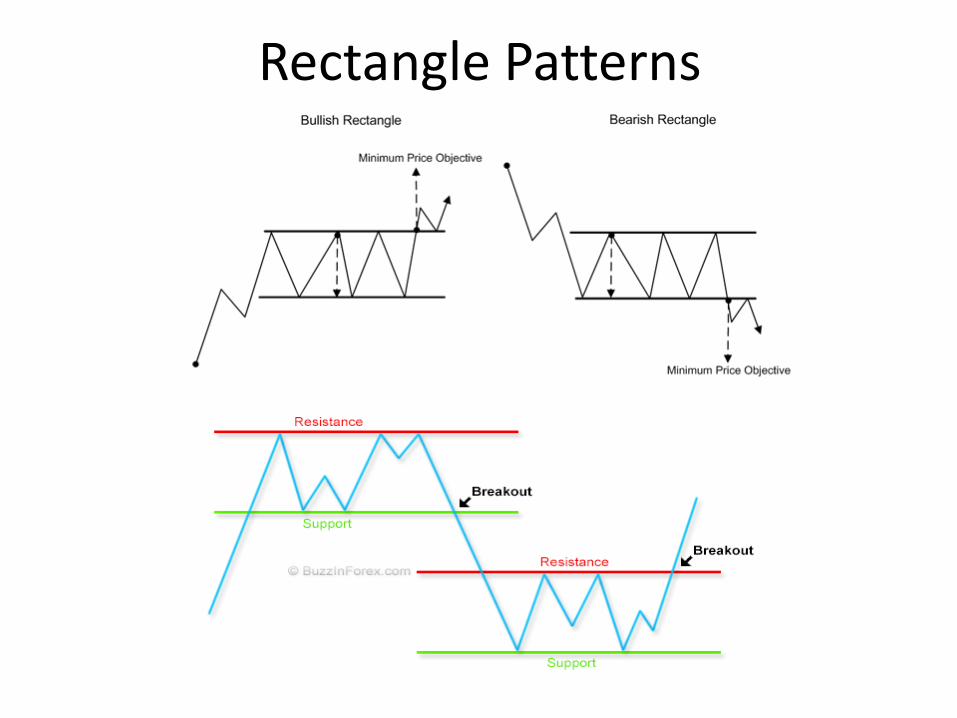
Rectangle Patterns
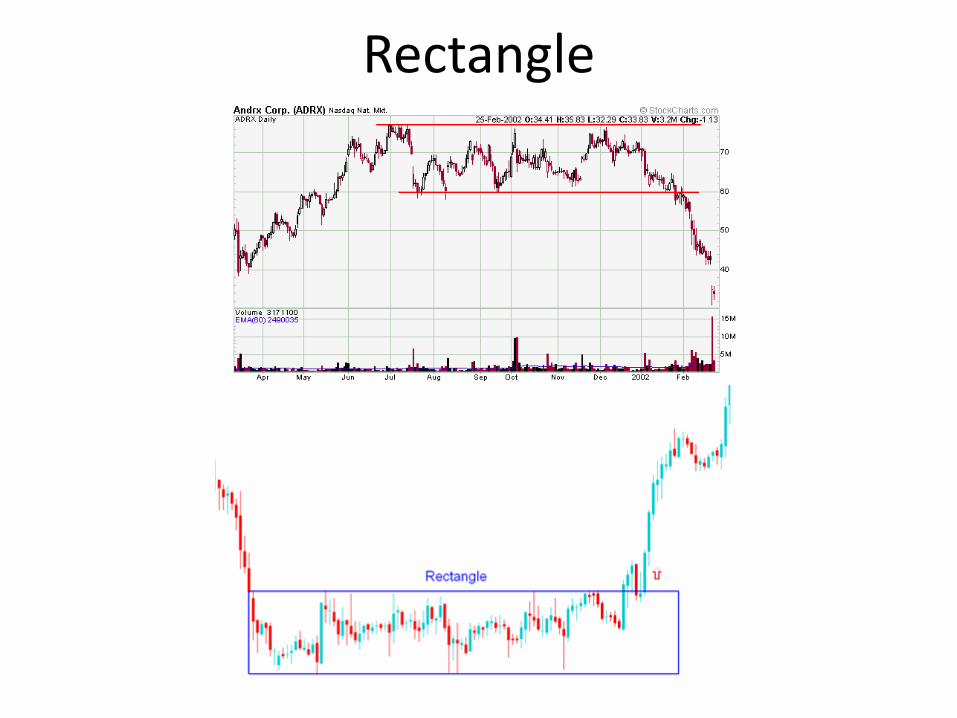
Rectangle
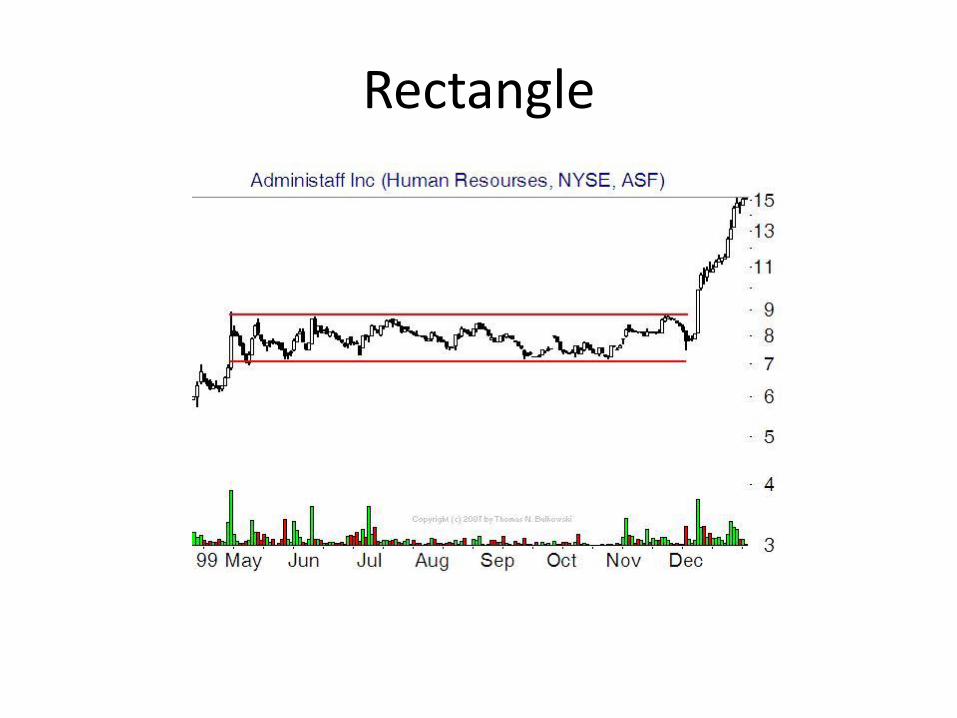
Rectangle
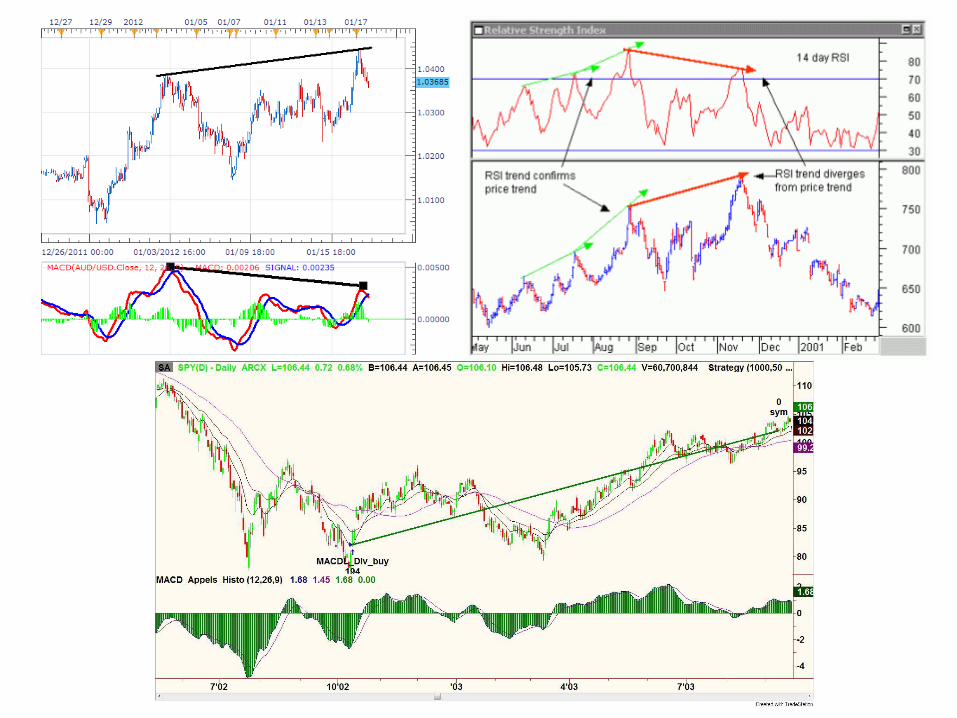
Principle of Confirmation
• Confirmation refers to the comparison of all technical signals and indicators to ensure that most of those indicators are pointing in the same direction and are confirming one another.
• Divergence is the opposite of confirmation and refers to a situation where different delivery months or related markets or technical indicators fail to confirm one another. It is one of the best early warning signals of impending trend reversals.
Confirmation of price trends or patterns
• Volume and open interest
• Technical signals
• Comparable market index or products
• Fundamental factors
• Other supports or resistances indicated by some previous (historical) price patterns or trends.
Technical Indicators
• Trend detective indicators:
Moving Average systems, Bollinger Bands, parabolic SAR, Commodity Channel Index, ZigZag
• Oscillation indicators:
MACD, RSI, RVI, Stochastic Oscillator, William’s percent range
• Volume indicators:
Volumes, On balance volume, Accumulation, Distribution.
MetaTrader 4
• Download:
http://www.metatrader4.com/
• Technical analysis
• Simulation trading account
• Algorithmic Trading with MQL4
http://docs.mql4.com/
Part II: Preview
• More on indicators
• Real market practice: currency market
• X Trader introduction
• Algorithmic trading
• Comprehensive list of indicators
• Technical analysis based statistical Modeling
• Axiomatic thoughts on technical analysis

Thank you!
• Questions?
• PQFC: http://web.ics.purdue.edu/~quantit/
• Join us now!