Embed Size (px)
Citation preview

TECH 3362
MEDIA STORAGE PERFORMANCE
DESIGN CONSIDERATIONS AND BENCHMARKING
Geneva August 2013

* Page intentionally left blank. This document is paginated for two sided printing

Tech 3362 Media Storage Performance – Design & Benchmarking
3
Abstract This document details work carried out by BBC R&D for the EBU Project Group on Future Storage Systems (FSS).
Media storage is still expensive and very specialist, with a few suppliers providing high performance network storage solutions to the industry. Specifying, selecting and configuring storage is very complex, with technical decisions having far reaching cost and performance implications.
The viability of true file based production will not be determined by storage performance alone. How applications, networks and protocols behave is fundamental to getting the best performance out of network storage.
This paper details the experience gained from testing two different approaches to high performance network storage and examines the key issues that determine performance on a generic Ethernet network.
All the graphs shown were produced from measured performance data using the BBC R&D Media Storage Meter open source test tool.
Acknowledgement This EBU Tech Doc was prepared by the Project Group on Future Storage Systems (FSS). It is largely based on a BBC R&D White Paper [1] written by David Butler.

Media Storage Performance – Design & Benchmarking Tech 3362
4
* Page intentionally left blank. This document is paginated for two sided printing

Tech 3362 Media Storage Performance – Design & Benchmarking
5
Contents
Abstract .................................................................................................... 3
Acknowledgement ........................................................................................ 3
1. Introduction ...................................................................................... 7
2. Design Considerations for Media Storage Systems .......................................... 8
3. Network Storage Fundamentals .............................................................. 12 3.1 Hard Disk Type ....................................................................................................... 12
3.2 Network File System ................................................................................................ 13
3.3 Network Behaviour .................................................................................................. 14
4. Approaches to High Performance Storage .................................................. 16 4.1 High Performance Storage Approach 1 ........................................................................... 17
4.2 High Performance Storage Approach 2 ........................................................................... 18
5. High Performance Storage Benchmarking .................................................. 19 5.1 Media Storage Meter ................................................................................................ 19
5.2 Test Profiles .......................................................................................................... 23
5.3 Test Setup ............................................................................................................ 23
5.4 Media Storage Meter Configuration ............................................................................... 24
6. Results and Analysis for Storage Approach 1 ............................................... 25 6.1 Access Profile and Network Storage Behaviour ................................................................. 25
6.2 Effect of Block Size on Transfer Rate and Latency ............................................................ 27
6.3 Caching and Network Storage Performance ..................................................................... 28
6.4 Cold Cache and Network Storage Performance ................................................................. 30
6.5 Flow Control and Network Storage Performance ............................................................... 31
6.6 Jumbo Frames and Network Storage Performance ............................................................. 33
6.7 Fragmentation and Network Storage Performance ............................................................ 34
6.8 Disk Scattering and Network Storage Performance ............................................................ 35
6.9 SAS and Near Line SAS Network Storage Performance ........................................................ 36
6.10 1 GbE and 10 GbE Connected Network Storage Performance ............................................... 38
6.11 Sequential Read Only Performance for 1 GbE and 10 GbE Connected Storage ............................ 40
6.12 Maximum Latency for Storage Type .............................................................................. 42
6.13 Client TCP Window Scaling Limitation .......................................................................... 43
7. Results and Analysis for Storage Approach 2 ............................................... 45 7.1 Single File and Multi File Access Storage Performance ........................................................ 45
7.2 TCP Window Size and Single Threaded Sequential Read Performance ..................................... 47

Media Storage Performance – Design & Benchmarking Tech 3362
6
7.3 TCP Window Size and Multi-Threaded Sequential Read Performance ...................................... 48
7.4 Multi File Sequential Read and Sequential Write Performance .............................................. 50
7.5 Scaling Storage Nodes for Heavy Sequential Reads and Writes .............................................. 52
7.6 Maximum Latency for Storage Type .............................................................................. 54
8. Generic IT Storage Performance ............................................................ 55
9. Further Work.................................................................................... 57 9.1 Possible Improvements to the Measurement Tool ............................................................. 57
9.2 Possible Improvements to the Test Method ..................................................................... 58
9.3 Profiling Production Workflow .................................................................................... 58
9.4 Measurement of Other Storage Types ............................................................................ 58
10. Glossary .......................................................................................... 59
11. References ...................................................................................... 60

Tech 3362 Media Storage Performance – Design & Benchmarking
7
Media Storage Performance
Design Considerations and Benchmarking
EBU Committee First Issued Revised Re-issued
FNS-FSS 2013
Keywords: NAS, SAS, BSAS, Near Line, SATA, Network, msMeter
1. Introduction Network storage performance is determined by the end to end system and all the components through which data is moved. How the storage is shared, client setup, application behaviour, server setup, network configuration and protocol behaviour all affect performance. As the load from the media workflow changes, different points in the data path can become a bottleneck, limiting desired performance. An example data path, with data rates, is shown in Figure 1.
NIC
10 GbE
NIC
10 GbE
CoreSwitch
10 GbE
10 GbE
EdgeSwitch
1 GbE
NIC
NIC
1 GbE
BackPlane
BackPlane
1 GbE
1 GbE
1 GbE
1 GbE
1 GbE
1 GbE
1 GbE
1 GbE
1 GbE
Disks Cache
Disks Cache
DiskCache
5 Gb/s
5 Gb/s
3 Gb/s
Backplane data rate, e.g: 144 Gb/s, 2MB shared buffer
Protocol Behaviour
Backplane data rate, e.g: 480 Gb/s, 4 x 32MB tiered buffers
Media Storage
Media Clients
Figure 1: Example Data Movement Path
Some production work areas employ high performance storage with client access over dedicated fibre channel networks. This is expensive and not very flexible, as it requires a separate network to the existing IT infrastructure.

Media Storage Performance – Design & Benchmarking Tech 3362
8
Employing high performance storage on a generic IT network could provide flexible high speed storage access, without the cost of fibre channel infrastructure and the need for fibre channel network cards in production workstations.
The goal of this document is to investigate the capability of high performance storage on a generic IT network and to act as a guide for evaluating storage products, experimentation and the analysis of current storage systems.
The target audience for this document is for technical users, designing and evaluating storage solutions from broadcasters and manufacturers.
The conclusions drawn from testing two different approaches to high performance storage on a generic IT network are summarised in § 2, “Design Considerations for Media Storage Systems”.
The remainder of the document covers fundamental knowledge on network storage and approaches to high performance storage. It also explains a benchmarking test method using an open source tool designed expressly for high performance media storage. The results and the analysis is presented for two storage approaches and compared with a sample generic IT storage solution, which shall be seen as representing an example of, not the conclusion of all, generic storage solutions. Finally, a section highlights possible work to improve and develop further the methodology and the software tool.
2. Design Considerations for Media Storage Systems Generic OEM storage is not ideally suited for production use; it does not scale well with many clients. Specialist network storage offers significant improvements over generic storage. However, network storage performance is a complex relationship determined by client, storage, network and protocol behaviour. All these interact when delivering typical media production workflows. The interaction is statistical in nature.
This section summarises the results from testing two types of high performance storage on a simple Ethernet network. The detailed results are provided in § 6 and § 7. Key factors were identified that have major effects on performance. Some of these are network storage issues that are obvious and well known. This document attempts to collate and highlight the underlying design considerations to help system designers understand the possible end to end effects on media workflows.
The key factors for high performance network storage are:
Access Profile and Network Storage Behaviour.
How data is written and read strongly affects the transfer rate.
◦ Increasing block size and data length increase the transfer rate, but also increase latency.
◦ Block sizes larger than the network storage limit are split into concatenated smaller blocks, so the transfer rate and latency still increase beyond the block size limit value.
For the NFS file system, the use of Direct IO is important for transfer behaviour.
◦ Without Direct IO, read ahead and local file caching results in peaky transfer behaviour.
◦ With Direct IO, there is no read ahead caching, so the transfer rate is more constant.
Application behaviour & file systems configuration will have a big effect on performance.
Caching and Network Storage Performance.
Reading and writing to the storage cache is much faster than to disk.

Tech 3362 Media Storage Performance – Design & Benchmarking
9
◦ Single file measurements generally show cache and network performance.
◦ Large multi file access generally shows storage disk input-output performance.
System architects must take into account the difference in cached and non-cached storage performance when specifying a storage system.
Cold Cache and Network Storage Performance.
The cache is populated by reading and writing data, improving performance over time.
A new file will not be in the cache after sustained file access to other large files.
◦ Initial reading from storage is slower, increasing as the cache becomes populated.
◦ Cache is typically RAM or flash memory, or a combination of the two, which responds much faster than a hard drive.
For storage types that employ a large read cache, production staff could see an initial drop in performance when accessing media not used recently, i.e. data that is not populated in the cache.
Flow Control and Network Storage Performance.
An effect called back pressure occurs in a switch, when the network connection speed changes from a higher rate to a lower rate, e.g. from 10 GbE1 to 1 GbE connectivity.
◦ Occurs when reading data from 10 GbE connected storage to 1 GbE clients.
◦ Does not occur when writing data to 10 GbE connected storage from1 GbE clients.
Packets arrive on 10 GbE faster than they can be delivered to multiple 1 GbE connections.
◦ With no flow control, packets are dropped, requiring re-transmission.
◦ With flow control, pause frames are sent to the storage NIC, controlling data transfer.
For link speed adaptation, flow control on the faster connection between the switch and storage is definitely required.
Switch Choice.
Switches with contested backplanes, where the backplane speed is not sufficient to support the full simultaneous wire speed of all the ports, should not be used.
◦ Switch backplane speed should be sufficient for the number of connections and wire speed.
Flow control can mitigate congestion and latency, but switch packet buffering is required.
◦ The infrastructure and hardware will introduce MAC message and protocol latency.
◦ Sufficient packet buffering is required or packets will be dropped.
If the switch buffering is shared, larger buffers are required to support more connections.
◦ The switch used for these tests had a shared 2 Mbyte buffer for 28 connections. This is fairly typical for a professional grade switch at the edge of a network.
An understanding of how the network switch memory and buffer management contributes to media flow performance is important.
The maximum available buffers per port (shared or assigned) are crucial when choosing switches. Insufficient per port buffer size can lead to overflow and packet loss.
Jumbo Frames and Network Storage Performance.
The use of jumbo (very large) frames reduced performance in the performance tests.
1 GbE is an abbreviation for gigabit Ethernet, as specified in the IEEE 802.3-2008 standard.

Media Storage Performance – Design & Benchmarking Tech 3362
10
◦ It is harder to multiplex large packets from multiple clients onto the storage connection.
Jumbo frames should be used with care. In some circumstances, such as multiple media clients on a shared storage network, the use of jumbo frames can reduce transfer rates and increase latency.
Fragmentation and Network Storage Performance.
File fragmentation reduces storage performance over time.
◦ Read reallocation or other fragmentation reducing algorithms reduce the drop in performance.
Production storage requires some form of fragmentation reduction or defragmentation mechanism (otherwise the system must be designed to compensate for the drop in performance).
Scheduled file defragmentation reduces the operational performance of storage system during defragmentation.
Disk Scattering and Network Storage Performance.
Starting file access from the outer sections of hard disks gives a high initial performance.
◦ The performance drops of significantly with increased disk utilisation.
File scattering: starting at different points on the hard disk results in a lower initial performance.
◦ The performance remains more consistent as disk utilisation increases.
Disk file scattering should be employed on production storage, if available.
SAS and Near-Line SAS (SATA hard disk with a SAS Interface) Network Storage Performance.
The choice between SAS and SATA is generally down to price and capacity.
◦ SAS is faster and more reliable; SATA is cheaper, with more capacity.
Storage disk performance is also determined by the number of disks in the RAID.
◦ Can achieve SAS performance with SATA by using more disks.
◦ Cannot achieve SAS reliability, but can mitigate using extra RAID error correction.
Use either SAS or SATA storage as required by storage volume size and application.
1 GbE and 10 GbE Connected Network Storage Performance.
Using a production edit read/write access profile, 10 GbE offered some improvement.
◦ 10 GbE offered no significant improvement for read transfer rate and latency.
◦ 10 GbE offered significant improvement for write transfer rate with no change to latency.
Using a 100% read or 100% write access profile, 10 GbE offered significant improvement.
◦ Improved read / write transfer rate and average latency.
With current network costs, 10 GbE store connectivity with flow control is recommended, particularly for heavy file copy operations.
Client problems under Heavy Loading.
Older client hardware can have a significant impact on performance.
◦ Older network interfaces cards may not fully support some newer protocol features.
Expect to see strange behaviour when using clients at the limit of their performance.

Tech 3362 Media Storage Performance – Design & Benchmarking
11
TCP protocol behaviour is very important for performance.
Under heavy load, the normal TCP window scaling is not sufficient.
◦ Congestion and delays in the network cause unnecessary TCP re-transmissions.
Enabling the extended TCP Window Scaling greatly improved transfer rate and latency.
◦ 100% sequential read total transfer rate was increased from 180 Mbyte/s to 620 Mbyte/s
◦ 100% sequential read average latency was reduced from 120 ms to 55 ms.
Although increasing the TCP window size increases the protocol latency, the increase in TCP latency is also small compared to the storage and other latencies.
TCP Window Scaling is already enabled on recent Windows OS and most Linux distributions.
Extended TCP Window Scaling should definitely be enabled.
How storage write performance is specified.
Write performance is typically optimised and specified for a complete sequential file write.
Sequential writes to multiple selected positions in a file, such as an edit write, requires far greater disk travel and counters the algorithms that improve sequential write speed.
A production edit tool is unlikely to achieve the quoted storage write performance.
Scaling of Read and Write Performance
Doubling the number of storage devices increased the transfer rate and reduced latency.
◦ 100% sequential read and write total transfer rates increased by up to a factor of 2.3.
◦ For 40 clients, the average latency with 2 storage nodes was reduced from 71 ms to 54 ms.
The greatest improvements were under heavy load, with the maximum number of clients (40).
◦ Indicated storage performance rather than network performance was the limiting factor.
Using a single edge type 1U switch, the storage scaled well and the generic IT network was not the limiting factor for performance.
Choice of storage RAID type.
The choice of RAID type was not investigated during the tests presented in this document.
A proprietary RAID system was employed for approach 1; approach 2 employed RAID 5.
RAID choice has both performance and reliability implications.
The use of generic IT storage.
In order to achieve the high level of performance required by media applications, the architecture of a storage system using generic IT components needs to be designed accordingly, i.e. high number of disks, Fibre Channel connections, file servers etc.
Even if the performance is acceptable using generic IT storage systems, it may still lack certain key features like fast failure recovery, snap shots or backup procedures which are important features of high availability scenarios in media production storage.
So which is the best approach to high performance storage? There are advantages and disadvantages to each of the approaches.
Approach 1: Large read cache and virtual file system with complex read and write algorithms
Very similar read and write performance, particularly when accessing the files from the cache.

Media Storage Performance – Design & Benchmarking Tech 3362
12
Greater variation in peak latency.
◦ More large peaks in maximum latency of up to 350 ms.
Peaks in maximum latency sometimes occur with relatively few clients.
◦ Complex algorithms are used to achieve high performance.
◦ When algorithm capabilities are exceeded, there are more peaks in maximum latency.
Approach 2: Hardware based file system with fast disk response.
Write transfer rate was always slower than the read transfer rate.
◦ Possibly non optimal read-modify-write sequences for the data blocks and the parity blocks.
Small variation in peak latency.
◦ Peak latency relatively flat, except with high number of clients.
◦ A single large maximum latency of 360 ms occurred.
◦ Peak latency values suggest that the latency response is more linear.
The choice of storage comes down to the requirements of the production application. One approach has a more symmetrical read / write behaviour, while the other has a more consistent latency behaviour.
3. Network Storage Fundamentals This section provides a brief introduction and tutorial into some of the technologies used in high performance network storage.
3.1 Hard Disk Type A typical hard disk consists of multiple spinning platters, with moving arm assemblies that read and write to sectors and tracks. Both SAS and Near Line SAS storage were employed in the tests. The Near Line SAS storage consists of SATA disks with a SAS interface. The differences between SAS and SATA disks [2] are shown in Figure 2 and Table 1.
SAS Hard Disk
Spindle
Sectors & Tracks
Heads
Arm Assembly
Disk Platter
SATA Hard Disk
Figure 2: Components of SAS and SATA Hard Disks

Tech 3362 Media Storage Performance – Design & Benchmarking
13
Table 1: Typical Specifications of SAS and SATA Hard Disks, as used in the tests
Disk Type SAS SATA
Disk Platter Diameter 2.5” 3.5”
Disk Spinning Speed 15000 rpm 7200 rpm
Bearings Top and bottom Single end only
Processors Separate server and IO Single
Disk Capacity 147 GB, 300 GB, 600 GB 1 TB, 2 TB, 3 TB
Typical Access Rate ~50 Mbyte/s / Disk ~25 Mbyte/s / Disk
Robustness Higher Lower
Cost Higher Lower
Using RAID, files are spread across multiple disks. The storage disk access speed is determined by the disk type (SAS or SATA) and the number of disk in the RAID. Using a faster disk type or more disks both increase the IOP speed for the storage [3].
3.2 Network File System During testing, clients and storage servers communicated using the NFS Version 3 protocol [4]. A simplified diagram of the protocol exchange to read 64 kbyte of data from a server is shown in Figure 3. The ‘NFS V3’ green blocks indicate NFS protocol messages, while the ‘TCP’ blue blocks indicate data transfer and acknowledgements.
NFS V3 GET ATTRIBUTE Call
Client Server
NFS V3 GET ATTRIBUTE Reply
NFS V3 GET ATTRIBUTE Call
NFS V3 GET ATTRIBUTE Reply
NFS V3 READ CALL
TCP Segment PDU
TCP Segment PDU
TCP Segment PDU
TCP Segment PDU
TCP NFS [ACK]
TCP NFS [ACK]
TCP NFS [ACK]
NFS V3 READ CALL Reply
TCP NFS [ACK]
TCP NFS [ACK]
TCP NFS [ACK]
Get File Attributes
Attributes (File ID, File Size, User IDs, Mode, Server Time)
Check File Attributes
Attributes (File ID, File Size, User IDs, Mode, Server Time)
Read File (File ID, Start offset, 65536 bytes)
File Attributes, 65536 bytes, current offset
NFS V3 READ CALL Reply
TCP Segment PDU
TCP Segment PDU
TCP Segment PDU
TCP Segment PDU
File Attributes, 65536 bytes, current offset
TCP NFS [ACK]
TCP NFS [ACK]
TCP NFS [ACK]
Figure 3: NFS Protocol Exchange for 64 kB Read
In Figure 3, the client first reads the file attributes and reads them again to check for close-to-open
Media Storage Performance – Design & Benchmarking Tech 3362
14
cache consistency [5]. This is to check that the file is not currently being updated in the cache or on disk.
The client then makes a READ CALL, requesting 65536 byte (64 kbyte) starting from a specific offset in the file. Data is sent from the server in TCP Segment PDUs, which are acknowledged by the client.
At points during the data transfer, the server sends READ CALL Reply messages, stating the current offset in the file and confirms the amount of data being transferred (65536 byte).
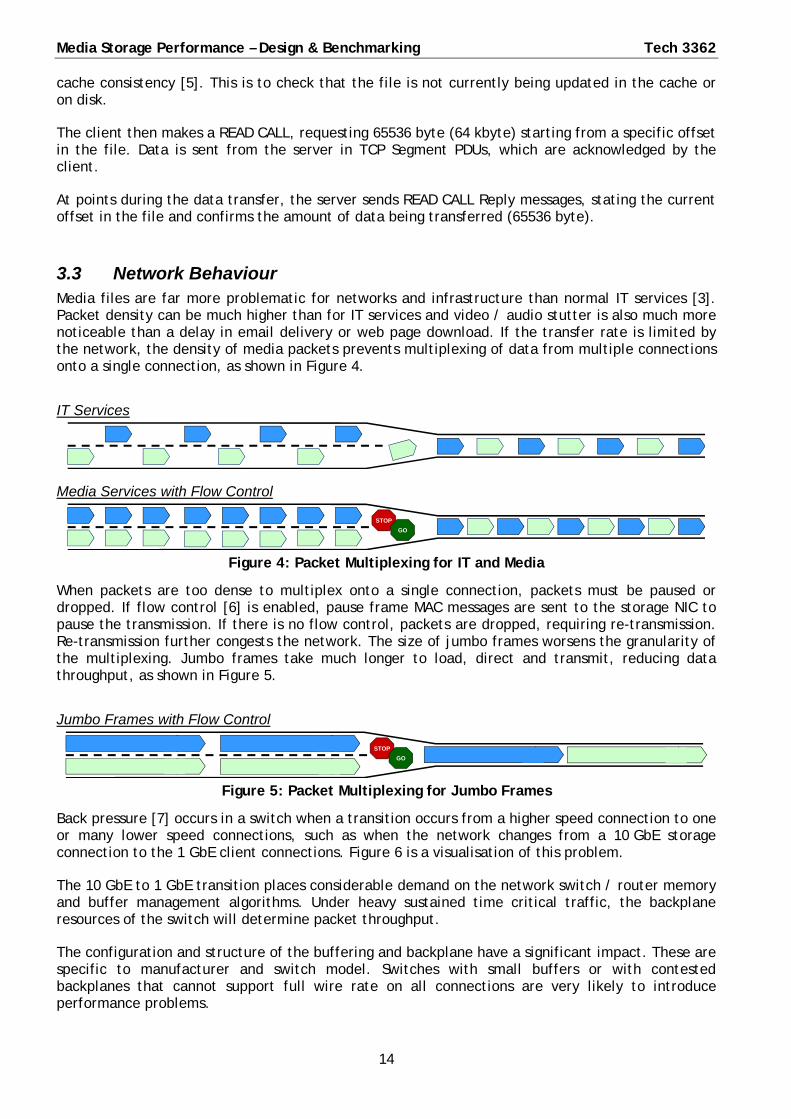
3.3 Network Behaviour Media files are far more problematic for networks and infrastructure than normal IT services [3]. Packet density can be much higher than for IT services and video / audio stutter is also much more noticeable than a delay in email delivery or web page download. If the transfer rate is limited by the network, the density of media packets prevents multiplexing of data from multiple connections onto a single connection, as shown in Figure 4.
IT Services
Media Services with Flow Control
STOP
GO
Figure 4: Packet Multiplexing for IT and Media
When packets are too dense to multiplex onto a single connection, packets must be paused or dropped. If flow control [6] is enabled, pause frame MAC messages are sent to the storage NIC to pause the transmission. If there is no flow control, packets are dropped, requiring re-transmission. Re-transmission further congests the network. The size of jumbo frames worsens the granularity of the multiplexing. Jumbo frames take much longer to load, direct and transmit, reducing data throughput, as shown in Figure 5.
Jumbo Frames with Flow Control
STOP
GO
Figure 5: Packet Multiplexing for Jumbo Frames
Back pressure [7] occurs in a switch when a transition occurs from a higher speed connection to one or many lower speed connections, such as when the network changes from a 10 GbE storage connection to the 1 GbE client connections. Figure 6 is a visualisation of this problem.
The 10 GbE to 1 GbE transition places considerable demand on the network switch / router memory and buffer management algorithms. Under heavy sustained time critical traffic, the backplane resources of the switch will determine packet throughput.
The configuration and structure of the buffering and backplane have a significant impact. These are specific to manufacturer and switch model. Switches with small buffers or with contested backplanes that cannot support full wire rate on all connections are very likely to introduce performance problems.

Tech 3362 Media Storage Performance – Design & Benchmarking
15
Back Pressure with Flow Control
STOP
GO
Figure 6: Back Pressure in Switch
Packets on the 10 GbE connections arrive faster than they can be directed and delivered on the 1 GbE connections. Packets are dropped, without flow control, or paused with flow control. The use of flow control increases throughput, as it relieves pressure on the switch resources and reduces the need for re-transmissions.
The TCP protocol provides another mechanism to reduce re-transmissions. Extended TCP window scaling [8], as shown in Figure 7, behaves a little like the variable speed limit on a motorway. It allows the network to deal with larger delays, before assuming lost packets.
Back Pressure with Flow Control and Extended TCP Window Scaling
30
STOP GO
5070
Figure 7: Extended TCP Window Scaling
During data transfer, both ends of a TCP connection keep track of data, using the idea of TCP windows. The windows are used to determine how much data can be in transit, without being acknowledged (ACKED) by the receiver, as shown in Figure 8.
As the network becomes more congested, the window size and receive buffering can be increased to compensate. This increases latency in the protocol, but maintains a higher throughput as fewer packets are re-transmitted.
For switches with shared buffers, this can reduce the level of flow control pausing, further improving the data transfer rate.
Next to be sent
Sent and
ACKED
Sent but not
ACKED
Not yet
Sent
Win
dow
Rec
eive
buf
fer
ACKEDbut not
deliveredto the App
Win
dow
Not yetACKED
Send Side Receive Side
Figure 8: Extended TCP Window Scaling Mechanism

Media Storage Performance – Design & Benchmarking Tech 3362
16
4. Approaches to High Performance Storage Generic storage from general IT vendors is intended for everyday IT uses, such as small file storage and database access. It is low cost item, with limited performance. It does not scale well with many clients, as shown in § 7. The cost and performance of generic storage is very different from high performance storage. Typically, generic storage consists of a hard disk RAID with some memory cache, as shown in the Figure 9.
File 1
File 2
Read CacheRead Cache Write CacheWrite Cache
Protocol ReadBlock Sizes
Protocol WriteBlock Sizes
Hard DiskBlock Size
Figure 9: Generic Storage
The physical performance of the storage device itself is limited by the number of disks, disk speed, cache size and the distribution of data on the disks:
RAID striping
◦ Writing data blocks from the same file across multiple hard drives, parallelising access.
Hard disk data block size selection and disk utilisation
◦ Optimising the data chunks on the hard disk to match the type of data access.
◦ Defragmentation and file scattering strategies to prevent performance drop over time.
Read and write caching
◦ Pre-loading files into memory in the storage head or server.
◦ Reading ahead, loading the file based on previous reads.
Network storage performance and behaviour is affected by more than the physical configuration of the storage. Limiting factors will change, as the load profile changes. Typical factors that affect performance for the server and client are:
Performance (CPU / memory / DMA)
Operating system (Linux / Windows).
◦ Sharing protocol (SMB / NFS).
◦ Protocol read and write block size limitations.
Caching and collation of data.
◦ Caching of data and read ahead by the protocol.
◦ Caching or collation of data by the read / write subroutines or application.
Read / write profile.
◦ Percentage mix of reads and writes.
◦ Percentage of random and sequential reads / writes.
◦ Length of data for each read and write.
◦ Number of files accessed and the file sizes.
Tech 3362 Media Storage Performance – Design & Benchmarking
17
◦ Block size of the individual transfers.
◦ Direct block size control or automatic block size allocation.
Although generic storage is discussed briefly, this document examines two different approaches to high performance storage.
The high performance storage suppliers tested, had different approaches to optimising performance for media application:
Approach 1 employs intelligent read/write algorithms and caching.
Approach 2 employs a high speed, hardware based, file system with high speed hard disks.
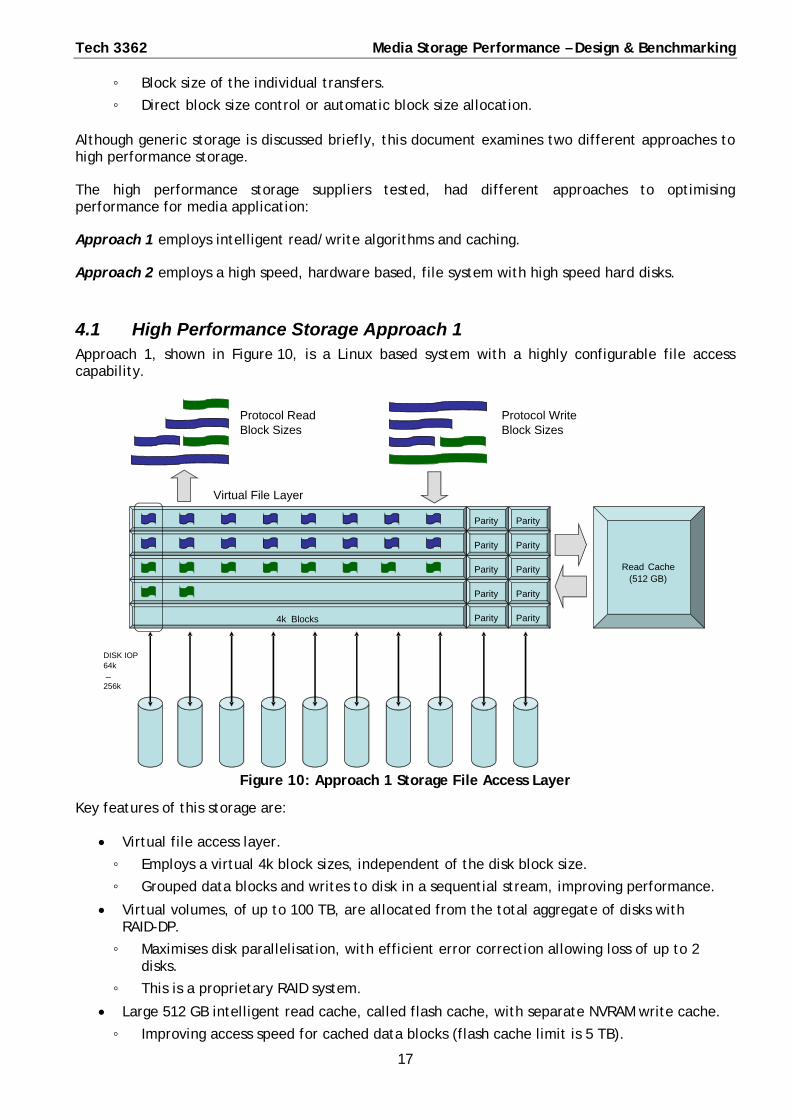
4.1 High Performance Storage Approach 1 Approach 1, shown in Figure 10, is a Linux based system with a highly configurable file access capability.
Figure 10: Approach 1 Storage File Access Layer
Key features of this storage are:
Virtual file access layer.
◦ Employs a virtual 4k block sizes, independent of the disk block size.
◦ Grouped data blocks and writes to disk in a sequential stream, improving performance.
Virtual volumes, of up to 100 TB, are allocated from the total aggregate of disks with RAID-DP.
◦ Maximises disk parallelisation, with efficient error correction allowing loss of up to 2 disks.
◦ This is a proprietary RAID system.
Large 512 GB intelligent read cache, called flash cache, with separate NVRAM write cache.
◦ Improving access speed for cached data blocks (flash cache limit is 5 TB).
Read Cache (512 GB)
DISK IOP 64k
–256k
4k Blocks
Parity
Parity
Parity
Parity
Parity
Parity
Parity
Parity
Parity
Parity
Protocol ReadBlock Sizes
Virtual File Layer
Protocol WriteBlock Sizes
Media Storage Performance – Design & Benchmarking Tech 3362
18
Supports read re-allocation and randomise allocation.
◦ Reduces file fragmentation and drop off of performance with time and disk utilisation.
Supports unified multiple mount protocols and network interface types from a single OS.
File system snapshot capability, requiring no copy-on-write, with instant recovery system.
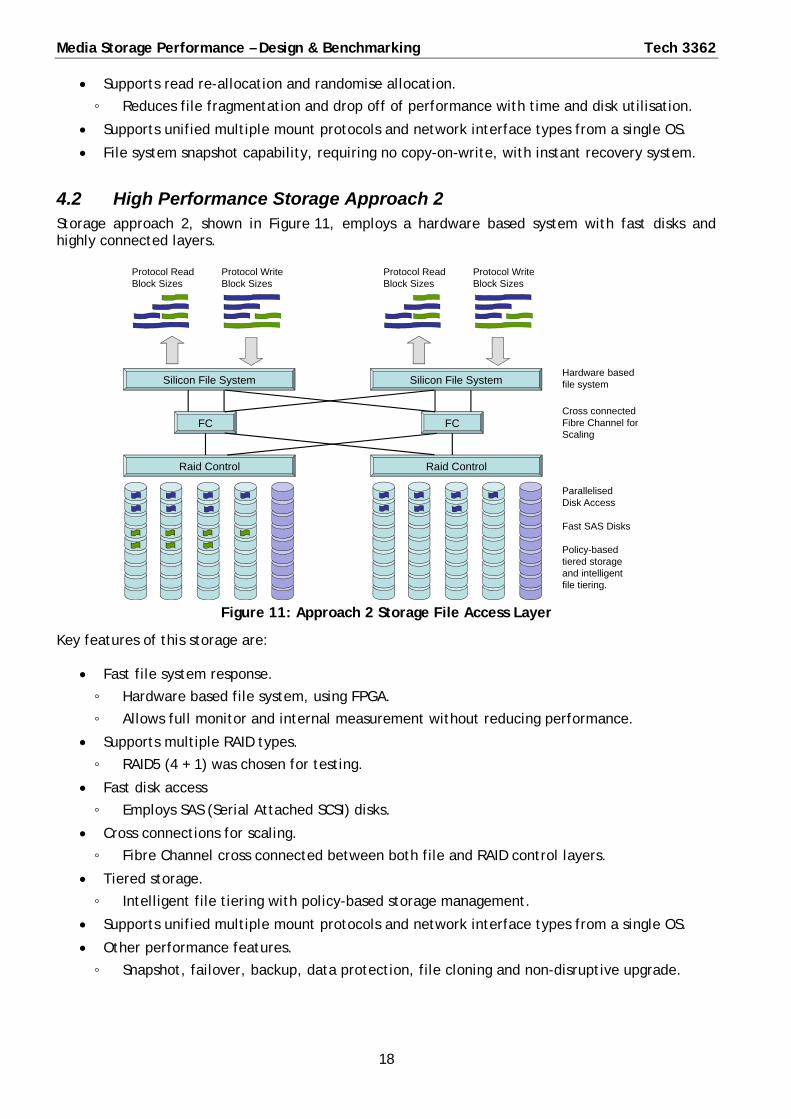
4.2 High Performance Storage Approach 2 Storage approach 2, shown in Figure 11, employs a hardware based system with fast disks and highly connected layers.
Silicon File System
Protocol Write Block Sizes
Raid Control
FC
Silicon File System
Raid Control
FCCross connected Fibre Channel for Scaling
Parallelised Disk Access
Fast SAS Disks
Policy-basedtiered storage and intelligent file tiering.
Hardware based file system
Protocol Read Block Sizes
Protocol Write Block Sizes
Protocol Read Block Sizes
Figure 11: Approach 2 Storage File Access Layer
Key features of this storage are:
Fast file system response.
◦ Hardware based file system, using FPGA.
◦ Allows full monitor and internal measurement without reducing performance.
Supports multiple RAID types.
◦ RAID5 (4 + 1) was chosen for testing.
Fast disk access
◦ Employs SAS (Serial Attached SCSI) disks.
Cross connections for scaling.
◦ Fibre Channel cross connected between both file and RAID control layers.
Tiered storage.
◦ Intelligent file tiering with policy-based storage management.
Supports unified multiple mount protocols and network interface types from a single OS.
Other performance features.
◦ Snapshot, failover, backup, data protection, file cloning and non-disruptive upgrade.
Tech 3362 Media Storage Performance – Design & Benchmarking
19
5. High Performance Storage Benchmarking Network storage performance is very dependent on the production infrastructure. Ideally testing should be performed on the intended production network, as the network forms part of the test bed. Testing the storage under controlled conditions, or benchmarking, is performed on a non-production network, to determine performance without impacting real production services.
To determine the key issues affecting performance, the two different approaches to high performance network storage were tested on a simple single switch LAN. The storage and network were tested using the BBC R&D Media Storage Meter [9].
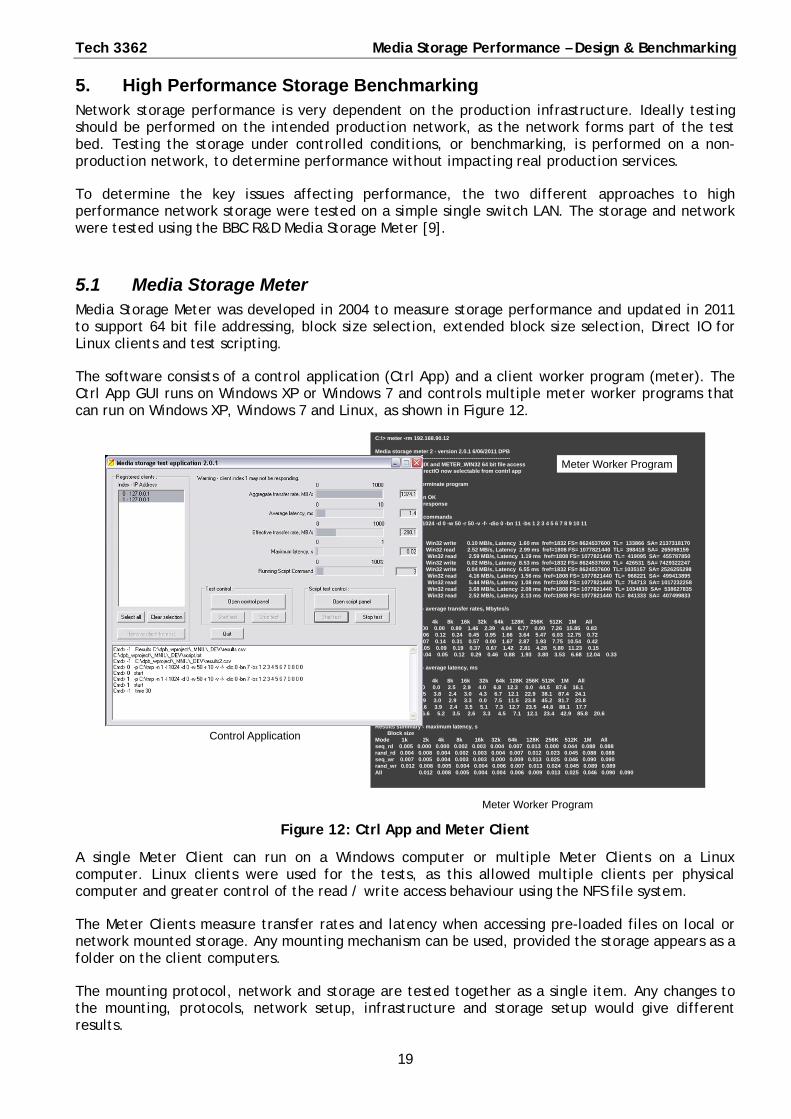
5.1 Media Storage Meter Media Storage Meter was developed in 2004 to measure storage performance and updated in 2011 to support 64 bit file addressing, block size selection, extended block size selection, Direct IO for Linux clients and test scripting.
The software consists of a control application (Ctrl App) and a client worker program (meter). The Ctrl App GUI runs on Windows XP or Windows 7 and controls multiple meter worker programs that can run on Windows XP, Windows 7 and Linux, as shown in Figure 12.
Control Application
C:\> meter -rm 192.168.90.12
Media storage meter 2 - version 2.0.1 6/06/2011 DPB--------------------------------------------------------------------------- METER_FILE_UNIX and METER_WIN32 64 bit file access- Block size and DirectIO now selectable from contrl app
Press any key to terminate program
Opened connection OKWaiting for server responsehellotoyouWaiting for server commands-p c:\dump\ -n 1 -l 1024 -d 0 -w 50 -r 50 -v -f- -dio 0 -bn 11 -bs 1 2 3 4 5 6 7 8 9 10 11startstartedtest000 4k 32 Win32 write 0.10 MB/s, Latency 1.60 ms fref=1832 FS= 8624537600 TL= 133866 SA= 2137318170test000 8k 48 Win32 read 2.52 MB/s, Latency 2.99 ms fref=1808 FS= 1077821440 TL= 398418 SA= 265098159test000 4k 102 Win32 read 2.59 MB/s, Latency 1.19 ms fref=1808 FS= 1077821440 TL= 419095 SA= 455787850test000 1k 416 Win32 write 0.02 MB/s, Latency 8.53 ms fref=1832 FS= 8624537600 TL= 426531 SA= 7429322247test000 1k 1010 Win32 write 0.04 MB/s, Latency 6.55 ms fref=1832 FS= 8624537600 TL= 1035157 SA= 2526255298test000 4k 236 Win32 read 4.16 MB/s, Latency 1.56 ms fref=1808 FS= 1077821440 TL= 968221 SA= 499413895test000 4k 184 Win32 read 5.44 MB/s, Latency 1.08 ms fref=1808 FS= 1077821440 TL= 754713 SA= 1017232258test000 8k 126 Win32 read 3.68 MB/s, Latency 2.08 ms fref=1808 FS= 1077821440 TL= 1034830 SA= 538627835test000 4k 205 Win32 read 2.52 MB/s, Latency 2.13 ms fref=1808 FS= 1077821440 TL= 841333 SA= 407499833pauseResults summary - average transfer rates, Mbytes/s
Block sizeMode 1k 2k 4k 8k 16k 32k 64k 128K 256K 512K 1M Allseq_rd 0.12 0.00 0.00 0.89 1.46 2.39 4.04 6.77 0.00 7.26 15.85 0.83rand_rd 0.03 0.06 0.12 0.24 0.45 0.95 1.66 3.64 5.47 6.03 12.75 0.72seq_wr 0.04 0.07 0.14 0.31 0.57 0.00 1.67 2.87 1.93 7.75 10.54 0.42rand_wr 0.02 0.05 0.09 0.19 0.37 0.67 1.42 2.81 4.28 5.80 11.23 0.15All 0.04 0.05 0.12 0.29 0.46 0.88 1.93 3.80 3.53 6.68 12.04 0.33
Results summary - average latency, msBlock size
Mode 1k 2k 4k 8k 16k 32k 64k 128K 256K 512K 1M Allseq_rd 4.4 0.0 0.0 2.5 2.9 4.0 6.8 12.3 0.0 44.5 87.6 16.1rand_rd 4.1 4.5 3.8 2.4 3.0 4.3 6.7 12.1 22.9 38.1 87.4 24.1seq_wr 4.7 3.9 3.0 2.9 3.3 0.0 7.5 11.5 23.8 45.2 81.7 23.8rand_wr 8.7 6.6 3.9 2.4 3.5 5.1 7.3 12.7 23.5 44.8 88.1 17.7All 6.6 5.2 3.5 2.6 3.3 4.5 7.1 12.1 23.4 42.9 85.8 20.6
Results summary - maximum latency, sBlock size
Mode 1k 2k 4k 8k 16k 32k 64k 128K 256K 512K 1M Allseq_rd 0.005 0.000 0.000 0.002 0.003 0.004 0.007 0.013 0.000 0.044 0.088 0.088rand_rd 0.004 0.008 0.004 0.002 0.003 0.004 0.007 0.012 0.023 0.045 0.088 0.088seq_wr 0.007 0.005 0.004 0.003 0.003 0.000 0.009 0.013 0.025 0.046 0.090 0.090rand_wr 0.012 0.008 0.005 0.004 0.004 0.006 0.007 0.013 0.024 0.045 0.089 0.089All 0.012 0.008 0.005 0.004 0.004 0.006 0.009 0.013 0.025 0.046 0.090 0.090
Meter Worker Program
Meter Worker Program
Figure 12: Ctrl App and Meter Client
A single Meter Client can run on a Windows computer or multiple Meter Clients on a Linux computer. Linux clients were used for the tests, as this allowed multiple clients per physical computer and greater control of the read / write access behaviour using the NFS file system.
The Meter Clients measure transfer rates and latency when accessing pre-loaded files on local or network mounted storage. Any mounting mechanism can be used, provided the storage appears as a folder on the client computers.
The mounting protocol, network and storage are tested together as a single item. Any changes to the mounting, protocols, network setup, infrastructure and storage setup would give different results.
Media Storage Performance – Design & Benchmarking Tech 3362
20
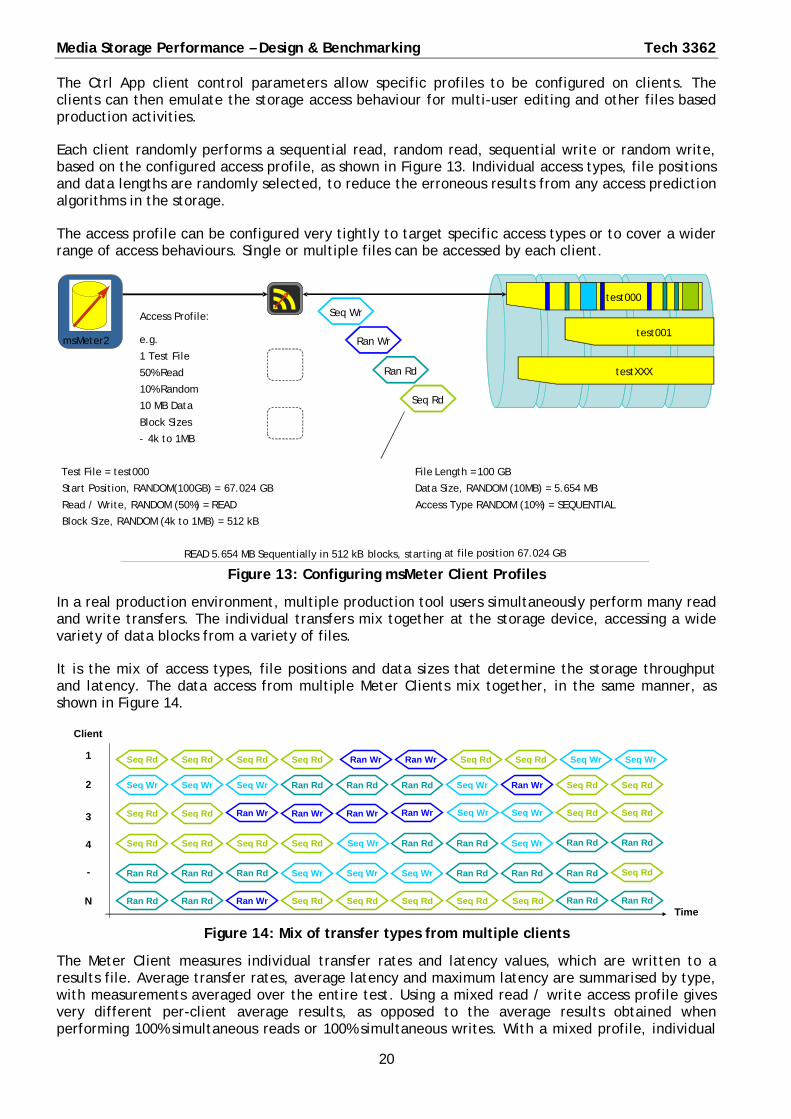
The Ctrl App client control parameters allow specific profiles to be configured on clients. The clients can then emulate the storage access behaviour for multi-user editing and other files based production activities.
Each client randomly performs a sequential read, random read, sequential write or random write, based on the configured access profile, as shown in Figure 13. Individual access types, file positions and data lengths are randomly selected, to reduce the erroneous results from any access prediction algorithms in the storage.
The access profile can be configured very tightly to target specific access types or to cover a wider range of access behaviours. Single or multiple files can be accessed by each client.
Figure 13: Configuring msMeter Client Profiles
In a real production environment, multiple production tool users simultaneously perform many read and write transfers. The individual transfers mix together at the storage device, accessing a wide variety of data blocks from a variety of files.
It is the mix of access types, file positions and data sizes that determine the storage throughput and latency. The data access from multiple Meter Clients mix together, in the same manner, as shown in Figure 14.
Time
Client
Seq Rd
Seq Wr
Ran WrSeq Rd
Ran RdSeq Wr
Seq Rd
Seq Wr
Seq Rd
Ran Rd Seq Wr
Ran Wr Seq Rd
Ran Rd
Seq Wr
Ran Wr
Ran Rd Seq Wr
Seq Rd Seq Rd Ran Wr
Seq Rd
Seq Wr
Seq Rd
Seq Rd
Seq Wr
Seq Rd
1
2
3
4
-
N
Seq Wr
Seq Rd
Seq Rd Seq RdSeq Rd Seq Rd
Ran Rd
Ran WrRan Wr Seq Wr
Ran Rd Ran Rd
Ran Wr
Seq Wr Seq Wr Seq Wr Ran Rd Ran Rd Ran Rd Seq Rd
Seq Rd Seq RdSeq Rd Seq Rd Seq Rd
Ran Rd
Ran Rd Ran Rd
Ran Rd Ran Rd
Ran Rd Ran Rd
Ran Wr
Figure 14: Mix of transfer types from multiple clients
The Meter Client measures individual transfer rates and latency values, which are written to a results file. Average transfer rates, average latency and maximum latency are summarised by type, with measurements averaged over the entire test. Using a mixed read / write access profile gives very different per-client average results, as opposed to the average results obtained when performing 100% simultaneous reads or 100% simultaneous writes. With a mixed profile, individual
Access Profile:
e.g.
1 Test File
50% Read
10% Random
10 MB Data
Block Sizes
- 4k to 1MB
test000
test001
testXXX
Test File = test000 File Length = 100 GB
Start Position, RANDOM(100GB) = 67.024 GB Data Size, RANDOM (10MB) = 5.654 MB
Read / Write, RANDOM (50%) = READ Access Type RANDOM (10%) = SEQUENTIAL
Block Size, RANDOM (4k to 1MB) = 512 kB
READ 5.654 MB Sequentially in 512 kB at file position 67.024 GB
Seq Rd
Ran Rd
Seq Wr
Ran Wr msMeter2
blocks, starting
Tech 3362 Media Storage Performance – Design & Benchmarking
21
client read access measurements and write access measurements can be made while other clients are performing a different access type.
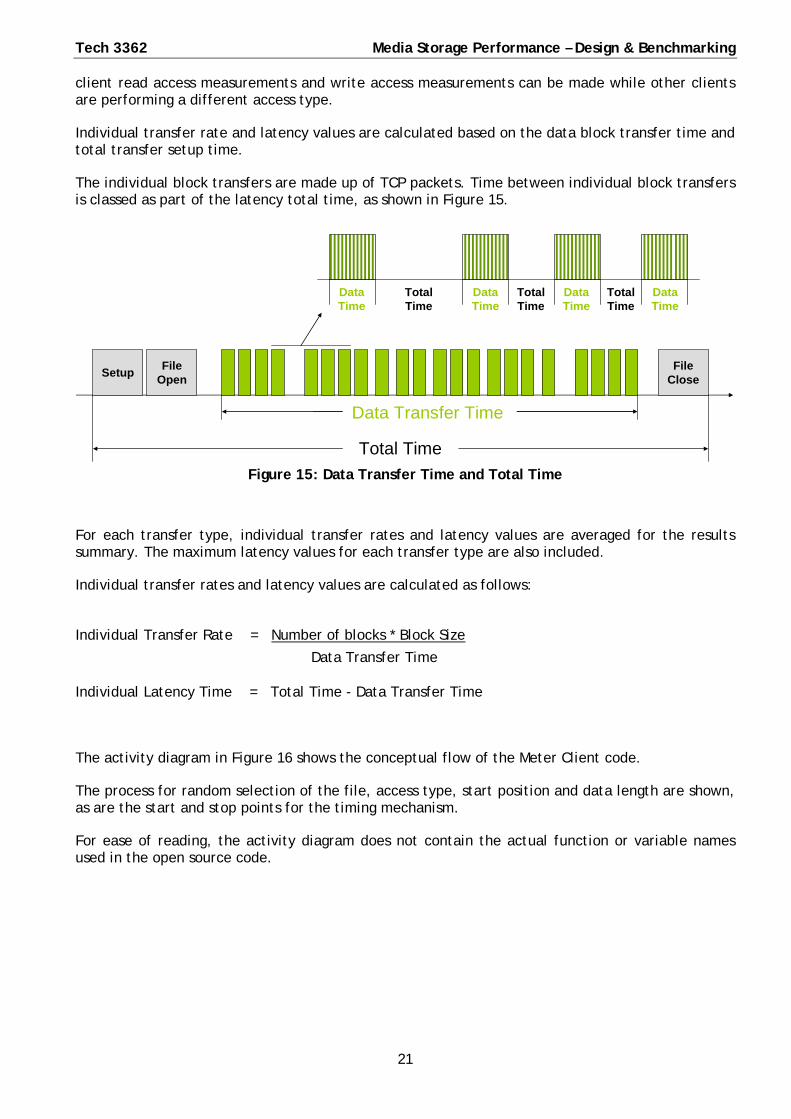
Individual transfer rate and latency values are calculated based on the data block transfer time and total transfer setup time.
The individual block transfers are made up of TCP packets. Time between individual block transfers is classed as part of the latency total time, as shown in Figure 15.
Setup File
Open File
Close
Total Time
Data Transfer Time
DataTime
TotalTime
DataTime
DataTime
DataTime
TotalTime
TotalTime
Figure 15: Data Transfer Time and Total Time
For each transfer type, individual transfer rates and latency values are averaged for the results summary. The maximum latency values for each transfer type are also included.
Individual transfer rates and latency values are calculated as follows:
Individual Transfer Rate = Number of blocks * Block Size
Data Transfer Time
Individual Latency Time = Total Time - Data Transfer Time
The activity diagram in Figure 16 shows the conceptual flow of the Meter Client code.
The process for random selection of the file, access type, start position and data length are shown, as are the start and stop points for the timing mechanism.
For ease of reading, the activity diagram does not contain the actual function or variable names used in the open source code.

Media Storage Performance – Design & Benchmarking Tech 3362
22
Figure 16: Meter Client Activity Diagram

Tech 3362 Media Storage Performance – Design & Benchmarking
23
5.2 Test Profiles The access profiles are based on previous tests with msMeter carried out in 2006 by BBC R&D. They are a very simplified estimate of what occurs during video editing, chosen more to show up known issues than accurately represent the edit process.
The profiles emulate a random mix of reads and writes arriving at the storage from multiple users in a controlled repeatable manner. Having a wide variety of block sizes, with a mix of sequential/random reads and writes is more likely to show up unusual behaviour or problems with the storage under particular conditions. A more specific profile might miss these.
The use of large files with single threaded/multi-threaded access also shows up different network and storage caching behaviour. A real production edit would involve many smaller files, without destructive writes to the source files. However, there are writes and destructive writes to intermediate render files, so a 50% read / write profile is realistic. The many smaller files equate to much larger total file size, so a 100 GB file size was chosen. There is also database / metadata access, hence the 10% random access. As productions often involves multi camera editing, for each client 4 simultaneous threads were configured.
5.3 Test Setup Two storage devices of each type were tested, independently. Different storage and network configurations were evaluated. Each storage device was network mounted on each of the 10 physical clients using the NFS mounting protocol. Pre-loaded test files were accessed by an increasing number of simultaneous clients. Particular attention was paid to storage connection speed, file caching, storage options, protocol options, network settings and storage scaling.
The number of simultaneous Meter Clients on each physical client was also varied. This allowed the emulation of single video editing and multi video editing on each physical client. Up to 4 Meter Clients ran simultaneously on each physical client, as shown in Figure 17. The number of simultaneous clients is determined by both the hardware and operating system. The clients used for these tests were server machines, running Ubuntu 12.04 Linux, with a single quad core processor and 16 GB of RAM.
Figure 17: Network Storage and msMeter Setup

Media Storage Performance – Design & Benchmarking Tech 3362
24
The network infrastructure will affect performance. For real production testing, the Meter Clients should be tested in situ, using the production computers, on the real production network. For the purpose of these tests, the storage and clients were connected via a single 1U edge type switch. This made it easier to differentiate between network and storage performance limitations.
5.4 Media Storage Meter Configuration Storage performance is very dependent on the access profile used. Different access profiles can be selected to emulate different production work loads, such as ingest, import, edit, transcode and other services. A production edit access profile, shown below, was chosen to roughly emulate multiple users editing video with some metadata. The profile range was widened to provide sufficient statistical coverage and to show up any unusual behaviour at different block sizes.
Maximum data length: 10240 kB Up to 10 MB to be transferred for each operation.
Maximum delay: 0 ms No delay between transfer operations.
Write access (%): 50% 50% of all read / write transfers are writes.
Random access (%): 10% 10% of read / writes are random, 90% sequential.
Block Size: 4 kB to 1 MB Full block size range (inc 1k + 2k for < 4k blocks).
Direct IO [NFS]: Enabled Block size is set, no read-ahead or local caching.
It should be noted that both types of storage were configured for a maximum block size of 64k to be compatible with multiple client mount types. Block size requests of greater than 64k were split into concatenated 64k blocks, resulting in higher transfer rates with increasing block size.
During each data transfer, any remaining data to transfer employed a suitable block size. Although a minimum block size of 4 kB was selected, 1 kB or 2 kB block transfers were only used when the remaining data was less than 4 kB. The profile provided sequential read, random read, sequential write and random write results for all block size requests from 1 kB to 1 MB.
For some storage types, the performance depends on whether the data is transferred from the cache or hard disks. Multiple clients accessing a single file, on storage with a large cache, are essentially measuring the performance of the cache. Multiple clients accessing multiple large files, exceeding the cache size, measure the disk access performance.
Some performance issues only show up under extreme loads in a single direction, such as 100% read or 100% writes. For these reasons, tests were predominantly made using two script types:
1) Single file access from multiple physical clients. 1 to 10 clients access a single file, ramping up by 1 client every hour for 10 hours.
2) Multi-file access from multiple physical and virtual clients. 1 - 40 clients, each access an individual file, increasing by 4 clients every hour for 10 hours. Initially 1 client per physical client, reaching a maximum of 4 clients per physical client.
The two script test types were performed with different access profiles:
1) Production edit access profile, as shown above.
2) 1 MB block size, 100% sequential read access profile
3) 1 MB block size, 100% sequential write access profile
In most of the graphs only the results for 1 MB block size have been plotted, so that the graphical results are clearer. Most results show per client transfer rates. The results labelled as total transfer rates, show the combined total transfer rate for all active clients.

Tech 3362 Media Storage Performance – Design & Benchmarking
25
6. Results and Analysis for Storage Approach 1 The key aim of these tests was to understand how network storage scales and how this was affected by client, network and storage configuration.
6.1 Access Profile and Network Storage Behaviour Varying the access profile will affect the transfer rates of any tests. The use of Direct IO with NFS has a significant effect on data transfer, as can be seen in Figures 17 and 18. With Direct IO disabled, the whole file is transferred into local cache in as large blocks as possible, resulting in a peak in network transfer. With Direct IO, the network transfer rate is lower, but more constant.
Figure 17: Network Utilisation with Direct IO disabled.
Figure 18: Network Utilisation with Direct IO enabled.
The more data requested, the greater the transfer rate, up to the limit of the line rate. Transfer rates increased with both data length and increasing block size, as more TCP packets were transferred during each access. This can be seen in Figure 19.

Media Storage Performance – Design & Benchmarking Tech 3362
26
Figure 19: Transfer Rate vs. Data Length for Different Block Sizes
In Figure 20 the large block sizes increased the transfer rate. However, for some storage types, as the random nature of the access request increased, the transfer rate dropped off.
Increasing the random access percentage countered any read ahead algorithms and increased the distance the disk heads needed to move on the disks, slowing down the disk access. This was more noticeable at larger block sizes, where more data was accessed.
Figure 20: Transfer Rate vs. Increase in % Random Access
0
20
40
60
80
100
120
1M 10M 100M 1G 2G
Tra
nsf
er R
ate
(Mb
yte/
s)
Data Length
Sequential Read: Transfer Rate vs. Data Length
1M
512k
256k
128k
64k
32k
16k
8k
4k
0
10
20
30
40
50
60
10% 20% 30% 40% 50% 60% 70% 80% 90%
Tra
nsf
er R
ate
(Mb
yte/
s)
% Random Access
Random Read: Transfer Rate vs. Increasing Random Access
1M
512k
256k
128k
64k
32k
16k
8k
4k

Tech 3362 Media Storage Performance – Design & Benchmarking
27
6.2 Effect of Block Size on Transfer Rate and Latency Increasing the block size increased transfer rate, but also increased the latency. This can be seen in the sequential read results shown in Figures 21 and 22.
Figure 21: Sequential Read Transfer Rate for Increasing Block Sizes
Figure 22: Sequential Read Average Latency for Increasing Block Sizes
Larger block sizes transferred more data for each access, so the transfer rate increased with block size. However, large block sizes required more data and took longer to load, so the latency increased with block size. In Figure 22 the average latency was slightly higher for the first three clients’ measurements. This suggests the file access and caching algorithms adjusted to the access profile as the test ramped up. The effect of caching is discussed further in § 6.3 and § 6.4.
0
10
20
30
40
50
60
70
80
90
100
1 2 3 4 5 6 7 8 9 10
Tra
nsf
er R
ate
(Mb
yte/
s)
Number of Clients
Sequential Read: Transfer Rate vs. Number of Clients
1M
512k
256k
128k
64k
32k
16k
8k
0
5
10
15
20
25
30
1 2 3 4 5 6 7 8 9 10
Ave
rag
e L
ate
nc
y (m
s)
Number of Clients
Sequential Read: Average Latency vs. Number of Clients
1M
512k 256k 128k 64k 32k 16k 8k
4k
Media Storage Performance – Design & Benchmarking Tech 3362
28
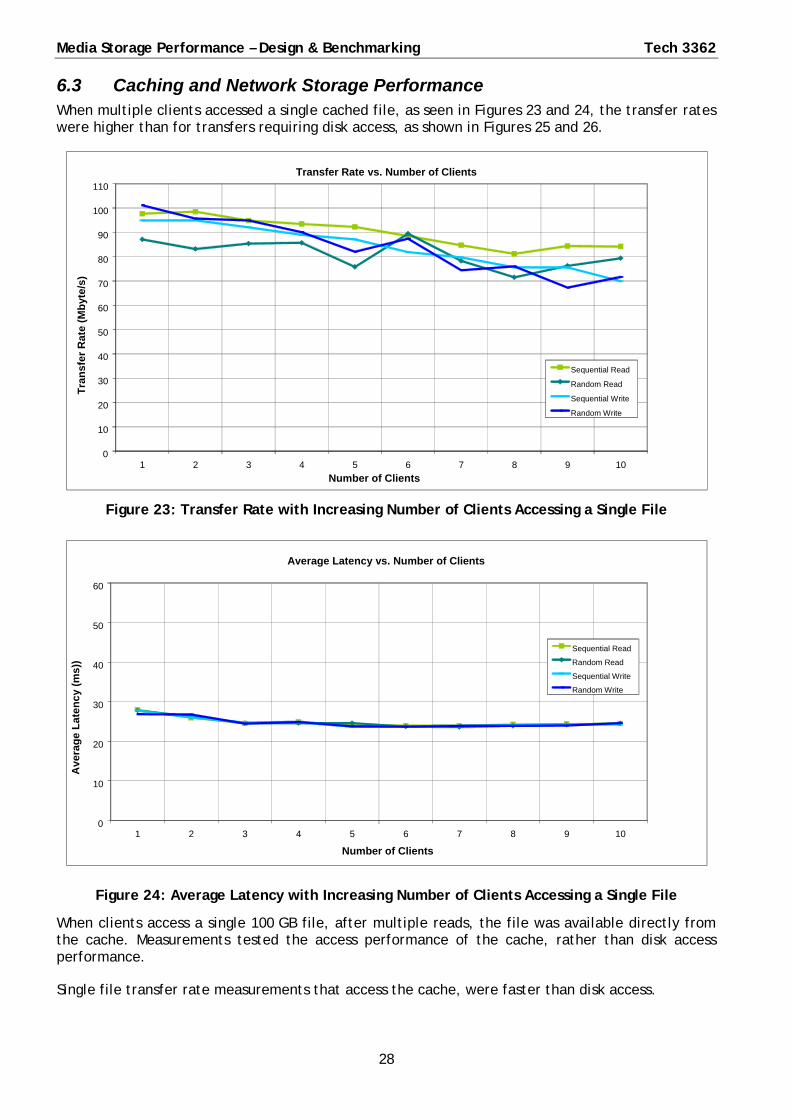
6.3 Caching and Network Storage Performance When multiple clients accessed a single cached file, as seen in Figures 23 and 24, the transfer rates were higher than for transfers requiring disk access, as shown in Figures 25 and 26.
Figure 23: Transfer Rate with Increasing Number of Clients Accessing a Single File
Figure 24: Average Latency with Increasing Number of Clients Accessing a Single File
When clients access a single 100 GB file, after multiple reads, the file was available directly from the cache. Measurements tested the access performance of the cache, rather than disk access performance.
Single file transfer rate measurements that access the cache, were faster than disk access.
0
10
20
30
40
50
60
70
80
90
100
110
1 2 3 4 5 6 7 8 9 10
Tra
nsf
er R
ate
(Mb
yte/
s)
Number of Clients
Transfer Rate vs. Number of Clients
Sequential Read Random Read
Sequential Write Random Write
0
10
20
30
40
50
60
1 2 3 4 5 6 7 8 9 10
Number of Clients
Average Latency vs. Number of Clients
Sequential Read Random Read
Sequential Write
Random Write
Ave
rag
e L
ate
nc
y (m
s))
Tech 3362 Media Storage Performance – Design & Benchmarking
29
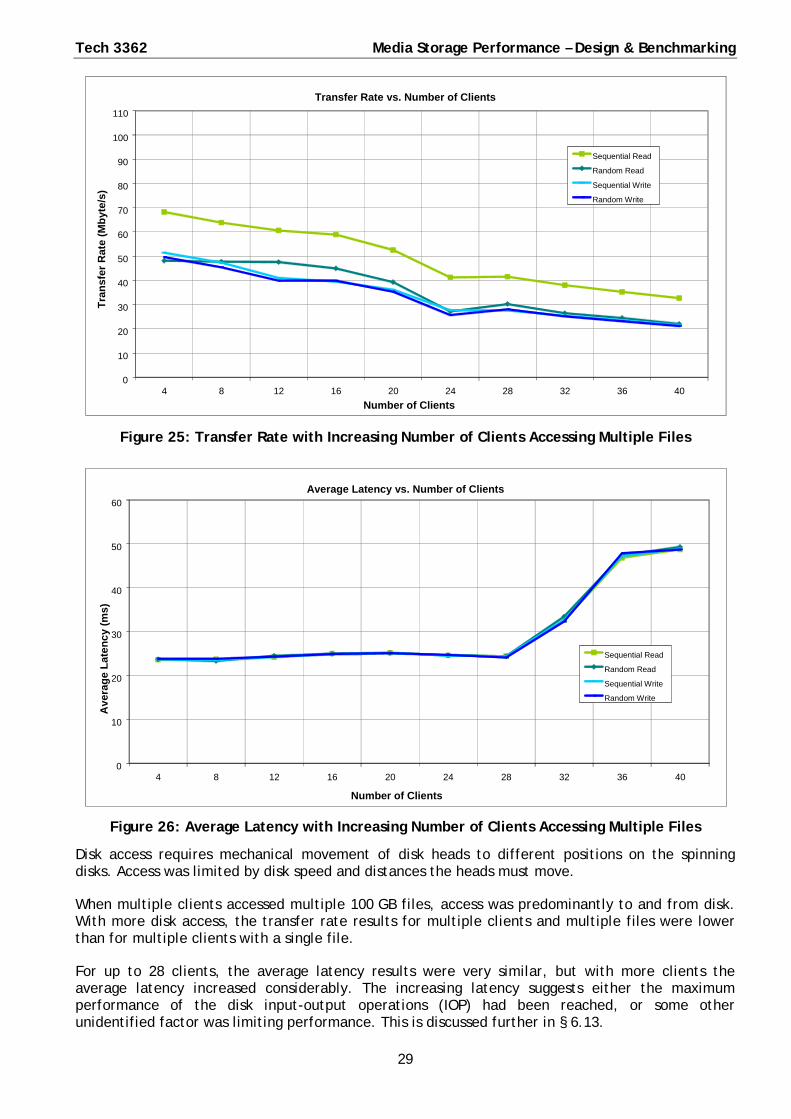
Figure 25: Transfer Rate with Increasing Number of Clients Accessing Multiple Files
Figure 26: Average Latency with Increasing Number of Clients Accessing Multiple Files
Disk access requires mechanical movement of disk heads to different positions on the spinning disks. Access was limited by disk speed and distances the heads must move.
When multiple clients accessed multiple 100 GB files, access was predominantly to and from disk. With more disk access, the transfer rate results for multiple clients and multiple files were lower than for multiple clients with a single file.
For up to 28 clients, the average latency results were very similar, but with more clients the average latency increased considerably. The increasing latency suggests either the maximum performance of the disk input-output operations (IOP) had been reached, or some other unidentified factor was limiting performance. This is discussed further in § 6.13.
0
10
20
30
40
50
60
70
80
90
100
110
4 8 12 16 20 24 28 32 36 40
Tra
nsf
er R
ate
(Mb
yte/
s)
Number of Clients
Transfer Rate vs. Number of Clients
Sequential Read Random Read
Sequential Write
Random Write
0
10
20
30
40
50
60
4 8 12 16 20 24 28 32 36 40
Number of Clients
Average Latency vs. Number of Clients
Sequential Read Random Read
Sequential Write
Random Write
Ave
rag
e L
ate
nc
y (m
s)

Media Storage Performance – Design & Benchmarking Tech 3362
30
6.4 Cold Cache and Network Storage Performance If the storage cache is ‘cold’, i.e. not populated or populated by other files, the read transfer rate performance can behave very differently, as shown in Figures 27 and 28.
Figure 27: Transfer Rate with Increasing Number of Clients Accessing a Single File
Figure 28: Average Latency with Increasing Number of Clients Accessing a Single File
During the test, the numbers of clients increased in 1 hour steps. Initially, there were no blocks from the test file in the cache, and the read transfer rate was slow. Over time, the storage cache became populated with blocks from the test file and the transfer rate increased. The transfer rate levelled off due to opposing performance effects. Caching increased performance, but increasing demand from more and more clients reduced performance. Write data was cached, for future reads, but this did not affect how fast data was written to disk.
In file based production, this effect would be particularly important when starting a new edit project, as the initial storage performance would be lower.
0
10
20
30
40
50
60
70
80
90
100
1 2 3 4 5 6 7 8 9 10
Tra
nsf
er R
ate
(Mb
yte/
s)
Number of Clients
Transfer Rate vs. Number of Clients
Sequential Read Random Read
Sequential Write Random Write
0
10
20
30
40
50
60
1 2 3 4 5 6 7 8 9 10
Ave
rag
e L
ate
nc
y (m
s)
Number of Clients
Average Latency vs. Number of Clients
Sequential Read Random Read
Sequential Write
Random Write
Tech 3362 Media Storage Performance – Design & Benchmarking
31
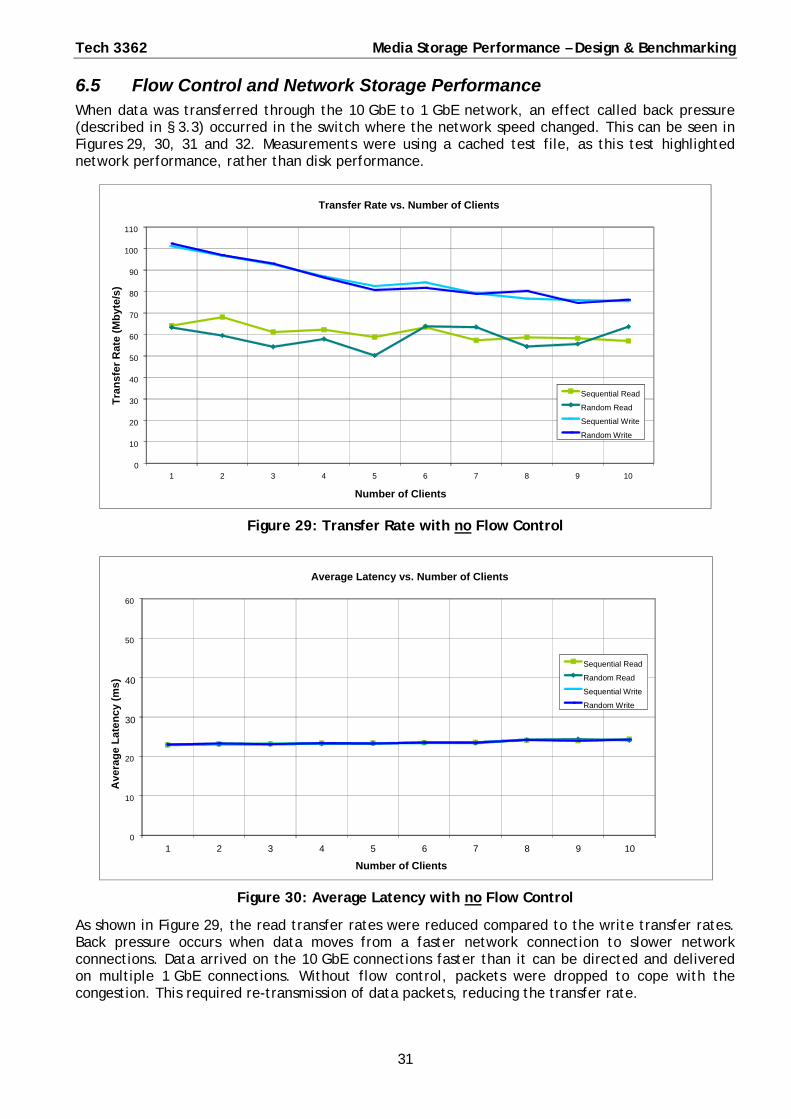
6.5 Flow Control and Network Storage Performance When data was transferred through the 10 GbE to 1 GbE network, an effect called back pressure (described in § 3.3) occurred in the switch where the network speed changed. This can be seen in Figures 29, 30, 31 and 32. Measurements were using a cached test file, as this test highlighted network performance, rather than disk performance.
Figure 29: Transfer Rate with no Flow Control
Figure 30: Average Latency with no Flow Control
As shown in Figure 29, the read transfer rates were reduced compared to the write transfer rates. Back pressure occurs when data moves from a faster network connection to slower network connections. Data arrived on the 10 GbE connections faster than it can be directed and delivered on multiple 1 GbE connections. Without flow control, packets were dropped to cope with the congestion. This required re-transmission of data packets, reducing the transfer rate.
0
10
20
30
40
50
60
70
80
90
100
110
1 2 3 4 5 6 7 8 9 10
Tra
nsf
er R
ate
(Mb
yte/
s)
Number of Clients
Transfer Rate vs. Number of Clients
Sequential Read Random Read
Sequential Write
Random Write
0
10
20
30
40
50
60
1 2 3 4 5 6 7 8 9 10
Ave
rag
e L
ate
nc
y (m
s)
Number of Clients
Average Latency vs. Number of Clients
Sequential Read Random Read
Sequential Write
Random Write

Media Storage Performance – Design & Benchmarking Tech 3362
32
Figure 31: Transfer Rate with Flow Control
Figure 32: Average Latency with Flow Control
With flow control enabled on the 10 GB link between the switch and the storage, read and write transfer rates were very similar, as seen in Figure 31.
Congestion in the switch was controlled using MAC messages, called pause frames. The pause frames reduced congestion by requesting that the storage NIC pause data transmission until the current packets were clear the switch. Transfer rates were maintained, without dropping packets and without requiring re-transmission of data.
As can be seen in Figures 30 and 32, the average latency results, with and without flow control, were very similar. The test tool measured the latency as delays that were not part of the actual data transmission. Packet loss, re-transmission and pause frames were all part of the data transmission process and therefore affected the transfer rate and were not counted as part of the latency. This was to differentiate between the file access process and the transmission process.
0
10
20
30
40
50
60
70
80
90
100
110
1 2 3 4 5 6 7 8 9 10
Tra
nsf
er R
ate
(Mb
yte/
s)
Number of Clients
Transfer Rate vs. Number of Clients
Sequential Read Random Read
Sequential Write
Random Write
0
10
20
30
40
50
60
1 2 3 4 5 6 7 8 9 10
Ave
rag
e L
ate
nc
y (m
s)
Number of Clients
Average Latency vs. Number of Clients
Sequential Read Random Read
Sequential Write
Random Write
Tech 3362 Media Storage Performance – Design & Benchmarking
33
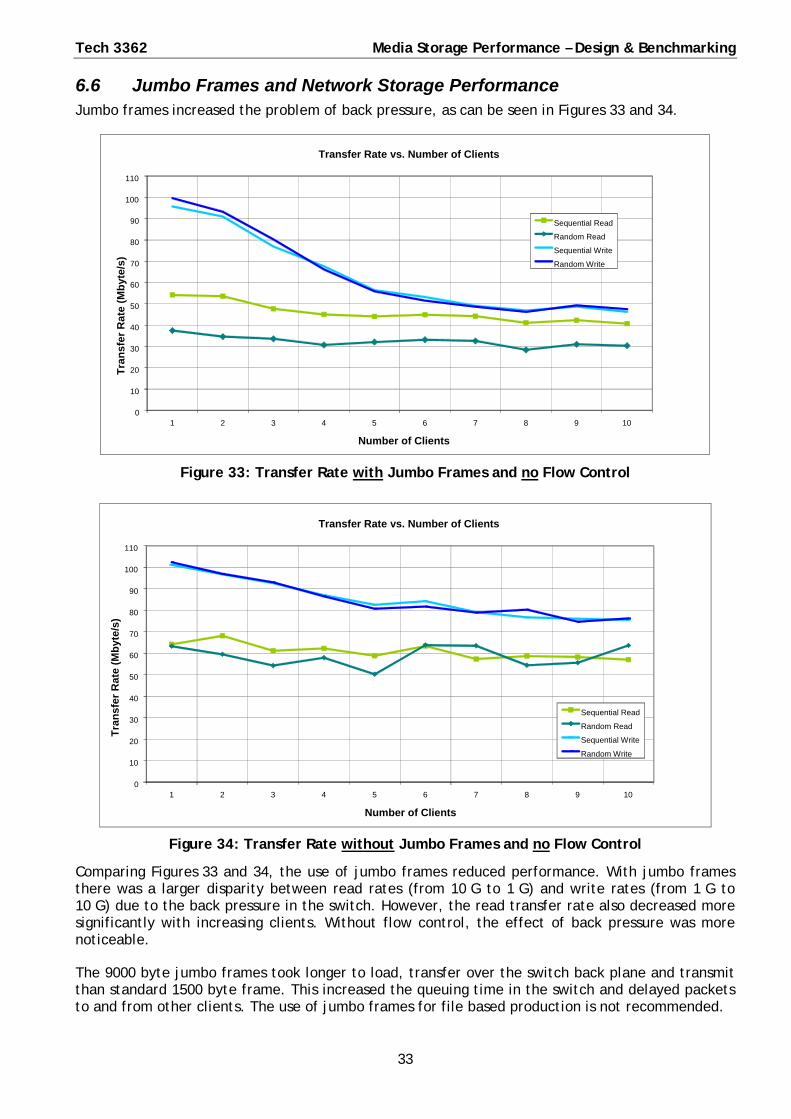
6.6 Jumbo Frames and Network Storage Performance Jumbo frames increased the problem of back pressure, as can be seen in Figures 33 and 34.
Figure 33: Transfer Rate with Jumbo Frames and no Flow Control
Figure 34: Transfer Rate without Jumbo Frames and no Flow Control
Comparing Figures 33 and 34, the use of jumbo frames reduced performance. With jumbo frames there was a larger disparity between read rates (from 10 G to 1 G) and write rates (from 1 G to 10 G) due to the back pressure in the switch. However, the read transfer rate also decreased more significantly with increasing clients. Without flow control, the effect of back pressure was more noticeable.
The 9000 byte jumbo frames took longer to load, transfer over the switch back plane and transmit than standard 1500 byte frame. This increased the queuing time in the switch and delayed packets to and from other clients. The use of jumbo frames for file based production is not recommended.
0
10
20
30
40
50
60
70
80
90
100
110
1 2 3 4 5 6 7 8 9 10
Tra
nsf
er R
ate
(Mb
yte/
s)
Number of Clients
Transfer Rate vs. Number of Clients
Sequential Read Random Read
Sequential Write
Random Write
0
10
20
30
40
50
60
70
80
90
100
110
1 2 3 4 5 6 7 8 9 10
Tra
nsf
er R
ate
(Mb
yte/
s)
Number of Clients
Transfer Rate vs. Number of Clients
Sequential Read Random Read
Sequential Write
Random Write

Media Storage Performance – Design & Benchmarking Tech 3362
34
6.7 Fragmentation and Network Storage Performance It is very important to maintain performance over time. Files on the storage can fragment over many reads and writes, reducing performance. The storage can be configured with a read reallocation algorithm, which attempts to group blocks from the same file, reducing file fragmentation over time. The effect of the read reallocation algorithm on performance can be seen by comparing Figures 35 and 36. Both results were measured after several days of continuous access.
Figure 35: Transfer Rate with Read Reallocation
Figure 36: Transfer Rate with no Read Reallocation
Comparing the performance after many hours of use, the use of read reallocation had a very significant effect on performance. Over time, without read reallocation, there was a 24 Mbyte/s drop in performance. A real production environment would require a mechanism to deal with file fragmentation. An independent defragmentation mechanism could affect performance during normal use; ideally it would be run during periods of inactivity or of low activity.
0
10
20
30
40
50
60
70
80
90
100
110
4 8 12 16 20 24 28 32 36 40
Tra
nsf
er R
ate
(Mb
yte/
s)
Number of Clients
Transfer Rate vs. Number of Clients
Sequential Read Random Read
Sequential Write
Random Write
0
10
20
30
40
50
60
70
80
90
100
110
4 8 12 16 20 24 28 32 36 40
Tra
nsf
er R
ate
(Mb
yte/
s)
Number of Clients
Transfer Rate vs. Number of Clients
Sequential Read Random Read
Sequential Write
Random Write

Tech 3362 Media Storage Performance – Design & Benchmarking
35
6.8 Disk Scattering and Network Storage Performance File scattering [3], referred to as randomised allocation in this storage approach, was a technique to limit the performance reduction with increasing disk utilisation.
Randomised allocation was set by default in the storage, so there were no results for this section. Figures 37a, 37b and 38 are diagrams to explain the concept of randomised allocation.
Due to the difference in track lengths between the edge and centre of a hard disk, the read write speeds at the edge of a disk are much faster than at the centre. If files are written from the edge inwards, as shown in Figure 37a, the first files will have very high access speeds. However, access speed will reduce significantly as the disk fills up and tracks close to the centre are used, as shown by the red curved section in Figure 38.
If files are randomly allocated on inner and outer tracks, as shown in Figure 37b, the access speed is lower, but the access speed will remain more constant as the disk fills up, as shown by the black flat section in Figure 38.
Figure 37a: Edge Inwards File Allocation Figure 37b: Randomised File Allocation
Disk Utilisation
& Time
Transfer Rate
Transfer rate with randomised allocation
Initial transfer rate without randomised alloc.
Reduced transfer without randomised alloc.
Figure 38: Performance vs. Time for Edge Inwards and Randomised Allocation
The use of random allocation is very important, as it prevents drastic changes in performance with increased disk utilisation, as shown in Figure 38.
In a real production environment using storage without randomised allocation, an un-predictable drastic change in performance could cause severe problems. If the system was specified based on file access performance with low disk utilisation, the production tools could be unusable as the disks fill up.

Media Storage Performance – Design & Benchmarking Tech 3362
36
6.9 SAS and Near Line SAS Network Storage Performance SAS and Near Line SAS offer different performance, reliability and cost. SAS disk are faster, more reliable, smaller in capacity and more expensive. The SATA disks used for Near Line SAS are slower, less reliable, higher in capacity and cheaper.
However, this is not the whole story. The SAS storage consisted of 9 TB using 23 disks and the Near Line SAS storage consisted of 40 TB using 68 disks.
As can be seen in Figures 39, 40, 41 and 42, the transfer rates and average latency results for both SAS and Near Line SAS storage were very similar.
Figure 39: Transfer Rate for Storage with SAS Disks, 9 TB (23 disks)
Figure 40: Average Latency for Storage with SAS Disks, 9 TB (23 disks)
0
10
20
30
40
50
60
70
80
90
100
110
4 8 12 16 20 24 28 32 36 40
Tra
nsf
er R
ate
(Mb
yte/
s)
Number of Clients
Transfer Rate vs. Number of Clients
Sequential Read Random Read
Sequential Write
Random Write
0
10
20
30
40
50
60
4 8 12 16 20 24 28 32 36 40
Ave
rag
e L
ate
nc
y (m
s)
Number of Clients
Average Latency vs. Number of Clients
Sequential Read Random Read
Sequential Write
Random Write

Tech 3362 Media Storage Performance – Design & Benchmarking
37
Figures 41: Transfer Rate for Storage with Near Line SAS Disks, 40 TB (68 disks)
Figures 42: Average Latency for Storage with Near Line SAS Disks, 40 TB (68 disks)
Disk access IOP speed was determined by both the disk speed and the number of disks. Although individually the SAS disks outperformed the Near Line SAS disks, the greater number of Near Line SAS disks provided a similar performance.
In reality, a production facility would employ a mix of SAS and Near Line SAS storage. SAS storage is employed where small capacity and high performance is required. Near Line SAS storage is employed for large capacity, longer term video file storage. The choice of SAS or Near Line SAS is largely determined by cost and requirement for long term reliability.
The increase in latency after 28 clients is explained later in this document, in § 6.13.
0
10
20
30
40
50
60
70
80
90
100
4 8 12 16 20 24 28 32 36 40
Tra
nsf
er R
ate
(Mb
yte/
s)
Number of Clients
Transfer Rate vs. Number of Clients
Sequential Read Random Read
Sequential Write
Random Write
0
10
20
30
40
50
60
4 8 12 16 20 24 28 32 36 40
Ave
rag
e L
ate
nc
y (m
s)
Number of Clients
Average Latency vs. Number of Clients
Sequential Read Random Read
Sequential Write
Random Write

Media Storage Performance – Design & Benchmarking Tech 3362
38
6.10 1 GbE and 10 GbE Connected Network Storage Performance The main difference between 1 GbE and 10 GbE connected storage, was congestion and back pressure. This can be seen in Figures 43, 44, 45 and 46.
Figure 43: Transfer Rate for 1 GbE Connected Storage
Figure 44: Transfer Rate for 10 GbE Connected Storage
Comparing the transfer rates for 1 GbE (Figure 43) and 10 GbE (Figure 44), the read transfer rates were similar, but the 1 GbE write transfer were much lower.
0
10
20
30
40
50
60
70
80
90
100
110
1 2 3 4 5 6 7 8 9 10
Tra
nsf
er R
ate
(Mb
yte/
s)
Number of Clients
Transfer Rate vs. Number of Clients
Sequential Read Random Read
Sequential Write
Random Write
0
10
20
30
40
50
60
70
80
90
100
110
1 2 3 4 5 6 7 8 9 10
Tra
nsf
er R
ate
(Mb
yte/
s)
Number of Clients
Transfer Rate vs. Number of Clients
Sequential Read Random Read
Sequential Write
Random Write

Tech 3362 Media Storage Performance – Design & Benchmarking
39
For the 10 GbE connected storage read transfers, back pressure was an issue. For the 1 GbE connected storage write transfers, congestion on the 1 GbE storage connection was an issue.
Figure 45: Average Latency for 1 GbE Connected Storage
Figure 46: Average Latency for 10 GbE Connected Storage
Comparing the average latency results for 1 GbE (Figure 45) and 10 GbE (Figure 46), the results were very similar. This was expected, as the latency results were based on storage delays, rather than network delays.
Both transfer and latency results were very much determined by the 50% read/write and 10% random/ sequential access profile. Very different results were achieved with a 100% sequential read profile, as shown in § 6.11.
0
10
20
30
40
50
60
1 2 3 4 5 6 7 8 9 10
Ave
rag
e L
ate
nc
y (m
s)
Number of Clients
Average Latency vs. Number of Clients
Sequential Read Random Read
Sequential Write
Random Write
0
10
20
30
40
50
60
1 2 3 4 5 6 7 8 9 10
Ave
rag
e L
ate
nc
y (m
s)
Number of Clients
Average Latency vs. Number of Clients
Sequential Read Random Read
Sequential Write
Random Write

Media Storage Performance – Design & Benchmarking Tech 3362
40
6.11 Sequential Read Only Performance for 1 GbE and 10 GbE Connected Storage
Testing the storage using just 100% sequential reads, provided a different view of storage connection speed and showed the effect of single threaded and multi-threaded client access. Performing a single file access test, using a single meter worker program for each physical client was a good example of single threaded client access. The storage cache was heavily utilised, so these results provided a better view of network, storage NIC and storage bus performance. The results for this can be seen in Figures 47 and 48. Performing a multi-file access test, using a multiple worker programs per client was a good example of multi-threaded client access. Disk, storage bus and network were heavily utilised. The results for this are shown in Figures 49 and 50.
Figure 47: Single Threaded Read Only Transfer Rate for 1 and 10 GbE Connected Storage
Figure 48: Single Threaded Read Only Average Latency for 1 GbE Connected Storage
The transfer rates for 10 GbE connected storage (Figure 47) were greater than for 1 GbE connected storage, but only by roughly 50%. For 10 GbE, the transfer rate could have been limited by the
0
50
100
150
200
250
300
350
1 2 3 4 5 6 7 8 9 10
Tra
nsf
er R
ate
(Mb
yte/
s)
Number of Clients
Total Transfer Rate vs. Number of Clients
10 GbE Sequential Read
1 GbE Sequential Read
0
25
50
75
100
125
150
175
200
225
250
1 2 3 4 5 6 7 8 9 10
Ave
rag
e L
ate
nc
y (m
s)
Number of Clients
Average Latency vs. Number of Clients
1 GbE Sequential Read
10 GbE Sequential Read

Tech 3362 Media Storage Performance – Design & Benchmarking
41
storage head speed or some other factor. The theoretical maximum speed on the storage internal bus was 4 Gbit/s (500 Mbyte/s). However, the transfer rate over 10 GbE for this test limited at approximately 2 Gbit/s (250 Mbyte/s). Congestion or some other factor is limiting the transfer rate. This is investigated further in § 7. A reduction in performance for 1 GbE and 10 GbE connected storage can also be seen in the average latency results (Figure 48). Both latencies increased with number of clients. As expected, the average latency for 1 GbE connected storage was larger, again by approximately 50%.
Figure 49: Multi Threaded Read Only Transfer Rate for 1 and 10 GbE Connected Storage
Figure 50: Multi Threaded Read Only Average Latency for 1 and 10 GbE Connected Storage
Even though the number of physical clients and connections were the same and greater disk access was required, multi-threaded access severely increased demand on the storage and network infrastructure. Comparing the single file (Figure 47) and multi file (Figure 49) transfer rates, there was different behaviour for 1 GbE and 10 GbE connected storage. The multi file 10 GbE transfer rate had increased, but the 1 GbE transfer rate results saturated almost immediately at approximately 150 Mbyte/s.
0
50
100
150
200
250
300
350
4 8 12 16 20 24 28 32 36 40
Tra
nsf
er R
ate
(Mb
yte/
s)
Number of Clients
Total Transfer Rate vs. Number of Clients
10 GbE Sequential Read 1 GbE Sequential Read
0
25
50
75
100
125
150
175
200
225
250
4 8 12 16 20 24 28 32 36 40
Ave
rag
e L
ate
nc
y (m
s)
Number of Clients
Average Latency vs. Number of Clients
1 GbE Sequentail Read
10 GbE Sequential Read

Media Storage Performance – Design & Benchmarking Tech 3362
42
The 1 GbE transfer rate was definitely limited by the connection speed, suggesting congestion. Comparing the single file (Figure 48) and multi file (Figure 50) average latency, there was a significant difference between single file and multi file results. The average latency for multi file, multi-threaded access, was 3 times that of the single file results. Multi-file access requires greater disk activity, as it effectively bypassed the large cache. However both the single and multi file transfer rate results also suggested increased congestion. § 6.10 showed that 1 GbE storage connectivity scaled poorly for write access. These results show that under heavy load, the read results also scaled poorly. The results suggest that network congestion was still a factor for the 10 GbE connected storage. This is discussed further in § 6.13 and § 7.2.
6.12 Maximum Latency for Storage Type All the results so far have shown average latency. The maximum latency can vary significantly for both single file and multi file access, as shown in Figures 51 and 52.
Figure 51: Single File Maximum Latency for 10 GbE Connected Storage with Flow Control
Figure 52: Multi File Maximum Latency for 10 GbE Connected Storage with Flow Control
0
0.05
0.1
0.15
0.2
0.25
0.3
0.35
1 2 3 4 5 6 7 8 9 10
Max
imu
m L
ate
nc
y (s
)
Number of Clients
Maximum Latency vs. Number of Clients
Sequential Read Random Read Sequential Write Random Write
0
0.05
0.1
0.15
0.2
0.25
0.3
0.35
4 8 12 16 20 24 28 32 36 40
Max
imu
m L
ate
ncy
(s)
Number of Clients
Maximum Latency vs. Number of Clients
Sequential Read Random Read Sequential Write Random Write

Tech 3362 Media Storage Performance – Design & Benchmarking
43
Although the peak latency tended to increase with increasing number of clients, the extreme peaks in latency appear to be random in nature. These occurred when slow disk access coincided with other delays in the system. For example, when access requests requiring large disk travel coincided with congestion in the storage server, network or client. Peak latency is very difficult to predict, interpret and remove. Latency is determined by the constantly changing distribution of disk data and statistical effects.
6.13 Client TCP Window Scaling Limitation Bizarre issues often occur in real production networks under extreme loads or at the limits of server and client performance. Some of these tests found that the client workstations used for storage were too old to fully support extended TCP window scaling.
TCP windows size determines how much data can be in transit, without being acknowledged by the receiver. As the network becomes more congested, the window size is increased to compensate. A diagram of this process is shown in Figure 8.
As the clients did not support extended TCP window scaling, the network reached a level of congestion and delay beyond which the TCP window could not increase. Beyond this point, delayed packets were assumed to be lost and re-transmissions occurred. The re-transmissions increased both the storage and network latency, as shown in Figure 53.
Figure 53: Average Latency without Client Extended TCP Windows Scaling
After 28 clients, the average latency increased significantly. This was the point at which the TCP window could not be extended. During later high performance storage testing, after replacing the client motherboards, the average latency did not increase after 28 clients, as shown in Figure 54.
0
10
20
30
40
50
60
4 8 12 16 20 24 28 32 36 40
Ave
rag
e L
aten
cy (
ms)
Number of Clients
Average Latency vs. Number of Clients
Sequential Read Random Read Sequential Write Random Write
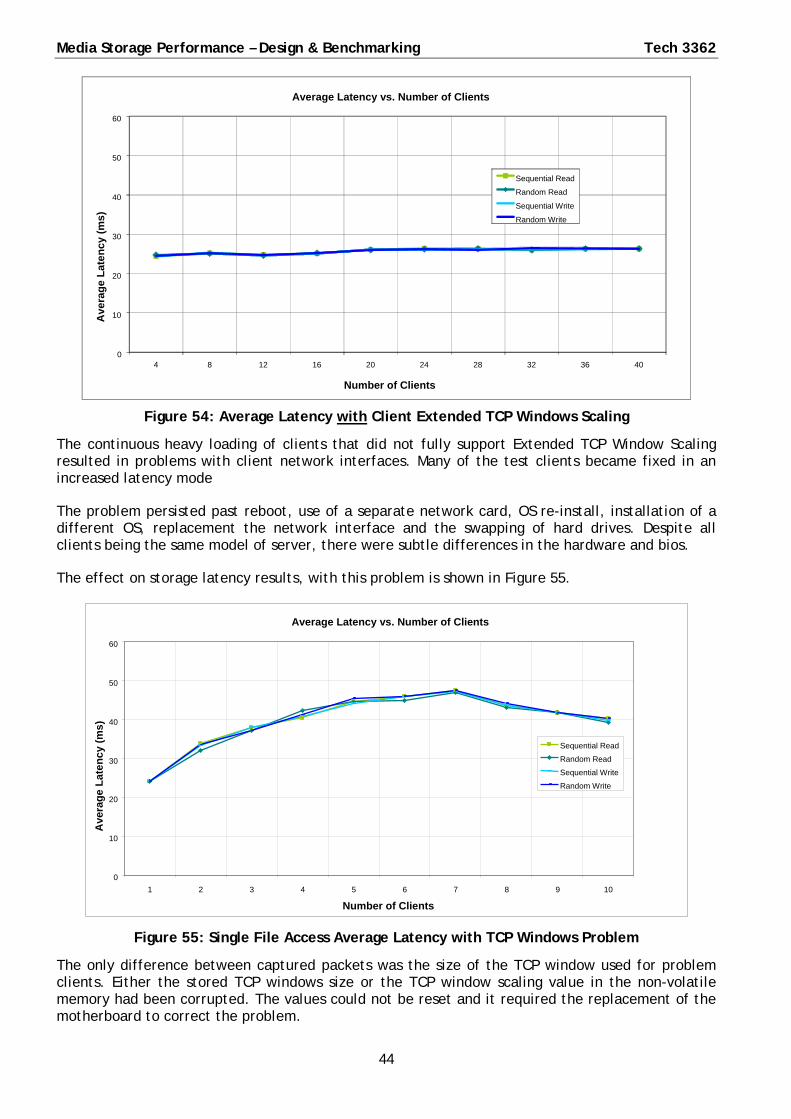
Media Storage Performance – Design & Benchmarking Tech 3362
44
Figure 54: Average Latency with Client Extended TCP Windows Scaling
The continuous heavy loading of clients that did not fully support Extended TCP Window Scaling resulted in problems with client network interfaces. Many of the test clients became fixed in an increased latency mode
The problem persisted past reboot, use of a separate network card, OS re-install, installation of a different OS, replacement the network interface and the swapping of hard drives. Despite all clients being the same model of server, there were subtle differences in the hardware and bios.
The effect on storage latency results, with this problem is shown in Figure 55.
Figure 55: Single File Access Average Latency with TCP Windows Problem
The only difference between captured packets was the size of the TCP window used for problem clients. Either the stored TCP windows size or the TCP window scaling value in the non-volatile memory had been corrupted. The values could not be reset and it required the replacement of the motherboard to correct the problem.
0
10
20
30
40
50
60
4 8 12 16 20 24 28 32 36 40
Ave
rag
e L
ate
nc
y (m
s)
Number of Clients
Average Latency vs. Number of Clients
Sequential Read Random Read
Sequential Write
Random Write
Average Latency vs. Number of Clients
0
10
20
30
40
50
60
1 2 3 4 5 6 7 8 9 10
Number of Clients
Ave
rag
e L
ate
nc
y (m
s)
Sequential Read Random Read
Sequential Write
Random Write

Tech 3362 Media Storage Performance – Design & Benchmarking
45
7. Results and Analysis for Storage Approach 2 As the second storage approach under test, the key aim of these tests was to understand how the network storage performance was affected by network protocol behaviour and the access profile.
7.1 Single File and Multi File Access Storage Performance Storage approach 2, as shown in Figure 11, employed a hardware file system and fast SAS disks. High performance was achieved without the use of a large cache, so there should not be any caching effects. The results for multiple clients accessing a single file and multiple files are shown in Figures 56, 57, 58 and 59.
Figures 56: Transfer Rate with Increasing Number of Clients Accessing a Single File
Figures 57: Average latency with Increasing Number of Clients Accessing a Single File
0
10
20
30
40
50
60
70
80
90
100
110
1 2 3 4 5 6 7 8 9 10
Tra
nsf
er R
ate
(Mb
yte/
s)
Number of Clients
Transfer Rate vs. Number of Clients
Sequential Read Random Read
Sequential Write
Random Write
0
5
10
15
20
25
30
1 2 3 4 5 6 7 8 9 10
Ave
rag
e L
ate
nc
y (m
s)
Number of Clients
Average Latency vs. Number of Clients
Sequential Read
Random Read
Sequential Write
Random Write
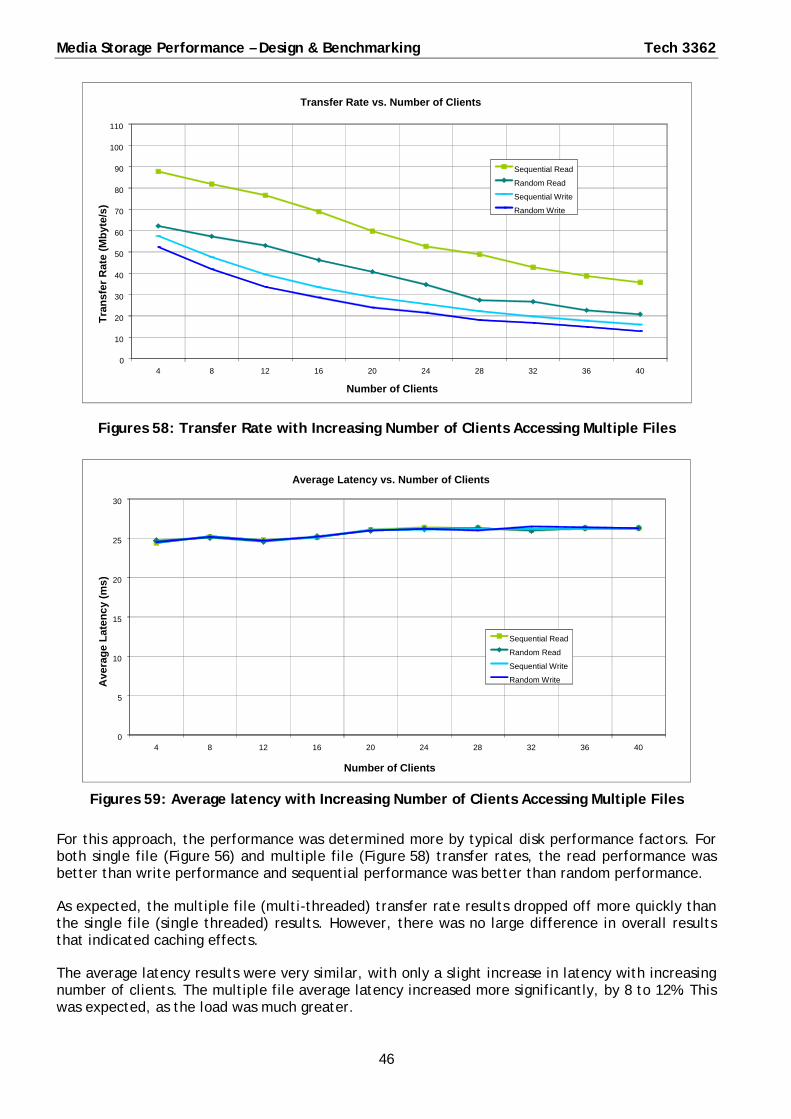
Media Storage Performance – Design & Benchmarking Tech 3362
46
Figures 58: Transfer Rate with Increasing Number of Clients Accessing Multiple Files
Figures 59: Average latency with Increasing Number of Clients Accessing Multiple Files
For this approach, the performance was determined more by typical disk performance factors. For both single file (Figure 56) and multiple file (Figure 58) transfer rates, the read performance was better than write performance and sequential performance was better than random performance.
As expected, the multiple file (multi-threaded) transfer rate results dropped off more quickly than the single file (single threaded) results. However, there was no large difference in overall results that indicated caching effects.
The average latency results were very similar, with only a slight increase in latency with increasing number of clients. The multiple file average latency increased more significantly, by 8 to 12%. This was expected, as the load was much greater.
0
10
20
30
40
50
60
70
80
90
100
110
4 8 12 16 20 24 28 32 36 40
Tra
nsf
er R
ate
(Mb
yte/
s)
Number of Clients
Transfer Rate vs. Number of Clients
Sequential Read Random Read
Sequential Write
Random Write
0
5
10
15
20
25
30
4 8 12 16 20 24 28 32 36 40
Ave
rag
e L
ate
nc
y (m
s)
Number of Clients
Average Latency vs. Number of Clients
Sequential Read Random Read
Sequential Write Random Write
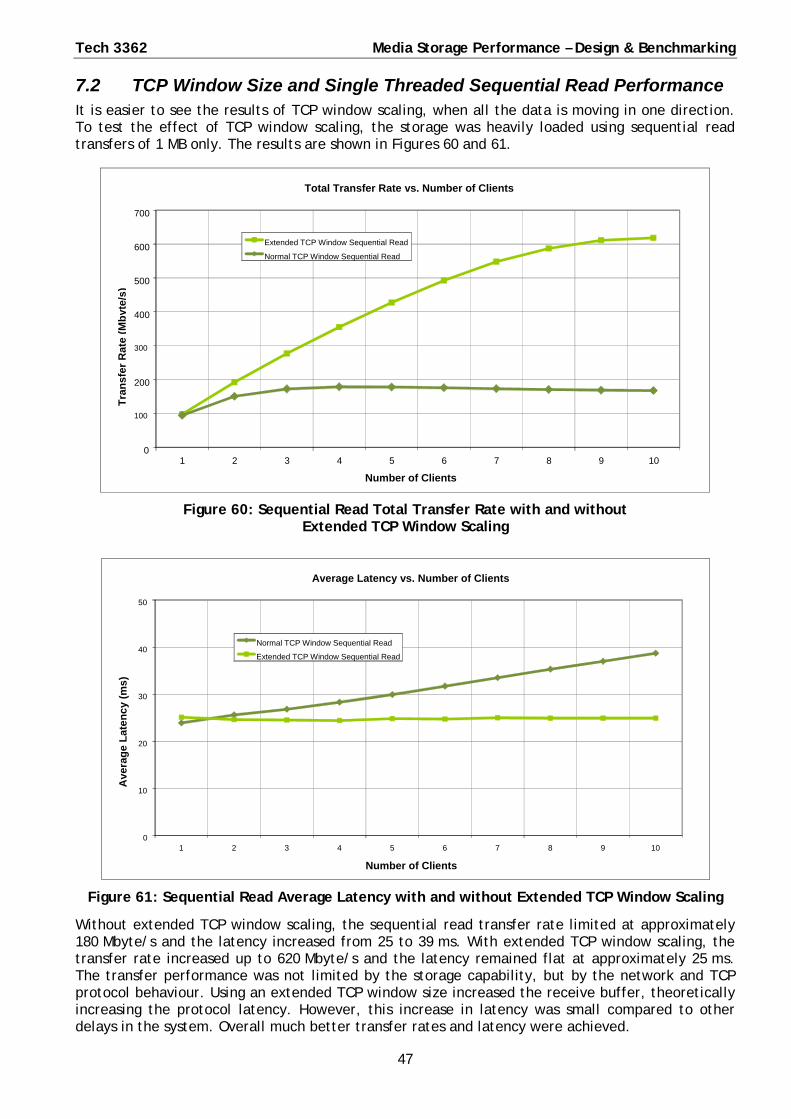
Tech 3362 Media Storage Performance – Design & Benchmarking
47
7.2 TCP Window Size and Single Threaded Sequential Read Performance It is easier to see the results of TCP window scaling, when all the data is moving in one direction. To test the effect of TCP window scaling, the storage was heavily loaded using sequential read transfers of 1 MB only. The results are shown in Figures 60 and 61.
Figure 60: Sequential Read Total Transfer Rate with and without Extended TCP Window Scaling
Figure 61: Sequential Read Average Latency with and without Extended TCP Window Scaling
Without extended TCP window scaling, the sequential read transfer rate limited at approximately 180 Mbyte/s and the latency increased from 25 to 39 ms. With extended TCP window scaling, the transfer rate increased up to 620 Mbyte/s and the latency remained flat at approximately 25 ms. The transfer performance was not limited by the storage capability, but by the network and TCP protocol behaviour. Using an extended TCP window size increased the receive buffer, theoretically increasing the protocol latency. However, this increase in latency was small compared to other delays in the system. Overall much better transfer rates and latency were achieved.
0
100
200
300
400
500
600
700
1 2 3 4 5 6 7 8 9 10
Tra
nsf
er R
ate
(Mb
yte/
s)
Number of Clients
Total Transfer Rate vs. Number of Clients
Extended TCP Window Sequential Read Normal TCP Window Sequential Read
0
10
20
30
40
50
1 2 3 4 5 6 7 8 9 10
Ave
rag
e L
ate
nc
y (m
s)
Number of Clients
Average Latency vs. Number of Clients
Normal TCP Window Sequential Read Extended TCP Window Sequential Read

Media Storage Performance – Design & Benchmarking Tech 3362
48
7.3 TCP Window Size and Multi-Threaded Sequential Read Performance Repeating the TCP window size tests with multi-threaded multi file access increased the demand on both the storage and the network. The results are shown in Figures 62 and 63.
Figure 62: Sequential Read Total Transfer Rate with and without Extended TCP Window Scaling
Figure 63: Sequential Read Average Latency with and without Extended TCP Window Scaling
With up to 40 clients accessing up to 40 files, the effect of TCP window scaling was even more noticeable. With a normal TCP window size, the total transfer rate (summed from all clients) limited immediately at about 180 Mbyte/s and the average latency increased from 30 ms to 120 ms.
With the extended TCP window size, the transfer rate limited at about 620 Mbyte/s. The average latency was significantly improved, increasing from 25 ms to 55 ms over 4 to 40 clients.
With extended TCP window scaling and multi-threaded access, the physical access speed of the storage disks was being approached and network performance was no longer the dominating factor.

Tech 3362 Media Storage Performance – Design & Benchmarking
49
There was a definite drop in total transfer rate between 28 and 40 clients. The total throughput measured by the storage device for 28 and 36 clients are shown in Figures 64 and 65. The disk access latency for the storage with 36 clients is shown in Figure 66.
Figure 64: Total Throughput Measured by Storage for 28 Clients
Figure 65: Total Throughput Measured by Storage for 36 Clients
Figure 66: Disk Access Latency for 36 Clients
There was a significant difference between the throughput, measured by the storage, for 28 clients and 36 clients. For 28 clients, the transfer rate was fairly consistent at 600 Mbyte/s. For 36 clients, the transfer rate was spiky, and varying between 400 - 600 Mbyte/s. This was consistent with flow control pausing packet transfers or disk access latency. The high storage disk access latency measurements (Figure 66) showed that this was a limit in storage performance, rather than network performance.
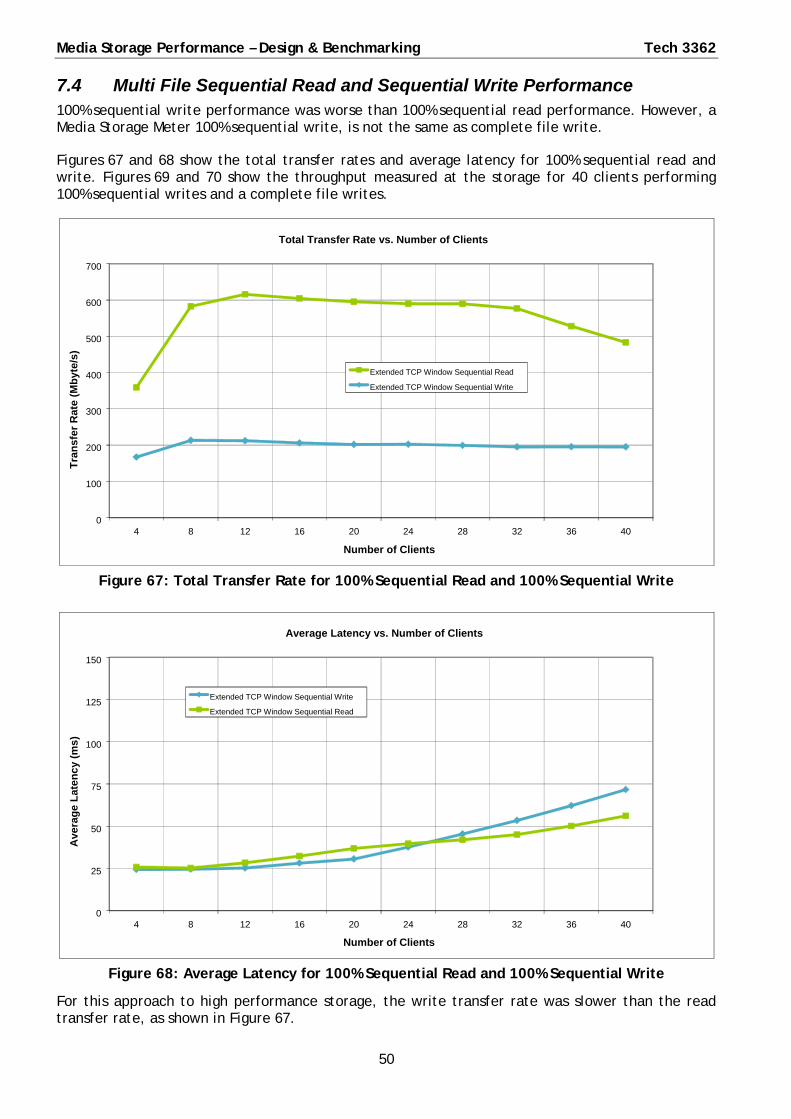
Media Storage Performance – Design & Benchmarking Tech 3362
50
7.4 Multi File Sequential Read and Sequential Write Performance 100% sequential write performance was worse than 100% sequential read performance. However, a Media Storage Meter 100% sequential write, is not the same as complete file write.
Figures 67 and 68 show the total transfer rates and average latency for 100% sequential read and write. Figures 69 and 70 show the throughput measured at the storage for 40 clients performing 100% sequential writes and a complete file writes.
Figure 67: Total Transfer Rate for 100% Sequential Read and 100% Sequential Write
Figure 68: Average Latency for 100% Sequential Read and 100% Sequential Write
For this approach to high performance storage, the write transfer rate was slower than the read transfer rate, as shown in Figure 67.
0
100
200
300
400
500
600
700
4 8 12 16 20 24 28 32 36 40
Tra
nsf
er R
ate
(Mb
yte/
s)
Number of Clients
Total Transfer Rate vs. Number of Clients
Extended TCP Window Sequential Read Extended TCP Window Sequential Write
0
25
50
75
100
125
150
4 8 12 16 20 24 28 32 36 40
Ave
rag
e L
ate
nc
y (m
s)
Number of Clients
Average Latency vs. Number of Clients
Extended TCP Window Sequential Write
Extended TCP Window Sequential Read
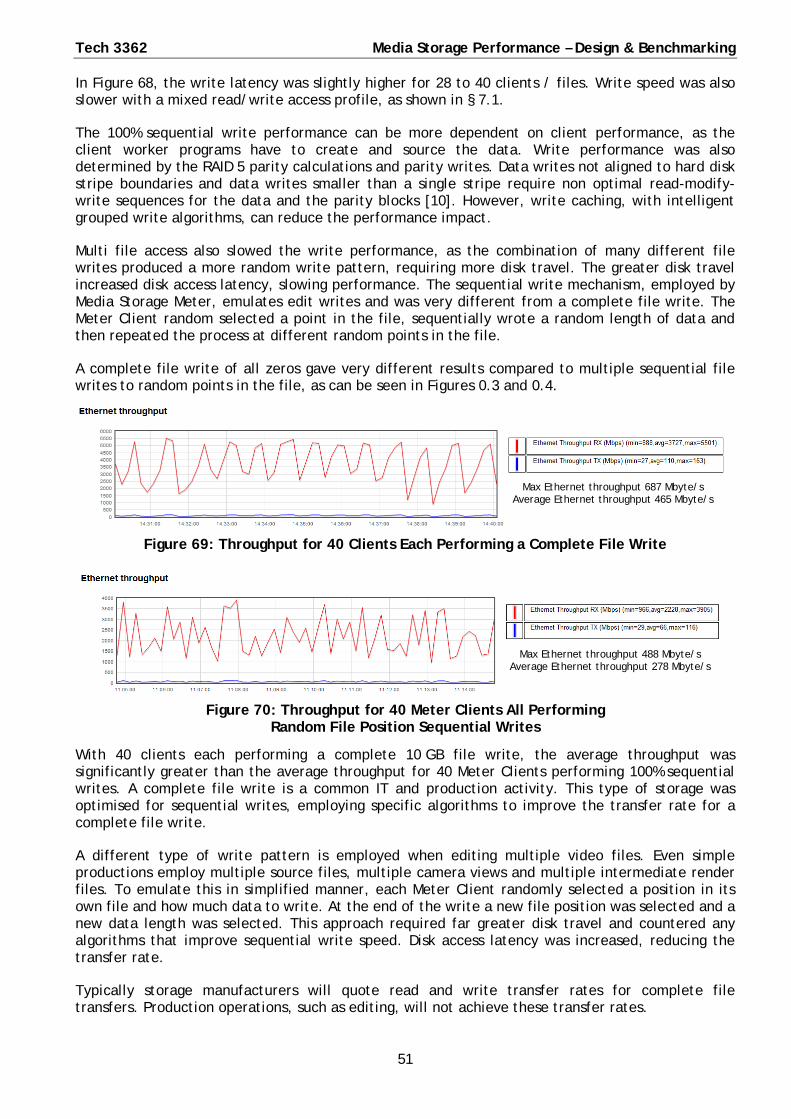
Tech 3362 Media Storage Performance – Design & Benchmarking
51
In Figure 68, the write latency was slightly higher for 28 to 40 clients / files. Write speed was also slower with a mixed read/write access profile, as shown in § 7.1.
The 100% sequential write performance can be more dependent on client performance, as the client worker programs have to create and source the data. Write performance was also determined by the RAID 5 parity calculations and parity writes. Data writes not aligned to hard disk stripe boundaries and data writes smaller than a single stripe require non optimal read-modify-write sequences for the data and the parity blocks [10]. However, write caching, with intelligent grouped write algorithms, can reduce the performance impact.
Multi file access also slowed the write performance, as the combination of many different file writes produced a more random write pattern, requiring more disk travel. The greater disk travel increased disk access latency, slowing performance. The sequential write mechanism, employed by Media Storage Meter, emulates edit writes and was very different from a complete file write. The Meter Client random selected a point in the file, sequentially wrote a random length of data and then repeated the process at different random points in the file.
A complete file write of all zeros gave very different results compared to multiple sequential file writes to random points in the file, as can be seen in Figures 0.3 and 0.4.
Figure 69: Throughput for 40 Clients Each Performing a Complete File Write
Figure 70: Throughput for 40 Meter Clients All Performing Random File Position Sequential Writes
With 40 clients each performing a complete 10 GB file write, the average throughput was significantly greater than the average throughput for 40 Meter Clients performing 100% sequential writes. A complete file write is a common IT and production activity. This type of storage was optimised for sequential writes, employing specific algorithms to improve the transfer rate for a complete file write.
A different type of write pattern is employed when editing multiple video files. Even simple productions employ multiple source files, multiple camera views and multiple intermediate render files. To emulate this in simplified manner, each Meter Client randomly selected a position in its own file and how much data to write. At the end of the write a new file position was selected and a new data length was selected. This approach required far greater disk travel and countered any algorithms that improve sequential write speed. Disk access latency was increased, reducing the transfer rate.
Typically storage manufacturers will quote read and write transfer rates for complete file transfers. Production operations, such as editing, will not achieve these transfer rates.
Max Ethernet throughput 687 Mbyte/s Average Ethernet throughput 465 Mbyte/s
Max Ethernet throughput 488 Mbyte/s Average Ethernet throughput 278 Mbyte/s
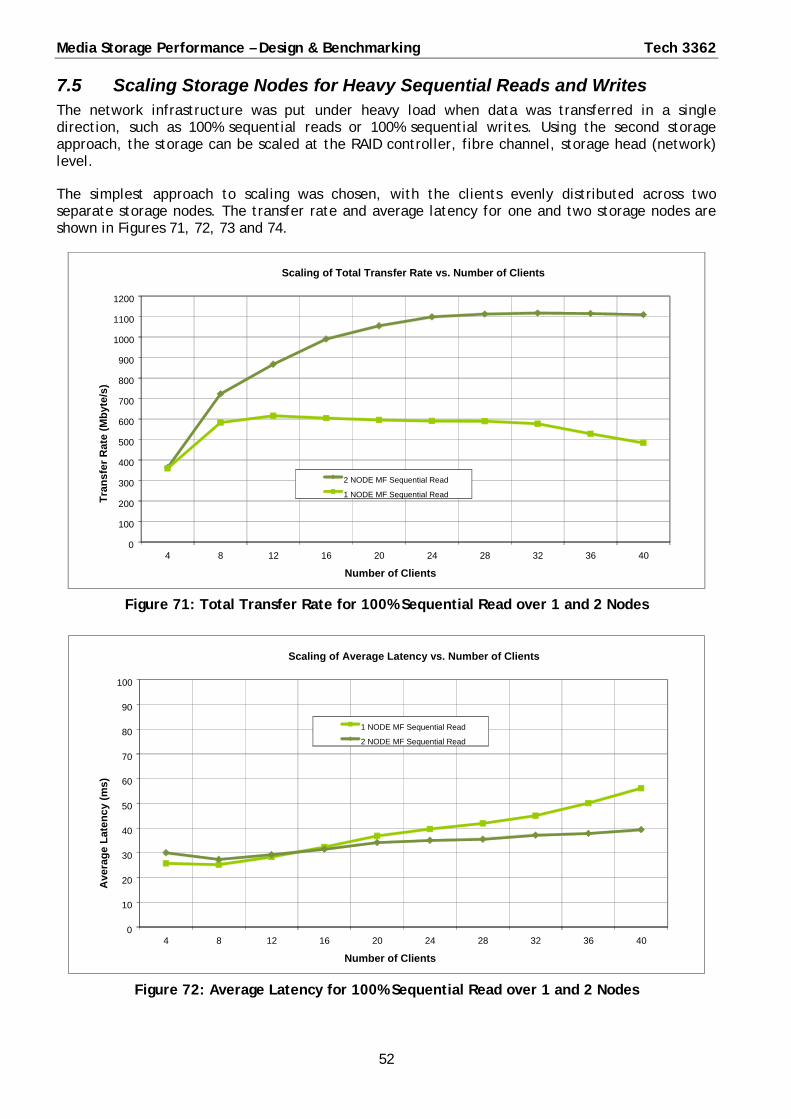
Media Storage Performance – Design & Benchmarking Tech 3362
52
7.5 Scaling Storage Nodes for Heavy Sequential Reads and Writes The network infrastructure was put under heavy load when data was transferred in a single direction, such as 100% sequential reads or 100% sequential writes. Using the second storage approach, the storage can be scaled at the RAID controller, fibre channel, storage head (network) level.
The simplest approach to scaling was chosen, with the clients evenly distributed across two separate storage nodes. The transfer rate and average latency for one and two storage nodes are shown in Figures 71, 72, 73 and 74.
Figure 71: Total Transfer Rate for 100% Sequential Read over 1 and 2 Nodes
Figure 72: Average Latency for 100% Sequential Read over 1 and 2 Nodes
0
100
200
300
400
500
600
700
800
900
1000
1100
1200
4 8 12 16 20 24 28 32 36 40
Tra
nsf
er R
ate
(Mb
yte/
s))
Number of Clients
Scaling of Total Transfer Rate vs. Number of Clients
2 NODE MF Sequential Read
1 NODE MF Sequential Read
0
10
20
30
40
50
60
70
80
90
100
4 8 12 16 20 24 28 32 36 40
Ave
rag
e L
ate
nc
y (m
s)
Number of Clients
Scaling of Average Latency vs. Number of Clients
1 NODE MF Sequential Read
2 NODE MF Sequential Read

Tech 3362 Media Storage Performance – Design & Benchmarking
53
Figure 73: Total Transfer Rate for 100% Sequential Write over 1 and 2 Nodes
Figure 74: Average Latency for 100% Sequential Write over 1 and 2 Nodes
For both read and write, doubling the number of storage devices increased the transfer rate by up to a factor of 2.3 (Figures 71 and 73). For 40 clients, the average latency with two storage nodes was reduced from 71 ms to 54 ms.
Both the improvements in transfer rate and latency increased with number of clients. The network configuration was unchanged, but each storage device was supporting half the number of original clients. This indicates that, for multi file access, the storage performance rather than network performance was the limiting the factor.
0
50
100
150
200
250
300
350
400
450
500
4 8 12 16 20 24 28 32 36 40
Tra
nsf
er R
ate
(Mb
yte/
s)
Number of Clients
Scaling of Total Transfer Rate vs. Number of Clients
2 NODE MF Sequential Write
1 NODE MF Sequential Write
0
10
20
30
40
50
60
70
80
90
100
4 8 12 16 20 24 28 32 36 40
Ave
rag
e L
ate
nc
y (m
s)
Number of Clients
Scaling of Average Latency vs. Number of Clients
1 NODE MF Sequential Write
2 NODE MF Sequential Write

Media Storage Performance – Design & Benchmarking Tech 3362
54
7.6 Maximum Latency for Storage Type The storage employed a hardware based file system and fast SAS disks, so the performance was less dependent on cache and algorithm capability. This approach gave different peak latency behaviour, as shown in Figures 75 and 76.
Figure 75: Peak latency for Single File Access Profile
Figure 76: Peak latency for Multi File Access Profile
For single file access, the peak latency results were exceptionally flat, varying from 24 ms to 38 ms for all access types. Although the peak latency did tend to increase slightly with increasing number of clients, there were no extreme peaks.
For multi file access, the peak latency gradually increased from 26 ms to 112 ms. Occasional peaks of up to 140 ms occurred at around 30 clients. One very large peak of 360 ms occurred at 32 clients. Overall there were few large variations in peak latency. The peaks occurred when delays in the system coincided. Again, the peak latency was very difficult to predict, interpret and remove.
0
0.05
0.1
0.15
0.2
0.25
0.3
0.35
0.4
1 2 3 4 5 6 7 8 9 10
Max
imu
m L
ate
ncy
(s)
Number of Clients
Maximum Latency vs. Number of Clients
Sequential Read Random Read
Sequential Write
Random Write
0
0.05
0.1
0.15
0.2
0.25
0.3
0.35
0.4
4 8 12 16 20 24 28 32 36 40
Max
imu
m L
ate
ncy
(s)
Number of Clients
Maximum Latency vs. Number of Clients
Sequential Read Random Read
Sequential Write
Random Write

Tech 3362 Media Storage Performance – Design & Benchmarking
55
8. Generic IT Storage Performance To highlight the difference between specialised network storage and off the shelf network storage, the standard single file and multi file tests were performed on generic IT storage.
The generic storage consisted of a dual quad core server, connected by a single 4 Gbit/s fibre channel to a RAID 6 array of 8 x 750 GB SATA disks. These were purchased from a general IT products and peripherals supplier. The results from these tests can be seen in Figures 77, 78, 79 and 80.
Figure 77: Single File Access Transfer Rate for 1 GbE Connected Generic Storage
Figure 78: Single File Access Average Latency for 1 GbE Connected Generic Storage
Comparing the single file results to the results in § 6.3 and § 7.1, the average latency values were similar, but the transfer rates were significantly reduced. As expected, the transfer rates for the generic storage were 2 to 5 times lower than for the high performance storage. The generic storage did not scale well with increasing numbers of clients.
Transfer Rate vs. Number of Clients
0
10
20
30
40
50
60
70
80
90
100
110
1 2 3 4 5 6 7 8 9 10 Number of Clients
Tra
nsf
er R
ate
(Mb
yte/
s)
Sequential Read Random Read
Sequential Write
Random Write
Average Latency vs. Number of Clients
0
10
20
30
40
50
60
1 2 3 4 5 6 7 8 9 10 Number of Clients
Ave
rag
e L
ate
nc
y (m
s)
Sequential Read Random Read
Sequential Write
Random Write

Media Storage Performance – Design & Benchmarking Tech 3362
56
Figure 79: Multi File Access Transfer Rate for 1 GbE Connected Generic Storage
Figure 80: Multi File Access Average Latency for 1 GbE Connected Generic Storage
Comparing the multi file results to the results in § 6.3 and § 7.1, the transfer rates were extremely reduced. Worse still were the average latency results, which increased rapidly with the number of clients. It is clear that the generic storage employed in the tests did not scale well with many users and is not suitable for production use.
It is unfair to compare the generic storage with specialist, high performance storage. There is a significant difference in cost; the generic product consisted of a small number of SATA disks with a single NFS server, whereas the specialist storage employed a hardware RAID controller with a 4 Gbit/s FC connection between the server and storage. The specialist products had more disks, more powerful controllers and more advanced access management algorithms than the generic product.
Transfer Rate vs. Number of Clients
0
10 20 30 40 50
60 70 80 90
100 110
4 8 12 16 20 24 28 32 36 40 Number of Clients
Tra
nsf
er R
ate
(Mb
yte/
s)
Sequential Read Random Read Sequential Write Random Write
Average Latency vs. Number ofClients
0
50
100
150
200
250
300
4 8 12 16 20 24 28 32 36 40 Number of Clients
Ave
rag
e L
ate
ncy
(m
s)
Sequential Read Random Read Sequential Write Random Write

Tech 3362 Media Storage Performance – Design & Benchmarking
57
In order to achieve the high level of performance required by media applications, the architecture of a storage system using generic IT components needs to be designed accordingly, i.e. high number of disks, FC connections, file servers etc. But even if the performance is acceptable using generic IT storage systems, it may still lack certain key features like fast failure recovery, snap shots or backup procedures which are important features of high availability scenarios in media production storage.
9. Further Work Possible further work for media storage benchmarking falls under four categories:
1. Improvements to the msMeter measurement tool.
2. Improvements in the test method.
3. Profiling of production workflows.
4. Testing new storage technologies.
9.1 Possible Improvements to the Measurement Tool All the transfer rate performance tests carried out so far have been based on results averaged over the measurement period. Peak latency results have also been captured. These types of measurement are useful for benchmarking media storage, but do not provide much information on instantaneous behaviour of storage. The average and peak results may show up abnormal behaviour, but it would be very difficult to trace back the exact conditions at which the behaviour occurred.
The addition of time stamping to measurements could help with instantaneous measurements analysis:
Add individual time stamps to each block transfer measurement to allow basic offline time based analysis of the detailed results file.
The test tools employ a randomised selection of files, file start point, block sizes and transfer type. The options could be increased to allow a wider range of testing:
Increased block sizes, for testing specialised storage with block sizes greater than 1 MB.
Allow selection of a non repeating randomised sequence that does not repeat data reads. This will overcome difficulties in testing storage types where local data caching cannot be disabled.
Allow selection of fixed data lengths based on video frame sizes for different video resolutions.
Although testing can be automated, the results analysis and install process is manual. Automated mechanisms would speed up testing:
Automate the results analysis for a standardised set of benchmarking tests (idea: can use RRDTool [11] or GnuPlot [12]).
Auto install of meter test client onto target workstation from the msMeter control application.

Media Storage Performance – Design & Benchmarking Tech 3362
58
9.2 Possible Improvements to the Test Method The results analysis in this document is based on averaged results by block size, latency and transfer rate. A more detailed or statistical analysis of the individual measurements could provide a greater understanding of high performance storage.
Instantaneous analysis and performance measurements corresponding to mean throughput values during the buffering time of actual (streaming) applications. Requires time stamping (as explained in § 9.1) and set parameters for defining buffer time and threshold value during buffer time (for notification when desired performance is not achieved).
More tests can be developed to provide more information on the performance of the tested storage:
Analysis of results on a per stream (per Meter Client) basis,
Testing with storage filled at different capacities, e.g. when storage is close to capacity.
Ultimately, a standard test procedure would ease the repeatability and comparison of storage systems:
Standardised test procedures and scripts.
Develop tests to identify the bottlenecks in complex layered storage systems.
9.3 Profiling Production Workflow The main challenge of performance benchmarking is to simulate the workload for the target application and operational environment. There is a need for more understanding of what are the most important factors that need to be stressed and what can be neglected to allow simplification of the problem. Ultimately it would be very useful to have a set of "standardised" profiles or guidelines that would predict storage performance and bottleneck for typical applications.
Develop a set of "standardised" profiles, and/or
Develop guidelines for profiling of a target production workflow
Profiles and guidelines could be extrapolated by offline analysis of captured data or other logging tools:
Develop an automated statistical analysis tool to parse storage protocols in capture files. (For example, the UNIX SAR utility can be used to measure the I/O block sizes and the rate of demand, whether expressed in IOPS or Mbyte/s. In addition, some versions of SAR split out the reads from writes so the ratio can be determined.)
9.4 Measurement of Other Storage Types Many Broadcasters are investigating new technologies for production storage. Some storage technologies that require benchmarking and further investigation are:
Solid state storage.
Virtual or cloud storage technologies.
Storage employing erasure coding [13].

Tech 3362 Media Storage Performance – Design & Benchmarking
59
10. Glossary
B Byte, a binary word containing 8 bits (Note, this is not an SI abbreviation)
CIFS Common Internet File System
DMA Direct Memory Access
DMI Digital Media Initiative
FC Fibre Channel
GbE Gigabit Ethernet
GCC GNU Compiler Collection
GNU GNU is Not Unix
GUI Graphical User Interface
IO Input Output
IOP Input/Output Operations
IP Internet Protocol
LUN Logical Unit Number
MAC Media Access Control
MF Multi File
NFS Network File System
NIC Network Interface Card
OS Operating System
PDU Protocol Data Unit
QoS Quality of Service
RAID Redundant Array of Independent Disks
RAID-DP RAID Double Parity
SAS Serial Attached SCSI
SATA Serial Advanced Technology Attachment
SCSI Small Computer System Interface
SDK Software Development Kit
SF Single File
SMB Server Message Block
TCP Transmission Control Protocol
WAFL Write Anywhere File Layer
Win 32 Windows 32 Bit Operating System
Win 64 Windows 64-bit Operating System
WIP [Media production] Work In Progress

Media Storage Performance – Design & Benchmarking Tech 3362
60
11. References
[1] Butler, D, BBC R&D, Feb 2013, White Paper WHP 237: Getting the Best out of High Performance Network Storage on Generic IT Infrastructure http://www.bbc.co.uk/rd/publications/whitepaper237
[2] Intel Corporation, 2012. Customer Support Document CS-031831 Choosing between SAS vs. SATA Hard Disk for your Server RAID System US: Intel Corporation http://www.intel.com/support/motherboards/server/sb/cs-031831.htm
[3] Andries, L, VRT, 2011, European Broadcast Union Networks Seminar, 28 - 29 June 2011 / Geneva (CH) Media Storage Fundamentals - How to guarantee predictable performance http://tech.ebu.ch/events/networks11
[4] Callaghan, B, 1995. NFS Version 3 Protocol Specification, RFC 1813. US: Sun Microsystems, Inc. http://www.ietf.org/rfc/rfc1813.txt
[5] Smith, C, NFS Source Forge, 2012. Linux NFS Overview, FAQ and HOWTO Documents US: Source Forge http://nfs.sourceforge.net/
[6] Spurgeon, C, 2000. Ethernet: The Definitive Guide. US: O'Reilly Media, Inc. Ethernet Flow Control, MAC Protocol and Pause Frames ISBN-13: 978-1-56592-660-8
[7] Noureddine, W; Tobagi, F, Global Telecommunications Conference, 1999. Selective back-pressure in switched Ethernet LANs US: Computer Systems Laboratory, Stanford University http://reference.kfupm.edu.sa/content/s/e/selective_backpressure_in_switched_ether_51120.pdf
[8] Jacobson, V, IETF, 1992. Network Working Group US: Internet Engineering Task Force RFC 1323 TCP Extensions for High Performance www.ietf.org/rfc/rfc1323.txt
[9] Butler, D, BBC R&D, 2011, Media Storage Meter 2 on Source Forge UK: Sourceforge http://sourceforge.net/projects/msmeter/ R&D Technical Notes RD3350, RD3351, R&D 2412, R&D 2509, R&D 2572.
[10] Gopinath, K. USENIX, 2000, USENIX Annual Technical Conference India: Indian Institute of Science, Bangalore. A 3-Tier Raid Storage System with RAID1, RAID5 and Compressed RAID5 for Linux. http://static.usenix.org/event/usenix2000/freenix/full_papers/gopinath/gopinath.pdf
[11] RRDTool, Open source data logging and graphing system. DE: Tobias Oetiker, OETIKER+PARTNER AG http://oss.oetiker.ch/rrdtool/
[12] Gnuplot, Portable command-line driven graphing utility for Linux. UK: Sourceforge http://www.gnuplot.info/
[13] Weatherspoon, H & Kubiatowicz, D. April 2002. Computer Science Division, University of California, Berkeley Erasure Coding vs. Replication: A Quantitative Comparison www.ietf.org/rfc/rfc1323.txt


![EBU-TT (EBU Tech 3350) · Version 1.2 of EBU Tech 3350 (EBU-TT Part 1) ... Tech 3370 [4] and Tech 3390 (Part M) [5]. ... 2009 Chapter 4](https://img.dokumen.tips/doc/110x75/5b010cb27f8b9a54578d9d53/ebu-tt-ebu-tech-3350-12-of-ebu-tech-3350-ebu-tt-part-1-tech-3370-4-and.jpg)