Embed Size (px)
Citation preview
Tech Exit Transaction Multiples - France 2019 Edition© 2019 Avolta Partners // www.avoltapartners.com
Tech Exit Transaction MultiplesFrance 2019 Edition
French unicorns exits: a fantasy?

Tech Exit Transaction Multiples - France 2019 Edition© 2019 Avolta Partners // www.avoltapartners.com 2
Avolta PartnersEdito
French unicorns, a fantasy?
How insubordinate is that?
Our religion is data. Despite all the recent fuss about French Tech, Next40, French unicorns, the Startup-Nation, we do not fall dumbly into the ranksof wishful thinking. Reality is quite simple: fundraisings are growing fast yet, the Tech industry in France is still pretty immature compared to its UK andGerman neighbours, not to mention the US and has failed to produce giant exits so far.
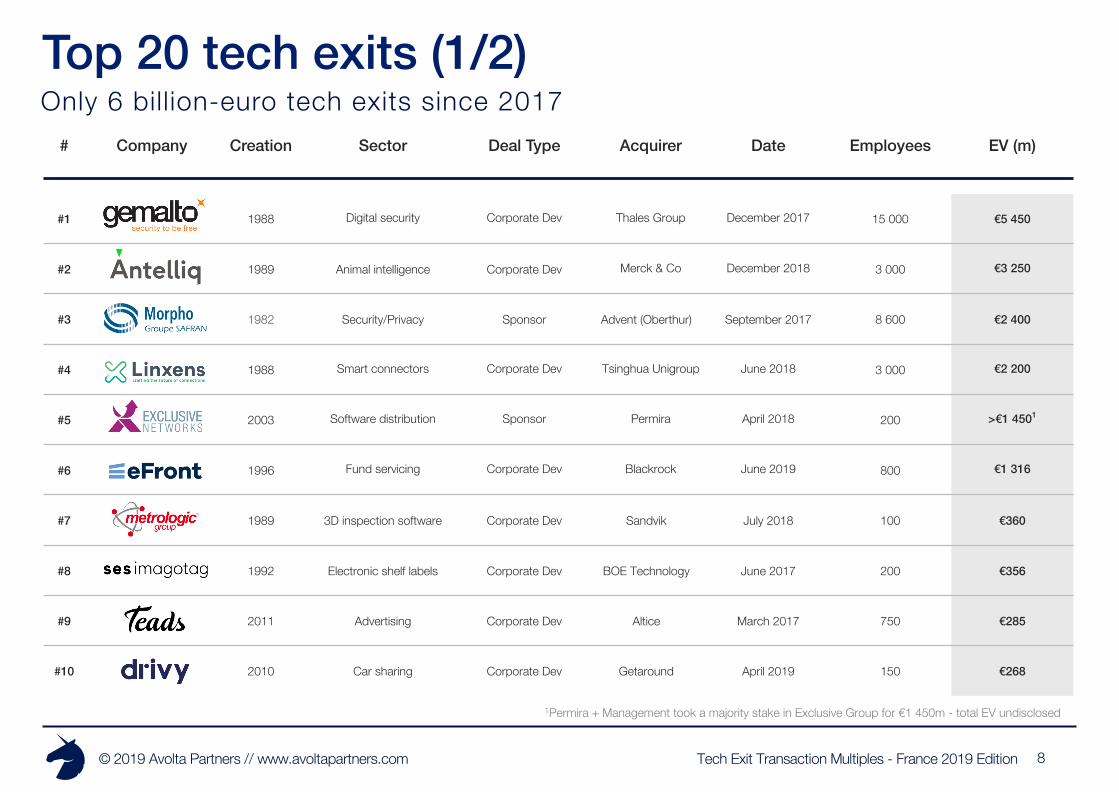
Between Jan-17 and Jun-19, the French Tech ecosystem has produced 493 exits for €23.7bn+ in total transaction value. Yet, a mere 12.5% of thetransactions exceed €150m and only 6 are 10-figures exits: Gemalto, Antelliq, Morpho, Lixens, Exclusive Networks, eFront. Even more stunning:among those 6 billion-euro exits, the “youngest” (Exclusive Networks) was created in 2003 – not really what we would call a “startup”.
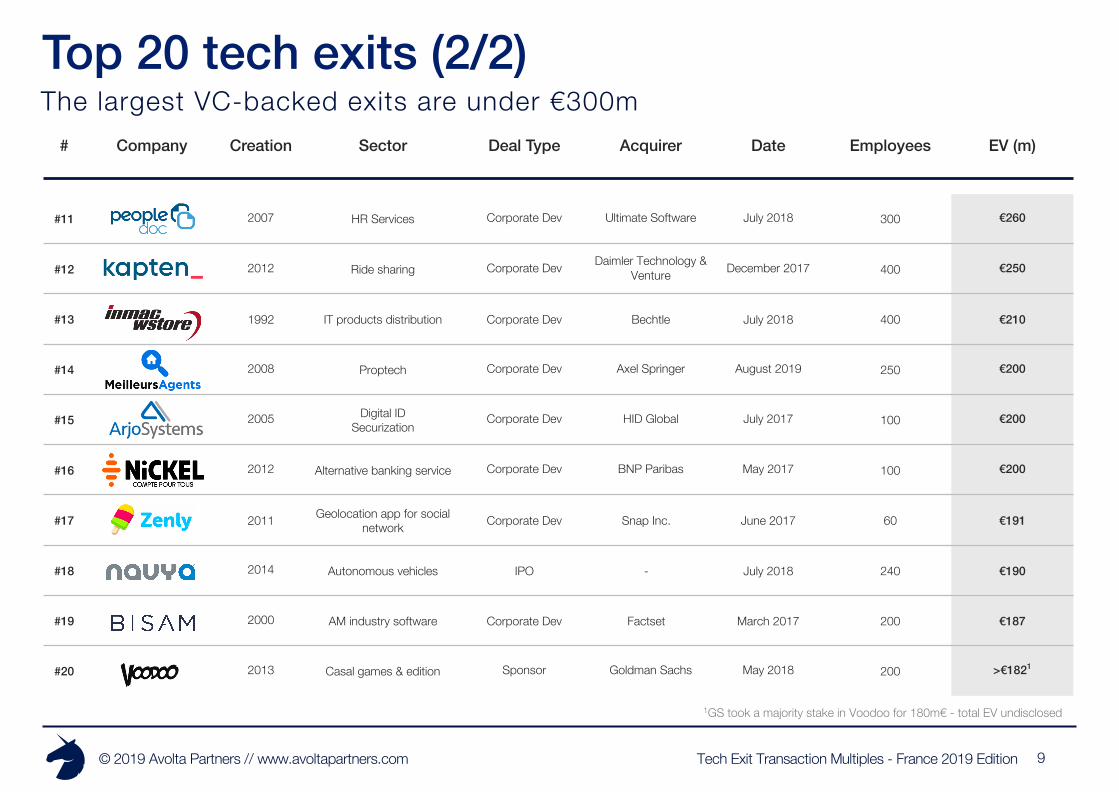
What about companies fostered by the French VC ecosystem, then?Since 2017, the largest VC-backed exit has been Teads sold to Altice (€285m), followed by Drivy acquired by Getaround (€268m) and Peopledoc byUltimate Software (€260m). A far cry from billion-euro exits rising all round in Europe. In 2018, top 3 European exits in value were Spotify €25bn IPO,Adyen €7bn IPO, Farfetch €5bn IPO.
So why does the French ecosystem fail to produce giant exits?In my opinion, the bottleneck lays in the lack of efficient liquidity solutions on the local market:1) IPOs on Euronext Paris are non-existent2) PE funds are just starting to feel that Tech could be a solution to their dry powder issue3) Above all, local strategic acquirers are not willing to take any risk and too often favor build vs. buy – strategic acquisitions not being considered as
a growth driver enough vs. in many other countries, where strategic players have made big move in acquiring many promising startups.
Are the current policies of the French government money-doping the ecosystem going to help?Yes - to a certain extent. Without money, it’s harder to grow fast and to compete against US & Chinese startups on steroids. But, without better localliquidity solutions, the best companies & talents will always end up out of France.
In the end, as the era of €50m+ fundraisings have just started to occur 2 years ago in France, we’ll have to wait until 2021-22 to see if the startupsfoie-gras’ing pays out.
Arthur Porré, Co-Founder & Managing Partner, Oct-19

Tech Exit Transaction Multiples - France 2019 Edition© 2019 Avolta Partners // www.avoltapartners.com
The Exits
Tech Exit Transaction Multiples - France 2019 Edition© 2019 Avolta Partners // www.avoltapartners.com
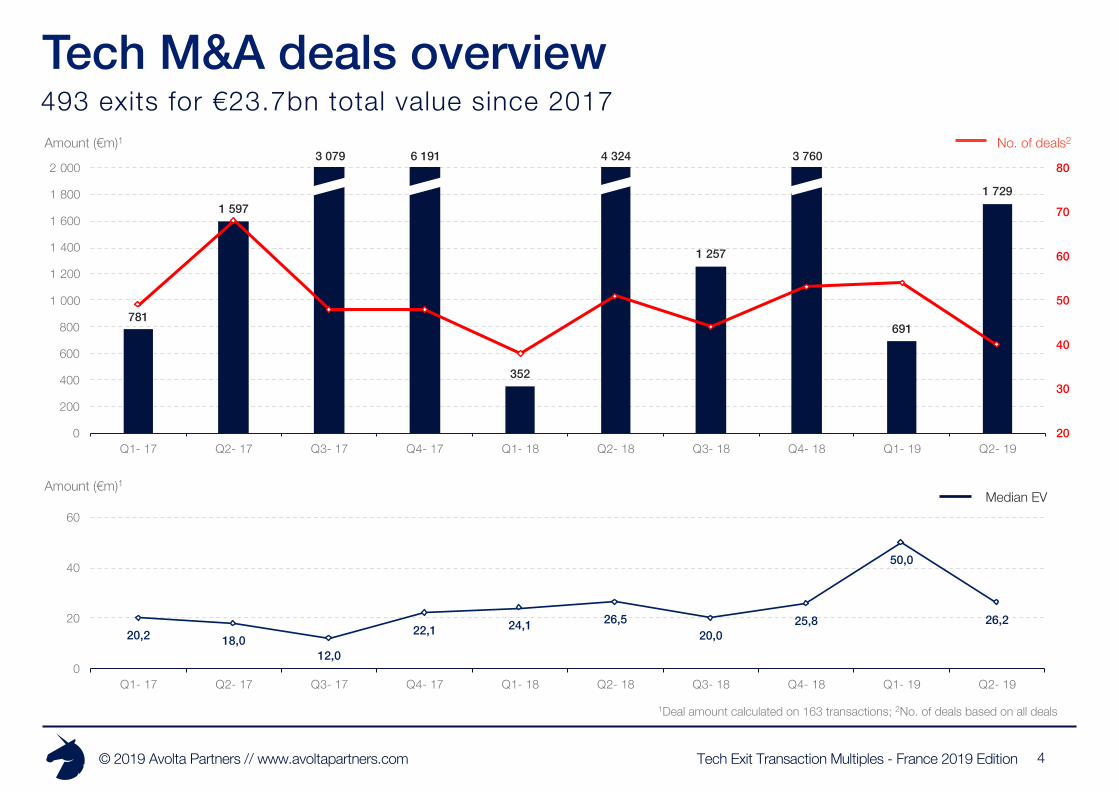
781
1 597
352
1 257
691
1 729
20
30
40
50
60
70
80
0
200
400
600
800
1 000
1 200
1 400
1 600
1 800
2 000
Q1- 17 Q2- 17 Q3- 17 Q4- 17 Q1- 18 Q2- 18 Q3- 18 Q4- 18 Q1- 19 Q2- 19
4
493 exits for €23.7bn total value since 2017Tech M&A deals overview
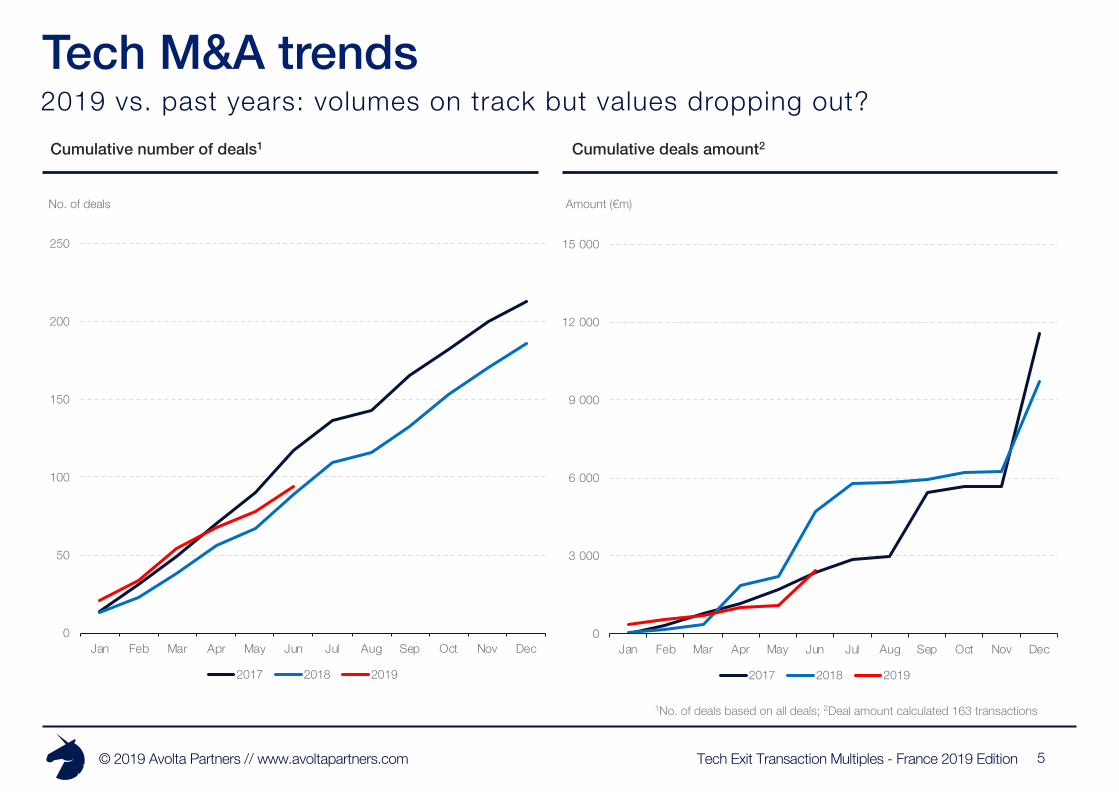
1Deal amount calculated on 163 transactions; 2No. of deals based on all deals
Amount (€m)1 No. of deals23 079 6 191 4 324 3 760
Amount (€m)1Median EV
20,2 18,012,0
22,1 24,1 26,520,0
25,8
50,0
26,2
0
20
40
60
Q1- 17 Q2- 17 Q3- 17 Q4- 17 Q1- 18 Q2- 18 Q3- 18 Q4- 18 Q1- 19 Q2- 19
Tech Exit Transaction Multiples - France 2019 Edition© 2019 Avolta Partners // www.avoltapartners.com 5
Amount (€m)
Cumulative deals amount2Cumulative number of deals1
No. of deals
1No. of deals based on all deals; 2Deal amount calculated 163 transactions
2019 vs. past years: volumes on track but values dropping out?Tech M&A trends
0
50
100
150
200
250
Jan Feb Mar Apr May Jun Jul Aug Sep Oct Nov Dec
2017 2018 2019
0
3 000
6 000
9 000
12 000
15 000
Jan Feb Mar Apr May Jun Jul Aug Sep Oct Nov Dec
2017 2018 2019

Tech Exit Transaction Multiples - France 2019 Edition© 2019 Avolta Partners // www.avoltapartners.com
0%
10%
20%
30%
40%
50%
60%
70%
80%
90%
100%
0 50 100 150 200 250 300 350
6
€150m+ exit value: only for the Happy FewDeals distribution% as of total panel
Exit value (€m)
1
2
The Peloton
The Breakaways
The Happy Few
Exit value % of the panel
1
2
3
<€50m
€50-150m
>€150m 12.5%
16.3%
71.2%
3
*Distribution based on smoothed average deal size calculation

Tech Exit Transaction Multiples - France 2019 Edition© 2019 Avolta Partners // www.avoltapartners.com 7
All-time high for subscription deals in Q2-19 (>50%)Business models breakdown
*Based on all deals
eCommerce
Subscription
Commission
Manufacturing
Audience
49,0%44,1%
31,3%
39,6%44,7% 43,1% 43,2%
30,2%
44,4%
55,0%
12,2% 20,6%
10,4%
22,9%
21,1%
13,7% 11,4%
26,4%
29,6%
22,5%12,2%8,8%
20,8%
12,5%
18,4%
19,6%20,5% 18,9%
11,1%7,5%
4,1% 2,9%
4,2%
2,1%
7,9%
3,9% 6,8% 3,8%
1,9% 5,0%
2,0% 5,9%
6,3%
3,9% 2,3%1,9%
2,5%
4,1%
7,4%
6,3%
6,3%
2,6%
3,9% 4,5%5,7%
3,7%
2,5%16,3%
10,3%
20,8%16,7%
5,3%11,8% 11,4% 13,2%
9,3%5,0%
0%
10%
20%
30%
40%
50%
60%
70%
80%
90%
100%
Q1- 17 Q2- 17 Q3- 17 Q4- 17 Q1- 18 Q2- 18 Q3- 18 Q4- 18 Q1- 19 Q2- 19
Performance
Others
Tech Exit Transaction Multiples - France 2019 Edition© 2019 Avolta Partners // www.avoltapartners.com
Only 6 bill ion-euro tech exits since 2017# Company Creation Sector Deal Type Acquirer Date Employees EV (m)
#1 1988 Digital security Corporate Dev Thales Group December 2017 15 000 €5 450
#2 1989 Animal intelligence Corporate Dev Merck & Co December 2018 3 000 €3 250
#3 1982 Security/Privacy Sponsor Advent (Oberthur) September 2017 8 600 €2 400
#4 1988 Smart connectors Corporate Dev Tsinghua Unigroup June 2018 3 000 €2 200
#5 2003 Software distribution Sponsor Permira April 2018 200 >€1 4501
#6 1996 Fund servicing Corporate Dev Blackrock June 2019 800 €1 316
#7 1989 3D inspection software Corporate Dev Sandvik July 2018 100 €360
#8 1992 Electronic shelf labels Corporate Dev BOE Technology June 2017 200 €356
#9 2011 Advertising Corporate Dev Altice March 2017 750 €285
#10 2010 Car sharing Corporate Dev Getaround April 2019 150 €268
Top 20 tech exits (1/2)
8
1Permira + Management took a majority stake in Exclusive Group for €1 450m - total EV undisclosed
Tech Exit Transaction Multiples - France 2019 Edition© 2019 Avolta Partners // www.avoltapartners.com
The largest VC-backed exits are under €300m# Company Creation Sector Deal Type Acquirer Date Employees EV (m)
#11 2007 HR Services Corporate Dev Ultimate Software July 2018 300 €260
#12 2012 Ride sharing Corporate Dev Daimler Technology & Venture December 2017 400 €250
#13 1992 IT products distribution Corporate Dev Bechtle July 2018 400 €210
#14 2008 Proptech Corporate Dev Axel Springer August 2019 250 €200
#15 2005 Digital IDSecurization Corporate Dev HID Global July 2017 100 €200
#16 2012 Alternative banking service Corporate Dev BNP Paribas May 2017 100 €200
#17 2011 Geolocation app for social network Corporate Dev Snap Inc. June 2017 60 €191
#18 2014 Autonomous vehicles IPO - July 2018 240 €190
#19 2000 AM industry software Corporate Dev Factset March 2017 200 €187
#20 2013 Casal games & edition Sponsor Goldman Sachs May 2018 200 >€1821
Top 20 tech exits (2/2)
9
1GS took a majority stake in Voodoo for 180m€ - total EV undisclosed

Tech Exit Transaction Multiples - France 2019 Edition© 2019 Avolta Partners // www.avoltapartners.com
10,8x 10,7x
12,9x
12,1x12,5x
8,8x9,3x
9,7x10,0x 10,0x
7x
9x
11x
13x
15x
S1 - 17 S2 - 17 S1 - 18 S2 - 18 S1 - 19
2,1x
2,5x
2,3x
2,7x2,9x
0,9x1,0x 1,0x 1,0x 0,9x
0x
1x
2x
3x
4x
S1 - 17 S2 - 17 S1 - 18 S2 - 18 S1 - 19
1Pre-revenue multiples out of scope
10
Tech values have constantly overperformed small/mid caps’Avolta Index
CAC Small IndexAvolta Index
Argos mid-market IndexAvolta Index
EV/EBITDA multiple index EV/TTM Revenue multiple1 index
Average gap: +1.5x Average gap: +2.3x

Tech Exit Transaction Multiples - France 2019 Edition© 2019 Avolta Partners // www.avoltapartners.com 11
Commission business model scores the largest exit multiple by farTech exit multiples
Q1 Q3
Med.
Median
3,7x
#adtech
2,0x
#bigdata
21,0x
#biotech
3,3x
#construction/real-estate
4,6x
#fintech
3,9x
#health
2,5x
#IoT
1,5x
#media
5,4x
#transportation/mobility
6,2x
#travel/hospitality
1,4x
Audience
1,5x
Performance
6,7x
Commission
0,8x
eCommerce
2,2x
Manufacturing
0,9x
Service
3,2x
Subscription
EV/TTM Revenue multiple per sectorEV/TTM Revenue multiple per business model
2,0x
0,5x
1,2x
0,5x
3,3x
1,0x
1,1x
7,7x
1,5x
4,4x
1,1x
13,0x
1,7x
1,6x
0x 5x 10x 15x 20x
3,1x
2,0x
1,2x
2,2x
2,1x
2,1x
3,3x
12,2x
1,2x
0,9x
10,3x
8,4x
3,8x
2,7x
13,4x
9,9x
3,9x
28,7x
5,3x
7,7x
0x 10x 20x 30x

Tech Exit Transaction Multiples - France 2019 Edition© 2019 Avolta Partners // www.avoltapartners.com
The Targets

Tech Exit Transaction Multiples - France 2019 Edition© 2019 Avolta Partners // www.avoltapartners.com 13
Targets are gaining maturity: higher revenues & profitableTech exits targets’ profile
60%of companies were profitable
12yMedian years of existence when exiting
61 Median number of
employees
Median TTM revenue (€m)
Median EV/TTM Revenue multiple
3,4
5,76,5
0
1
2
3
4
5
6
7
2017 2018 2019
2,1x 2,3x
3,1x
1x
2x
3x
4x
2017 2018 2019
Tech Exit Transaction Multiples - France 2019 Edition© 2019 Avolta Partners // www.avoltapartners.com 14
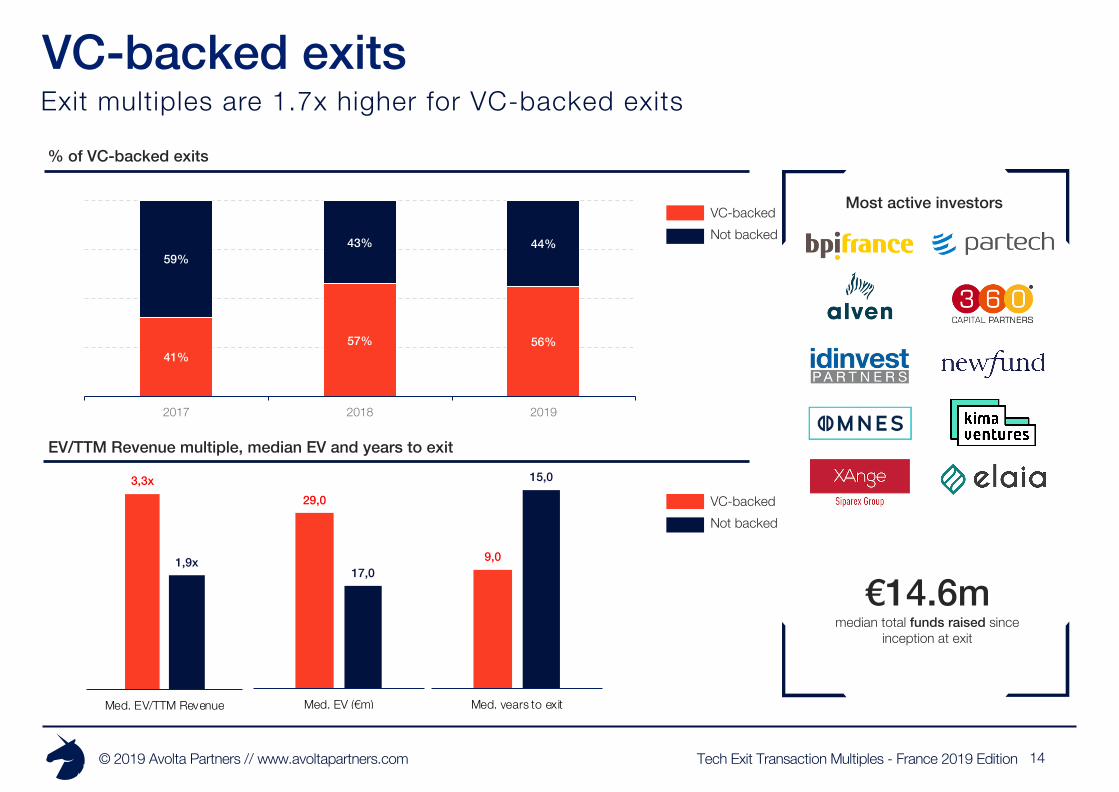
Exit multiples are 1.7x higher for VC-backed exitsVC-backed exits
% of VC-backed exits
Most active investors
€14.6mmedian total funds raised since
inception at exit
EV/TTM Revenue multiple, median EV and years to exit
41%57% 56%
59%43% 44%
2017 2018 2019
3,3x
1,9x
Med. EV/TTM Revenue
29,0
17,0
Med. EV (€m)
9,0
15,0
Med. years to exit
VC-backedNot backed
VC-backedNot backed
Tech Exit Transaction Multiples - France 2019 Edition© 2019 Avolta Partners // www.avoltapartners.com
14,0
8,0
Med. years to exit
15
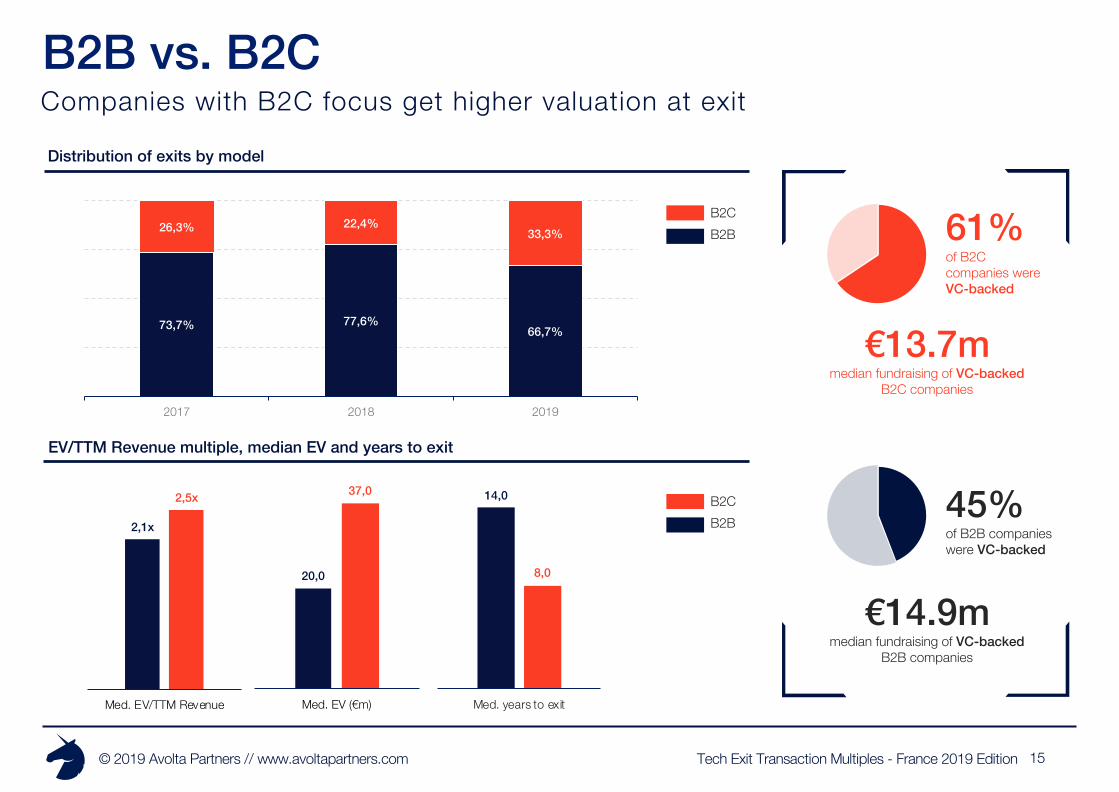
Companies with B2C focus get higher valuation at exitB2B vs. B2C
73,7% 77,6%66,7%
26,3% 22,4%33,3%
2017 2018 2019
2,1x
2,5x
Med. EV/TTM Revenue
20,0
37,0
Med. EV (€m)
Distribution of exits by model
EV/TTM Revenue multiple, median EV and years to exit
45%of B2B companies were VC-backed
€13.7mmedian fundraising of VC-backed
B2C companies
€14.9mmedian fundraising of VC-backed
B2B companies
B2CB2B 61%
of B2C companies were VC-backed
B2CB2B

Tech Exit Transaction Multiples - France 2019 Edition© 2019 Avolta Partners // www.avoltapartners.com
Median Absolute Relative Performance
Performances Performance to Small CAC Index# of IPOs Perf. (%) # of IPOs Perf. (%)
Total Panel 100% -18.2% 100% -3.3%
Overperforming 22% +31.9% 44% +13.8%Underperforming 78% -22.7% 56% -35.8%
VC-Backed 72% -18.4% 72% -2.5%Not Backed 28% -18.0% 28% -16.7%
5%
10%
10%
10%10% 15%
15%
25%
16
Most Tech IPOs are underperforming the marketTech IPOs
Performance1 of the 32 Tech IPOs compared to Small CAC Index
Tech IPOs breakdown per sectorPerformance per sample
-100%
-80%
-60%
-40%
-20%
0%
20%
40%
60%
80%
100%
1Performance calculation from IPO date to 12 months onwards
CAC Small IndexTech IPOs Tech IPOs with positive absolute performance
Tech IPOs with negative absolute performance
#Iot
#ecommerce
#media
#biotech
#deeptech
#medtech
#others
#hardware

Tech Exit Transaction Multiples - France 2019 Edition© 2019 Avolta Partners // www.avoltapartners.com
The Acquirers

Tech Exit Transaction Multiples - France 2019 Edition© 2019 Avolta Partners // www.avoltapartners.com 18
More than 2/3 of tech exit acquirers are CorporatesAcquirers by type
Distribution of exits by type of acquirer (in no. of deals)
EV/TTM Revenue multiple, median EV and years to exit
70,9% 65,6% 66,7%
14,0%10,9%
20,8%
15,1% 23,4%12,5%
2017 2018 2019
Sponsor
Corporate
IPO
8,0
15,0
11,0
Med. years to exit
15,0
39,4
33,1
Med. EV (€m)
2,0x
Corporate
4,5x
IPO
2,1x
Sponsor
EV/TTM revenue per deal type
45%Corporate exits are VC-backed
29%Sponsor exits are VC-backed
72%IPOs are VC-backed
2,5x
0,8x
1,2x
9,8x
2,9x
6,1x
0x 5x 10x 15x
Tech Exit Transaction Multiples - France 2019 Edition© 2019 Avolta Partners // www.avoltapartners.com
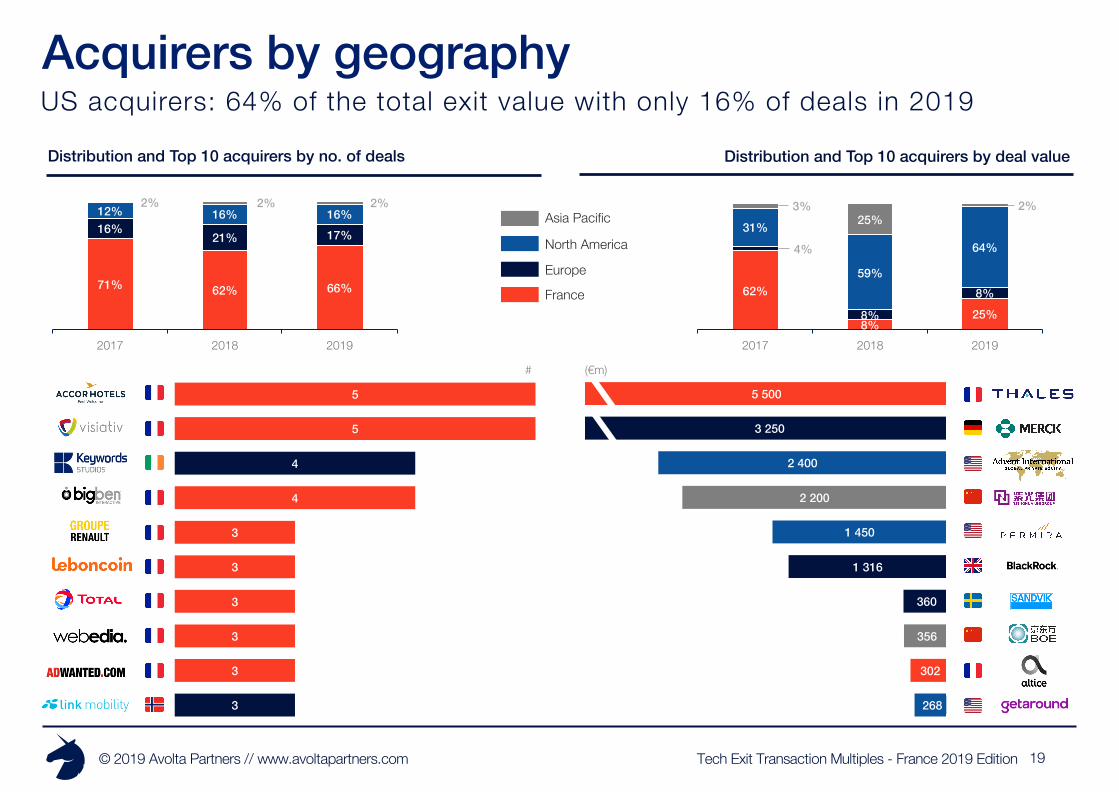
US acquirers: 64% of the total exit value with only 16% of deals in 2019 Acquirers by geography
19
5
5
4
4
3
3
3
3
3
3
5 500
3 250
2 400
2 200
1 450
1 316
360
356
302
268
Distribution and Top 10 acquirers by no. of deals Distribution and Top 10 acquirers by deal value
71% 62% 66%
16%21% 17%
12% 16% 16%2% 2% 2%
2017 2018 2019
Europe
France
North America
Asia Pacific
62%
8%25%
4%
8%
8%
31%
59%
64%
3%25%
2%
2017 2018 2019
(€m)#

Tech Exit Transaction Multiples - France 2019 Edition© 2019 Avolta Partners // www.avoltapartners.com 20
Young Corporates have a more aggressive acquisition strategy
Distribution of Tech exit acquirers by age (in no. of deals)
Acquirers by age
50%Tech exit acquirers have less than 20 years
25 y/oMedian age of acquirers
0% 5% 10% 15% 20% 25% 30%
2010 - 2019
2000 - 2009
1990 - 1999
1980 - 1989
1970 - 1979
1960 - 1969
1950 - 1959
1940 - 1949
1930 - 1939
1920 - 1929
1910 - 1919
1900 - 1909
Before 1899

Tech Exit Transaction Multiples - France 2019 Edition© 2019 Avolta Partners // www.avoltapartners.com
Miscellaneous
Tech Exit Transaction Multiples - France 2019 Edition© 2019 Avolta Partners // www.avoltapartners.com 22
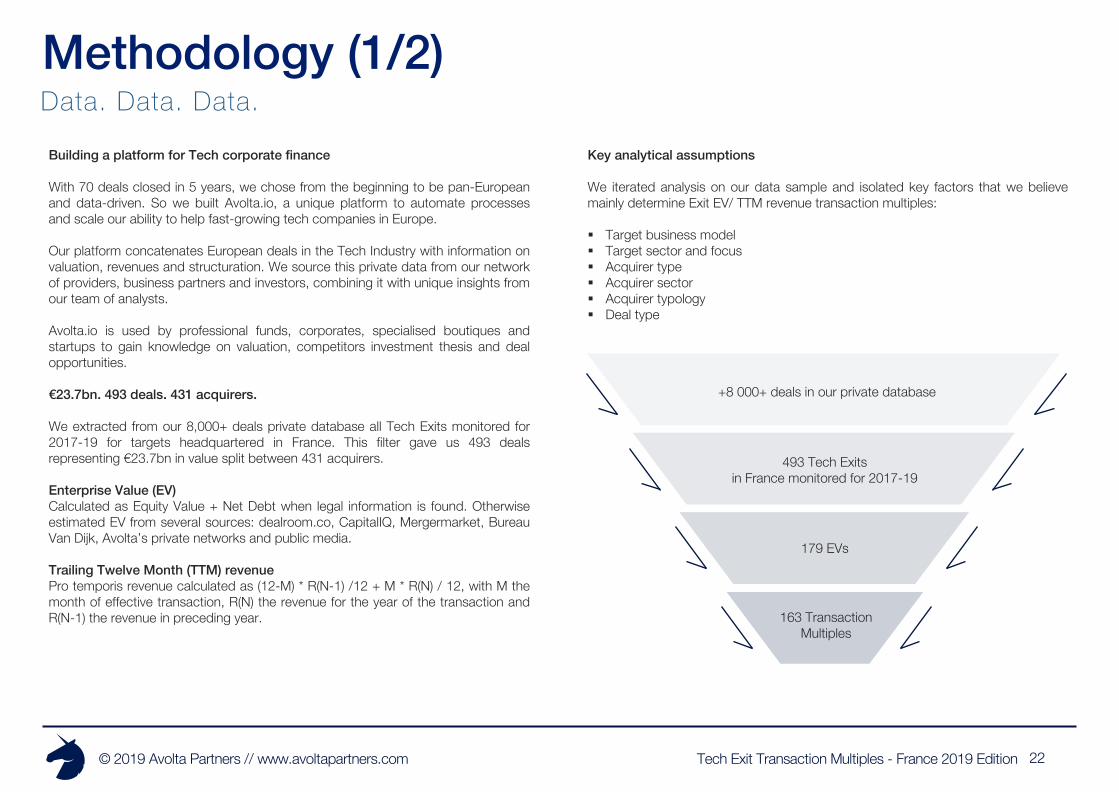
Building a platform for Tech corporate finance
With 70 deals closed in 5 years, we chose from the beginning to be pan-Europeanand data-driven. So we built Avolta.io, a unique platform to automate processesand scale our ability to help fast-growing tech companies in Europe.
Our platform concatenates European deals in the Tech Industry with information onvaluation, revenues and structuration. We source this private data from our networkof providers, business partners and investors, combining it with unique insights fromour team of analysts.
Avolta.io is used by professional funds, corporates, specialised boutiques andstartups to gain knowledge on valuation, competitors investment thesis and dealopportunities.
€23.7bn. 493 deals. 431 acquirers.
We extracted from our 8,000+ deals private database all Tech Exits monitored for2017-19 for targets headquartered in France. This filter gave us 493 dealsrepresenting €23.7bn in value split between 431 acquirers.
Enterprise Value (EV)Calculated as Equity Value + Net Debt when legal information is found. Otherwiseestimated EV from several sources: dealroom.co, CapitalIQ, Mergermarket, BureauVan Dijk, Avolta’s private networks and public media.
Trailing Twelve Month (TTM) revenuePro temporis revenue calculated as (12-M) * R(N-1) /12 + M * R(N) / 12, with M themonth of effective transaction, R(N) the revenue for the year of the transaction andR(N-1) the revenue in preceding year.
Data. Data. Data.Methodology (1/2)
+8 000+ deals in our private database
493 Tech Exitsin France monitored for 2017-19
179 EVs
163 Transaction Multiples
Key analytical assumptions
We iterated analysis on our data sample and isolated key factors that we believemainly determine Exit EV/ TTM revenue transaction multiples:
§ Target business model§ Target sector and focus§ Acquirer type§ Acquirer sector§ Acquirer typology§ Deal type

Tech Exit Transaction Multiples - France 2019 Edition© 2019 Avolta Partners // www.avoltapartners.com 23
Key analyt ical assumptionsMethodology (2/2)
Acquirer types
• Startup: no shareholder has absolute majority of the companyexcepting founders
• Corporate: founders have lost majority of the company and eitheranother entity has majority or the firm is public
• Sponsor: financial acquirer
M&A types
• Corporate Dev: main reason for acquirer is to gain market sharesand/or margin percentages
• Sponsor: the acquirer is a private equity fund (LBO, MBO, OBO)• Merger: union of two companies (often equal) into a unique company• IPO: Initial Public Offering though financial markets• Liquidation: transfer of assets, liquidation value method is used
Business Models
• Subscription: SaaS or more traditional licensing recurring revenue• Commission: platform debiting a defined cut from its flows• Performance: built around usage from a recurring user community• eCommerce: buy and online resale of goods• Manufacturing: production and resale of goods• Retail: resale of goods through brick-and-mortar shops• Audience: traffic-based revenue• Service: margin between labour cost and service invoice price• Research: strong R&D focus to keep high barriers to entry
Target tags
§ SaaS§ Deep Tech§ eCommerce§ IoT§ Media§ Hardware§ Biotech§ Adtech§ Marketplace§ Travel/hospitality§ Transportation/mobility§ Fintech§ Edtech§ Medtech§ Construction/Real-estate§ Big data§ Marketing§ Mobile§ Telecom
EV33.8% of monitored deals are associated to an Enterprise Value in thesample.When analyzing data that takes into account EV, we decided to focus only ondisclosed valuations.

Tech Exit Transaction Multiples - France 2019 Edition© 2019 Avolta Partners // www.avoltapartners.com 24
About Avolta PartnersLeading Tech advisor in Europe
§ 60 deals / €300m completed in 5 years
§ All types of transactions (€10-100m EV)- Fundraising (Series A/B/C+)- M&A- LBO
§ 70% cross-border deals
§ 100% Tech companies, with major focus on:- Fintech / Insurtech- Mobility- SaaS- Marketplace- Deeptech (AI, Blockchain, etc.)- Media- HR- Travel
Private Placement Strategic Advisory
§ 40 advisory missions executed in 3 years
§ All types of customers:- CAC40- Medium & Small companies- Scale-ups- Startups
§ Type of missions:- Buy-side strategy and execution- CVC strategy and execution- Mapping of acquisition/investment targets- Valuation and fairness opinions- Corporate Finance advisory

Tech Exit Transaction Multiples - France 2019 Edition© 2019 Avolta Partners // www.avoltapartners.com 25
Research teamContact us
Arthur PorréCo-Founder & Managing Partner
Jeremy SartreHead of Strategic Advisory -
Director
Vincent EvesqueAssociate
Pascal FarrugiaHead of Private Placement - Director
Alexandre MeiersAnalyst
Enzo CocquerelAnalyst
Jean-Jacques MbassiAnalyst
Max FourmentinAnalyst
Yasmine BensoudaData Analyst
Ugo VarrassoData Analyst

Tech Exit Transaction Multiples - France 2019 Edition© 2019 Avolta Partners // www.avoltapartners.com 26
External sourcesLeveraging quality data providers
Tech Exit Transaction Multiples - France 2019 Edition© 2019 Avolta Partners // www.avoltapartners.com
Disclaimer
The information contained in this report has been produced by Avolta Partners, based on Diane+ data, BODACC legal data and third party information. While Avolta Partners has made every effort to ensure the reliability ofthe data included in this report, Avolta Partners cannot guarantee the accuracy of the information collected and presented. Therefore, the Avolta Partners cannot accept responsibility for any decision made or action takenbased upon this report or the information provided herein.This presentation is for the exclusive use of the people to whom it is addressed and is intended for general information purposes only. It is not intended to constitute legal or other professional advice and should not betreated as such.Appropriate legal advice must be sought before making any decision, taking any action or refraining from taking any action in reliance on the information contained in this presentation. does not assume any responsibility forany person’s reliance upon the information contained herein.
© Copyright Avolta Partners October 2019