Embed Size (px)
Citation preview
Team #19076 Page 1 of 22
For office use only
T1 ________________
T2 ________________
T3 ________________
T4 ________________
Team Control Number
19076
Problem Chosen
A
For office use only
F1 ________________
F2 ________________
F3 ________________
F4 ________________
2013 Mathematical Contest in Modeling (MCM/ICM) Summary Sheet
In this proposal we present a model for optimizing the cooking of food items in the
electrical oven by optimizing the shape of pans used in the same.
We started with the mathematical modelling for the heat distribution along the
edges of a pan. For the doing so we have assumed exponential decaying model for
estimating the amount of energy absorbed at across the edge. The main reason
behind this is that according to the paper “Combined conduction and radiation
heat transfer with variable thermal conductivity and variable refractive index “,
which is available online at www.sciencedirect.com, temperature is decaying
along the length for 1-D object in exponential way. This is a basis for theoretical
and mathematical component of this method. Some other assumptions are also
taken for simplification of the model.
Using above concepts incorporated with concepts of superposition, we have
modelled the variation of heat along the edges of the food item kept in pans of
different shapes (like: square to circle with other like pentagon, hexagon etc. in
between). All the analysis done by us, are on regular polygonal pan shapes for the
sake of simplicity. Thus for a N side polygon, each side faces a heat distribution due
to combination of flux from n sides (including itself)
From the results obtained above, we got relation between the quality of the
food item (defined by us) and the number of edges of the pan in which it was
baked. We also verified that the heat distribution in case of circular pan has
maximum uniformity.
Once done with the quality, we started with the quantitative analysis. For the
sake of simplification of the model, we assumed a particular methodology of
putting the pans which is based on the general human habits. By keeping the area
of the pan constant but variation in shapes, we have finally obtained a relation
between packing efficiency and number of edged in the pan (at different values of
required parameters). The proposal ends with a combined analysis of above
concepts to obtain optimized values of the number of edges (pan shape) on the
basis of user preference.
However, a weakness in our model could be that a lot of assumptions are made
based on logic but no theoretical, experimental background. But for now, the
model remains accurate and reasonable.
Team #19076 Page 2 of 22
Contents
List of Figures: ....................................................................................................................... 3
List of Symbols, Subscripts and Superscripts.......................................................................... 4
1. Introduction: .................................................................................................................. 5
2. Problem Statement: ....................................................................................................... 5
3. Model 1: Heat distribution across the edges for various pan shapes .............................. 6
3.1 Assumptions: .......................................................................................................... 6
3.2 Model Overview:..................................................................................................... 7
3.3 Model Description: ................................................................................................. 7
3.4 Case Study - Rectangular shape pan: ....................................................................... 9
3.5 Model Application: ................................................................................................ 11
3.6 Result and Conclusion: .......................................................................................... 15
4. Model 2: Optimize solution for pan shape.................................................................... 16
4.1 Assumptions: ........................................................................................................ 16
4.2 Model Overview:................................................................................................... 17
4.3 Model Description: ............................................................................................... 17
4.4 Result and Conclusion: .......................................................................................... 21
Limitations: ......................................................................................................................... 21
References: ......................................................................................................................... 22
Team #19076 Page 3 of 22
List of Figures:
Figure 1: Rectangular Pan
Figure 2: Round Pan .............................................................................................................. 5
Figure 3: Oven with two racks ............................................................................................... 5
Figure 4: Schematic of the Model .......................................................................................... 8
Figure 5: Understanding scaling Factor Effect ........................................................................ 8
Figure 6: Heat distribution for rectangular pan...................................................................... 9
Figure 7: Surface plot showing heat variation on rectangular pan ....................................... 10
Figure 8: Contour plot showing heat variation on rectangular pan ...................................... 10
Figure 9: Square .................................................................................................................. 11
Figure 10: Pentagon ............................................................................................................ 11
Figure 11: heat distribution plot for hexagon ...................................................................... 12
Figure 12: heat distribution plot for heptagon ..................................................................... 12
Figure 13: heat distribution plot for octagon ....................................................................... 13
Figure 14: heat distribution plot for nonagon ...................................................................... 14
Figure 15: Relative Burning wrt number of edges ................................................................ 15
Figure 16: packing in circular pan ........................................................................................ 16
Figure 17: Packing efficency for different values of K (W/L) ................................................. 19
Team #19076 Page 4 of 22
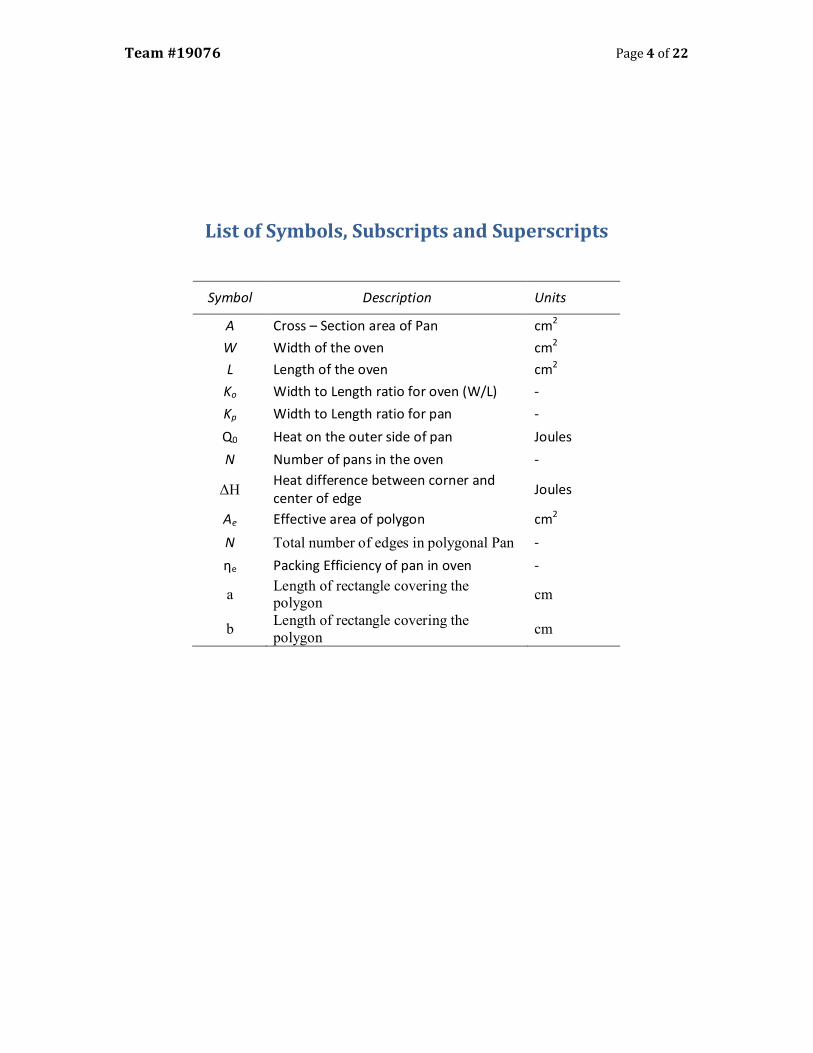
List of Symbols, Subscripts and Superscripts
Symbol Description Units
A Cross – Section area of Pan cm2
W Width of the oven cm2
L Length of the oven cm2
Ko Width to Length ratio for oven (W/L) -
Kp Width to Length ratio for pan -
Q0 Heat on the outer side of pan Joules
N Number of pans in the oven -
ΔH Heat difference between corner and center of edge
Joules
Ae Effective area of polygon cm2
N Total number of edges in polygonal Pan -
ηe Packing Efficiency of pan in oven -
a Length of rectangle covering the polygon
cm
b Length of rectangle covering the polygon
cm

Team #19076 Page 5 of 22
1. Introduction:
Ovens are one of the most common kitchen appliances used in every house. Today
various kinds of ovens are available in market which includes conventional ovens
(works on natural convection), modern ovens (works on forced convection) and
microwave ovens. They are generally available in rectangular shape and used for
heating, baking, drying etc.
Lot of study has been done on oven to efficiently cook the food. But very little effort
seems to be provided towards improving the pan design. To study the effect of pan
shape on cooking of the food, we have constructed a mathematical model which will
help to choose user, appropriate shape of pan as per his priorities.
Figure 1: Rectangular Pan Figure 2: Round Pan
2. Problem Statement:
We are given a rectangular oven with
constant width to length ratio and having
two evenly spaced racks. Rectangular pans
are commonly used for baking in the oven.
But the product gets overcooked near the
corner of the pan due to higher heat
distribution around the corner of the pan.
To overcome this problem, pans can be
design in circular shape to provide even
Figure 3: Oven with two racks
Team #19076 Page 6 of 22
distribution of heat across the edge. But circular pans are inefficient for space
optimization. Our model can help to select the optimize pan shape for the
combination of above to factors.
3. Model 1: Heat distribution across the edges for various pan shapes
3.1 Assumptions:
1. Oven is considered rectangular in shape, with width W and Length L.
2. Area (A) of the pan is fixed.
3. Heat flux on the outer surfaces of the pans is uniform.
4. Overcooking of the food is due to excessive heat (as compare to center
portion of the edges) absorbed by food at the point of observation. Hence we
are relating the heat distribution across the edge directly to the heat
absorbed by the food.
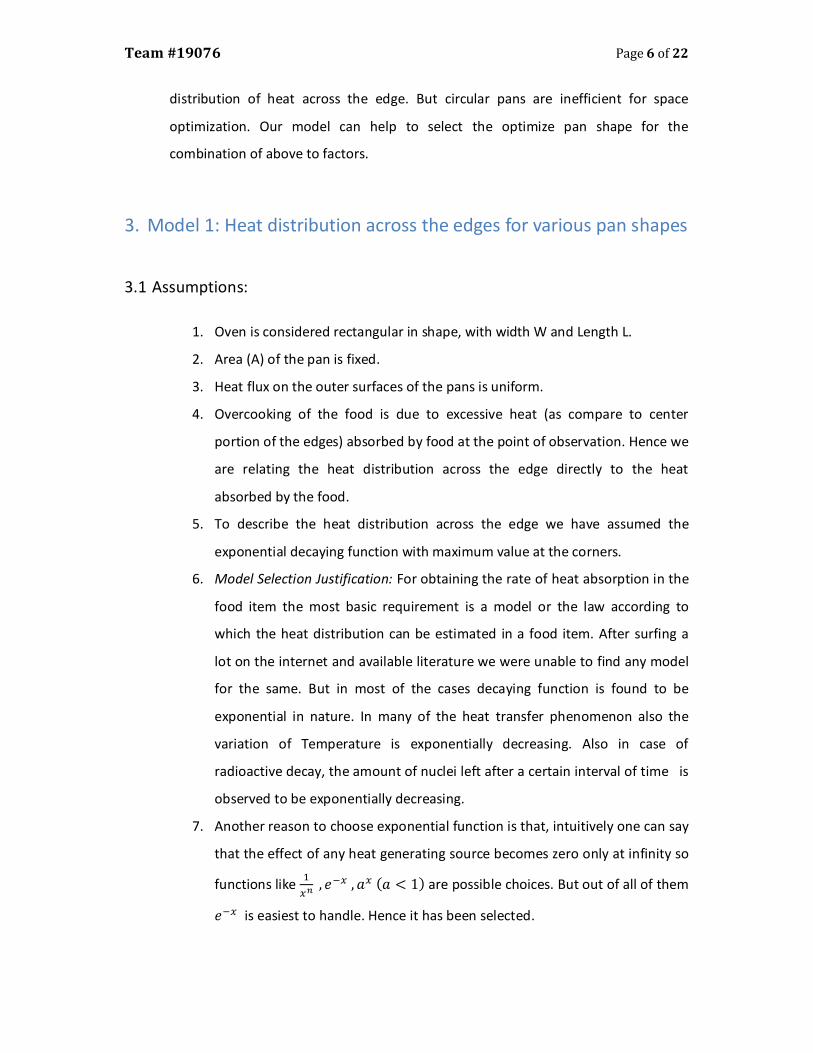
5. To describe the heat distribution across the edge we have assumed the
exponential decaying function with maximum value at the corners.
6. Model Selection Justification: For obtaining the rate of heat absorption in the
food item the most basic requirement is a model or the law according to
which the heat distribution can be estimated in a food item. After surfing a
lot on the internet and available literature we were unable to find any model
for the same. But in most of the cases decaying function is found to be
exponential in nature. In many of the heat transfer phenomenon also the
variation of Temperature is exponentially decreasing. Also in case of
radioactive decay, the amount of nuclei left after a certain interval of time is
observed to be exponentially decreasing.
7. Another reason to choose exponential function is that, intuitively one can say
that the effect of any heat generating source becomes zero only at infinity so
functions like �
�� ,��� ,�� (� < 1) are possible choices. But out of all of them
��� is easiest to handle. Hence it has been selected.

Team #19076 Page 7 of 22
8. In our model we have considered heat distribution contours to be straight
lines parallel to heat releasing edges which should be circular in nature in
actual case (shown below).
3.2 Model Overview:
Our model based on the observation that food gets overcooked at the corners than
across the edges. So heat absorbed by the food is max at the corners and decreases
at the center of the edge for the same time period. This variation is assumed to be
same as that of heat distribution across the edge. To begin with we have chosen a
rectangular pan to show the uneven heat distribution over its cross section. We
applied our model to square, pentagonal, hexagonal, heptagonal, octagonal and
nonagonal pan shapes and extrapolated the result to show even heat distribution
across the circular pan.
3.3 Model Description:
The heat absorption variation with distance from the side at which it is supplied:
Q = e�� ∗ SF(x)
Where,
SF(x)= Scaling Factor(x) = Transverse Length at x
Transverse Length at x = 0
From the above model, net Heat distribution due to only one edge can be seen
below:

Team #19076 Page 8 of 22
Figure 4: Schematic of the Model
Scaling factor refers to the ratio of transverse length at given distance (x) from origin
to the transvers length of surface at origin( x=0 from which heat is coming).
Thus the basic assumption that we have used in adopting the definition of Scaling
factor is that, ‘Heat is evenly distributed over entire transverse length at given
distance from origin’.
Consider following example to understand effect of scaling factor in a better way.
Analyzing cross section AB (at some particular distance from the origin) for different
shapes,
Figure 5: Understanding scaling Factor Effect

Team #19076 Page 9 of 22
Scaling Factor at Cross section AB (equal distance from each):
Case 1: d/a Case 2: d/b Case 3: d/c
Where:
a, b, c, d are lengths at different cross sections as shown in Figure 4
Thus SF(1)> SF(2)> SF(3).
Now,
Assuming same heat input per unit length from heat sources
Heat distribution trend is: Case 1> Case 2> Case 3.
3.4 Case Study - Rectangular shape pan:
Consider a cross section of rectangular pan.
We are showing here the variation of heat absorbed by the food on given pan cross
section.
From above our model, Scaling Factor = 1.
Heat distribution in the pan due to uniform heat flux on:
Side AB : Q = Q� ∗ e�� Side AD : Q = Q� ∗ e
��
Side CD : Q = Q� ∗ e�(���) Side BC: Q = Q� ∗ e
�(���)
Figure 6: Heat distribution for rectangular pan

Team #19076 Page 10 of 22
The net heat distribution obtained has been shown in contour and surface plots
below (plotted in Matlab):
Figure 7: Surface plot showing heat variation on rectangular pan
Figure 8: Contour plot showing heat variation on rectangular pan
As can be seen above that the variation along the edges is found as per expectations
and the maximum heat concentration is at corners. Thus verifying the applicability of
our Model.

Team #19076 Page 11 of 22
3.5 Model Application:
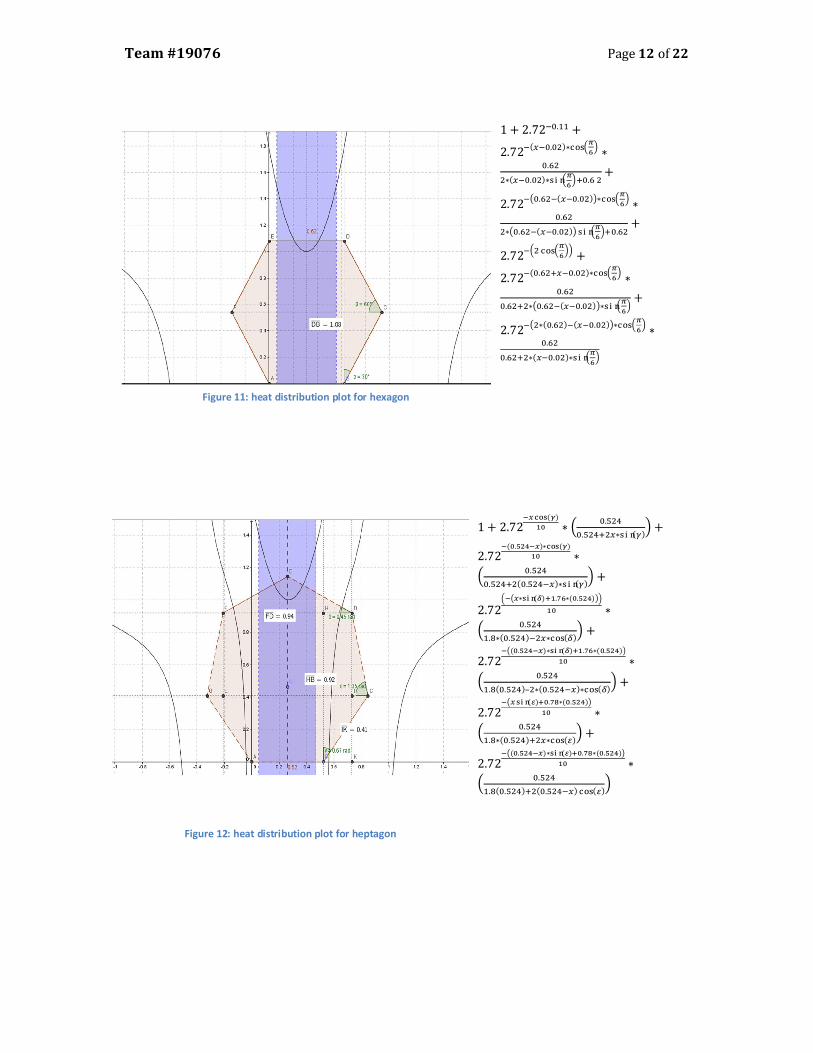
We used the above model to find out the heat distribution across the edges of
square, pentagonal, hexagonal, heptagonal, octagonal and nonagonal pan shapes.
The equations utilized and the results obtained are shown below:
1 + 2.72�� + 2.72�(� � �.��) + 2.72��� � (� � �.��)�
Figure 9: Square
Figure 10: Pentagon
1 + 2.72��∗����
����∗�
0.76
0.76+ 2� ∗sin��10�� + 2.72
�(�.����)∗�������
�∗�
0.76
0.76+ 2 ∗(0.76− �)∗sin��10��
+ 2.72���.�����∗����
����∗�
0.76
1.23− 2� ∗cos��5�� + 2.72�
��.����∗(�.����)∗��������
∗�0.76
1.23− 2 ∗(0.76− �)∗cos��5��
Team #19076 Page 12 of 22
1 + 2.72��.�� +
2.72�(���.��)∗����
�
��∗
�.��
�∗(���.��)∗�����
����.� �
+
2.72���.���(���.��)�∗����
�
��∗
�.��
�∗��.���(���.��)������
��� �.��
+
2.72��� ����
�
���+
2.72�(�.������.��)∗����
�
��∗
�.��
�.����∗��.���(���.��)�∗�����
��+
2.72���∗(�.��)�(���.��)�∗����
�
��∗
�.��
�.����∗(���.��)∗�����
��
1 + 2.72�����(�)
�� ∗��.���
�.������∗���(�)� +
2.72�(�.���� �)∗���(�)
�� ∗
��.���
�.�����(�.�����)∗���(�)� +
2.72�� ��∗���(�)� �.��∗(�.���)��
�� ∗
��.���
�.�∗(�.���)���∗���(�)� +
2.72��(�.�����)∗���(�)��.��∗(�.���)�
�� ∗
��.���
�.�(�.���)–�∗(�.�����)∗���(�)� +
2.72��� ���(�)� �.��∗(�.���)�
�� ∗
��.���
�.�∗(�.���)���∗���(�)� +
2.72��(�.�����)∗���(�)� �.��∗(�.���)�
�� ∗
��.���
�.�(�.���)��(�.�����)���(�)�
Figure 11: heat distribution plot for hexagon
Figure 12: heat distribution plot for heptagon

Team #19076 Page 13 of 22
Figure 13: heat distribution plot for octagon
1 + ���.� + ��(�∗���(�.�����)) ∗�0.54
0.54 + 2� ∗sin(0.79���)� + ��(�.����) ∗�
0.54
1.3�
+ ��(�.����∗���(�.�����))∗�0.54
1.3 − 2� ∗cos(0.79���)� + ���(�.����)∗���(�.�����)�
∗�0.54
0.54 + 2 ∗(0.54 − �)∗sin(0.79���)� + ��(�.����.����) ∗�
0.54
1.3�
+ ��(�.���(�.����)∗���(�.�����))∗�0.54
1.3 − 2 ∗(0.54 − �)∗cos(0.79���)�
Team #19076 Page 14 of 22
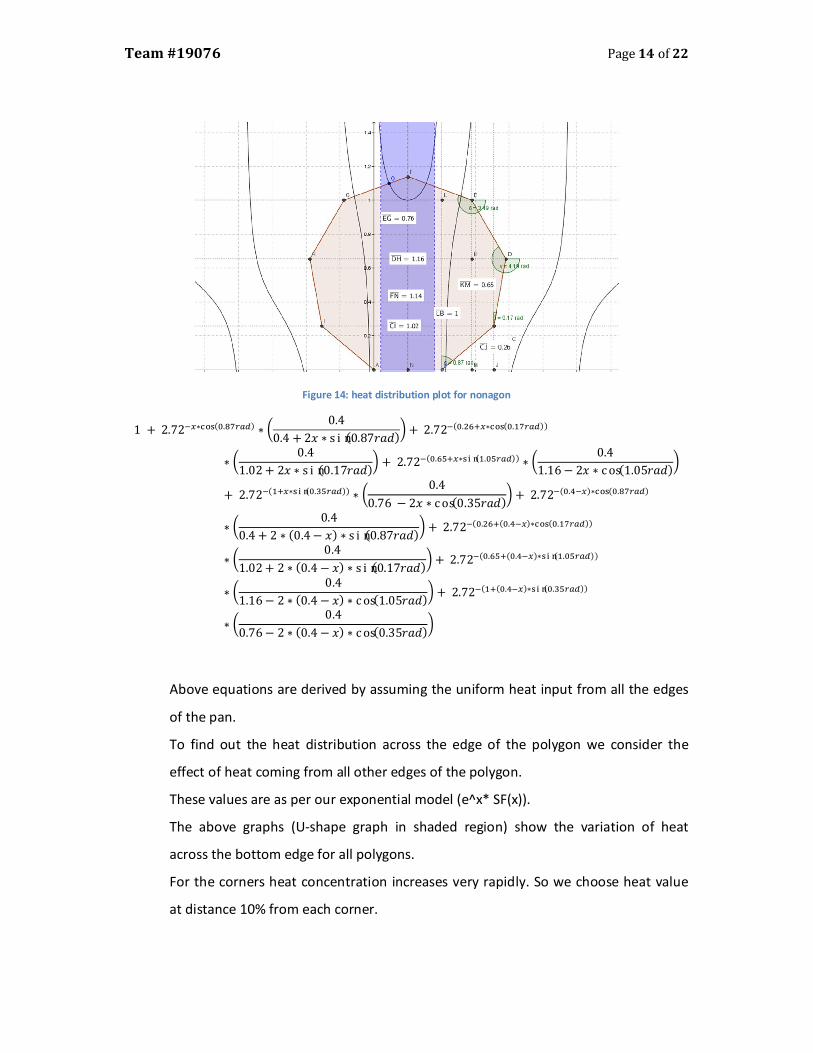
Figure 14: heat distribution plot for nonagon
1 + 2.72��∗���(�.�����) ∗�0.4
0.4 + 2� ∗sin(0.87���)� + 2.72�(�.����∗���(�.�����))
∗�0.4
1.02+ 2� ∗sin(0.17���)� + 2.72�(�.����∗���(�.�����))∗�
0.4
1.16− 2� ∗cos(1.05���)�
+ 2.72�(���∗���(�.�����))∗ �0.4
0.76 − 2� ∗cos(0.35���)� + 2.72�(�.���)∗���(�.�����)
∗�0.4
0.4 + 2 ∗(0.4 − �)∗sin(0.87���)� + 2.72�(�.���(�.���)∗���(�.�����))
∗�0.4
1.02+ 2 ∗(0.4 − �)∗sin(0.17���)� + 2.72�(�.���(�.���)∗���(�.�����))
∗�0.4
1.16− 2 ∗(0.4 − �)∗cos(1.05���)� + 2.72�(��(�.���)∗���(�.�����))
∗�0.4
0.76− 2 ∗(0.4 − �)∗cos(0.35���)�
Above equations are derived by assuming the uniform heat input from all the edges
of the pan.
To find out the heat distribution across the edge of the polygon we consider the
effect of heat coming from all other edges of the polygon.
These values are as per our exponential model (e^x* SF(x)).
The above graphs (U-shape graph in shaded region) show the variation of heat
across the bottom edge for all polygons.
For the corners heat concentration increases very rapidly. So we choose heat value
at distance 10% from each corner.

Team #19076 Page 15 of 22
Then we normalize the values of heat by dividing it by heat value at the centre of the
edge. This value will give you the relative burning of the corners with respect to
centre of the edge.
From the graphs drawn above we have obtained the relative burning at the corners
of pan for different shapes of pan.
Relative Burning: Ratio of heat absorbed at a distance of 0.1 times the total edge
length from the corner to centre of the edge.
Figure 15: Relative Burning wrt number of edges
3.6 Result and Conclusion:
1. Area of the pan (A) is same for all shapes (square to circle). So for fixed area
(A), increasing the number of sides, edge length decreases. This decreases
the heat difference between corners and center of the edge (ΔH).
2. The equation for relative burning is � = 3.73∗�(��.��∗�).
3. We can extrapolate this result to show that for circle which can be
considered as polygon of infinite sides, heat distribution is uniform.
y = 3.73e-0.12n
1.0
1.2
1.4
1.6
1.8
2.0
2.2
2.4
2.6
3 4 5 6 7 8 9 10
Rel
ati
ve b
urn
ing
Number of edges in polygon
Variation of Unevenity in heat distribution across edge

Team #19076 Page 16 of 22
4. On increasing the number of side of regular polygon, number of axis of
symmetry increases and hence overall symmetry of polygon is increased.
Thus heat distribution is becoming uniform. As circle has infinite number of
axis of symmetry, heat distribution across the edges (circumference) is
expected to be highest uniformity.
4. Model 2: Optimize solution for pan shape
4.1 Assumptions:
1. Oven is considered rectangular in shape, with width W and Length L.
2. Area (A) of the pan is fixed.
3. Length (L) of the oven is fixed.
4. We chose polygon till 9 edges. As generally pan with more than 9 edges is not
used.
5. For simplicity we neglected the spacing between two pans in oven. This
effect of spacing will be same for all shapes of pan.
6. We considered the pans of regular shapes. Considering the factors of
easiness, simplicity, and habitually one can say that most of the users will
prefer to make the regular arrangement of the pans. The point can be
explained by considering the arrangements of circular pans in a rectangular
oven.
Figure 16: packing in circular pan
(a) (b)

Team #19076 Page 17 of 22
We have assumed that a user will prefer and make arrangements as in (a) instead
of (b) even after knowing the fact that b) is better in terms of space optimization
because,
1. The assumption makes our model quite simple, easy to analyze.
2. Making of arrangement – (a) is quicker and convenient for user.
4.2 Model Overview:
In the model, we started with defining the effective area for polygon. We calculated
packing efficiency for pan by assuming pan cross – section area (A) equals 1cm2 and
oven length (L) to be 20cm. This packing efficiency is plotted with the pan shape.
4.3 Model Description:
The figure below shows the arrangements of pans in the oven. The arrangement is
regular and pans are arranged in regular manner. On the basis of above discussion/
assumption, we found that every pan will occupy a rectangular space of the
dimensions shown below:
Team #19076 Page 18 of 22
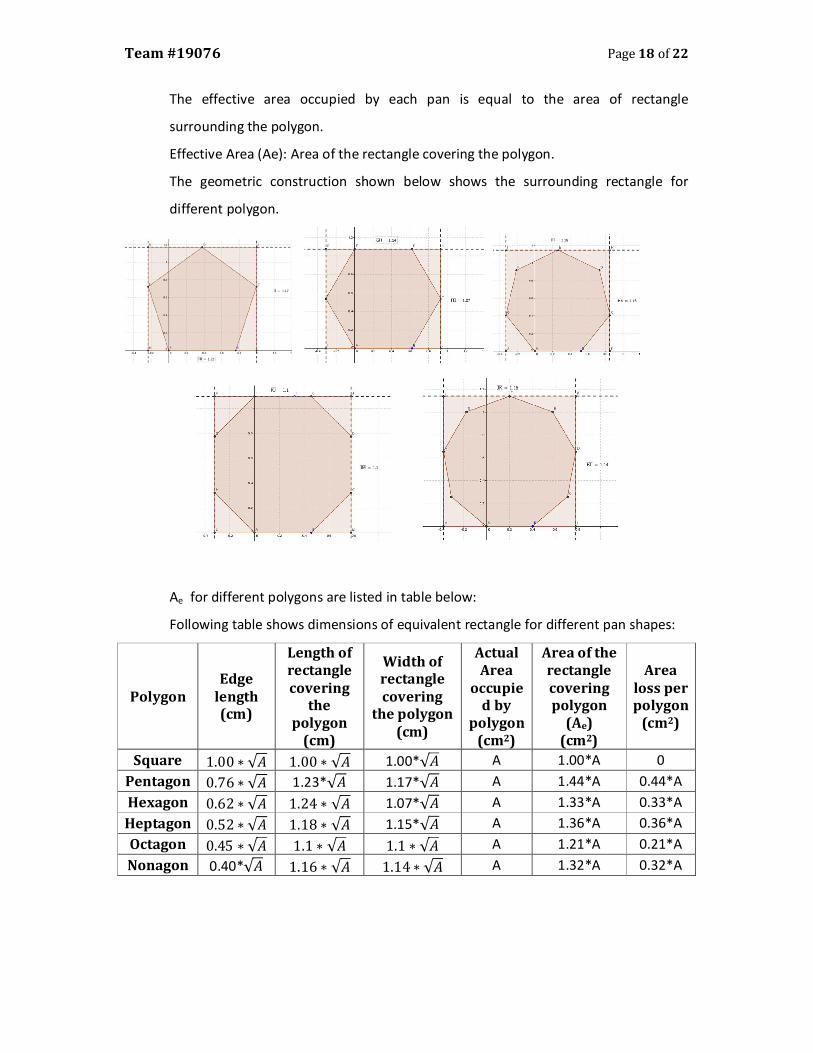
The effective area occupied by each pan is equal to the area of rectangle
surrounding the polygon.
Effective Area (Ae): Area of the rectangle covering the polygon.
The geometric construction shown below shows the surrounding rectangle for
different polygon.
Ae for different polygons are listed in table below:
Following table shows dimensions of equivalent rectangle for different pan shapes:
Polygon Edge
length (cm)
Length of rectangle covering
the polygon
(cm)
Width of rectangle covering
the polygon (cm)
Actual Area
occupied by
polygon (cm2)
Area of the rectangle covering polygon
(Ae) (cm2)
Area loss per polygon
(cm2)
Square 1.00∗√� 1.00∗√� 1.00*√� A 1.00*A 0
Pentagon 0.76∗√� 1.23*√� 1.17*√� A 1.44*A 0.44*A
Hexagon 0.62∗√� 1.24 ∗√� 1.07*√� A 1.33*A 0.33*A
Heptagon 0.52∗√� 1.18 ∗√� 1.15*√� A 1.36*A 0.36*A
Octagon 0.45 ∗√� 1.1∗√� 1.1 ∗√� A 1.21*A 0.21*A
Nonagon 0.40*√� 1.16∗√� 1.14 ∗√� A 1.32*A 0.32*A

Team #19076 Page 19 of 22
For the irregular polygonal pan, the packing efficiency is given by ηe = ��∗
�
���∗�
�∗�
For pan of regular polygonal pan,
ηe = ������
�
���∗��
�
���,��
�
���∗��
�
����∗�
�∗� =
�������
���∗��
�
���,��
�
���∗��
�
����∗�
�∗(��)
Following table shows the packing efficiency value for different values of K (=W/L)
with A=1 cm2 and L=20 cm.
Polygon a(cm) b(cm) �� = ��� ���
�
��� ∗ ��
�
��� ,��
�
��� ∗ ��
�
���� ∗ �
� ∗ �
K=0.1
L = 20 cm W=2 cm
K=0.2 L = 20 cm W=4 cm
K=0.5 L = 20 cm W=10 cm
K=0.75 L = 20 cm W=15 cm
K=1.0 L = 20 cm W=20 cm
Square 1.0 1.0 40/40 80/80 200/200 300/300 400/400
Pentagon 1.0 1.0 17/40 51/80 136/200 192/300 289/400
Hexagon 1.0 1.0 18/40 54/80 144/200 224/300 324/400
Heptagon 1.0 1.0 17/40 51/80 136/200 208/300 289/400
Octagon 1.0 1.0 18/40 54/80 162/200 234/300 324/400
Nonagon 1.0 1.0 17/40 51/80 136/200 221/300 289/400
Following graph shows the variation of packing efficient with number of edges
Figure 17: Packing efficency for different values of K (W/L)
30
40
50
60
70
80
90
100
4 5 6 7 8 9 10
Pa
ckin
g e
ffic
ien
cy o
f P
an %
Number of edges in Pan/polygon
Variation of Packing efficiency with number of edges
(W/L) = 0.1
(W/L) = 0.2
(W/L) = 0.5
(W/L) = 0.75
(W/L) = 1

Team #19076 Page 20 of 22
The curves obtained above shows variation of space utilization by a polygon with its
number of edges for different values of (W/L).
For given condition curves shows fluctuating behavior hence are to be used as such.
This model requires the maximization of space utilization while minimization in heat
variation across the edge.
We tried to approximate graph between ηe and number edges (W/L = 0.5) for higher
order polynomial. For the 5th degree polynomial the graphs shows minimum
deviation (R2 = 1). So we are approximating the packing efficiency by function
g(n)= − 3.7417 ∗n� + 123.83 ∗n�– 1614.5∗n� + 10359∗n�– 32687∗n +
40766.
We define the function for combine effect of heat distribution and packing efficiency
as follows:
Number of edges = H(p)= (g(n)∗p ∗4 )+ �(1 − p)∗�
�(�)��
�
For p=1 (for optimal packing efficiency), n=4 (square shape pans)
For p= 0 (For even heat distribution), n=infinity (circular shape pans)
Following plot shows the variation of pan shape (type of polygon) for different values
of weights (p).
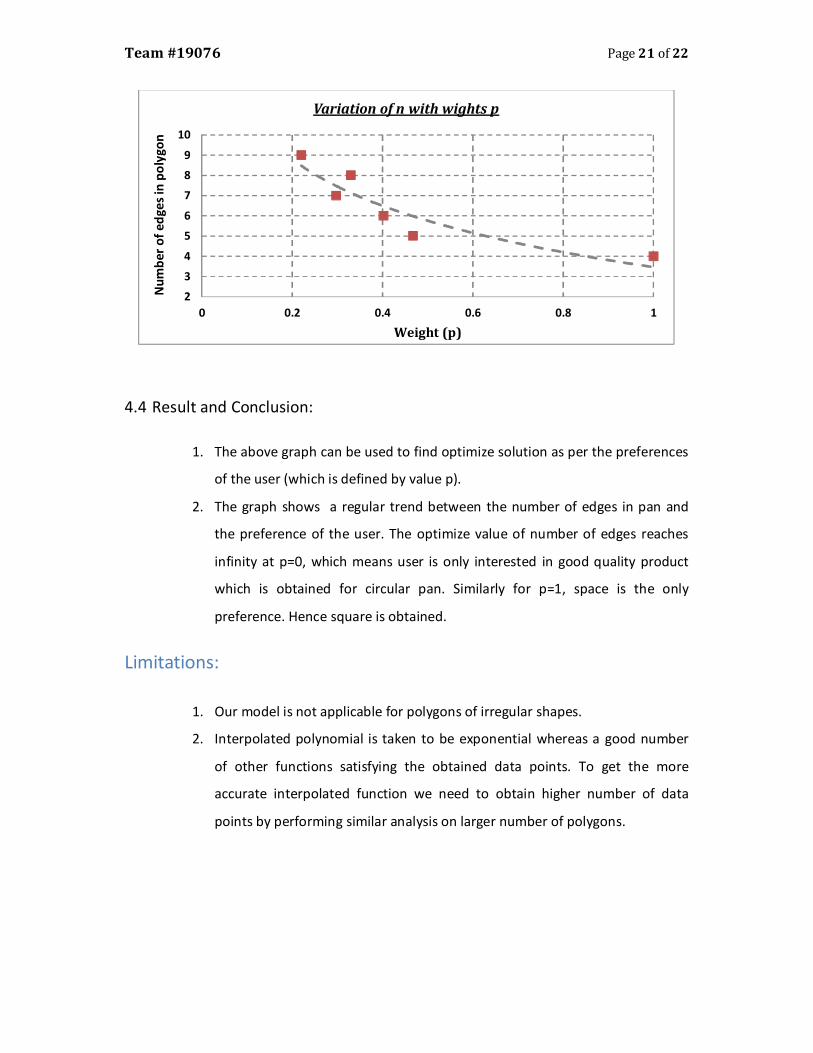
H(p) = n g(n) y(n) p 4 1.00 2.46 1
5 0.68 2.00 0.467
6 0.72 1.8 0.402
7 0.68 1.4 0.297
8 0.81 1.42 0.33
9 0.68 1.36 0.22
Team #19076 Page 21 of 22
4.4 Result and Conclusion:
1. The above graph can be used to find optimize solution as per the preferences
of the user (which is defined by value p).
2. The graph shows a regular trend between the number of edges in pan and
the preference of the user. The optimize value of number of edges reaches
infinity at p=0, which means user is only interested in good quality product
which is obtained for circular pan. Similarly for p=1, space is the only
preference. Hence square is obtained.
Limitations:
1. Our model is not applicable for polygons of irregular shapes.
2. Interpolated polynomial is taken to be exponential whereas a good number
of other functions satisfying the obtained data points. To get the more
accurate interpolated function we need to obtain higher number of data
points by performing similar analysis on larger number of polygons.
2
3
4
5
6
7
8
9
10
0 0.2 0.4 0.6 0.8 1
Nu
mb
er o
f ed
ges
in p
oly
gon
Weight (p)
Variation of n with wights p
Team #19076 Page 22 of 22
References:
1. Edible Garden, http://www.cookingandme.com/2010/05/types-of-ovens-
how-to-choose-oven.html
2. http://www.sciencedirect.com/science/article/pii/S096030850700017X
3. Geogebra: http://www.geogebra.org/cms/
4. Blender: http://www.blender.org/
5. http://mathworld.wolfram.com/CirclePacking.html

Advertisement for New Brownie Gourmet Magazine

The Ulfa & Ulfa Company brings you
“The ultimate Brownie Pan”
* More number of food items cooked at a time
* Better cooking with no burning at corners
* Smart pan decision taker:
* Huge time saving
* Huge reduction in power Bills
* Space optimization up to 50%
Cuts most cooking time by 50%, Brownie Baking in 2 times faster in larger amount. Make the greatest cooking discovery since fire for yourself. Cooking with this oven is simple and easy. You can cook thing as per your choice with a better quality in more amount and in a quicker way in about half of the normal time. Only the food gets hot your kitchen and stays cool.


![[Back office services] how to empower your back office services team](https://img.dokumen.tips/doc/110x75/5480bd6ab4795946578b4788/back-office-services-how-to-empower-your-back-office-services-team.jpg)


