Embed Size (px)
Citation preview

e-Profit Monitor Analysis Dairy Farms 2015
Teagasc
e-Profit Monitor AnalysisDairy Farms 2015
Animal & Grassland Research and Innovation Programme

e-Profit Monitor Analysis Dairy Farms 2015

1
e-Profit Monitor Analysis Dairy Farms 2015
Teagasc
e-Profit Monitor AnalysisDairy Farms 2015
Authors
Teagasc Specialist Service

2
e-Profit Monitor Analysis Dairy Farms 2015

3
e-Profit Monitor Analysis Dairy Farms 2015
Table of Contents
Foreword
Spring Milk Dairy Farms 2015 6
Winter Milk Dairy Farms 2015 10
‘Grass Rich’ vs. ‘Grass Poor’ Systems of Spring Milk Production 2015 14
Regional analysis – Spring Milk Production 2015 18
Matched Sample of Winter and Spring Milk Producers 2009-2015 22
Spring Milk Dairy Farms 2015 – costs per cow and per litre 26
Winter Milk Dairy Farms 2015 – costs per cow and per litre 30
Difference between Top Net Profit Farms – per litre vs. per hectare 2015 34
Replacement Heifer Costs 38

4
e-Profit Monitor Analysis Dairy Farms 2015
ForewordThe Teagasc eProfit Monitor (ePM) is an online financial analysis tool available to all Teagasc clients. Dairy farmers work with their Teagasc Dairy Adviser to gather the data required. Once the data is entered, a range of reports for each enterprise (dairy, replacements, cattle and tillage) or the overall farm can be produced. If the farmer has carried out an ePM analysis on a yearly basis, multiple year reports tracking performance over a number of years can be generated. In addition, if the farmer is a member of a discussion group, a group report can be produced allowing each individual farmer to benchmark his performance with other group members. This purpose of this publication is to provide a range of benchmarks for both individual farmers and farmer groups.
The analyses in this publication are based on data provided by Teagasc dairy farmer clients relating to the 2015 production year and entered onto the ePM system prior to 8th March 2015. In all, 1,562 farms are represented; 1,392 of these are engaged in spring milk production with the balance (170) engaged in winter/ liquid milk production. In addition, a matched sample analysis of 100 farmers who have completed ePM analysis for each year in the period 2008 to 2015 is included.
A range of tables are provided with a summary of the key figures included in the main tables and a more detailed breakdown of costs
contained in the later tables. Where ‘Top 25%’ results are presented, the dataset was initially ranked on the basis of net profit per hectare.
The net profit referred to in this publication refers to the dairy enterprise only and not the whole farm. Other enterprises on the farm may generate some additional profit for the farm business. In addition direct payments, claimed by the majority of dairy farmers, are excluded from this analysis. An article is included which explains the difference between eProfit Monitor and National Farm Survey results. This stresses the differences in the samples for both analyses while recommending the use of eProfit Monitor results for farmer benchmarking and National Farm Survey results for the presentation of national results and especially in issues pertaining to government policy, economic planning and cross-country comparisons.
Finally, I would like to acknowledge the work of all Teagasc Dairy Advisers in promoting, completing and using ePM and to dairy farmers for providing the data required for analysis. Without their support, this publication would not be possible. I would also like to acknowledge the work of George Ramsbottom and Kevin Connolly in extracting the data necessary for this publication.
Tom O’Dwyer, Head of Dairy Knowledge Transfer

5
e-Profit Monitor Analysis Dairy Farms 2015
Profit Monitor per hectare analysis
(1,392 farms)
Spring Milk Dairy Farms
2015
6
e-Profit Monitor Analysis Dairy Farms 2015
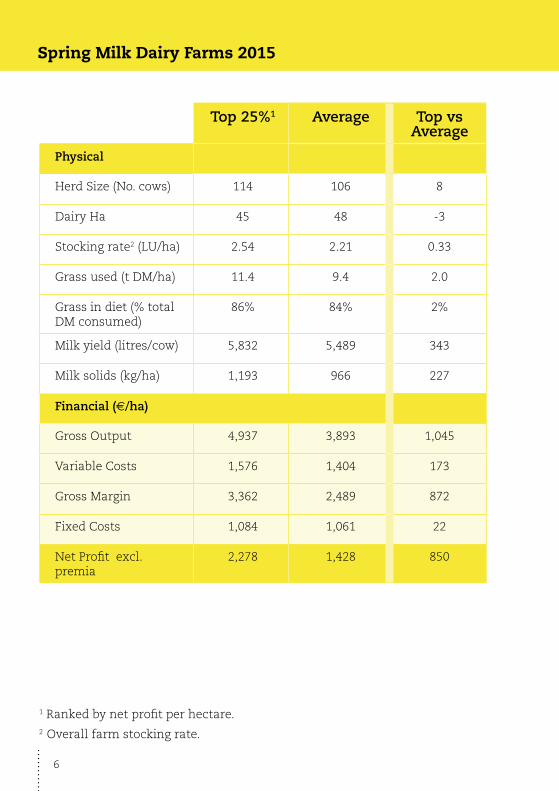
Spring Milk Dairy Farms 2015
1 Ranked by net profit per hectare.2 Overall farm stocking rate.
Top 25%1 Average Top vs Average
Physical
Herd Size (No. cows) 114 106 8
Dairy Ha 45 48 -3
Stocking rate2 (LU/ha) 2.54 2.21 0.33
Grass used (t DM/ha) 11.4 9.4 2.0
Grass in diet (% total DM consumed)
86% 84% 2%
Milk yield (litres/cow) 5,832 5,489 343
Milk solids (kg/ha) 1,193 966 227
Financial (€/ha)
Gross Output 4,937 3,893 1,045
Variable Costs 1,576 1,404 173
Gross Margin 3,362 2,489 872
Fixed Costs 1,084 1,061 22
Net Profit excl. premia
2,278 1,428 850

7
e-Profit Monitor Analysis Dairy Farms 2015
Spring Milk Dairy Farms 2015
n The top farms generated a gross output of €4,937 per ha compared to €3,893 per ha on the average farms, a difference of 27%.
n Output per ha on the top 25% of farms was 227 kg milk solids per ha or 23% higher than on the average farm (966 kg per ha). This is as a result of a higher stocking rate (+0.33 LU per ha) and higher yield (+ 33 kg milk solids per cow).
n Average spring milk dairy farms had lower variable costs than the top farms at €1,404 per ha versus €1,576 per ha. However, as a percentage of gross output they accounted for 36% on the average farms compared to 32% of the output on the top farms.
n The gross margin was €3,362 per ha on the top spring milk farms which was 35% or €872 per ha higher than those on the average farm.
n The biggest variable cost on spring milk dairy farms in 2015 was purchased concentrates and forage accounting for 33% or €463 per ha of total variable costs.
n The average spring milk dairy farm in 2015 generated a net profit of €1,428 per ha compared to €2,278 per ha on the top 25% of farms.

8
e-Profit Monitor Analysis Dairy Farms 2015
Spring Milk Dairy Farms 2015
Spring milk dairy farms net profit per hectare 2015
Spring milk dairy farms net profit per hectare 2015
l
Average spring milk variable costs per hectare 2015
J
Net Profit (€/ha)
€0
€1,250
€2,500
€3,750
€5,000
Top 25% Average
€1,428
€2,278 Net Profit (€/ha)
€230
€194
€69
€132€313
€463FeedFertVetAIContractorOther Var. Costs
1,193 kg MS/ha
966 kg MS/ha
9.4 T Grass DM/ha11.4 T Grass DM/ha
Average spring milk variable costs per hectare 2015
Spring milk dairy farms net profit per hectare 2015
l
Average spring milk variable costs per hectare 2015
J
Net Profit (€/ha)
€0
€1,250
€2,500
€3,750
€5,000
Top 25% Average
€1,428
€2,278 Net Profit (€/ha)
€230
€194
€69
€132€313
€463FeedFertVetAIContractorOther Var. Costs
1,193 kg MS/ha
966 kg MS/ha
9.4 T Grass DM/ha11.4 T Grass DM/ha
9
e-Profit Monitor Analysis Dairy Farms 2015
Profit Monitor per hectare analysis
(170 farms)
Winter Milk Dairy Farms 2015

10
e-Profit Monitor Analysis Dairy Farms 2015
Winter Milk Dairy Farms 2015
3 Ranked by net profit per hectare.
Top 25%3 Average Top vs Average
Physical
Herd Size (No. cows) 137 138 -1
Dairy Ha 58 61 -3
Stocking rate (LU/ha) 2.37 2.27 0.10
Grass used (t DM/ha) 9.9 8.9 0.9
Grass in diet (% total DM consumed)
80% 77% 3%
Milk yield (litres/cow) 6,093 5,960 133
Milk solids (kg/ha) 1,112 1,040 72
Financial (€/ha)
Gross Output 4,923 4,462 461
Variable Costs 1,564 1,703 -139
Gross Margin 3,359 2,759 600
Fixed Costs 1,177 1,358 -181
Net Profit excl. premia
2,182 1,400 782

11
e-Profit Monitor Analysis Dairy Farms 2015
Winter Milk Dairy Farms 2015
n The top 25% of farms generated a gross output of €4,923 per ha compared to €4,462 per ha on the average farms, a difference of 10%.
n Output per ha on the top 25% of farms was 72 kg milk solids per ha or 7% higher than on the average farm (1,040 kg per ha). This is as a result of a higher stocking rate (+0.10 LU per ha) and higher yield (+ 11 kg milk solids per cow).
n Average winter milk dairy farms had higher variable costs than the top farms at €1,703 per ha versus €1,564 per ha. As a percentage of gross output they accounted for 38% on the average farms compared to 32% of the output on the top farms.
n The gross margin was €3,359 per ha on the top winter milk farms which was 22% or €600 per ha higher than those on the average farm.
n The biggest variable cost on winter milk dairy farms in 2015 was purchased forage and concentrate accounting for 44% or €748 per ha of total variable costs.
n The average winter milk dairy farm in 2015 generated a net profit of €1,400 per ha compared to €2,182 per ha on the top 25% of farms.

12
e-Profit Monitor Analysis Dairy Farms 2015
Winter Milk Dairy Farms 2015
Winter milk dairy farms net profit per hectare 2015
Winter milk dairy farms net profit per hectare 2015
l
Average winter milk variable costs per hectare 2015
J
Net Profit (€/ha)
€0
€1,250
€2,500
€3,750
€5,000
Top 25% Average
€1,400
€2,182 Net Profit (€/ha)
€249
€200
€69
€143
€292
€748
FeedFertVetAIContractorOther Var. Costs
1,112 kg MS/ha
1,040 kg MS/ha
8.9 T Grass DM/ha9.9 T Grass DM/ha
Average winter milk variable costs per hectare 2015
Winter milk dairy farms net profit per hectare 2015
l
Average winter milk variable costs per hectare 2015
J
Net Profit (€/ha)
€0
€1,250
€2,500
€3,750
€5,000
Top 25% Average
€1,400
€2,182 Net Profit (€/ha)
€249
€200
€69
€143
€292
€748
FeedFertVetAIContractorOther Var. Costs
1,112 kg MS/ha
1,040 kg MS/ha
8.9 T Grass DM/ha9.9 T Grass DM/ha

13
e-Profit Monitor Analysis Dairy Farms 2015
Profit Monitor per hectare analysis
(1,392 farms)
Grass Rich vs Grass Poor Systems of
Spring Milk Production 2015

14
e-Profit Monitor Analysis Dairy Farms 2015Grass Rich vs Grass Poor Systems of Spring Milk Production 2015
Grass Rich Grass Poor
Proportion of purchased feed in the diet
<10% 10-20% 20-30% >30%
No. of farms 244 831 261 56
Physical
Stocking rate (LU/ha) 2.2 2.2 2.2 2.3
Grass used (t DM/ha) 10.2 9.3 8.5 7.7
Grass in diet (% total DM consumed)
92% 85% 76% 64%
Milk yield (litres/cow) 5,142 5,477 5,681 6,267
Milk solids (kg/ha) 949 955 978 1,086
Financial (€/ha)
Gross Output 3,795 3,865 3,954 4,495
Variable Costs 1,173 1,358 1,599 1,990
Gross Margin 2,622 2,507 2,355 2,505
Fixed Costs 1,053 1,033 1,061 1,217
Net Profit excl. premia 1,569 1,474 1,293 1,288
15
e-Profit Monitor Analysis Dairy Farms 2015Grass Rich vs Grass Poor Systems of Spring Milk Production 2015
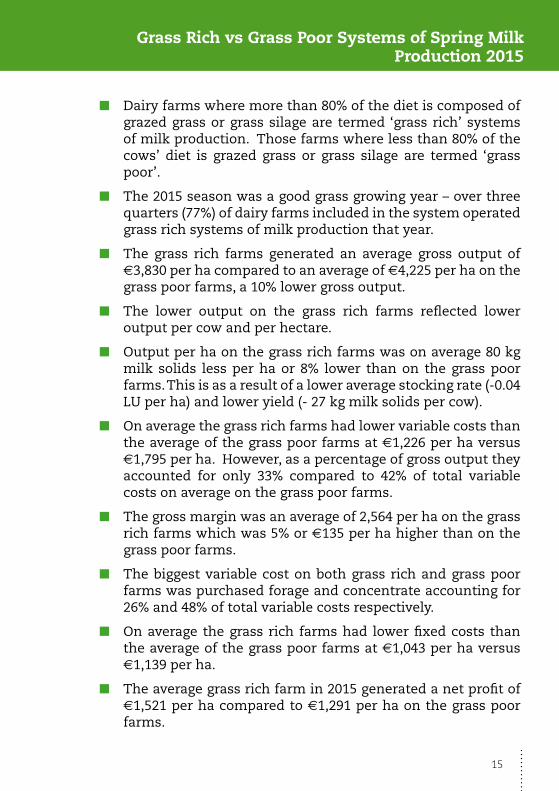
n Dairy farms where more than 80% of the diet is composed of grazed grass or grass silage are termed ‘grass rich’ systems of milk production. Those farms where less than 80% of the cows’ diet is grazed grass or grass silage are termed ‘grass poor’.
n The 2015 season was a good grass growing year – over three quarters (77%) of dairy farms included in the system operated grass rich systems of milk production that year.
n The grass rich farms generated an average gross output of €3,830 per ha compared to an average of €4,225 per ha on the grass poor farms, a 10% lower gross output.
n The lower output on the grass rich farms reflected lower output per cow and per hectare.
n Output per ha on the grass rich farms was on average 80 kg milk solids less per ha or 8% lower than on the grass poor farms. This is as a result of a lower average stocking rate (-0.04 LU per ha) and lower yield (- 27 kg milk solids per cow).
n On average the grass rich farms had lower variable costs than the average of the grass poor farms at €1,226 per ha versus €1,795 per ha. However, as a percentage of gross output they accounted for only 33% compared to 42% of total variable costs on average on the grass poor farms.
n The gross margin was an average of 2,564 per ha on the grass rich farms which was 5% or €135 per ha higher than on the grass poor farms.
n The biggest variable cost on both grass rich and grass poor farms was purchased forage and concentrate accounting for 26% and 48% of total variable costs respectively.
n On average the grass rich farms had lower fixed costs than the average of the grass poor farms at €1,043 per ha versus €1,139 per ha.
n The average grass rich farm in 2015 generated a net profit of €1,521 per ha compared to €1,291 per ha on the grass poor farms.

16
e-Profit Monitor Analysis Dairy Farms 2015
€1,000
€1,200
€1,400
€1,600
€1,800
> 90% 80-90% 70-80% < 70%
1,2881,293
1,474
1,569
949 kgMS/ha
955 kgMS/ha
978 kgMS/ha
1,086 kgMS/ha
10.2T GrassDM/ha 9.3T Grass
DM/ha 8.5T GrassDM/ha 7.7T Grass
DM/ha
2015 Net Profit (€/ha) on spring milk dairy farms categorised by % of grass in the diet
‘Grass Rich’ Systems ‘Grass Poor’ Systems
Grass Rich vs Grass Poor Systems of Spring Milk Production 2015

17
e-Profit Monitor Analysis Dairy Farms 2015
Regional analysis - Spring Milk Production 2015
Profit Monitor per hectare analysis
(1,392 farms)

18
e-Profit Monitor Analysis Dairy Farms 2015
Regional analysis - Spring Milk Production 2015
Regions
Cork: Cork East and Cork West.
Midlands: Kildare: Laois; Longford; Louth; Meath; Offaly, Tipperary NR; Westmeath and Wicklow.
North West: Cavan; Clare; Donegal; Galway; Leitrim; Mayo; Monaghan; Roscommon and Sligo.
South East: Carlow; Kilkenny; Tipperary SR; Waterford and Wexford.
South West: Limerick and Kerry.
Region Average Cork Midlands North West
South East
South West
No. of farms 1,392 339 274 288 292 199
Physical
Herd size (Cows) 106 113 119 85 115 92
Dairy Ha 48 49 53 42 51 43
Stocking rate (LU/ha)
2.21 2.33 2.24 2.01 2.25 2.15
Grass used (t DM/ha)
9.4 10.0 9.5 7.9 9.8 8.9
Grass in diet (% total DM consumed)
84% 84% 85% 81% 86% 84%
Milk yield (litres/cow)
5,489 5,657 5,390 5,380 5,545 5,411
Milk solids (kg/ha)
966 1,054 969 847 1,007 917
Financial (€/ha)
Gross Output 3,893 4,272 3,863 3,421 4,085 3,702
Variable Costs 1,404 1,525 1,331 1,308 1,420 1,360
Gross Margin 2,489 2,748 2,532 2,113 2,665 2,342
Fixed Costs 1,061 1,109 1,111 956 1,083 950
Net Profit excl. premia
1,428 1,638 1,421 1,157 1,582 1,392
19
e-Profit Monitor Analysis Dairy Farms 2015
Regional analysis - Spring Milk Production 2015
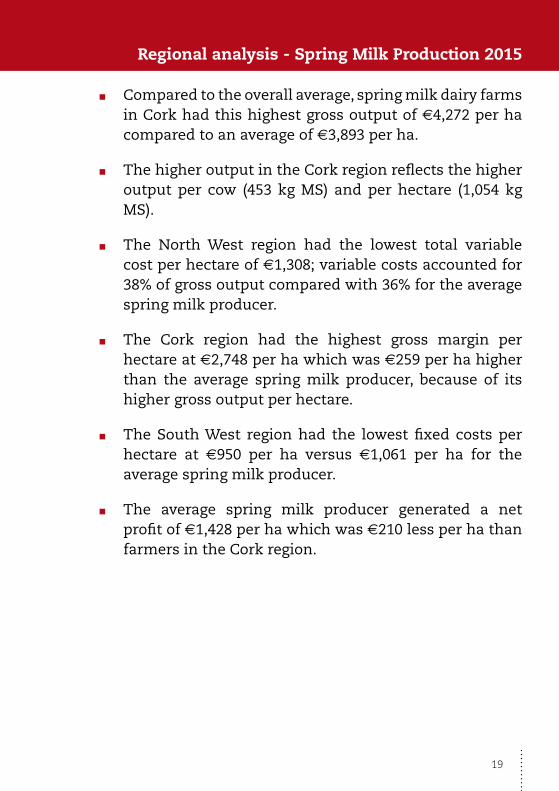
n Compared to the overall average, spring milk dairy farms in Cork had this highest gross output of €4,272 per ha compared to an average of €3,893 per ha.
n The higher output in the Cork region reflects the higher output per cow (453 kg MS) and per hectare (1,054 kg MS).
n The North West region had the lowest total variable cost per hectare of €1,308; variable costs accounted for 38% of gross output compared with 36% for the average spring milk producer.
n The Cork region had the highest gross margin per hectare at €2,748 per ha which was €259 per ha higher than the average spring milk producer, because of its higher gross output per hectare.
n The South West region had the lowest fixed costs per hectare at €950 per ha versus €1,061 per ha for the average spring milk producer.
n The average spring milk producer generated a net profit of €1,428 per ha which was €210 less per ha than farmers in the Cork region.

20
e-Profit Monitor Analysis Dairy Farms 2015

21
e-Profit Monitor Analysis Dairy Farms 2015
Matched Sample of Winter and Spring Milk Producers 2009-2015 (100 farms)

22
e-Profit Monitor Analysis Dairy Farms 2015
2009 2010 2011 2012 2013 2014 2015 Change
2009-2015
Physical
Herd Size (No. cows)
71 74 78 78 81 82 91 20
Dairy Ha 35 36 37 37 38 38 41 6
Stocking rate (LU/ha)
2.06 2.10 2.11 2.12 2.18 2.17 2.23 0.17
Milk yield (litres/cow)
5,411 5,722 5,726 5,611 5,702 5,681 5,914 503
Milk solids (kg/ha)
828 907 912 902 945 947 1,030 203
Financial (€/ha)
Gross Output
2,663 3,762 4,373 4,054 4,997 4,740 4,235 1,572
Variable Costs
1,336 1,448 1,555 1,803 2,142 1,899 1,706 370
Gross Margin
1,327 2,315 2,818 2,251 2,855 2,841 2,529 1,201
Fixed Costs 1,023 1,119 1,227 1,242 1,318 1,450 1,300 277
Net Profit excl. premia
304 1,196 1,591 1,008 1,537 1,391 1,229 924
Net Profit ( /ha)
0
450
900
1,350
1,800
2009 2010 2011 2012 2013 2014 2015
Matched Sample of Winter and Spring Milk Producers 2009-2015 (n=100)

23
e-Profit Monitor Analysis Dairy Farms 2015Matched Sample of Winter and Spring Milk Producers 2009-2015 (n=100)
n Herd size and dairy land used increased by 28% and 18% respectively over the 2009-2015 period on this matched sample of spring and winter milk dairy farms.
n While the volume of milk produced increased by 9% over the period, milk solids yield per hectare increased by 24% reflecting a combination of higher yield (60 kg milk solids per cow) and higher stocking rate (0.17 LU/ha).
n Gross output per hectare increased by 59% over the period but this was counterbalanced by a 28% increase in variable costs and a 27% rise in fixed costs.
n Net profit per hectare increased by 304% over the period reflecting mainly the increased milk price received in 2015 compared with 2009.

24
e-Profit Monitor Analysis Dairy Farms 2015

25
e-Profit Monitor Analysis Dairy Farms 2015
Profit Monitor per hectare analysis
(1,392 farms)
Spring Milk Dairy Farms 2015 – costs per cow and per litre

26
e-Profit Monitor Analysis Dairy Farms 2015
Spring Milk Dairy Farms 2015 – costs per cow and per litre
4 Ranked by net profit per hectare.
Spring Milk Dairy Farms 2015 – costs per cow and per litre
Top 25%4 Average Difference Top 25% - Average
Physical
Stocking rate (LU/ha) 2.54 2.21 0.33
Grass used (t DM/cow) 4.48 4.24 0.24
Milk yield (litres/cow) 5,832 5,489 343
Milk solids Fat (%) / Protein (%)Milk solids (kg/cow)
4.21 / 3.61470
4.17 / 3.57437
0.04 / 0.0433
Financial
c/litre €/cow c/litre €/cow c/litre €/cow
Gross OutputCo-op Price
33.3331.98
1,944 32.0931.24
1,761 1.240.74
182
Variable CostsFeedFertiliserVetAIContractorOther var. costsTotal Variable Costs
3.472.441.030.521.431.74
10.64
202142603083101621
3.822.581.090.571.601.90
11.57
210142603188
104635
- 0.35- 0.14- 0.06- 0.05- 0.17- 0.16- 0.93
- 7 1 0 1- 4- 3
- 15
Gross Margin 22.69 1,662 20.52 1126 2.17 536
Fixed Costs LabourMachineryCat/ESB/PhoneDepreciationLeasesInterestOther fixed costsTotal Fixed Costs
0.841.051.061.680.730.561.527.31
49616298433389
426
1.051.321.231.790.910.611.848.75
587268985033
101480
- 0.21- 0.27- 0.17- 0.11- 0.18- 0.05- 0.32- 1.44
- 9- 11- 6 0- 7- 1
- 12- 54
Net Profit excl. premia
15.38 897 11.77 646 3.61 251

27
e-Profit Monitor Analysis Dairy Farms 2015
Spring Milk Dairy Farms 2015 – costs per cow and per litre Spring Milk Dairy Farms 2015 – costs per cow and per litre
n Compared with the average farm, the highest net profit farms are more highly stocked (0.33 LU/Ha) and more productive (33 kg milk solids per cow) and higher output (1.24 c and e182 per cow) with 60% of the difference in output per litre coming from higher milk price);
n The highest net profit farms had lower variable costs per litre and per cow (0.93 c and e15 respectively) and lower fixed costs per litre and per cow (1.44 c and e54 respectively);
n Net profit is 39% higher per cow than the average spring milk producer with 73% and 27% of the difference derived from higher output and lower production costs respectively.

28
e-Profit Monitor Analysis Dairy Farms 2015
29
e-Profit Monitor Analysis Dairy Farms 2015
Winter Milk Dairy Farms 2015 – costs per cow and per litre
Profit Monitor per hectare analysis
(170 farms)

30
e-Profit Monitor Analysis Dairy Farms 2015
Winter Milk Dairy Farms 2015 – costs per cow and per litre
5 Ranked by net profit per hectare.
Top 25%5 Average Difference Top 25% - Average
Physical
Stocking rate (LU/ha) 2.37 2.27 0.10
Grass used (t DM/cow) 4.16 3.94 0.92
Milk yield (litres/cow) 6,093 5,960 133
Milk solids Fat (%) / Protein (%)Milk solids (kg/cow)
4.05 / 3.49494
4.03 / 3.45458
0.02 / 0.0436
Financial (w/cow)
c/litre w/cow
c/litre w/cow
c/litre w/cow
Gross OutputCo-op Price
33.9633.15
2,069 32.9832.26
1,966 0.980.89
104
Variable CostsFeedFertiliserVetAIContractorOther var. costsTotal Variable Costs
5.281.890.910.471.171.67
11.40
322115552971102695
5.532.161.060.511.481.84
12.59
330129633088110750
- 0.25- 0.27- 0.15- 0.04- 0.31- 0.17- 1.19
-8- 14- 8- 2-17- 8
- 56Gross Margin 22.56 1,374 20.38 1,215 2.18 159
Fixed Costs LabourMachineryCat/ESB/PhoneDepreciationLeasesInterestOther fixed costsTotal Fixed Costs
1.541.311.021.640.710.541.538.30
948062100433393
506
1.831.651.241.940.850.631.91
10.04
10998741165138114598
- 0.29- 0.34- 0.22- 0.3- 0.14- 0.09- 0.38- 1.74
-15-19-12- 16- 7- 5- 21- 93
Net Profit excl. premia
14.26 869 10.35 617 3.91 252

31
e-Profit Monitor Analysis Dairy Farms 2015
Winter Milk Dairy Farms 2015 – costs per cow and per litre
n Compared with the average farm, the highest net profit farms are more highly stocked (0.10 LU/Ha) and more productive (36 kg more milk solids per cow); have greater output (0.98 c and €104 per cow) with 91% of the difference in output per litre coming from higher milk price);
n The highest net profit farms had lower variable costs per litre and per cow (1.19 c and €56 respectively) and lower fixed costs per litre and per cow (1.74 c and €93 respectively);
n Net profit is 41% higher per cow than the average winter milk producer with 41% and 59% of the difference derived from higher output and lower production costs respectively.

32
e-Profit Monitor Analysis Dairy Farms 2015

33
e-Profit Monitor Analysis Dairy Farms 2015
Difference between Top Net Profit farms per litre vs Top Net Profit farms per hectare – 2015

34
e-Profit Monitor Analysis Dairy Farms 2015Difference between Top Net Profit farms per litre vs Top Net Profit farms per hectare – 2015
Top 25%Ranked by
Net profit per hectare
Top 25%Ranked by Net Profit per litre
Top 25% per hectare – top 25% per litre
Physical
Herd Size (No. cows) 114 105 9
Dairy Ha 45 44 1
Stocking rate (LU/ha) 2.54 2.39 0.15
Grass used (t DM/ha) 11.4 10.6 0.8
Grass in diet (% total DM consumed)
86 87 -1
Milk yield (litres/cow) 5,832 5,565 267
Milk solids Fat (%) / Protein (%)Milk solids (kg/cow [kg/ha))
4.21 / 3.61470 / 1,194
4.22 / 3.61449 / 1,073
- 0.01 / - 0.0021 / 121
Per litre
Per ha
Per litre
Per ha
Per litre
Per ha
Financial (g/ha)
Gross Output 33.33 4,937 33.69 4,481 -0.36 456
Variable Costs 10.64 1,576 10.22 1,359 0.42 217
Gross Margin 22.69 3,362 23.48 3,123 -0.78 239
Fixed Costs 7.31 1,084 7.10 945 0.21 139
Total Costs 17.95 2,660 17.32 2,304 0.63 356
Net Profit excl. premia
15.38 2,278 16.38 2,178 -1.00 100

35
e-Profit Monitor Analysis Dairy Farms 2015Difference between Top Net Profit farms per litre vs Top Net Profit farms per hectare – 2015
Difference between Top Net Profit farms per litre vs Top Net Profit farms per hectare – 2015
n The top profit per hectare farms generated an average gross output of c4,937 per ha which was c456 higher per hectare compared to the top profit per litre farms.
n This higher output was achieved because of their higher yield (21 kg milk solids per cow) and higher stocking rate (0.15 LU/ha).
n Part of the output advantage of the top profit per hectare farms was lost due to their higher variable costs per hectare and per litre (c217 and 0.42 c respectively).
n Gross margin for the category was still c239 higher per hectare but due to a combination of lower gross output and higher variable costs their gross margin per litre was 0.76 c lower per litre.
n The high net profit per hectare farms had higher fixed costs per hectare and per litre (c139 and 0.21 c respectively)
n While net profit per litre was 6% lower (1.00 c) on the high net profit per hectare farms, net profit her hectare was 5% higher (c100).
n The implications of these findings for dairy farming without the restrictions of milk quota are that the more profitable farms are those:
o Higher stocked farms growing and utilising large quantities of grass;
o Delivering high output - large quantities of high value milk solids per cow and per hectare (in excess of 440 and 1,150 respectively);
o Operating at relatively low but not necessarily the lowest cost.
36
e-Profit Monitor Analysis Dairy Farms 2015
l
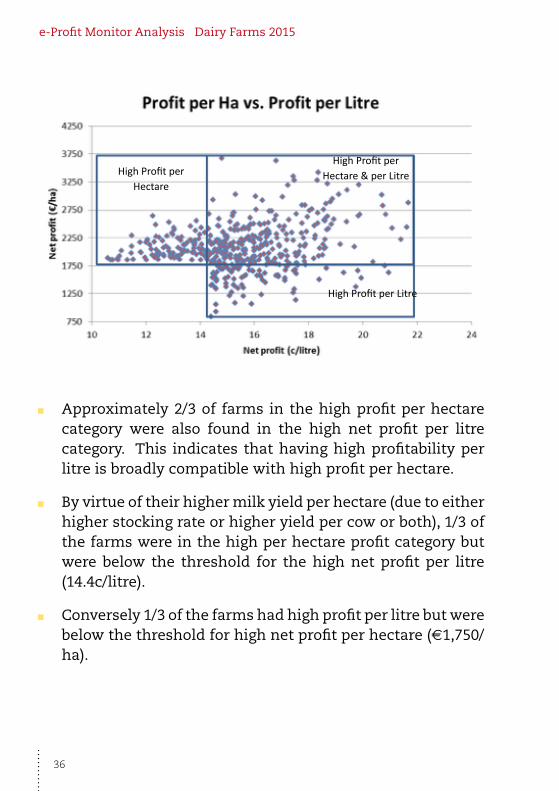
Approximately 2/3 of farms in the high profit per hectare category were also found in the high net profit per litre category. !his indicates that having high profitability per litre is broadly compaEble with high profit per hectare.
By virtue of their higher milk yield per hectare (due to either higher stocking rate or higher yield per cow or both), 1/3 of the farms were in the high per hectare profit category but were below the threshold for the high net profit per litre (14.4c/litre).
High Profit per Hectare
High Profit per Litre
High Profit per Hectare & per Litre
n Approximately 2/3 of farms in the high profit per hectare category were also found in the high net profit per litre category. This indicates that having high profitability per litre is broadly compatible with high profit per hectare.
n By virtue of their higher milk yield per hectare (due to either higher stocking rate or higher yield per cow or both), 1/3 of the farms were in the high per hectare profit category but were below the threshold for the high net profit per litre (14.4c/litre).
n Conversely 1/3 of the farms had high profit per litre but were below the threshold for high net profit per hectare (c1,750/ha).

37
e-Profit Monitor Analysis Dairy Farms 2015
Replacement Heifer Costs

38
e-Profit Monitor Analysis Dairy Farms 2015Replacement Heifer Costs
The guideline costings for spring born dairy replacement heifers on creamery milk farms on comes from the average 2015 Profit Monitor data for 1,374 farms. The costs are evaluated per LU – the average age at calving for spring born and autumn born heifer calves was 28 months on Irish spring calving dairy farms in 2012 – thus 1.2 LU was required per heifer calving on spring milk farms that year. This equates to fixed and variable costs of c823 per heifer before the opportunity costs of the replacement heifer calf, own land used and own labour are accounted for.

39
e-Profit Monitor Analysis Dairy Farms 2015Replacement Heifers
Costs per LU (s)
Stocking rate (LU/ha) 2.21
Variable CostsConcentrate Costs
Fertiliser and LimeVet
AI/BreedingContractor
Other Variable CostsTotal variable costs
1181395515
10645
478
Fixed costs6
Hired LabourMachinery Costs
InterestCar/ESB/Phone
DepreciationOther Fixed costsTotal fixed costs
222713253685
208
Total Fixed & Variable Costs 686
Not included in the costs outlined above are:
1) The value of the replacement heifer calf – approximately d300 per head;
2) Leased land cost and the opportunity cost of owned land required for rearing replacement heifers. Assuming a value of d500/ha, the land cost per replacement is d212 per heifer reared (included in the other fixed costs is a d48/LU cost for leased land);
3) The own labour costs associated with replacement heifer rearing – Moorepark Labour Survey estimate approximately d229/LU.
6 Includes land rental cost of d53/LU.

40
e-Profit Monitor Analysis Dairy Farms 2015
What is the difference between eProfit Monitor and National Farm Survey results?7
The cost of production on dairy farms is an issue of critical importance
to the sector especially at a time when farmers may be planning
expansion in the aftermath of milk quotas and also given the current
weakness in dairy markets. Teagasc produces an analysis of dairy
production costs on an annual basis using both the eProfit Monitor
(ePM) and the National Farm Survey (NFS). These results tend to vary
somewhat, which can be the source of some confusion. The ePM
typically reports lower costs of production and higher profits. In this
article the two data sources are described and compared.
The National Farm Survey (NFS) involves the collection of data on
an annual basis from a random, nationally representative sample
of approximately 1,000 farms (of which about 300 are classed as
specialist dairy farmers). The NFS is a member of the pan-EU Farm
Accountancy Data Network (FADN) which uses a harmonised system
to collect national statistics on farming across Europe. Data validation
is by the Teagasc data recorder with reference to financial documents.
The Teagasc eProfit Monitor (ePM) is a financial benchmarking tool
that is available to all Teagasc clients via the Teagasc website. Data
(both technical and financial) are provided by the farmer through the
completion of an Input Sheet and can be entered directly by the farmer
or (as is more likely) by his/her Teagasc Adviser. Advisers select farmers
to complete the benchmarking analysis and users are encouraged to
repeat the analysis over a number of years. The results generated
are not nationally representative as the farms included in the annual
dataset are self-selecting and do not proportionally represent the

41
e-Profit Monitor Analysis Dairy Farms 2015
entire farming population.
Table 1 summarises the key features of both systems. While there
are some differences in the cost headings used and the calculation
of depreciation, the results generated for an individual dairy farmer
will be similar for both analyses. This suggests that the methodology
employed by both systems is similar and that methodological
differences do not account for the differing results from the two
systems.
Table 1: Summary of key features of National Farm Survey (NFS) and eProfit Monitor (ePM)
National Farm Survey (NFS) eProfit Monitor (ePM)
Data collection Data provided by farmer and verified by Teagasc data recorder with reference to financial documents (invoices etc.)
Data provided by farmer using Input Sheet and verified by Adviser
Calculation of total costs
Costs grouped into ‘Direct’ and ‘Overhead’ categories
Costs grouped into ‘Variable’ and ‘Fixed’ categories
Apportionment of costs
Similar to ePM except discussion takes place between recorder and farmer re allocation
Variable costs are allocated on the basis of LUs; fixed costs are allocated on the basis of output
Treatment of heifer rearing costs
Similar to ePM except transfer values are agreed between data recorder and farmer (standardised values used in ePM)
Heifer rearing charge included against Gross Output on Dairy Enterprise report; separate Replacement Enterprise report also produced
Treatment of own labour
Own labour charge not included
Land charge No land charge included for owned land
Depreciation Replacement method used Straight line method used based on original asset value
Treatment of inventory
Recorded at year end; fodder crop adjustment calculated
Facility to record inventory available but rarely used
Reports Whole farm and dairy enterprise reports
7 The original copy of this article appeared in the Teagasc publication TResearch Winter 2015 p.p. 38-39 http://www.teagasc.ie/publications/view_publication.aspx?publicationID=3788

42
e-Profit Monitor Analysis Dairy Farms 2015
Given the relatively small differences in the methodologies of the two systems, it is most likely that the difference in the results is due to sample issues. As can be seen, ePM farms are, on average, larger, more intensively managed and more productive than NFS farms (Table 2).
Table 2: Characteristics of the average dairy farm in the Teagasc NFS and the Teagasc ePM: 2014
NFS ePM
(n=318) (n = 1363)
Herd Size (cows) 68 97
Total Milk production (litres) 351,560 497,901
Stocking Rate 2.07 2.17
Yield Per Cow (litres) 5,170 5,133
Milk Solids per cow (kg) 375 402
Milk Solids per hectare (kg) 775 872
Grass utilised (kgDM/ha) 7.41 8.5
These differences in management and productivity resulted in cost and profit differences between the two samples. Direct and fixed costs were 13 and 8 per cent lower respectively on the average ePM farm in 2014 (Table 3). The difference in financial performance is more apparent when examined on a per cow or a per hectare basis (results not shown) reflecting the higher rates of productivity on the ePM farms.
Table 3: Output, Costs and Profit (cent per litre) for the average dairy farm in the Teagasc NFS and the Teagasc ePM: 2014
NFS ePM
(n=318) (n = 1363)
Milk Price 39.5 39.26
Gross Output 38.9 39.43
Total Direct Costs 14.74 12.90
Total Fixed Costs 11.16 10.31
Net Margin (cent per litre) 12.97 16.21
Net Margin (d per cow) 671 832
Net Margin (d per hectare) 1,386 1,806

43
e-Profit Monitor Analysis Dairy Farms 2015
Finally, in addition to comparing the average farm in the ePM and NFS, a comparison was made between the top and bottom performing farms. The profit differential between the ePM and the NFS was smaller for the Top one-third of farms in the two samples but was larger for the bottom one-third. This suggests that the “best” farms in the two groups are more comparable than the “poorest” farms, reflecting the fact that the NFS provides a greater representation of poorer performing farms.
Which data to use?
There are clear differences in the two data sources, so which is the appropriate one to use? Given the advisory and farm management
focus of the ePM system, this is the most suitable data source for farm advisory events where the demonstration of “best practice” is the focus. On the other hand, the Teagasc NFS provides an insight into all types of farming and given the representative nature of its sample it is the more
appropriate source to use in presentation of national results and especially in issues pertaining to government policy, economic planning and cross-
country comparisons.
In summary, the average ePM dairy farmer was 30 per cent more profitable on a per hectare basis than the average NFS dairy farmer in 2014. While a small amount of this differential was due to methodological issues, it is more likely that the different samples used in the two systems was the main cause for variation. It is clear that the farmers participating in ePM are larger and more productive than the national average. Furthermore, all of the farms participating in ePM are in active contact with a Teagasc Adviser and are evidently benefitting from that interaction.

44
e-Profit Monitor Analysis Dairy Farms 2015

45
e-Profit Monitor Analysis Dairy Farms 2015

e-Profit Monitor Analysis Dairy Farms 2015
Contact DetailsAnimal & Grassland Research and Innovation CentreTeagasc,Moorepark,Fermoy, Co. CorkIreland.
Tel: + 353 (0)25 42222
www.teagasc.ie
Design & Print by Modern Printers: 056 7721739