Embed Size (px)
Citation preview

Gerard,Liu,Corliss,Varma,Spitulnik&Linn(inpress).Teachingwithvisualizations:Acomparisonstudy.InC.Mouza&N.Lavigne(Eds.)EmergingTechnologiesfortheClassroom:ALearningSciencesPerspective.NewYork:Springer
Teaching with Visualizations: A Comparison Study
Libby F. Gerard, Ed.D University of California at Berkeley, Graduate School of Education, [email protected], 415-794-0525 (phone), 510-643-0520 (fax), 4523 Tolman Hall, mc1670, Berkeley, CA 94720 Ou Lydia Liu, Ph.D Educational Testing Service, [email protected], Rosedale Road, Princeton, Jersey, 085411 Stephanie B. Corliss, Ph.D University of Texas at Austin, Division of Instructional Innovation and Assessment, [email protected], PO Box 7246, Austin, TX 78713 Keisha Varma, Ph.D University of Minnesota, College of Education and Human Development, [email protected],155 Education Sciences Building, 56 East River Road, Minneapolis, MN 55455 Michele Spitulnik, Ph.D Contra Costa Jewish Day School, [email protected], 3836 Mount Diablo Blvd. Lafayette, CA 94549 Marcia C. Linn, Ph.D University of California at Berkeley, Graduate School of Education, [email protected], 4611 Tolman Hall, mc1670, Berkeley, CA 94720
Author Note: This material is based upon work supported by National Science Foundation (NSF) grant numbers 0455877 and 0334199. Any opinions, findings, and conclusions or recommendations expressed in this material are those of the authors and do not necessarily reflect the views of the NSF. The authors gratefully acknowledge support and feedback from participating MODELS and TELS teachers and the members of the Technology-Enhanced Learning in Science Center.

Gerard,L.F.,Liu,O.,Corliss,S.B.,Varma,K.,Spitulnik,M.W.,&Linn,M.C.(inpress).Teachingwithvisualizations:Acomparisonstudy.InC.Mouza&N.Lavigne(Eds.)EmergingTechnologiesfortheClassroom:ALearningSciencesPerspective.NewYork:Springer
Teaching with Visualizations: A Comparison Study
Libby Gerard, University of California, Berkeley Ou Lydia Liu, Educational Testing Service
Stephanie Corliss, Univerity of Texas at Austin Keisha Varma, University of Minnesota
Michele Spitulnik, Contra Costa Jewish Day School, Lafayette, CA and Marcia C. Linn, University of California, Berkeley
Abstract
Previous research suggests the value of technology-enhanced materials that guide learners to use dynamic, interactive visualizations of science phenomena. The power of these visualizations to improve student understanding depends on the teacher. In this chapter we contrast two professional development programs focused on teaching with visualizations. The programs differ in intensity but follow the same basic philosophy. We show that the more intense professional development approach results in more effective teacher implementation of visualizations and greater student learning gains. We identify specific strategies that other educators can use to improve student knowledge integration with interactive visualizations.

Gerard,Liu,Corliss,Varma,Spitulnik&Linn(inpress).Teachingwithvisualizations:Acomparisonstudy.InC.Mouza&N.Lavigne(Eds.)EmergingTechnologiesfortheClassroom:ALearningSciencesPerspective.NewYork:Springer
BACKGROUND
Introduction
It is the last period of the day in the 6th grade classroom in Jefferson Middle School.
Instead of daydreaming about the end-of-the-day bell or chatting with friends about lunchtime
gossip, students are engrossed in exploration of the greenhouse effect.
Student 1: Okay, Go. Make it [albedo] really high? Student 2: How about sunrays? Click on that Student 1: Want to put a cloud? What do you think is going to happen now when we put CO2? Student 2: [Reading text on computer] The CO2 plus thinning air is going to help the clouds
bounce off the sunrays. Do you see how they’re going to do that? Student 1: See! watch that one [sunray] right there. Student 2: [Reading] Do you see how they’re bouncing? The sunrays are bouncing off of the
clouds. And they’re bouncing off of the CO2 too. So… Student 1: Let’s see how long it takes before [the sunray] leaves. Oh, that one’s going….oh,
no…that one’s going back in [the earth]. Student 2: The CO2 helped the clouds even though the CO2 is bad. It reflected the sunlight. Student 1: Because that’s what, that’s what’s in the air right now on earth and… But, here [in
the visualization], we can just like, magically take it away and we see what happens...
Students in the above example try out multiple conjectures about global climate change, a
highly relevant science topic that is rarely taught due to its complexity. Students “magically” add
and take away different variables like cloud cover and carbon dioxide and observe their role in
earth’s temperature. This interaction sharply contrasts with how students typically experience
science in a secondary classroom. Most science instruction follows an absorption model of
teaching and learning (Linn & Eylon, 2011). Teachers tend to focus on adding ideas through
lectures, rather than on helping students refine their thinking by supporting them to integrate
these new ideas with the repertoire of their existing ideas. Students work individually on drills
and exercises that often fail to engage their curiosity, and that leave little room for them to
articulate their understanding. Moreover, when classes reach up to 40 students, teachers find

Gerard,L.F.,Liu,O.,Corliss,S.B.,Varma,K.,Spitulnik,M.W.,&Linn,M.C.(inpress).Teachingwithvisualizations:Acomparisonstudy.InC.Mouza&N.Lavigne(Eds.)EmergingTechnologiesfortheClassroom:ALearningSciencesPerspective.NewYork:Springer
themselves limited to monitoring students’ progress through end-of-unit tests. This makes it
difficult for teachers to provide useful, individualized feedback, and students become frustrated
and disengaged as their only indication of success or failure comes from a single test.
Inquiry activities featuring visualizations of science concepts move away from this
absorption model of instruction. We define visualizations as computer based, interactive models,
simulations, animations, graphs, data tables, drawing and diagramming tools. Visualizations give
students the opportunity to direct their own learning as they explore the variables involved in
complex science phenomena, such as cell division, global climate change, chemical reactions
and evolution. Visualizations require scaffolding in order to improve students’ scientific
understanding. Students, as shown in the example above, often change the visualizations
conditions rapidly - “make albedo really high…how about sunrays, click on that…want to put a
cloud…what about CO2” - and seemingly at random. Students are engaged. But they do not
necessarily link evidence from the visualization to scientific ideas.
Research indicates that visualizations can be “deceptively clear” (Chiu & Linn, in press).
That is, they can leave students with a feeling of deep understanding when that understanding
might in fact be superficial or erroneous. Students often point out salient features of
visualizations but need support to gather and use evidence from visualizations to formulate
scientific explanations and arguments; systematically experiment with a visualization by
controlling variables and documenting outcomes; sort out ideas gathered from different
visualizations of related processes within the same scientific phenomena; identify limitations of a
visualization, work effectively with a partner to reconcile visualization interpretations and
articulate views, and identify gaps in their understanding (Chiu, 2009; Dunbar, 1993; McEleheny
& Linn, 2011; Zhang & Linn, in press).

Gerard,Liu,Corliss,Varma,Spitulnik&Linn(inpress).Teachingwithvisualizations:Acomparisonstudy.InC.Mouza&N.Lavigne(Eds.)EmergingTechnologiesfortheClassroom:ALearningSciencesPerspective.NewYork:Springer
The Web-Based Inquiry Science Environment (WISE, http://wise4.berkeley.edu), the
focus of this chapter, places visualizations in an inquiry oriented scaffolding, assessment and
classroom management environment. Visualizations in WISE include but are not limited to
interactive molecular level simulations, Flash and Java animations, graphs generated by students
or displaying data collected by sensors, data tables, diagramming, drawing and animation tools,
idea mangers, and video. Schools are likely to have more success with WISE to support student
inquiry learning, in comparison to stand-alone visualization tools because of these features.
Studies on professional development for stand-alone visualization tools have documented the
substantial challenges teachers face when trying to design lessons to incorporate stand-alone
visualizations to both support inquiry and address science curriculum standards (Gerard, Varma,
Corliss & Linn, 2011).
Extensive research on demonstrates significantly greater student knowledge integration in
target science concepts when students use WISE, than when using the traditional textbook
instruction (Linn, Lee, Tinker, Husic, & Chiu, 2006; Lee, Linn, Varma, & Liu, 2010). These
student learning outcomes are significantly, positively impacted by teacher participation in
professional development focused on teaching with visualizations (Liu, Lee & Linn, 2011). In
this chapter we illustrate effective teaching practices with visualizations resulting from
professional development. We provide two examples of professional development programs that
had positive results on teaching with visualizations and students’ science learning outcomes,
though the programs differ substantially in how far reaching their impact is and their overall cost.
We begin by describing the knowledge integration framework guiding the design of the WISE
learning environment and professional development programs. Next, we detail the comparative
impacts of two professional development programs on teachers’ use of WISE visualizations and

Gerard,L.F.,Liu,O.,Corliss,S.B.,Varma,K.,Spitulnik,M.W.,&Linn,M.C.(inpress).Teachingwithvisualizations:Acomparisonstudy.InC.Mouza&N.Lavigne(Eds.)EmergingTechnologiesfortheClassroom:ALearningSciencesPerspective.NewYork:Springer
their students’ developing understanding of abstract science concepts. We end with
recommendations for schools as they consider integrating visualizations into their science
program.
Knowledge Integration
We use the knowledge integration (KI) framework to guide the design of professional
development, curriculum and assessments with respect to visualizations in WISE. The KI
framework is a constructivist view that emphasizes building on the repertoire of ideas held by
learners and helping them incorporate new practices. The framework is based on extensive
research, which suggests that simply adding new ideas about teaching practices or the target
science discipline is not sufficient for inducing behavioral change. Learners, including teachers
and students, have a repertoire of ideas about instruction and learning, science and technology,
based on their observations, experiences, and education. The KI perspective emphasizes asking
learners to articulate their ideas about the target phenomena, adding ideas to learners’ repertoire
in ways that make the new information accessible, enabling learners to use evidence to sort out
and distinguish among these new ideas and their existing views, and encouraging learners to
engage in an ongoing process of reflecting on and integrating the ideas, which most
appropriately explain the science content, teaching and/or learning phenomena (Linn & Eylon,
2011).
Web-Based Inquiry Science Environment
The Web-Based Inquiry Science Environment is an exemplary, web-based learning
environment that embeds varied visualizations in inquiry activities to guide student investigation
of a target phenomenon (Linn et al., 2004). Each WISE project typically takes 5 to 7 class
periods (50 minutes each) to complete. WISE projects target topic areas that are aligned with

Gerard,Liu,Corliss,Varma,Spitulnik&Linn(inpress).Teachingwithvisualizations:Acomparisonstudy.InC.Mouza&N.Lavigne(Eds.)EmergingTechnologiesfortheClassroom:ALearningSciencesPerspective.NewYork:Springer
state (CA) and national science standards, and that research suggests are difficult to teach,
because they are hard if not impossible to see in a school laboratory experiment or a regular
textbook (Linn & Hsi, 2000).
The WISE projects engage students in collaborative activities with visualizations such as
investigating hypotheses, designing solutions to problems, critiquing scientific claims, and
building scientific models. Assessments are embedded throughout the WISE projects to help
students and teachers monitor student understanding and progress as they interact with
visualizations. The embedded assessments ask students to make predictions about the
visualizations, sort out evidence, and link ideas together to explain concepts and processes
observed. The embedded assessment notes open in a pop-up window that students can place
where they prefer on the screen (See Figure 1). This allows students to work with an embedded
note while they explore a visualization tool. Pop-up hints are also available on demand, by
clicking on the Panda icon (see top left of Figure 1). Hints open in a pop-up window that
students can place where they prefer on the screen. These assessments support students’ in
monitoring their ideas to determine how new ideas relate to previous ideas, which facilitates KI.
For example, in the Mitosis project, students investigate one big question throughout the
project: how can plants help to stop cancer? The project elicits’ ideas about cell division by
asking students to explain what cancer is to a friend, and then predict what would happen to body
parts if cells started dividing out of control. Students are supported to add ideas by viewing and
manipulating dynamic visualizations of normal cell division, and cell division when treated by
three different plant medicines (See Figure 1). The Mitosis project helps students distinguish
ideas, by guiding students to collect and use evidence from the visualizations. Students
manipulate the visualizations to identify phases of mitosis in normal cell division, and in cell

Gerard,L.F.,Liu,O.,Corliss,S.B.,Varma,K.,Spitulnik,M.W.,&Linn,M.C.(inpress).Teachingwithvisualizations:Acomparisonstudy.InC.Mouza&N.Lavigne(Eds.)EmergingTechnologiesfortheClassroom:ALearningSciencesPerspective.NewYork:Springer
division when treated by three different plant medicines. Finally, the students make connections
among ideas as they use the evidence from the visualizations of cell division to recommend one
of the plants to a doctor as a medicine for cancer.
EXEMPLARS
Approximately 200 teachers and over 40,000 students have partnered with the WISE
research team over the last 5 years to refine curricular and instructional support for student
learning with WISE visualizations. Teachers and their students participated in one of our two
professional development research programs focused on teaching with visualizations: Mentored
and Online Development of Educational Leaders in Science (MODELS) or Technology-
Enhanced Learning in Science (TELS).
The professional development differed between MODELS and TELS, with respect to the
depth of interactions with teachers. The MODELS project focused on supporting teachers in two
local school districts to integrate technology-enhanced inquiry science materials into their
instruction. Each MODELS teacher participated in a 1-week summer institute for 5 consecutive
years. The TELS center focused on scaling teacher use of the same technology-enhanced inquiry
science materials. It supported over 175 teachers in seven states to implement the materials in
their classrooms. Teachers received support as needed in the classroom and participated in
optional, 1-day workshops.
We analyzed the data from seven of the teachers and their students who: (a) participated
in either the MODELS or TELS professional development program for 2 consecutive years, (b)
implemented the WISE Mitosis, and or Simple Inheritance project for 2 consecutive years, and
(c) administered a student knowledge integration baseline test, and delayed posttests for 2
consecutive years. All teachers were similar in that they had at least 5 years of experience as a

Gerard,Liu,Corliss,Varma,Spitulnik&Linn(inpress).Teachingwithvisualizations:Acomparisonstudy.InC.Mouza&N.Lavigne(Eds.)EmergingTechnologiesfortheClassroom:ALearningSciencesPerspective.NewYork:Springer
science teacher, worked in schools with a diverse student body, and had multiple colleagues also
using the WISE curriculum in their school. In the next sections, we describe how a MODELS
teacher and a TELS teacher improved their teaching practices with Mitosis visualizations over 2
years of professional development. Then, we illustrate the comparative impacts of the
professional development programs on the 7 teachers’ teaching practices and students’ science
learning outcomes.
Exemplar 1: Teaching with Visualizations in MODELS Professional Development
Ms. Cramer in the classroom (Year 1): Ms. Cramer initially selected the 7-10 day WISE
Mitosis project because she strives to help her 7th graders realize the relevance of biology to real-
world problems and was disappointed that her textbook-based lessons did not interest her
students. Ms. Cramer was impressed with the relevant scientific issues addressed in Mitosis and
the varied visualizations of cell division.
In the first year using Mitosis, Ms. Cramer was challenged by primarily technical and
classroom management issues. She had little time to focus on student learning with
visualizations. Rather, registering students in the WISE environment, viewing student work in
the grading tool, managing a classroom of students working in pairs on a computer, and
troubleshooting a slow school Internet connection, were primary concerns.
Ms. Cramer participated in a summer professional development workshop after her first
year teaching with WISE. This provided Ms. Cramer extended time to reflect on her students’
thinking in relation to the Mitosis visualizations. Ms. Cramer and her 7th grade colleagues who
also taught Mitosis identified specific embedded notes that called for their students to use
evidence from the visualizations to explain mitosis. The teachers reviewed their students’
explanations, sorting responses according to how students linked their ideas using evidence. Ms.
Gerard,L.F.,Liu,O.,Corliss,S.B.,Varma,K.,Spitulnik,M.W.,&Linn,M.C.(inpress).Teachingwithvisualizations:Acomparisonstudy.InC.Mouza&N.Lavigne(Eds.)EmergingTechnologiesfortheClassroom:ALearningSciencesPerspective.NewYork:Springer
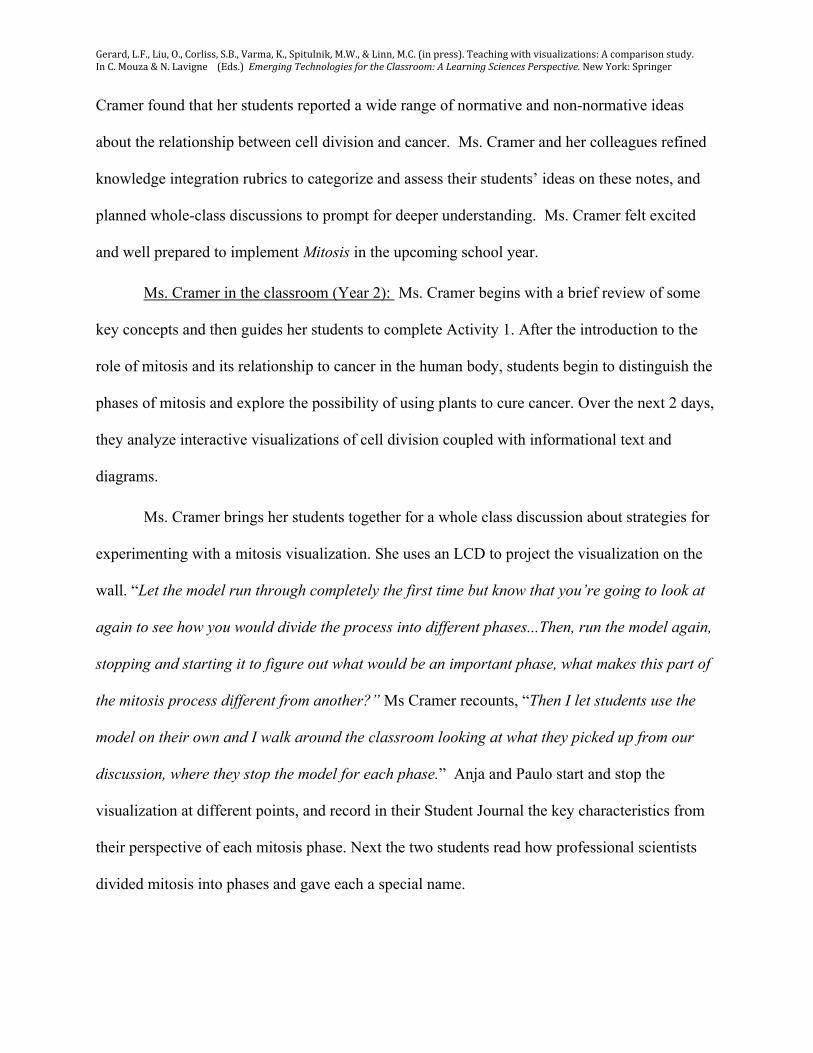
Cramer found that her students reported a wide range of normative and non-normative ideas
about the relationship between cell division and cancer. Ms. Cramer and her colleagues refined
knowledge integration rubrics to categorize and assess their students’ ideas on these notes, and
planned whole-class discussions to prompt for deeper understanding. Ms. Cramer felt excited
and well prepared to implement Mitosis in the upcoming school year.
Ms. Cramer in the classroom (Year 2): Ms. Cramer begins with a brief review of some
key concepts and then guides her students to complete Activity 1. After the introduction to the
role of mitosis and its relationship to cancer in the human body, students begin to distinguish the
phases of mitosis and explore the possibility of using plants to cure cancer. Over the next 2 days,
they analyze interactive visualizations of cell division coupled with informational text and
diagrams.
Ms. Cramer brings her students together for a whole class discussion about strategies for
experimenting with a mitosis visualization. She uses an LCD to project the visualization on the
wall. “Let the model run through completely the first time but know that you’re going to look at
again to see how you would divide the process into different phases...Then, run the model again,
stopping and starting it to figure out what would be an important phase, what makes this part of
the mitosis process different from another?” Ms Cramer recounts, “Then I let students use the
model on their own and I walk around the classroom looking at what they picked up from our
discussion, where they stop the model for each phase.” Anja and Paulo start and stop the
visualization at different points, and record in their Student Journal the key characteristics from
their perspective of each mitosis phase. Next the two students read how professional scientists
divided mitosis into phases and gave each a special name.

Gerard,Liu,Corliss,Varma,Spitulnik&Linn(inpress).Teachingwithvisualizations:Acomparisonstudy.InC.Mouza&N.Lavigne(Eds.)EmergingTechnologiesfortheClassroom:ALearningSciencesPerspective.NewYork:Springer
At the start of class the next day, Anja and Paulo begin to compare dynamic
visualizations of mitosis occurring in 3 unique, rainforest plants, to the dynamic visualization of
normal mitosis in a human cell. The two students gather and evaluate evidence from the
visualizations, and weigh the benefits against the potential side-effects of the plants for treating
cancer. They continue to add to and refine their argument concerning which plant would be the
best treatment for cancer in their WISE Journal.
Ms. Cramer listens to the student discussions and observes that multiple pairs are
challenged to relate the visualizations of abnormal mitosis to cancer treatment. She feels that this
is an important time to review students’ work. That night, Ms. Cramer reads the student-pair
responses to one note about the visualization of mitosis in Plant A, “What are your
recommendations for Plant A as a possible medicine to treat cancer?” She finds that students
are challenged to sort out the evidence from the plant visualization to formulate a
recommendation for cancer treatment. “Students are really torn about whether they actually
want to stop mitosis or not. With each of the plant models, they’re like, ‘well, I don’t want to
choose any of these plants because if you stop mitosis you won’t have any cells.’ Ms. Cramer
notices a particularly interesting explanation written by Anja and Paulo, which utilizes evidence
from the visualization of Plant A and the description of the boy with cancer. With a tool in her
Teacher Dashboard, Ms. Cramer flags Anja and Paulo’s response, along with a few other
students’ responses for comparison. In class the next day, she projects the flagged responses
(clicking a button to anonymize each flagged example) and guides a lively whole-class
discussion. “We talk about each model, weighing the different side effects of each plant
treatment in relation to effects of cancer.” This helped students to sort out their ideas about the

Gerard,L.F.,Liu,O.,Corliss,S.B.,Varma,K.,Spitulnik,M.W.,&Linn,M.C.(inpress).Teachingwithvisualizations:Acomparisonstudy.InC.Mouza&N.Lavigne(Eds.)EmergingTechnologiesfortheClassroom:ALearningSciencesPerspective.NewYork:Springer
relationships among the plant mitosis visualizations, effects on the human body, and tradeoffs of
different cancer treatments.
In a culminating activity within the Mitosis project, Anja and Paulo participate in a
structured online debate with their peers about the benefits and drawbacks of each plant as an
effective cancer treatment. The principal stops in to observe students work in the WISE project.
Ms. Cramer monitors the debate by circling the classroom to read what students are writing, and
to give suggestions as needed. She remarks to Paulo and Anja, “Tell your peers about all 3
plants. What did each one do? Why did you like/not like each one? Why did you pick that one?”
Anja and Paulo revisit the visualizations of Plant A, B and C, and then substantiate their ideas
with further evidence. “We would recommend plant B because mitosis is stopped and the cell
affected by cancer will simply just die without a nucleus and with its chromosomes floating
around the cell, because during metaphase, when the spindle fibers were coming out, the plant
caused the spindle fibers to retract…We recommended plant B instead of plant C because though
they ended up with the same results, the cell affected by plant B never divided in the first place
and was affected by the plant sooner. Plant A caused the chromosomes on the right side of the
cell to disappear during anaphase making it so that the cell on the right will not be able to divide
again. However, the cell on the left can continue dividing out of control, which is why we did not
recommend this plant.” The principal reads Anja and Paulo’s response over their shoulder, and is
impressed by their use of evidence.
On the last day, Ms. Cramer leads a class discussion on the current state of scientific
inquiry into cancer treatment. She recognizes that the mitosis visualizations illustrate not only
how cancer treatments can work, but also the substantial limitations of cancer treatment. “I know
several different kids who have somebody in their family struggling with cancer so I want them

Gerard,Liu,Corliss,Varma,Spitulnik&Linn(inpress).Teachingwithvisualizations:Acomparisonstudy.InC.Mouza&N.Lavigne(Eds.)EmergingTechnologiesfortheClassroom:ALearningSciencesPerspective.NewYork:Springer
to finish the project with a bit of hope.” Some students who completed the project early
presented research posters on the benefits and side effects of different treatments used today.
Ms. Cramer in the classroom (Summer Workshop): During the 1-week summer
professional development workshop Ms. Cramer works with her colleagues and the WISE
researchers to analyze her students’ responses to key assessments using the KI rubrics. She uses
her Teacher Dashboard to share the Mitosis project run with her other 7th grade colleagues so
they can see her students’ work in context. Based on their collaborative analysis of student data,
Ms. Cramer and her colleagues negotiate customizations to the project and their teaching
strategies in order to further scaffold students’ use of the visualizations (See Table 1).
[Insert Table 1]
They also refine their premade comment list for the Mitosis note regarding Plant A.
Exemplar 2: Teaching with Visualizations in TELS Professional Development
Ms. Lewis in the classroom (Year 1): Ms. Lewis decided to use the Mitosis project in
Year 1 because she liked how it connected cell division to the issue of curing cancer. Prior to
running the project, a TELS professional development mentor met with Ms. Lewis and showed
her how to register students in the WISE environment, manage student pairs, and assess student
work.
Ms. Lewis was excited by the Mitosis visualizations. “The visualizations really brought
mitosis to life. It made it concrete for the students.” She was challenged however to integrate the
project with her existing curriculum and efficiently assess student work. Ms. Lewis’ decided to
implement the Mitosis project after teaching the textbook unit on cell division with the hope that
the visualizations would provide greater detail than the text. Students found this sequence
frustrating. As Ms. Lewis introduced the WISE project to the class, several students remarked,

Gerard,L.F.,Liu,O.,Corliss,S.B.,Varma,K.,Spitulnik,M.W.,&Linn,M.C.(inpress).Teachingwithvisualizations:Acomparisonstudy.InC.Mouza&N.Lavigne(Eds.)EmergingTechnologiesfortheClassroom:ALearningSciencesPerspective.NewYork:Springer
“Didn’t we already do mitosis - why are we doing it again!!” Technology challenges also arose
as Ms. Lewis figured out how to locate students’ forgotten WISE passwords, arrange students
into pairs, and access students’ work. A professional development mentor came to the classroom
several days during the project implementation to assist Ms. Lewis.
Ms. Lewis’ biggest challenge in Year 1 was assessment. She was eager to grade all of her
students’ work in Mitosis to be sure they linked appropriate evidence from the mitosis
visualizations to cancer treatment. To prepare, Ms. Lewis “went through the whole project as if
[she] was a student and jotted down possible answers that students might put for each question.”
Generating criteria to grade students’ responses to the embedded notes was particularly
challenging however. She suggested the curriculum developers provide a key for the teachers
that would give the correct answer to each question and a range of sample student responses. In
addition, Ms. Lewis found that reading, grading and commenting on every single student
response was exhausting. She decided to give most students a numerical score for each response,
but wrote only 2 comments.
Ms. Lewis in the classroom (Year 2): Ms. Lewis redesigned her curriculum in Year 2 to
“do the Mitosis project in conjunction with a little bit of notes that they read in the textbook and
the related workbook pages.” Joseph and Sara were excited to work together on Mitosis. They
watched a visualization illustrating the different rates of cells division in muscle, liver, nerve and
skin cells. Sara hypothesized “Different kinds cells divide at different rates because they need to
be replenished at different speeds. For example, muscle cells divide more often than nerve cells
because they are damaged more often.” Joseph linked the rates of cell division to what he and
Sara read as the definition of cancer, a term for diseases in which abnormal cells divide without
control. Joseph commented, “I think cancer cells would divide as fast as skin cells, because they
Gerard,Liu,Corliss,Varma,Spitulnik&Linn(inpress).Teachingwithvisualizations:Acomparisonstudy.InC.Mouza&N.Lavigne(Eds.)EmergingTechnologiesfortheClassroom:ALearningSciencesPerspective.NewYork:Springer
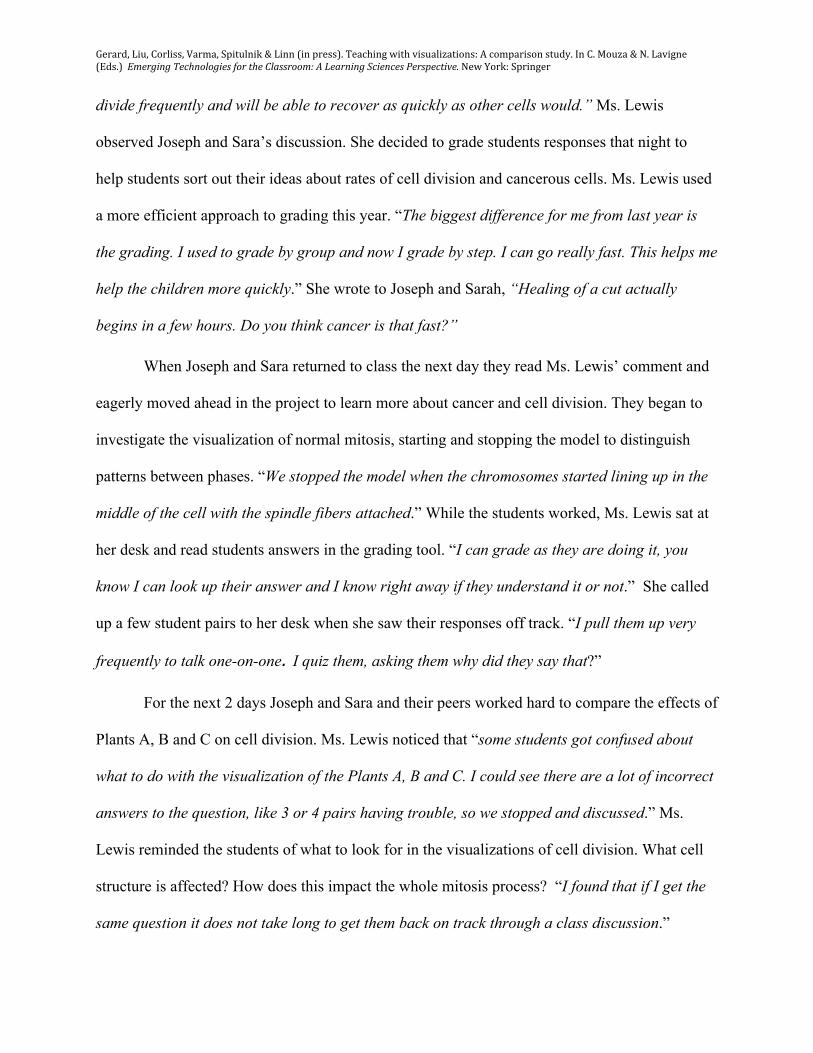
divide frequently and will be able to recover as quickly as other cells would.” Ms. Lewis
observed Joseph and Sara’s discussion. She decided to grade students responses that night to
help students sort out their ideas about rates of cell division and cancerous cells. Ms. Lewis used
a more efficient approach to grading this year. “The biggest difference for me from last year is
the grading. I used to grade by group and now I grade by step. I can go really fast. This helps me
help the children more quickly.” She wrote to Joseph and Sarah, “Healing of a cut actually
begins in a few hours. Do you think cancer is that fast?”
When Joseph and Sara returned to class the next day they read Ms. Lewis’ comment and
eagerly moved ahead in the project to learn more about cancer and cell division. They began to
investigate the visualization of normal mitosis, starting and stopping the model to distinguish
patterns between phases. “We stopped the model when the chromosomes started lining up in the
middle of the cell with the spindle fibers attached.” While the students worked, Ms. Lewis sat at
her desk and read students answers in the grading tool. “I can grade as they are doing it, you
know I can look up their answer and I know right away if they understand it or not.” She called
up a few student pairs to her desk when she saw their responses off track. “I pull them up very
frequently to talk one-on-one. I quiz them, asking them why did they say that?”
For the next 2 days Joseph and Sara and their peers worked hard to compare the effects of
Plants A, B and C on cell division. Ms. Lewis noticed that “some students got confused about
what to do with the visualization of the Plants A, B and C. I could see there are a lot of incorrect
answers to the question, like 3 or 4 pairs having trouble, so we stopped and discussed.” Ms.
Lewis reminded the students of what to look for in the visualizations of cell division. What cell
structure is affected? How does this impact the whole mitosis process? “I found that if I get the
same question it does not take long to get them back on track through a class discussion.”

Gerard,L.F.,Liu,O.,Corliss,S.B.,Varma,K.,Spitulnik,M.W.,&Linn,M.C.(inpress).Teachingwithvisualizations:Acomparisonstudy.InC.Mouza&N.Lavigne(Eds.)EmergingTechnologiesfortheClassroom:ALearningSciencesPerspective.NewYork:Springer
Ms. Lewis decided to grade student again after school and send comments after school
since she had observed how challenging it was for students to analyze the mitosis process in the
visualizations. The professional development mentor stayed to help Ms. Lewis reflect on
students’ work. She read Joseph and Sarah’s response “We think that Arias chromagonia is a
possible cure because even though it doesn't stop the cell from dividing it stops the chromosomes
from reaching the other cell”. Ms. Lewis and the mentor wrote back, “Go back to the model.
What phase of mitosis did the plant effect? Why is this important for curing cancer?” During the
grading process, Ms. Lewis told the mentor her continued difficulty with grading. “We are not
all experts in these areas. I’ve taught life science a long time but this is difficult.”
Students returned to class the next day and read through Ms. Lewis’ comments. Sara and
Joseph went back and watched the visualization of Plant A and of normal mitosis carefully. They
added to their response “The phase of mitosis that was affected by arias chromagonia was
Anaphase.” The principal popped in to observe but Ms. Lewis “barely noticed because I am so
engaged.” Ms. Lewis continued to monitor and observe students carefully. The professional
development mentor modeled how to circle the room, kneeling down to talk with student pairs at
their computers as they engaged with the visualizations. Ms. Lewis remarked to the mentor “My
interactions with my students are different when I am teaching a WISE unit than regular
teaching. It is more like one-on-two. There are a lot of students I don’t have to help so they can
move ahead and work with the visualizations without my assistance. They feel good about
themselves.” As students completed the project, Ms. Lewis was pleased. “I enjoyed doing Mitosis
myself, the models helped me in supporting inquiry”. She “extended the project one week so
students could go back, and continue to redo their notes one time and come ask if they have
questions”.

Gerard,Liu,Corliss,Varma,Spitulnik&Linn(inpress).Teachingwithvisualizations:Acomparisonstudy.InC.Mouza&N.Lavigne(Eds.)EmergingTechnologiesfortheClassroom:ALearningSciencesPerspective.NewYork:Springer
Ms. Lewis in the Classroom (Professional Development Mentor). At the end of the
project, Ms. Lewis sat down with the WISE professional development mentor to reflect on her
student work. Together, they looked over students’ pretest/posttest data and identified areas of
difficulty. Ms. Lewis noted that students did well at identifying how the Plants affected mitosis,
but few linked this back to the overarching issue of how to use the Plants to treat cancer. Ms.
Lewis planned to restructure her whole class discussions about the Plant visualizations to help
students use the evidence to describe cancer treatment.
Exemplar 3: Comparative Impacts of Professional Development on Teaching and Student
Learning with Visualizations
Ms. Cramer and Ms. Lewis illustrate the trajectory of teachers who participated in WISE
related professional development for more than 2 years. Consistent with the data from the other 5
teachers in our longitudinal study, the seven teachers reported that the biggest change they made
in their instruction to support student learning with visualizations, from Year 1 to Year 2, related
to assessment and whole class discussions.
Each of the teachers reported that they examined students’ responses to embedded
assessments about the visualizations more frequently and/or more efficiently in Year 2. As a
result, teachers in both MODELS and TELS increased the amount of comments they gave to
each student during a WISE project from Year 1 to Year 2. The TELS teachers gave an average
of 2 comments to each student during a WISE project enactment in Year 1, and 7 comments in
Year 2. The MODELS teachers gave an average of 6 comments to each student during a WISE
project enactment in Year 1, and 10 comments in Year 2. The MODELS teachers felt better
prepared to evaluate student work than the TELS teachers, having spent time in the summer
workshops collaboratively analyzing and scoring students’ responses to embedded notes. All
Gerard,L.F.,Liu,O.,Corliss,S.B.,Varma,K.,Spitulnik,M.W.,&Linn,M.C.(inpress).Teachingwithvisualizations:Acomparisonstudy.InC.Mouza&N.Lavigne(Eds.)EmergingTechnologiesfortheClassroom:ALearningSciencesPerspective.NewYork:Springer
teachers in Year 2 encouraged their students to revise their work in the WISE project after they
received comments from their teacher. This often meant revisiting the visualization to gather
specific pieces of evidence to further substantiate their claims, or to distinguish among normative
and non-normative ideas.
We have conducted further research on role of teacher comments in learning. Our work
has found that teachers’ use of specific comments, which build on student ideas about a
particular visualization, (e.g. “What happened to the spindle fibers in the visualization of Plant
A?”) are more likely to result in student revision and high quality revisions than general
comments (e.g. “Revisit the visualization and add evidence to your claim”) (Sato, 2011).
A common, successful strategy illustrated by Ms. Cramer was to identify a key embedded
note about a visualization, send students feedback on their responses to this note at night, and
then lead a whole class discussion, or “Opener”, at the start of class the next day to clarify and
build on students’ ideas. Some teachers projected the visualization on the wall during the
discussion, as we saw Ms. Cramer do. Teachers reported that this approach helped their class to
distinguish key features or limitations of a visualization. Students then went back to review their
individual comments from the teacher, revise their work, and continue in the project. TELS
teachers led fewer whole-class discussions during the week of implementation likely due to less
time in summer workshops to plan such discussions.
We have since conducted research on how teachers Openers about students’
interpretations of WISE visualizations affect learning. Findings suggest that when teachers led a
class discussion about the visualization, their students demonstrated a more robust understanding
of the visualization and more frequent revision of their explanation of the visualization, than
their students who did not have a class discussion. More specifically, class discussions that
Gerard,Liu,Corliss,Varma,Spitulnik&Linn(inpress).Teachingwithvisualizations:Acomparisonstudy.InC.Mouza&N.Lavigne(Eds.)EmergingTechnologiesfortheClassroom:ALearningSciencesPerspective.NewYork:Springer
engaged students in each of the knowledge integration processes resulted in greater student
learning than class discussions in which the teacher presented information shown in a
visualization (Zertuche, Gerard & Linn, NSF Annual Report).
Teachers’ improved strategies for teaching with visualizations had a significant effect on
their students’ understanding of complex Life Science topics like mitosis and inheritance
principles. We used pretests – delayed posttest comparisons to evaluate annual student learning
gains in the two professional development programs.
[Insert Table 2]
Teachers who participated in both professional development programs significantly improved
student understanding of mitosis and genetics from Baseline to Year 2. By the end of the second
year, students in all participating teachers’ classes made significant achievement gains from the
baseline Year 0 test, to the Year 2 delayed posttest on targeted mitosis and genetics KI
assessment items.
The MODELS teachers were more effective, helping their students to make more
significant gains in the first year and the second year. In order to show the magnitude of the
performance differences, we also presented the effect size in Cohen’s d (Figure 2). An effect size
larger than .80 is considered large, .50 to .80 medium, .20 to .50 small (Cohen, 1988). This
shows further support for intensive professional development on teaching with visualizations.
[Insert Figure 2]
NEXT STEPS
Evaluating Visualization Technologies
The data presented in this chapter highlight the key role professional development plays
in teaching practices and student science learning with visualizations. The teacher provided

Gerard,L.F.,Liu,O.,Corliss,S.B.,Varma,K.,Spitulnik,M.W.,&Linn,M.C.(inpress).Teachingwithvisualizations:Acomparisonstudy.InC.Mouza&N.Lavigne(Eds.)EmergingTechnologiesfortheClassroom:ALearningSciencesPerspective.NewYork:Springer
essential guidance to help students make predictions about the science phenomena in the
visualization, gather evidence from the visualization to distinguish among their many ideas about
the phenomena, and integrate their ideas to explain scientific processes. This stands in contrast to
a majority of visualization-tools available to educators today. Many of the visualization tools are
stand-alone, rather than embedded within curriculum projects involving scaffolding for inquiry,
and coupled with intensive teacher professional development. These visualization tools are less
likely to result in significant science learning as teachers have little if any guidance on how to
effectively incorporate the visualization into standards-aligned inquiry activities. Without aligned
assessments teachers have no record of student thinking to guide the design and refinement of
instruction. Without sustained professional development teachers have no time or access to
curriculum design and domain experts to help teachers cultivate, test and refine strategies for
guiding student learning with visualizations (Gerard et al., 2011). In short, our research suggests
that when purchasing technologies for a school(s), one should identify materials that embed
visualizations into tested inquiry activities, provide assessment tools, and have extensive high-
quality professional development opportunities for teachers.
Developing Strategies for Teaching with Visualizations
The data from our WISE programs suggests that visualizations can significantly improve
science teaching and learning when the professional development, curriculum and assessments
are aligned with the knowledge integration framework. Alignment allows researchers to
document the effects of professional development on student learning. Further, it supports the
notion of teaching as an evolving process in which practitioners become proficient by adjusting
practice according to collaborative reflection on student work and instructional practices, not
merely by repeating routines. The availability of the assessment data, detailing student learning
Gerard,Liu,Corliss,Varma,Spitulnik&Linn(inpress).Teachingwithvisualizations:Acomparisonstudy.InC.Mouza&N.Lavigne(Eds.)EmergingTechnologiesfortheClassroom:ALearningSciencesPerspective.NewYork:Springer
in relation to instruction is essential. Investing resources in intensive professional development
that supports teachers to analyze student work, reflect on teaching and assessment strategies, and
collaborate with colleagues, can improve students’ learning outcomes faster, and most
importantly, to a greater degree. The alternative and less costly option is to support teachers as
needed in the classroom to navigate the technologies and reflect on student work as they
implement new visualization tools in their classroom.
REFERENCES
Chang, H.-Y., Quintana, C. and Krajcik, J. S. (2010). The impact of designing and evaluating
molecular animations on how well middle school students understand the particulate
nature of matter. Science Education, 94, 73–94.
Chiu, J., & Linn, M. C. (in press). The Role of Self-Monitoring in Learning Chemistry with
Dynamic Visualization. In A. Zohar & Y. J. Dori (Eds.), Metacognition and Science
Education: Trends in Current Research. London, UK: Springer-Verlag.
Chiu, J. L. (2009, April 15). The Impact of Feedback on Student Learning and Monitoring with
Dynamic Visualizations. Paper presented at the annual meeting of the American
Educational Research Association, San Diego, CA.
Cohen, J., (1988). Statistical Power Analysis for the Behavioral Sciences (second ed.). New
Jersey: Lawrence Earlbaum Associates.
Dunbar, K. (1993). Concept Discovery in a Scientific Domain, Cognitive Science, 17, 397-434.
Fishman, B., Marx, R.W., Best, S., & Tal, R. (2003). Linking teacher and student learning to
improve professional development in systemic reform, Teaching and Teacher Education,
19(6), 643-658.

Gerard,L.F.,Liu,O.,Corliss,S.B.,Varma,K.,Spitulnik,M.W.,&Linn,M.C.(inpress).Teachingwithvisualizations:Acomparisonstudy.InC.Mouza&N.Lavigne(Eds.)EmergingTechnologiesfortheClassroom:ALearningSciencesPerspective.NewYork:Springer
Geir, R., Blumenfeld, P., Marx, R.W., Krajcik, J.S., Fishman, B., Soloway, E. & Chambers, J.
(2008). Standardized test outcomes for students engaged in inquiry-based science
curricula in the context of urban reform. Journal of Research in Science Teaching, 45(8),
922-939.
Gerard, L., Varma, K., Corliss, S., & Linn, M. C. (2011). Professional development in
technology-enhanced inquiry science. Review of Educational Research, 81(3), 408-448
Gerard, L.F., Bowyer, J.B., & Linn, M.C. (2010). A principal community: Building school
leadership for technology-enhanced science curriculum reform, Journal of School
Leadership, 20, 145-183.
Gerard, L.F., Spitulnik, M., & Linn, M.C. (2010). Teacher use of evidence to customize inquiry
science instruction, Journal of Research in Science Teaching, 47(9), 1037-1063.
Koedinger, K. R. & Aleven, V. (2007). Exploring the assistance dilemma in experiments with
Cognitive Tutors. Educational Psychology Review, 19 (3): 239-264.
Lee, H.-S., Linn, M. C., Varma, K., & Liu, O. L. (2010). How do technology-enhanced inquiry
science units impact classroom learning? Journal of Research in Science Teaching, 47(1),
71-90.
Linn, M. C., Davis, E. A., & Bell, P. (Eds.). (2004). Internet Environments for Science
Education. Mahwah, NJ: Lawrence Erlbaum Associates.
Linn, M. C., & Eylon, B. (2011). Science Learning and Instruction: Taking Advantage of
Technology to Promote Knowledge Integration. New York: Routledge.
Linn, M. C., & Hsi, S. (2000). Computers, Teachers, Peers: Science Learning Partners. Mahwah,
NJ: Lawrence Erlbaum Associates.
Gerard,Liu,Corliss,Varma,Spitulnik&Linn(inpress).Teachingwithvisualizations:Acomparisonstudy.InC.Mouza&N.Lavigne(Eds.)EmergingTechnologiesfortheClassroom:ALearningSciencesPerspective.NewYork:Springer
Linn, M. C., Lee, H. - S., Tinker, R., Husic, F., & Chiu, J. L. (2006). Teaching and Assessing
Knowledge Integration in Science. Science, 313, 1049–1050.
Liu, O.L., Lee, H-S, Linn, M.C. (2011). Multi-faceted assessments of inquiry based science
learning. Educational Assessment, 15, 69-86.
McElhaney, K.W. & Linn, M.C. (2011). Orchestrating Inquiry Using the Knowledge Integration
Framework. In K. Littleton, E. Scanlon, & M. Sharples (Eds.), Orchestrating Inquiry
Learning: Contemporary Perspectives on Supporting Scientific Inquiry Learning. New
York: Routledge.
McNeil, K.L. & Krajcik, J.S. (2008). Scientific explanations: Characterizing and evaluating the
effects of teachers' instructional practices on student learning. Journal of Research in
Science Teaching, 5(1), 53-78.
Rodrigues, S. (2006). Pedagogic practice integrating primary science and elearning: the need for
relevance, recognition, resource, reflection, readiness and risk. Technology, Pedagogy
and Education, 15(2), 175-189.
Sato, E. (2011). Developing Criteria for Explanations in Science: Scaffolding Peer Critique and
Feedback in Technology-Enhanced Instruction. American Educational Research
Association (AERA). New Orleans, LA.
Williams, M., Linn, M. C, Ammon, P., & Gearhart, M. (2004). Learning to Teach Inquiry
Science in a Technology-Based Environment: A Case Study. Journal of Science
Education and Technology, 13(2), 189–206.
Zhang, Z. & Linn, M. C. (in press). Can Generating Representations Enhance Learning with
Dynamic Visualizations? Journal of Research in Science Teaching.
TABLES
Gerard,L.F.,Liu,O.,Corliss,S.B.,Varma,K.,Spitulnik,M.W.,&Linn,M.C.(inpress).Teachingwithvisualizations:Acomparisonstudy.InC.Mouza&N.Lavigne(Eds.)EmergingTechnologiesfortheClassroom:ALearningSciencesPerspective.NewYork:Springer
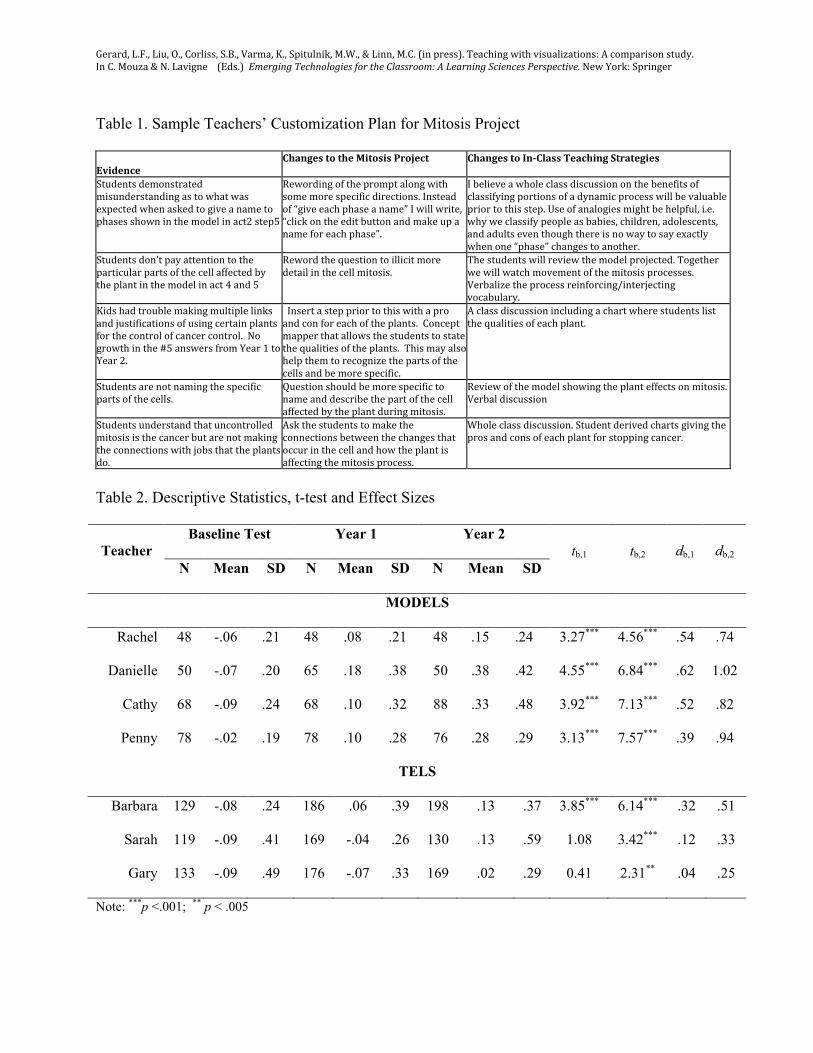
Table 1. Sample Teachers’ Customization Plan for Mitosis Project Evidence
ChangestotheMitosisProject ChangestoInClassTeachingStrategies
Studentsdemonstratedmisunderstandingastowhatwasexpectedwhenaskedtogiveanametophasesshowninthemodelinact2step5
Rewordingofthepromptalongwithsomemorespecificdirections.Insteadof“giveeachphaseaname”Iwillwrite,“clickontheeditbuttonandmakeupanameforeachphase”.
Ibelieveawholeclassdiscussiononthebenefitsofclassifyingportionsofadynamicprocesswillbevaluablepriortothisstep.Useofanalogiesmightbehelpful,i.e.whyweclassifypeopleasbabies,children,adolescents,andadultseventhoughthereisnowaytosayexactlywhenone“phase”changestoanother.
Studentsdon’tpayattentiontotheparticularpartsofthecellaffectedbytheplantinthemodelinact4and5
Rewordthequestiontoillicitmoredetailinthecellmitosis.
Thestudentswillreviewthemodelprojected.Togetherwewillwatchmovementofthemitosisprocesses.Verbalizetheprocessreinforcing/interjectingvocabulary.
Kidshadtroublemakingmultiplelinksandjustificationsofusingcertainplantsforthecontrolofcancercontrol.Nogrowthinthe#5answersfromYear1toYear2.
Insertasteppriortothiswithaproandconforeachoftheplants.Conceptmapperthatallowsthestudentstostatethequalitiesoftheplants.Thismayalsohelpthemtorecognizethepartsofthecellsandbemorespecific.
Aclassdiscussionincludingachartwherestudentslistthequalitiesofeachplant.
Studentsarenotnamingthespecificpartsofthecells.
Questionshouldbemorespecifictonameanddescribethepartofthecellaffectedbytheplantduringmitosis.
Reviewofthemodelshowingtheplanteffectsonmitosis.Verbaldiscussion
Studentsunderstandthatuncontrolledmitosisisthecancerbutarenotmakingtheconnectionswithjobsthattheplantsdo.
Askthestudentstomaketheconnectionsbetweenthechangesthatoccurinthecellandhowtheplantisaffectingthemitosisprocess.
Wholeclassdiscussion.Studentderivedchartsgivingtheprosandconsofeachplantforstoppingcancer.
Table 2. Descriptive Statistics, t-test and Effect Sizes
Baseline Test Year 1 Year 2 Teacher
N Mean SD N Mean SD N Mean SD tb,1 tb,2 db,1 db,2
MODELS
Rachel 48 -.06 .21 48 .08 .21 48 .15 .24 3.27*** 4.56*** .54 .74
Danielle 50 -.07 .20 65 .18 .38 50 .38 .42 4.55*** 6.84*** .62 1.02
Cathy 68 -.09 .24 68 .10 .32 88 .33 .48 3.92*** 7.13*** .52 .82
Penny 78 -.02 .19 78 .10 .28 76 .28 .29 3.13*** 7.57*** .39 .94
TELS
Barbara 129 -.08 .24 186 .06 .39 198 .13 .37 3.85*** 6.14*** .32 .51
Sarah 119 -.09 .41 169 -.04 .26 130 .13 .59 1.08 3.42*** .12 .33
Gary 133 -.09 .49 176 -.07 .33 169 .02 .29 0.41 2.31** .04 .25
Note: ***p <.001; ** p < .005

Gerard,Liu,Corliss,Varma,Spitulnik&Linn(inpress).Teachingwithvisualizations:Acomparisonstudy.InC.Mouza&N.Lavigne(Eds.)EmergingTechnologiesfortheClassroom:ALearningSciencesPerspective.NewYork:Springer
The numbers under ‘mean’ are the mean ability estimate for students taught by each teacher. As described in the data analysis section, these estimates are put onto a logit scale from -3 to 3. The higher the estimate, the more able the student is. tb,1 stands for the t-test value between the baseline and Year 1 data. Similarly for tb,2 d = effect size, calculated by the dividing the mean difference between the baseline and post tests by pooled standard deviation. db,1 stands for the effect size of the difference between the baseline and Year 1 data. Similarly for db,2
FIGURES
Figure 1. A Step in the WISE Mitosis Project
Inquiry Embedded Note Visualization Hint Map

Gerard,L.F.,Liu,O.,Corliss,S.B.,Varma,K.,Spitulnik,M.W.,&Linn,M.C.(inpress).Teachingwithvisualizations:Acomparisonstudy.InC.Mouza&N.Lavigne(Eds.)EmergingTechnologiesfortheClassroom:ALearningSciencesPerspective.NewYork:Springer
Figure 2. Effect Size of Baseline to Year 1 and Baseline to Year 2 Performance
0.540.62
0.52
0.390.32
0.120.04
0.74
1.02
0.82
0.94
0.51
0.33
0.25
0.00
0.20
0.40
0.60
0.80
1.00
1.20
Rachel(MODELS)
Danielle(MODELS)
Cathy(MODELS)
Penny(MODELS)
Barbara(TELS)
Sarah(TELS)
Gary(TELS)
BaselinetoYear1EffectSize BaselinetoYear2EffectSize