Embed Size (px)
Citation preview

Teaching Secondary Mathematics
Module 7Learning through investigation: Focus on chance and variability 7

Published by the Student Learning Programs Division
Office for Government School Education
Department of Education and Early Childhood Development
Melbourne
© State of Victoria 2008
The copyright in this document is owned by the State of Victoria. No part may be reproduced by any process
except in accordance with the provisions of the Copyright Act 1968, NEALS (see below) or with permission.
An educational institution situated in Australia which is not conducted for profit, or a body
responsible for administering such an institution, may copy and communicate the materials, other
than third-party materials, for the educational purposes of the institution.
Authorised by the Department of Education and Early Childhood Development, 2 Treasury Place, East Melbourne,
Victoria 3002.
Also published on http://www.education.vic.gov.au

Module 7 Learning through investigation: Focus on chance and variability | iii
Contents
Introduction to Module 7: Learning through investigation: Focus on chance and variability 1
Web connections 2
Content of the module 2
Organisation of the module 2
Required resources 3
Icons 3
User’s Guide to Module 7: Learning through investigation: Focus on chance and variability 4
Outline of this module 4
Links to Departmental resources 4
Variability: intuitive ideas and experience 5
Digilearn spinner 6
Knowing your students – diagnostic task 7
The Continuum – Short-run variation and long-run stability: 5.0 10
Teaching strategies and goals – Using ICT 14
Principles of Learning and Teaching P–12 16
Conclusion 17
Resource 1: Principles of Learning and Teaching P–12 18

Module 7 Learning through investigation: Focus on chance and variability | 1
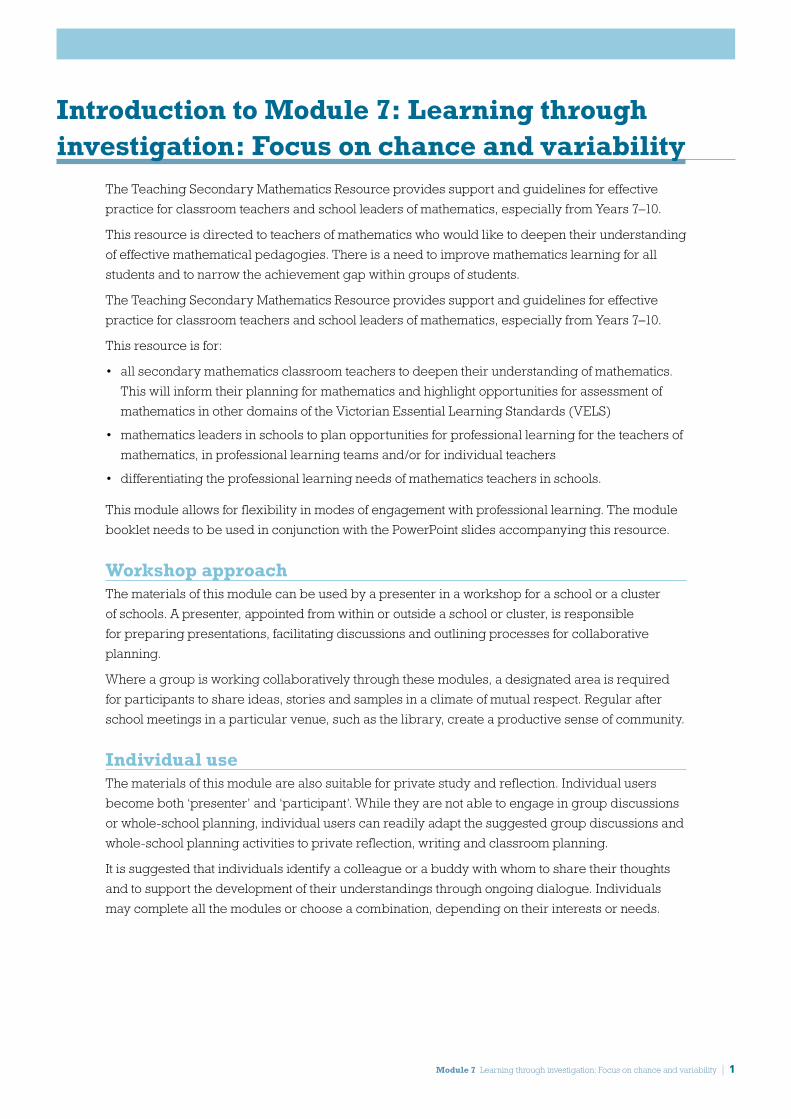
The Teaching Secondary Mathematics Resource provides support and guidelines for effective
practice for classroom teachers and school leaders of mathematics, especially from Years 7–10.
This resource is directed to teachers of mathematics who would like to deepen their understanding
of effective mathematical pedagogies. There is a need to improve mathematics learning for all
students and to narrow the achievement gap within groups of students.
The Teaching Secondary Mathematics Resource provides support and guidelines for effective
practice for classroom teachers and school leaders of mathematics, especially from Years 7–10.
This resource is for:
• allsecondarymathematicsclassroomteacherstodeepentheirunderstandingofmathematics.
This will inform their planning for mathematics and highlight opportunities for assessment of
mathematics in other domains of the Victorian Essential Learning Standards (VELS)
• mathematicsleadersinschoolstoplanopportunitiesforprofessionallearningfortheteachersof
mathematics, in professional learning teams and/or for individual teachers
• differentiatingtheprofessionallearningneedsofmathematicsteachersinschools.
This module allows for flexibility in modes of engagement with professional learning. The module
booklet needs to be used in conjunction with the PowerPoint slides accompanying this resource.
Workshop approachThe materials of this module can be used by a presenter in a workshop for a school or a cluster
of schools. A presenter, appointed from within or outside a school or cluster, is responsible
for preparing presentations, facilitating discussions and outlining processes for collaborative
planning.
Where a group is working collaboratively through these modules, a designated area is required
for participants to share ideas, stories and samples in a climate of mutual respect. Regular after
school meetings in a particular venue, such as the library, create a productive sense of community.
Individual useThe materials of this module are also suitable for private study and reflection. Individual users
become both ‘presenter’ and ‘participant’. While they are not able to engage in group discussions
or whole-school planning, individual users can readily adapt the suggested group discussions and
whole-school planning activities to private reflection, writing and classroom planning.
It is suggested that individuals identify a colleague or a buddy with whom to share their thoughts
and to support the development of their understandings through ongoing dialogue. Individuals
may complete all the modules or choose a combination, depending on their interests or needs.
Introduction to Module 7: Learning throughinvestigation: Focus on chance and variability

2 | Module 7 Learning through investigation: Focus on chance and variability
Web connectionsThe ‘Teaching for Secondary Mathematics’ resource is located at http://www.education.vic.gov.au/
studentlearning/teachingresources/maths/teachsec/default.htm.
Before commencing to plan any elements of the program, schools are strongly advised to visit
the Mathematics Domain page to review the most up-to-date advice, resources and information
relevant to each module of the program. Many elements of this resource are available online in a
downloadable format. There are links to assist schools to locate relevant information.
• Mathematics Domain (http://www.education.vic.gov.au/studentlearning/teachingresources/
maths/default.htm)
See the website for further details about this additional information or contact the student learning
help desk on [email protected]
Content of the moduleThe module comprises Module 8 booklet and the accompanying slide presentations which can
be downloaded from http://www.education.vic.gov.au/studentlearning/teachingresources/maths/
teachsec/module7.htm
The following are included in this document:
• the User’s Guide that assists the user through the professional learning program
• hardcopiesoftheslide presentations and resource sheets
• selected resources.
Organisation of the moduleComputer access is required for all modules. If a group is completing the modules, a data
projector and tables that enable people to sit together and work collaboratively are also necessary.
The presenter should encourage participants to raise questions throughout the ensuing
presentation. This presentation should take approximately one hour, depending on the depth of
discussion and types of activities that facilitators incorporate.

Module 7 Learning through investigation: Focus on chance and variability | 3
Required resourcesIndicators of Progress
• Indicator of Progress: Short-run variation and long-run stability: 5.0
(http://www.education.vic.gov.au/studentlearning/teachingresources/maths/mathscontinuum/
mcd/M50007P.htm)
• Mathematics Development Continuum – Mapping the Indicators of Progress
(http://www.eduweb.vic.gov.au/edulibrary/public/teachlearn/student/mathscontinuum/
indicatorsgrid.pdf)
Developmental Overviews
• Chance
(http://www.eduweb.vic.gov.au/edulibrary/public/teachlearn/student/mathscontinuum/
mcdochance.pdf)
• Data
(http://www.eduweb.vic.gov.au/edulibrary/public/teachlearn/student/mathscontinuum/
mcdodata.pdf)
DigiLearn objects
• Dice Duels
(https://www.eduweb.vic.gov.au/dlrcontent/4c33363731/index.html)
• Coin Tossing
(https://www.eduweb.vic.gov.au/dlrcontent/4c33353135/ec_002_utah_014/index.html)
• Spinners
(https://www.eduweb.vic.gov.au/dlrcontent/4c33353436/ec_002_utah_045/index.html)
Spreadsheet simulations
• Short run variability
(http://www.eduweb.vic.gov.au/edulibrary/public/teachlearn/student/mathscontinuum/
mod7cointoss.xls)
• Long run variability
(https://www.eduweb.vic.gov.au/edulibrary/public/teachlearn/student/mathscontinuum/
M50007sv.xls)
IconsThe following icons have been used in this workshop program:
Distribute handout:
Group discussion:
Group activity:

4 | Module 7 Learning through investigation: Focus on chance and variability
Dice Duels Coin Tossing
Slide 3; Dice Duels Coin Tossing
Side 2: Outline of module 7
Slide 1: Title slide
User’s Guide to Module 7: Learning throughinvestigation: Focus on chance and variability
Slide 1 is the title slide.
Module 7 is specifically about teaching mathematics through investigations within
the context of ‘Chance and variability’. The main mathematical objective is for
students to develop a conceptual understanding of short-run variation and long-run
stability.
There are two themes running concurrently in this module:
• howtogivestudentstheopportunitytolearnthroughinvestigation
(mathematical theme: Learning through investigation)
• howtoprovidethemwiththeopportunitytogainabetterconceptual
understanding of chance and variability (pedagogical theme: Chance and
variability).
Participants should be reminded that their students should be provided with the
opportunity to link their own life experiences with their learning of mathematics.
Connecting mathematics learning in schools with the student’s own experiences
will support each student’s growth as a community member as well as raise their
achievement in mathematics.
The activities are located in the Mathematics Developmental Continuum P–10,
Measurement, chance and data 5.0, indicator of progress: Short-run variation and
long-run stability: 5.0 found on:
• Mathematics Developmental Continuum P–10 (http://www.education.vic.gov.
au/studentlearning/teachingresources/maths/mathscontinuum/mcd/M50007P.
htm)
Outline of this moduleSlide 2 gives an outline of this module. The module includes:
• LinkstoDepartmentresources
• Variabilityintuitiveideasandexperience
• Digilearn–Spinners
• Continuum–Short-runvariationandlong-runstability:5.0
• TeachingStrategies
• usingICT
• investigations
• LinkstoPrinciplesofLearningandTeachingP–10
Links to Departmental resourcesSlide 3 illustrates how participants could improve student learning in variation
through accessing activities from:
• Mathematics Developmental Continuum P–10 (http://www.education.vic.gov.au/
studentlearning/teachingresources/maths/mathscontinuum/default.htm)
• Digilearn animations – DigiLearn provides effective demonstration animations.
Inparticulartheseactivitiesallowtheusertovaryandbiastheprobabilities.
(http://www.education.vic.gov.au/studentlearning/teachingresources/
elearning/digilearn.htm).

Module 7 Learning through investigation: Focus on chance and variability | 5
Slide 5: Variability: intuitive ideas and
experience
Slide 4: Variability: intuitive ideas and
experience
Variability: intuitive ideas and experienceSlide 4 invites participants to discuss three questions. The aim of these questions
is to link teachers’ current understanding of variability with students’ previous
experience outside the mathematics classroom.
Use slide 4: Variability – intuitive ideas and experience
The questions are:
• Wheredostudentsencountervariability?
• Whatexperiencesandideasdotheybringtotheclassroom?
• Whatwordsdoweusewhenwediscussvariabilityinmathematics?
The following information may support discussion with participants.
Variabilityasatermcausessomeconfusion.Ithasonlyrecentlybeenusedwithin
the context of mathematics. Teachers are encouraged to incorporate students’
prior experiences in discussing chance and probability in class. Teachers could
illustrate variability with the use of photographs. Students experience variability
in a variety of contexts including probability. This typically occurs when they play
games. Examples include board games, such as ‘Monopoly’.
Participants may confuse variablitlity with variation. The term variation is used in
relation to direct and indirect variation, i.e. y=kx.
Teachers may have used the following words when discussing variability in the
mathematics classroom:
• likely
• chance
• predict
• outcome
• probability
• frequency.
Short term experienceSlide 5 illustrates an example to show how easily students could draw conclusions
from short term experience.
Surprise snow in Ballarat
Short term experience – snowed twice in two days – reinforces people’s perception
that Ballarat is a cold place. But long term experience is significant – this event has
only occurred 5–6 times in 30 years.

6 | Module 7 Learning through investigation: Focus on chance and variability
http://
Many gamblers believe that you
can beat the odds and win, if
you know the right strategy.
(ABC news)
Slide 8: Digilearn spinner
Slide 7: Variability: intuitive ideas and
experience — Does the house always win in
Sin City?
Slide 6: Variability: intuitive ideas and
experience — Does the house always win in
Sin City?
Does the house always win in Sin City?Slides 6 and 7 illustrate an online article concerning gambling, which comments
on the way gamblers create myths based on their misconceptions about probability.
Use slides 5, 6, 7: Real world experiences of variation
Invite participants to discuss whether there are any other applications of variability found in the real-world context.
Digilearn spinnerSlide 8 is an animated slide demonstrating a diagram of the Digilearn spinner
resource. The spinner can be modified, allowing students to create a spinner to suit
their particular needs. The resource records the results of the spin.
• Spinner
(https://www.eduweb.vic.gov.au/dlrcontent/4c33353436/ec_002_utah_045/
index.html)

Module 7 Learning through investigation: Focus on chance and variability | 7
From Continuum – MCD - 5.0 - Illustration 1
Slide 11: The Mathematics Developmental
Continuum
Slide 10: The Mathematics Developmental
Continuum
Slide 9: The Mathematics Developmental
Continuum
Knowing your students – diagnostic taskThe activity on slides 9, 10 and 11 will provide an opportunity for participants to
discuss a diagnostic task. The question below is posed on slide 9. This task was
taken from:
• Mathematics Developmental Continuum – Short-run variation and long-
run stability: 5.0 (http://www.education.vic.gov.au/studentlearning/
teachingresources/maths/mathscontinuum/mcd/M50007P.htm)
Background information
An important step in developing student conceptual knowledge about variation is
that they know how random processes exhibit short-run variation and they also
exhibit long-run stability.
They understand that if they roll a fair die 10 times then the proportion of sixes is
hard to predict, but if they roll it 10000 times, the relative frequency is highly likely
to be very close to 1/6, the theoretical probability.
Inthisway,therelativefrequencygivestheexperimental(empirical)probability,
which approximates the theoretical probability.
Use slides 9–11: Diagnostic task
Invite participants to answer each question, shown one at a time on slide 10.
• Afaircoinistossed.Whichoutcomeismorelikely,oraretheyequallylikely?
Inviteparticipantstodiscussthefourpossibilitiesonslide10.
Ask the participants to respond and give reasons for their answers.
Slide 10 is animated, which will allow the participants the opportunity to answer the
highlighted question.
The correct responses are highlighted in green on slide 11.
Invite participants to respond to the next two questions:
• Whyarethewronganswersappealing?
• Whatmisconceptionsdostudentsbringintotheclassroom?

8 | Module 7 Learning through investigation: Focus on chance and variability
Background information
The following information may provide participants with some insights about how
students think about the concepts in underpinning variation.
One of the difficult things for students is that they need to keep track of what is
being considered:
1. First there is an individual coin toss (which can come up either heads or tails).
2. A set of 10 (or 1000) coin tosses then make up a trial (which has an outcome of a
certain number of heads and tails).
3. Finally, they need to imagine what kinds of outcomes are going to happen more
oftenthanothers(e.g.,aretheymorelikelytoget6headsor2heads?).This
means they have to imagine running lots of trials of 10 (or 1000) coin tosses.
Students need to be able to picture all of this in order to make comparisons
betweenthe10cointossandthe1000cointosssituation.Inadditiontheyneed
to have an understanding of the long-term predictability of coin-tossing (we
expect the coin to come up heads about half of the time) as well as the short-term
variability of coin-tossing (we cannot predict what it will actually do next).
Exactly 5 heads in 10 coin-tosses vs Exactly 500 heads in 1000 coin-tosses
Part (a) will be answered incorrectly by students who over-estimate the
predictability of individual events and also by students who have a shallow
understanding of the short-run variability and long-run predictability.
For example, students know from their experience that the probability of tossing a
head is a half and believe that in a long run experiment this exact value will arise,
i.e.,theyexpect500headsfor1000cointosses.Inasense,theirunderstandingof
long-term predictability dominates any idea of short-term variation. They also do
not immediately appreciate how close proportions like 1000 or even 1000 are to 12.
This indicates that their conceptual understanding is quite shallow.
Parts (b) and (c) are designed to identify those students who appreciate the
importance of the relative frequency, not just frequency of outcomes.
4, 5 or 6 heads in 10 coin-tosses vs 499, 500 or 501 heads in 1000 coin-tosses
Students may answer part (b) incorrectly if they know that there is long-run
predictability (about a half will be heads) but they think about this in absolute
terms,ratherthanrelativefrequency.Itismuchmorelikelytobewithin1of5(half
of 10) when tossing 10 times than to be within 1 of a 500 (half of 1000) when tossing
1000 times.
4, 5 or 6 heads in 10 coin-tosses vs between 400 and 600 heads in 1000 coin-tosses
Getting the correct answer in part (c) relies on understanding the long-term
predictability of coin-tossing, and that the proportion of heads gets closer to half the
more coin tosses are done. This means that when 1000 tosses are done the number
of heads is very likely to be close to 500, and almost certainly in the range of
400–600. Again, this can also be demonstrated with a spreadsheet. The short-term
variation phenomenon means that when only tossing the coin 10 times, the number
of heads may vary quite widely from 5.
501 520

Module 7 Learning through investigation: Focus on chance and variability | 9
Short-term variability
• AnExcelspreadsheetsimulationisavailable(Shortrunvariability).Itwillneed
to be downloaded on to the user’s computer before entering numbers.
(http://www.eduweb.vic.gov.au/edulibrary/public/teachlearn/student/
mathscontinuum/mod7cointoss.xls)
An important thing to realise here is that any trial of 10 coin tosses will have one
result for the number of heads, e.g., you may get 4 heads or on another trial you
may get 8 heads.
Let’s just consider getting exactly 4 heads out of 10 coin tosses. This has a
reasonable chance of occurring (use of the binomial distribution shows this to be
about 0.2). However, getting exactly 5 heads out of 10 coin tosses actually has a
different likelihood (about 0.25). Some students may just think that each possibility
is equally likely, when in fact they aren’t.
Relative probability
Now let’s consider the 1000 coin tossing experiment. This time, getting exactly
499 heads out of 1000 coin tosses is not very likely (the actual probability is about
0.025). Getting exactly 500 or 501 are similarly unlikely.
Note that some students may think that there are three outcomes in each case
(4, 5 and 6 for the 10 coin tossing case, and 499, 500, and 501 for the 1000 coin
tossing case). Some students may therefore conclude that the two situations are
equally likely.
Other students, in contrast, may think that the first case in part (b) has a probability
of 310 and the other has a probability of 1000, thus concluding – correctly, but for the
wrong reasons – that the first situation is more likely. However, students following
this line of reasoning will then get question (c) incorrect (by comparing 310 with 1000).
Knowing the exact probabilities helps students see that getting 4 or 5 or 6 heads
when tossing a coin 10 times is much more likely than getting exactly 499, 500 or
501 heads. This can be demonstrated with a spreadsheet simulation, or even by
doing some actual simulations in class (but perhaps only doing 100 coin tosses
instead of 1000).
• AnExcelspreadsheetsimulationisavailable(Longrunvariability).Itwillneed
to be downloaded on to the user’s computer before entering numbers.
(https://www.eduweb.vic.gov.au/edulibrary/public/teachlearn/student/
mathscontinuum/M50007sv.xls)
• Notethereisotherexcellentsimulationsoftwarebeingmadeavailableto
teachers during 2008. Check the Digilearn site, or the Mathematics Domain site.
3, 4, 5, 6 or 7 heads in 10 coin-tosses vs between 450 and 500 heads in 1000 coin-tosses
Part (d) further clarifies the long-run probability idea. Correct answers should
mention that the increasing number of tosses means that that the number of heads
is more likely to be about a half when there are more tosses.
Even though we seem to have widened the range of possible values for the 10
coin-toss situation, and narrowed the range for the 1000 coin-toss situation, the
long-term tendency to half means that the number of heads arising when a coin
is tossed 1000 times is extremely likely to be between 450 and 550. On the other
hand, short-term variation when tossing the coin only 10 times means that extreme
values like 0, 1, 2 or 8, 9, 10 are still quite likely to arise.
3
199

10 | Module 7 Learning through investigation: Focus on chance and variability
Slide 13: The Mathematics Developmental
Continuum — Small number of trials exhibit
great variation
Slide 12: The Mathematics Developmental
Continuum — Why use investigations in
mathematics?
Why use investigations in mathematics?Slide 12 provides the rationale for using investigations to enhance student learning.
Students’ capacity as learners is enhanced when they investigate questions.
Students will already be familiar with ideas of unpredictability of random processes
and possibly also with ideas of long-run predictability, but these are subtle ideas
which need development and discussion over some time.
The activities in the next set of slides are sequential, and employ the principles
that teaching about probability and random processes should be based on practical
experiences and that technology can be used to extend classroom experiences
from the hands-on base.
The Continuum – Short-run variation and long-run stability: 5.0
Small number of trials exhibit great variationSlide 13 describes an awareness-raising activity found on the continuum, providing
hands-on experience, and moving students towards the conceptual change of
considering rolling a die 12 times as one experiment (and not 12 experiments).
This activity is found on
• Mathematics Development Continuum – Short-run variation and long-
run stability: 5.0 (http://www.education.vic.gov.au/studentlearning/
teachingresources/maths/mathscontinuum/mcd/M50007P.htm)
Direct participants to the Excel spreadsheet:
• Excelspreadsheetsimulation.Itwillneedtobedownloadedontotheuser’s
computer before entering numbers.
(http://www.eduweb.vic.gov.au/edulibrary/public/teachlearn/student/
mathscontinuum/mod7cointoss.xls)
Use slide 13: Small number of trials exhibit great variation
Invite participants to complete the following task in groups and discuss results
Predict • Howmany3sin12rollsofadie?Maximumnumberof3s?Minimumnumberof3s?
Conduct experiment • Inpairs,rolladie12times(orroll12diceonce!).Recordthe number of times each face ‘comes up’.
Discuss • Variationinresults.Comparethenumberof3swiththepredicted number.
Calculate • Relativefrequencies(frequenciesdividedby12).
Discuss • Experimentalprobabilitiesobtainedandhowtheyvary.
• Whatthismeansinrealsituationse.g.playinggames,interpreting statistics in the media, etc.
• Alternativewaystorecordresults,theideaof12tossesin this case being viewed as one experiment or one event rather than a series of 12 experiments or events.

Module 7 Learning through investigation: Focus on chance and variability | 11
Slide 15: The Mathematics Developmental
Continuum — Exploration of 60 trials
Slide 14: The Mathematics Developmental
Continuum — Exploration of 60 trials
Exploration of 60 trials Use slides 14–16: Exploration of 60 trials
Slide14describestheactivity.Informparticipantsthattheyareassumingtherole
of a student.
This activity extends the previous activity by using a simulation of rolling a die sixty
times, which enables students to explore the variation in the relative frequencies
(experimental probabilities) with a larger number of trials. Participants need to
interpret both tabulated and graphical data to determine the variation in results for
this situation.
Direct participants to the Excel spreadsheet:
• Excelspreadsheetsimulation.Itwillneedtobedownloadedontotheuser’s
computer before entering numbers.
(https://www.eduweb.vic.gov.au/edulibrary/public/teachlearn/student/
mathscontinuum/M50007sv.xls)
Invite participants to complete the following task in groups and discuss results
Predict • Howmanyones,twos,threes,fours,fivesandsixestheywould they get if a die was tossed 60 times. (should be 10).
Conduct experiment • Askpairsofparticipantstorolladiesixtytimesandrecord the number of times each outcome appears.
• Writethefrequencyofeachoutcomeandconverttoitsrelative frequency (i.e. divide by 60).
Discuss • Thevariationintheresults.Forexample,didanyonegetexactlytenofeachoutcome?Didanyonenothaveanythrees,etc?Whatwasthehighestfrequencyforanoutcome?
• Linkingrelativefrequencyandexperimentalprobability:participants need to consider each set of 60 trials as one experiment, not as 60 experiments.

12 | Module 7 Learning through investigation: Focus on chance and variability
It is important that students see the links between real and virtual experiments!
Slide 17: The Mathematics Developmental
Continuum
Slide 16: The Mathematics Developmental
Continuum
Simulation
Slides 16 and 17 demonstrate how this activity can be completed through a
simulation.
Invite participants to use a random number generator spreadsheet to simulate 60 rolls of a die:
• Downloadrandom generator spreadsheet (Excel – 821Kb). The random number
generator updates an automatic graphical display. (http://www.eduweb.vic.gov.
au/edulibrary/public/teachlearn/student/mathscontinuum/M50007sv.xls).
• Complete60trialswiththerandomgenerator.Usethe60trialspageofthe
spreadsheet.
Each time the spreadsheet file opens, 60 rolls of a die are automatically generated.
Although the relevant frequencies are provided, ask the participants to calculate
the relative frequencies (experimental probabilities) and use the summary table
and graph to describe the situation for one group of 60 rolls. Two graphs for 60 rolls
are shown on slide 16.
Conduct experiment • Performmanytrialsusingthespreadsheet.
• Togenerateasimulationofrollingadie60times,holddownCTRLandpress‘=’.
Discuss • Howtheexperimentalprobabilitiesarecalculated.
• Thebiggestdifferencesinexperimentalprobabilitiesforasample of 60.
• Thevariabilityindifferentgroupsof60trials.
• Thebiggestdifferencesinexperimentalprobabilitiesforasample of 600.
• Thesizeoftheintervalontheverticalaxis.Theverticalaxis of the spreadsheet graph only goes up to 0.3 – was thereacasewhereitwasnotbigenough?
Predict • Arangethatyoumightexpectthesevalues(experimentalprobabilities) to lie within.
• Aretheseresultswhatyouexpected?
• Whatdoesthismeanforreallife?

Module 7 Learning through investigation: Focus on chance and variability | 13
Exploring long-run relative frequency, experimental and theoretical probability with a random generator
Slide 19: The Mathematics Developmental
Continuum
Slide 18: The Mathematics Developmental
Continuum
Exploring long-run relative frequency, experimental and theoretical probability
Use slides 18–21: Long run relative frequency
This activity uses slides 18–21 in a simulation activity. The activity is based on:
• Mathematics Development Continuum – Short-run variation and long-
run stability: 5.0 (http://www.education.vic.gov.au/studentlearning/
teachingresources/maths/mathscontinuum/mcd/M50007P.htm)
Exploring long-run relative frequency, experimental and theoretical probability
extends the exploration using technology for experiments consisting of 6000 trials,
conducted multiple times. Participants can directly compare the variability of
experimental probabilities from short-run and long-run experiments
Inthisactivityparticipantsusetherandomgeneratorspreadsheettoproduce
many results of many trials quickly to explore long term relative frequency and the
experimental probability.
• Download random generator spreadsheet (Excel – 821Kb). The random
number generator updates an automatic graphical display. [This is the same
spreadsheet used for the previous activity] (http://www.eduweb.vic.gov.au/
edulibrary/public/teachlearn/student/mathscontinuum/M50007sv.xls).
Experiment, explore: • resultsfromthrowingdice600times
• resultsfromthrowingdice6000times.
Observe, record: • resultsineachcase
• featuresofthegraphs.
Discuss: • howrelativefrequenciescomparewith12and60tosses
• howresultscomparewithprediction
• experimentalvstheoreticalprobability
• shortrunvslongrunstability.
Participants will observe how the variation in results for each experiment is larger
for experiments with a smaller number of trials. They will also observe that when
the number of trials is very large, the value of the experimental probability (long-
run relative frequency) is often very close to the theoretical probability.
Note the importance of proportional reasoning: with the larger trials there can
still be a big difference in absolute numbers between the theoretical and the
experimental results, but the point is that this is a small proportion.
Two graphs are illustrated on slide 18 comparing the relative frequencies for
experiments containing 600 and 6000 trials.
Refer also to Measurement, chance and data - How to use an Excel spreadsheet
to simulate tossing a die: 5.0 (http://www.education.vic.gov.au/studentlearning/
teachingresources/maths/mathscontinuum/mcd/M50007a.htm)
14 | Module 7 Learning through investigation: Focus on chance and variability
Slide 22: Teaching strategies and goals – Using
ICT
Slide 21: absolute difference between the long-
run relative frequencies and the theoretical
probability
Slide 20: Compare variability in short and long
runs
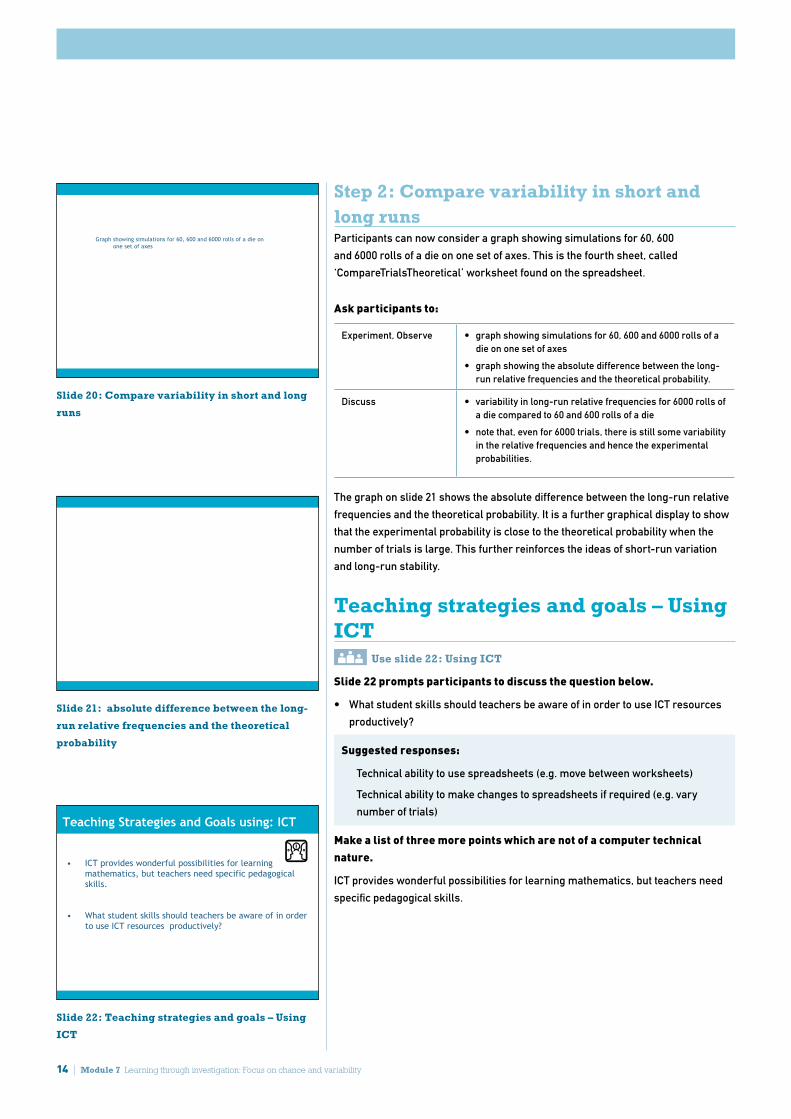
Step 2: Compare variability in short and long runsParticipants can now consider a graph showing simulations for 60, 600
and 6000 rolls of a die on one set of axes. This is the fourth sheet, called
‘CompareTrialsTheoretical’ worksheet found on the spreadsheet.
Ask participants to:
Experiment, Observe • graphshowingsimulationsfor60,600and6000rollsofadie on one set of axes
• graphshowingtheabsolutedifferencebetweenthelong-run relative frequencies and the theoretical probability.
Discuss • variabilityinlong-runrelativefrequenciesfor6000rollsofa die compared to 60 and 600 rolls of a die
• notethat,evenfor6000trials,thereisstillsomevariabilityin the relative frequencies and hence the experimental probabilities.
The graph on slide 21 shows the absolute difference between the long-run relative
frequenciesandthetheoreticalprobability.Itisafurthergraphicaldisplaytoshow
that the experimental probability is close to the theoretical probability when the
number of trials is large. This further reinforces the ideas of short-run variation
and long-run stability.
Teaching strategies and goals – Using ICT
Use slide 22: Using ICT
Slide 22 prompts participants to discuss the question below.
• WhatstudentskillsshouldteachersbeawareofinordertouseICTresources
productively?
Suggested responses:
Technical ability to use spreadsheets (e.g. move between worksheets)
Technical ability to make changes to spreadsheets if required (e.g. vary
number of trials)
Make a list of three more points which are not of a computer technical nature.
ICTprovideswonderfulpossibilitiesforlearningmathematics,butteachersneed
specific pedagogical skills.

Module 7 Learning through investigation: Focus on chance and variability | 15
Slide 23: ICT: Other Resources
Discuss the following issues with participants:
• Donotassumethatallstudentswillappreciatetherelevanceofthecomputer
graphics, which will certainly need careful attention.
• Donotassumethatstudentsautomaticallyunderstandwhatthecomputeris
doing or how the computer results link to the work they carried out beforehand.
• Makesurethatstudentsengageinmathematicalthinking,notjustplaying
with the computer or just going through the data collection motions. This is a
difficulty in all practical work – how to get depth in mathematical discussion, not
just collecting data.
• Thereareclassroommanagementissueswhentheclassworksinthe
computerlab.Aretheydoingthemaths,orsurfingtheinternet?
• Isitbettertousethisspreadsheetforawholeclassinvestigation,orfor
studentstoworkdirectlyonthecomputers,whetheraloneorinpairs?
Using ICT for teaching mathematical investigationsSlide 23 provides a brief list of other resources which support the learning of
mathematicsthroughtheuseofICT.
These are:
• Measurement, Chance & Data – A critical approach to summary statistics and
graphs: 4.75 – activities 2 and 3 deal with Chance and Data in the news
(http://www.education.vic.gov.au/studentlearning/teachingresources/maths/
mathscontinuum/mcd/M47509P.htm)
• WorkingMathematically–Carryingoutinvestigations:4.5 – activity 6 ‘Posing
questions from a data set’
(http://www.education.vic.gov.au/studentlearning/teachingresources/maths/
mathscontinuum/wmathly/W45003P.htm)
• Structure – Exponential functions: 5.5 – activity 3: ‘Exponential decay on a
guitar’ provides a ‘Guitar frets’ spreadsheet
(http://www.education.vic.gov.au/studentlearning/teachingresources/maths/
mathscontinuum/structure/St55002P.htm)
• Australian Bureau of Statistics
(http://www.abs.gov.au/)
• Choice (previously Australian Consumers’ Association)
(http://www.choice.com.au/)
Dynamic geometry files are also extremely valuable but cannot be accessed
through the Mathematics Domain page, so teachers should look elsewhere for
these. Many good files are on the internet.

16 | Module 7 Learning through investigation: Focus on chance and variability
Slide 25: Principles of Learning and Teaching
P–12
Slide 24: Principles of Learning and Teaching
P–12
Principles of Learning and Teaching P–12The experiments in this module are carried out with dice, but the implications go
far beyond playing games.
RefertoResource1:PrinciplesofLearningofTeachingP–10,alsoavailableonline.
Slide 24 reminds participants that the activities presented in this module offer a
rich resource for teachers to provide for:
• asupportiveandproductivelearningenvironmentthatpromotesstudents’self
confidence through the building of success (PoLT principle 1)
• acollaborativeclassroom(PoLTprinciple2)
• anenvironmentthatprovidesopportunitiesforstudentstolinktheirclassroom
experiences with their local and broader community (PoLT principle 6).
Use slides 24–25: Principles of Learning and Teaching P–12
Slide 25 invites participants to discuss how the activities link with:
• PoLTprinciple2:Thelearningenvironmentpromotesindependence,
interdependence and self-motivation.
• PoLTprinciple6:Learningconnectsstronglywithcommunitiesandpractice
beyond the classroom.
The investigation explored in this module requires students to:
• workcooperativelyinpairsby:
• recordingdata
• reportingfindings
• workcooperativelyasaclassthrough:
• sharingresults
• reportingfindings
• drawingconclusions
• directingtheirownwork.
InresponsetolinkingPoLTprinciple6(Learningconnectsstronglywith
communities and practice beyond the classroom), remind participants that
probabilities can help people analyse important information and make decisions
thataffecttheirlives.Inotherwords,probabilityisnotjust‘stuff’thathappensat
school!
Examples of probabilities affecting decisions in real life include the probabilities
that
• anoperationwillbesuccessful
• achildwillhaveageneticdisease
• aparticularstrategywillwininagameofchance
• acertainbehavioursuchassmokingwillleadtoabadoutcome.
These probabilities are generally obtained as ‘long run’ probabilities.

Module 7 Learning through investigation: Focus on chance and variability | 17
Slide 26: End of Module 7
Participants could:
• Discusswiththeirstudentshowtheanecdotalexperiencesofeverydaylifeoften
fall into the ‘short run’ category (all my grandparents smoke and none of them
have lung disease).
• Notethemodellingissues–aproperlythrowndiehasexactlyequal
probabilitiesofgettinganyofthenumbersoneveryoccasion.Inreallife,the
probabilities are not as clear as this, and will be affected by many other things,
however the basic findings of the experiment will still hold.
• Notethatthelongerthatpeopleplayagame(e.g.gamble)themorelikelyitis
that they will end up at the average outcomes.
• Notethatthingslike‘winningstreaks’arejustpartofthevariationobservedin
statistics.
ConclusionSlide 26 is the concluding slide to the module.
There are 8 more professional learning modules:
1. Overview of learning in the Mathematics Domain
2. Overview of the Mathematics Developmental Continuum P–10
3. Narrowing the achievement gap: Focus on fractions
4. Conducting practical and collaborative work: Focus on contours
5. Understandingstudents’mathematicalthinking:Focusonalgebraandthe
meaning of letters
6. Usingarangeofstrategiesandresources:Focusonpercentages
8. Workingmathematically:Focusonarangeofchallengingproblems
9. Conclusion: Planning for improvement in mathematics

18 | Module 7 Learning through investigation: Focus on chance and variability
Resource 1: Principles of Learning and Teaching P–12
• Principles of Learning and Teaching P–12 and their components (http://www.education.vic.gov.
au/studentlearning/teachingprinciples/principles/principlesandcomponents.htm)
Students learn best when:
The learning environment is supportive and productive. In learning environments that
reflect this principle the teacher:
1.1) builds positive relationships through knowing and valuing each student
1.2) promotes a culture of value and respect for individuals and their communities
1.3) uses strategies that promote students’ self-confidence and willingness to take risks with their
learning
1.4) ensures each student experiences success through structured support, the valuing of effort,
and recognition of their work.
The learning environment promotes independence, interdependence and self
motivation. In learning environments that reflect this principle the teacher:
2.1) encourages and supports students to take responsibility for their learning
2.2) uses strategies that build skills of productive collaboration.
Students’ needs, backgrounds, perspectives and interests are reflected in the learning
program. In learning environments that reflect this principle the teacher:
3.1) uses strategies that are flexible and responsive to the values, needs and interests of
individual students
3.2) uses a range of strategies that support the different ways of thinking and learning
3.3) builds on students’ prior experiences, knowledge and skills
3.4) capitalises on students’ experience of a technology rich world.
Students are challenged and supported to develop deep levels of thinking and
application. In learning environments that reflect this principle the teacher:
4.1) plans sequences to promote sustained learning that builds over time and emphasises
connections between ideas
4.2) promotes substantive discussion of ideas
4.3) emphasises the quality of learning with high expectations of achievement
4.4) uses strategies that challenge and support students to question and reflect
4.5) uses strategies to develop investigating and problem solving skills
4.6) uses strategies to foster imagination and creativity.

Module 7 Learning through investigation: Focus on chance and variability | 19
Assessment practices are an integral part of teaching and learning. In learning
environments that reflect this principle the teacher:
5.1) designs assessment practices that reflect the full range of learning program objectives
5.2) ensures that students receive frequent constructive feedback that supports further learning
5.3) makes assessment criteria explicit
5.4) uses assessment practices that encourage reflection and self assessment
5.5) uses evidence from assessment to inform planning and teaching.
Learning connects strongly with communities and practice beyond the classroom. In
learning environments that reflect this principle the teacher:
6.1) supports students to engage with contemporary knowledge and practice
6.2) plans for students to interact with local and broader communities and community practices
6.3) uses technologies in ways that reflect professional and community practices.