Embed Size (px)
Citation preview
Teaching Engineering Materials: the CES EduPack M. F. Ashby, D. Cebon
Engineering Department, Cambridge University, England
May 2007
Abstract
A design-led procedure for the teaching of materials and processes is described. It is based around the CES EduPack: a set of texts and software tools for teaching materials and manufacturing processes. The texts and tools explain material and process properties, develop the underlying science and allow design-led selection. A central element is a materials selection method that is systematic, building on the identification of constraints that the material or process must meet, and on the objectives that govern the design. The method is documented and demonstrated in the texts and is supported by extensive computer-based methods, tools and data. The underlying science is presented through links to explanatory text and developed further via an additional database documenting the properties of the elements of the Periodic Table.
1. Introduction
Engineers make things. They make them out of materials. What do they need to know to choose and use materials successfully? First, a perspective of the world of materials – the “menu” of metals, polymers, glasses, ceramics, composites and so forth – and of processes that can shape, join and finish them. Second, some understanding of the origin of these properties and of the ways that they can be manipulated. Third, they need methods for selecting from these menus the materials and processes that best meet the requirements of a design. Fourth, they need access to data for material attributes and – since the quantity of data is large and the methods tedious to implement by hand – computer-based tools to enable their implementation. And, of course, they need common sense: the ability to use experience and knowledge of the world at large to recognize inspired choices and to reject those that are impractical.
2. Material and process attributes
A material has attributes: its density, strength, cost, resistance to corrosion, and the like [1 - 4]. A design demands a certain profile of these: a low density, a high strength, a modest cost and resistance to sea water, perhaps. The task of selection is that of matching the choice of material to the requirements of the design [5 - 11].
Figure 1. The menu of engineering materials. The basic families of metals, ceramics, glasses, polymers and
elastomers can be combined in various geometries to create hybrids.
Material attributes
The starting point is the “universe” of materials. Figure 1 shows the material families: polymers, metals, ceramics, glasses, natural materials, and the hybrids that can be synthesized by combining these. Figure 2 expands this structure, suggesting a hierarchical organization of the population. Each family embraces classes, sub-classes and members; in this figure the family of metals is expanded to show the class of
1 MFA, 04/05/2007

Figure 2. A hierarchical structure for material classification, ending with a schematic of a record.
aluminum alloys and the sub-class of 6000-series aluminum alloys, containing many members (e.g. Al-6061). It, and every other member of the universe, is characterized by a set of attributes that include its mechanical, thermal, electrical, optical and chemical properties, its processing characteristics, its cost and availability, and the environmental consequences of its use. We call this its property profile.
Information about manufacturing processes can be organized in a similar way. Figure 3 shows part of the hierarchy. The Process universe has three families: shaping, joining and surface treatment. In this figure, the shaping family is expanded to show classes: casting, deformation, molding etc. One of these – molding – is again expanded to show its members: rotation molding, blow molding, injection molding and so forth. Each process is characterized by a set of attributes: the materials it can handle, the shapes it can make, their size, precision, and an economic batch size (the number of units that it can make most economically).
3. The selection strategy
Selection involves seeking the best match between the property profiles of the materials in the universe and that required by the design. The strategy for achieving this match is sketched in Figure 4. It connects with the literature on design [12-16].
Translation
The first task is that of translation: converting the design requirements into a prescription for selecting a material and a process to shape it. Any engineering component has one or more functions: to support a load, to contain a pressure, to transmit heat, and so forth. This must be achieved subject to constraints: that certain dimensions are fixed, that the component must carry the design loads without failure, that it insulates or conducts, that it can function in a certain range of temperature and in a given environment, and many more. In designing the component, the designer has one or more objectives: to make it as cheap as possible, perhaps, or as light, or as safe, or perhaps some combination of these. Certain parameters can be adjusted in order to optimize the objective – the designer is free to vary dimensions that are not constrained by design requirements and, most importantly, free to choose the material for the component. We refer to these as free variables. Function, constraints, objectives and free variables (Table 1) define the boundary conditions for selecting a material and – in the case of load-bearing components – a shape for its cross-section. The first step in relating design requirements to material properties is a clear statement of function, constraints, objectives and free variables.
Figure 3. A hierarchical structure for process classification, ending with a schematic of a record.
2 MFA, 04/05/2007
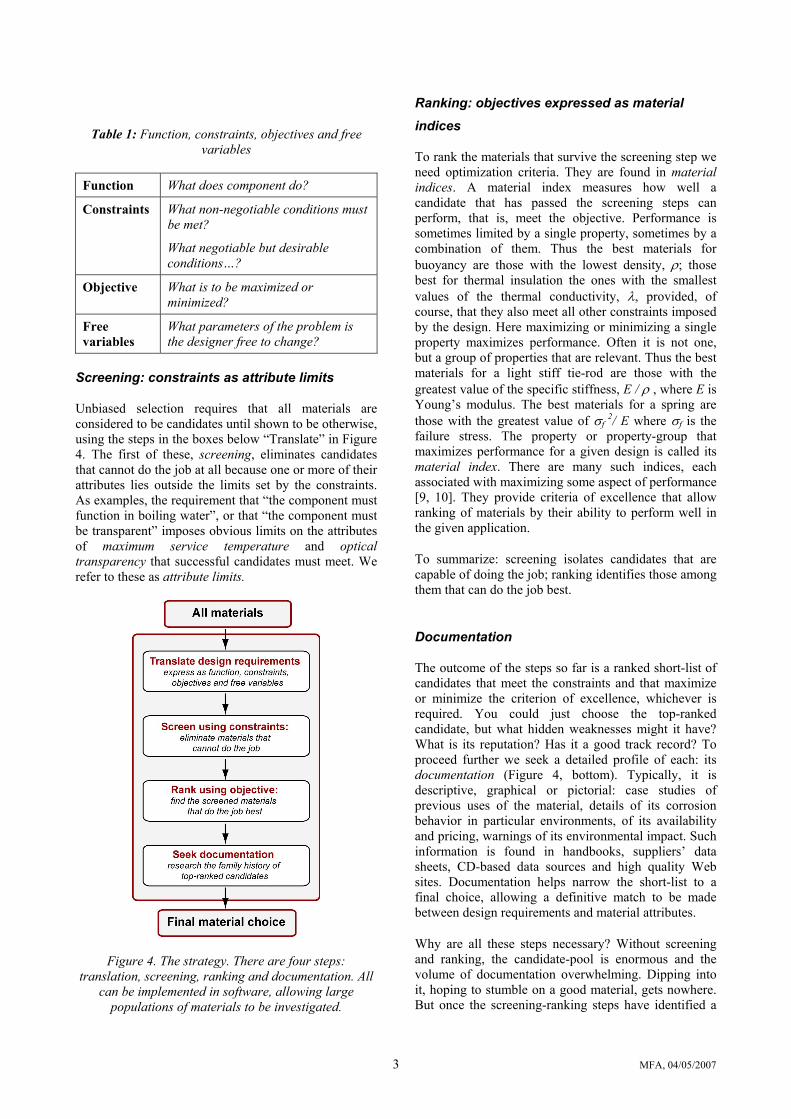
Table 1: Function, constraints, objectives and free variables
Function What does component do?
Constraints What non-negotiable conditions must be met?
What negotiable but desirable conditions…?
Objective What is to be maximized or minimized?
Free variables
What parameters of the problem is the designer free to change?
Screening: constraints as attribute limits
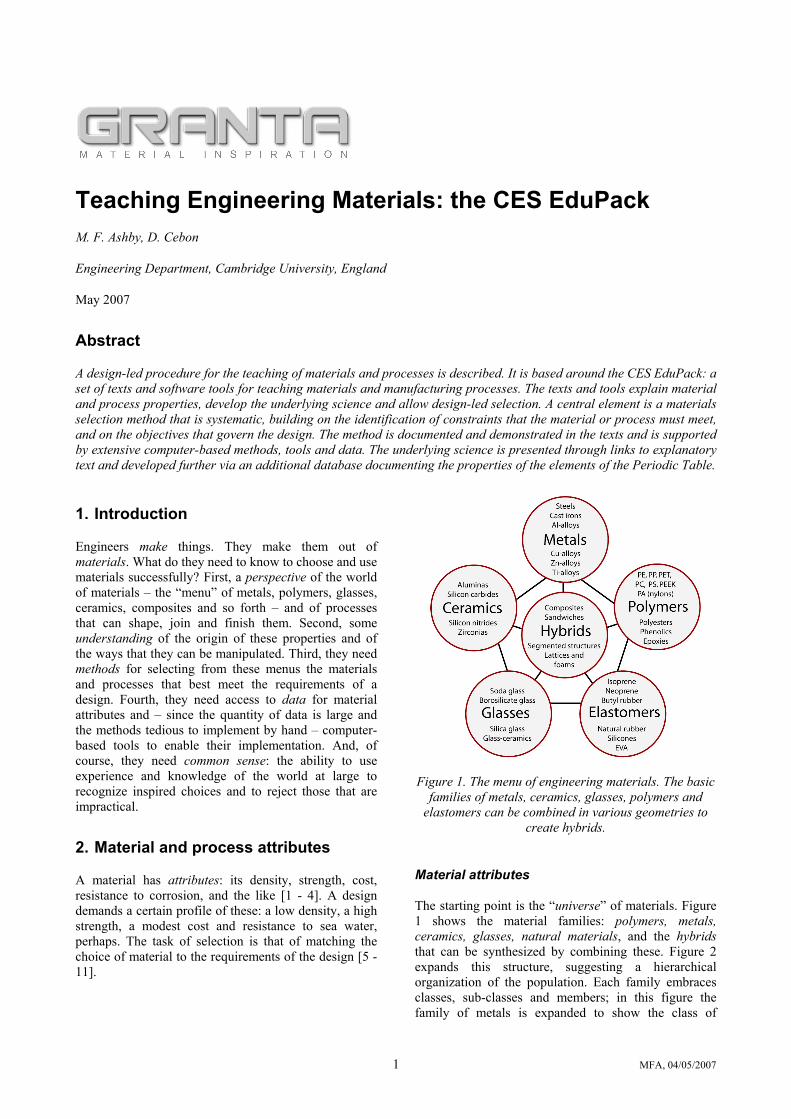
Unbiased selection requires that all materials are considered to be candidates until shown to be otherwise, using the steps in the boxes below “Translate” in Figure 4. The first of these, screening, eliminates candidates that cannot do the job at all because one or more of their attributes lies outside the limits set by the constraints. As examples, the requirement that “the component must function in boiling water”, or that “the component must be transparent” imposes obvious limits on the attributes of maximum service temperature and optical transparency that successful candidates must meet. We refer to these as attribute limits.
Figure 4. The strategy. There are four steps: translation, screening, ranking and documentation. All
can be implemented in software, allowing large populations of materials to be investigated.
Ranking: objectives expressed as material indices
To rank the materials that survive the screening step we need optimization criteria. They are found in material indices. A material index measures how well a candidate that has passed the screening steps can perform, that is, meet the objective. Performance is sometimes limited by a single property, sometimes by a combination of them. Thus the best materials for buoyancy are those with the lowest density, ρ; those best for thermal insulation the ones with the smallest values of the thermal conductivity, λ, provided, of course, that they also meet all other constraints imposed by the design. Here maximizing or minimizing a single property maximizes performance. Often it is not one, but a group of properties that are relevant. Thus the best materials for a light stiff tie-rod are those with the greatest value of the specific stiffness, E / ρ , where E is Young’s modulus. The best materials for a spring are those with the greatest value of σf
2/ E where σf is the failure stress. The property or property-group that maximizes performance for a given design is called its material index. There are many such indices, each associated with maximizing some aspect of performance [9, 10]. They provide criteria of excellence that allow ranking of materials by their ability to perform well in the given application.
To summarize: screening isolates candidates that are capable of doing the job; ranking identifies those among them that can do the job best.
Documentation
The outcome of the steps so far is a ranked short-list of candidates that meet the constraints and that maximize or minimize the criterion of excellence, whichever is required. You could just choose the top-ranked candidate, but what hidden weaknesses might it have? What is its reputation? Has it a good track record? To proceed further we seek a detailed profile of each: its documentation (Figure 4, bottom). Typically, it is descriptive, graphical or pictorial: case studies of previous uses of the material, details of its corrosion behavior in particular environments, of its availability and pricing, warnings of its environmental impact. Such information is found in handbooks, suppliers’ data sheets, CD-based data sources and high quality Web sites. Documentation helps narrow the short-list to a final choice, allowing a definitive match to be made between design requirements and material attributes.
Why are all these steps necessary? Without screening and ranking, the candidate-pool is enormous and the volume of documentation overwhelming. Dipping into it, hoping to stumble on a good material, gets nowhere. But once the screening-ranking steps have identified a
3 MFA, 04/05/2007

small number of potential candidates, detailed documentation can be sought for these few alone, making the task viable.
4. Implementation: methods and tools
We now have a strategy. How best to implement it? Figures 5 to 7 illustrate some aspects of a method that we have found to work well. More details can be found in [9, 10]. The first, Figure 5, shows one material property (here the elastic modulus, E) plotted against
another (the density, ρ) on logarithmic scales. The range of the axes is chosen to include all materials, from the lightest, flimsiest foams to the stiffest, heaviest metals. It is then found that data for a given family of materials (polymers for example) cluster together on the chart; the sub-range associated with one material family is, in all cases, much smaller than the full range of that property. Data for one family can be enclosed in a family-envelope, as the figure shows. Within it lie bubbles enclosing classes and sub-classes.
Figure 6 shows a second example, here two thermal properties – thermal expansion, α, and thermal conductivity, λ. As in Figure 5, members of a given family cluster in a small area of the chart: ceramics and metals to the right, with low expansion and high
conductivity; polymers and elastomers in the upper left, with ten times the expansion and only 1% of the conductivity of the first two. Electrical properties can be mapped in a similar way: Figure 7 shows the electrical resistivity and the thermal conductivity. The chart makes it clear that, for metals at least, the two are closely correlated.
Charts like these, available for all the usual material properties [9, 10], give a perspective of the world of materials. The charts locate the families in material-property space, revealing the areas that are occupied and
(importantly) those that are not. By building the materials attributes into a database and addressing this with appropriate search and graphical software, charts can be plotted at will, choosing any pair of properties.
Figure 5. A chart of Young’s modulus and density for materials created using the CES EduPack 2007 software with the Level 2 database.
Already the student has something useful for engineering design. A design requires a material that is light and stiff – Figure 5 guides the choice. A material with low thermal expansion or expansion that matches another material? Figure 6 suggests answers. A material that conducts heat well but is an electrical insulator? Figure 7 provides candidates. The charts put material properties in perspective: metals are 20 to 100 times stiffer than polymers and conduct heat 100 times faster. Elastomers have enormous expansion coefficients but are excellent electrical insulators. This “order of
4 MFA, 04/05/2007

Figure 6. A chart of thermal conductivity and thermal expansion for materials created using the CES EduPack 2007 software with the Level 2 database.
Figure 7. A chart of thermal conductivity and electrical resistivity for materials created using the CES EduPack 2007 software with the Level 2 database.
magnitude” familiarity is useful; much engineering design, even today, is intuitive, but the intuition is informed by just this sort of familiarity.
And the charts lead naturally to another set of questions. Why do the members of each material class cluster in the way they do? What determines where the clusters lie
5 MFA, 04/05/2007

on the charts? Why are some material properties so obviously correlated? These questions are a natural lead-in (and one the engineering student sees as relevant) to the underlying science of the material classes – the atomic bonding and packing determining density, melting point and stiffness; the defect structure determining hardness, strength, toughness; the transport properties and the magnetic behavior. The materials texts cited as references [1] – [11] provide this information.
Student interest is stimulated by encouragement to use these charts to explore the materials world. But as understanding progresses, more detail is needed. It is here that software can help, allowing the student to create charts with any desired combination of properties, to zoom in on any chosen part to increase resolution, and to access records for the attributes of individual materials. Figures 5, 6 and 7 were created using one such software package [17] specifically designed for education. It is described next.
5. Introducing CES EduPack
The CES EduPack™ software provides an extensive database of material and process information. It offers tools to apply this information in selecting materials and processes to meet complex design requirements. And it helps students to explore and learn the underlying science. Figure 8 shows part of a material record – that
for ABS – contained in the CES EduPack 2007 software. It starts with a description of the material and an image of a familiar object made from it – a way of conveying information relevant for industrial design. That is followed by a table of material properties, a list of typical uses, and, in a higher level of the software, design guidelines, technical notes and notes concerning its impact on the environment. Finally, each material record is linked to appropriate members of a parallel database of manufacturing processes: those that can shape, join, finish and decorate it. Figure 9 is part of one of the shaping records linked to ABS – it lists information for injection molding. It, in turn, is linked to all materials that can be injection molded. Each field name is linked to text files, known as science notes, that give a definition, a description of how it is measured and explanation of its origins (Figure 10).
The software has three levels of data so that it evolves with the needs of the student. Level 1 contains limited data for 66 of the most widely used materials, drawn from the six families of Figure 1. A record, of which Figure 8 is a part, starts with a brief description of the material and its history, illustrated with an image of a familiar product in which it is used. Numeric data follow for the most basic mechanical, thermal, electrical and optical properties. A material record ends with a list of its common applications. Manufacturing processes for shaping, joining and finishing, 75 of them in all, are treated in a similar, simple way: a description, a schematic illustrating how the process works, a brief list
Typical uses
General properties
Mechanical properties Thermal properties
Electrical properties
Safety helmets; camper tops; automotive instrument panels and other interior components; pipe fittings; home-security devices and housings for small appliances; communications equipment; business machines; plumbing hardware; automobile grilles; wheel covers; mirror housings; refrigerator liners; luggage shells; tote trays; mower shrouds; boat hulls; large components for recreationalvehicles; weather seals; glass beading; refrigerator breaker strips; conduit; pipe for drain-waste-vent (DWV) systems.
Density 1e3 - 1.2e3 kg/m3
Price 2 - 2.7 USD/kg
Young's modulus 1.1 - 2.9 GPa Hardness - Vickers 5.6 - 15 HV Elastic limit 19 - 51 MPa Tensile strength 28 - 55 MPa Compressive strength 31 - 86 MPa Elongation 1.5 - 1e2 % Endurance limit 11 - 22 MPa Fracture toughness 1.2 - 4.3 MPa.m1/2
Thermal conductivity 0.19 - 0.34 W/m.K Thermal expansion 85 - 230 µstrain/°C Specific heat 1400 - 1900 J/kg.K Glass Temperature 88 - 130 °C Max service temp. 62 - 90 °C
Resistivity 2.3e21 - 3e22 µohm.cm Dielectric constant 2.8 - 2.2
Acrylonitrile butadiene styrene (ABS) The Material ABS (Acrylonitrile-butadiene-styrene) is tough, resilient, and easily molded. Itis usually opaque, although some grades can now be transparent, and it can be given vivid colors. ABS-PVC alloys are tougher than standard ABS and, in self-extinguishing grades, are used for the casings of power tools.
Figure 8. Part of a record for a material, ABS. It contains numeric data, text and image-based information.
6 MFA, 04/05/2007

Injection molding
of attributes and applications (see Figure 9). The Level 1 system allows the student to explore materials and processes without being overwhelmed by detail.
Level 2 retains this format, expanding the number of records (to 95 materials and 105 processes) and the detail of the data to include information on design, on
The process No other process has changed product design more than INJECTION MOULDING. Injection molded products appear in every sector of product design:consumer products, business, industrial, computers, communication, medical and research products, toys, cosmetic packaging and sports equipment. The most common equipment for molding thermoplastics is the reciprocating screw machine, shown schematically in the figure. Polymer granules are fed into a spiral press where they mix and soften to a dough-like consistency that can be forced through one or more channels ('sprues') into the die. The polymer solidifies under pressure and the component is then ejected. Physical Attributes
Economic Attributes
Shape
Typical uses
Mass range 1e-3 - 25 kg Range of section thickness 0.4 - 6.3 mm Surface roughness (A=v. smooth) A
Economic batch size (units) 1e4 - 1e6 Relative tooling cost very high Relative equipment cost high Labor intensity low
Circular Prismatic True Non-circular Prismatic True Solid 3-D True Hollow 3-D True
Extremely varied. Housings, containers, covers, knobs, tool handles, plumbing fittings, lenses, etc.
Figure 9. Part of a record for a process, injection molding. The image shows how it works, and the numeric and Boolean data and text document its attributes.
Figure 10. A schematic illustrating the way in which science notes providing definitions, measurement and the underlying scientific origin of each material and process attribute can be accessed from within a record.
General properties
Mechanical properties
-
20 %
Thermal properties
Electrical properties
Density 2500 - 2900 kg/m^3Price 2.3 - 2.86 USD/kg
Young's modulus 68 - 80 GPaYield strength (elastic limit) 95 610 MPaTensile strength 180 - 620 MPaElongation 1 -Fatigue strength at 10^7 cycles 57 - 210 MPaFracture toughness 21 - 35 MPa.m^1/2
Melting point 495 - 640 °CMaximum service temperature 120 - 200 °CThermal conductivity 118 - 174 W/m.KThermal expansion coefficient 22 - 24 µstrain/°C
Electrical resistivity 3.8 - 6 µohm.cm
Description.
Age-hardening wrought Al-alloys
The high-strength aluminum alloys rely on age-hardening: a sequence of heat treatment steps that causes the precipitation of a nano-scale dispersion ofintermetallics that impede dislocation motion and impart strength.
General properties
Mechanical properties
-
20 %
Thermal properties
Electrical properties
Density 2500 - 2900 kg/m^3Price 2.3 - 2.86 USD/kg
Young's modulus 68 - 80 GPaYield strength (elastic limit) 95 610 MPaTensile strength 180 - 620 MPaElongation 1 -Fatigue strength at 10^7 cycles 57 - 210 MPaFracture toughness 21 - 35 MPa.m^1/2
Melting point 495 - 640 °CMaximum service temperature 120 - 200 °CThermal conductivity 118 - 174 W/m.KThermal expansion coefficient 22 - 24 µstrain/°C
Electrical resistivity 3.8 - 6 µohm.cm
Description. The high-strength aluminum alloys rely on age-hardening: a sequence of heat treatment steps that causes the precipitation of a nano-scale dispersion ofintermetallics that impede dislocation motion and impart strength.
General properties
Mechanical properties
-
20 %
Thermal properties
Electrical properties
Density 2500 - 2900 kg/m^3Price 2.3 - 2.86 USD/kg
Young's modulus 68 - 80 GPaYield strength (elastic limit) 95 610 MPaTensile strength 180 - 620 MPaElongation 1 -Fatigue strength at 10^7 cycles 57 - 210 MPaFracture toughness 21 - 35 MPa.m^1/2
Melting point 495 - 640 °CMaximum service temperature 120 - 200 °CThermal conductivity 118 - 174 W/m.KThermal expansion coefficient 22 - 24 µstrain/°C
Electrical resistivity 3.8 - 6 µohm.cm
Description.
Age-hardening wrought Al-alloys
The high-strength aluminum alloys rely on age-hardening: a sequence of heat treatment steps that causes the precipitation of a nano-scale dispersion ofintermetallics that impede dislocation motion and impart strength.
Age-hardening wrought Al-alloys
Definitions and measurement.ensile stress-strain
s elastic, meaning that the strain is ble – the material returns to its
The o
trongly enough they form solids; the the bond, the higher is the melting
Young’s modulus
Figure 1 shows a typical tcurve. The initial part is linear (Hooke’s law), and it irecoveraoriginal shape when the stress is removed. Stresses above the elastic limit cause permanent deformation or fracture ………
rigins of moduli. Atoms bondtogether, some weakly, some strongly. If they bind sstrongerpoint of the solid. Think of the bonds as little springs (Figure 3). The atoms have an equilibrium spacing ; a force pulls them apart a little, to , but when it is released they jump back to their original spacing. . ……….
Measurement of Young’s modulus
Orig ins of the modulus
Definitions and measurement.
i
How do fatigue cracks propagate?
Material subjected to repeated stress cycles may fail even when the peak stress is well below the tensile strength, or even below that for yield. Fatigue data are measured and presented as curves, where ∆σ is the range over which the stress varies and Nf
s the number of cycles to failure………
Holes, change of section, cracks, and surface scratches concentrate stress so that, even when the sample as a whole remains elastic (the “high-cycle” regime), local plasticity occurs. The damage this creates accumulates, finally developing into a tiny crack. The crack propagates in the way shown on the left of Figure 2. ……….
Fatigue strength at 107 cycles
7 MFA, 04/05/2007
technical details and on possible environmental concerns. It allows more ambitious exercises and projects, still without smothering the student with information. The final, third, level develops this yet further with a much larger number of data records, providing a tool with which the student is already familiar, but now capable of professional-level selection exercises and projects (currently 2940 materials, 207 processes).
All three levels are managed by the same search and selection engine, so although the complexity and power increase, the interface remains familiar. Records can be retrieved by browsing and by a number of simple search methods. The science notes that are linked to every attribute in the database, describing how the property is defined, how it is measured and the science that underlies its values, create a built-in textbook, further supporting the educational role of the EduPack. More challenging (and stimulating) is the range of tools for selection to meet a set of engineering design requirements. They are based on systematic methods, documented in [9, 10 and 11] that engender understanding and encourage creative thinking. A selection exercise starts with an analysis of the design requirements: What is the function of the component? What constraints must it meet? What objectives influence the choice (maximizing performance, perhaps, or minimizing cost)? What freedom of choice exists – choice of material, of dimensions, of shape? The selection tool allows the user to eliminate materials that fail to meet the constraints and to rank the candidates that remain by their ability to meet the objective. Trade-off methods allow compromises to be reached between conflicting objectives (performance versus cost, for instance). The way the selection system works is described next.
6. The selection tools
The CES EduPack software does much more than just provide data and create charts. It allows the entire strategy of Figure 4 to be implemented, allowing sequential steps that apply the constraints, rank the survivors and initiates a search for documentation via a Web portal to materials information, using the top-ranked materials designations as search strings. We now look briefly at selection.
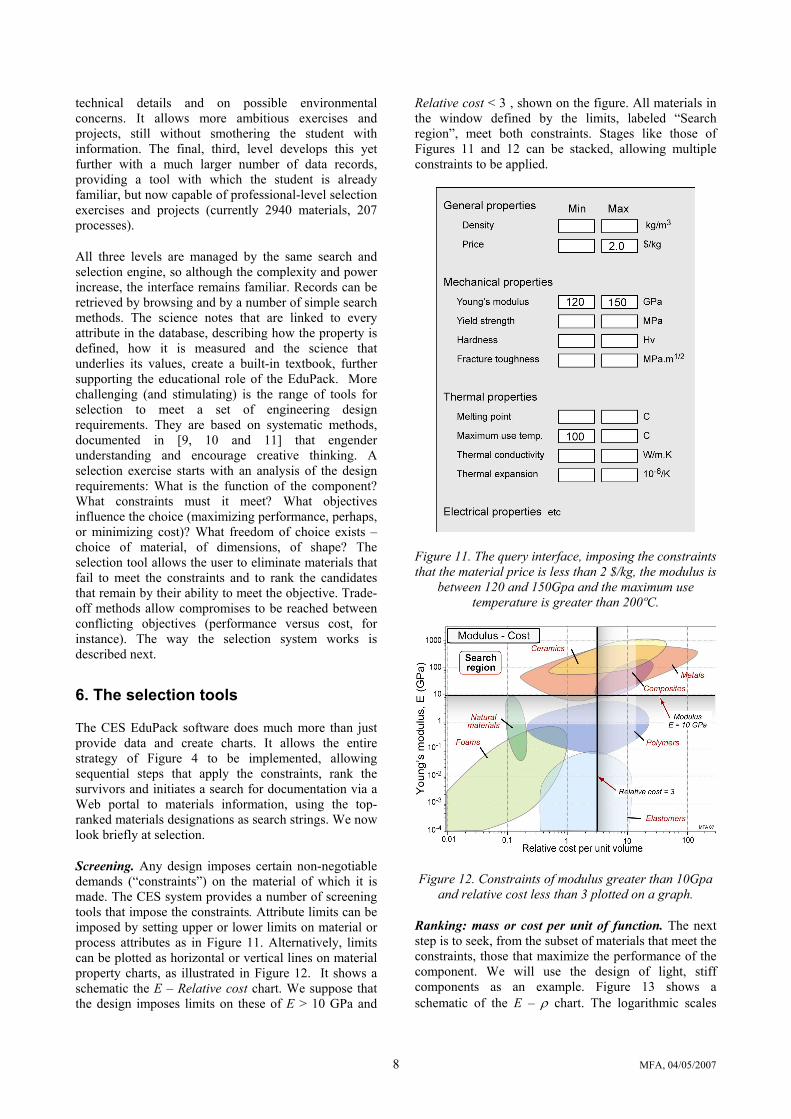
Screening. Any design imposes certain non-negotiable demands (“constraints”) on the material of which it is made. The CES system provides a number of screening tools that impose the constraints. Attribute limits can be imposed by setting upper or lower limits on material or process attributes as in Figure 11. Alternatively, limits can be plotted as horizontal or vertical lines on material property charts, as illustrated in Figure 12. It shows a schematic the E – Relative cost chart. We suppose that the design imposes limits on these of E > 10 GPa and
Relative cost < 3 , shown on the figure. All materials in the window defined by the limits, labeled “Search region”, meet both constraints. Stages like those of Figures 11 and 12 can be stacked, allowing multiple constraints to be applied.
Figure 11. The query interface, imposing the constraints that the material price is less than 2 $/kg, the modulus is
between 120 and 150Gpa and the maximum use temperature is greater than 200ºC.
Figure 12. Constraints of modulus greater than 10Gpa and relative cost less than 3 plotted on a graph.
Ranking: mass or cost per unit of function. The next step is to seek, from the subset of materials that meet the constraints, those that maximize the performance of the component. We will use the design of light, stiff components as an example. Figure 13 shows a schematic of the E – ρ chart. The logarithmic scales
8 MFA, 04/05/2007

9 MFA, 04/05/2007
allow the index E / ρ and others like them, to be plotted. Consider the condition:
E / ρ = constant, C
Taking logs:
log (E) = log (ρ) + log (C)
This is the equation of a straight line of slope 1 on a plot of log (E) against log (ρ). Figure 13 shows a grid of
lines corresponding to values of E / ρ from 0.01 to 10 in units of GPa/(Mg.m-3).
Figure 13. The index E/ρ, describing the objective of stiffness at minimume weight, plotted on a chart. The
best choices are materials with the greatest vale of E/ρthat at the same time meet all other constraints.
It is now easy to read off the subset of materials that maximize performance, meaning that they have the highest values of E / ρ. All the materials that lie on a line of constant E / ρ perform equally well as a light, stiff component; those above the line perform better, those below, less well. A material with a value of E / ρ = 10 in these units gives a component with a one tenth the weight, for a given stiffness, of a material with a value of ρ/E = 1. In practice an index line is plotted on a chart and moved until a manageably small number of materials lie above it. The software presents a list of these, ranked by the value of the index.
Figure 14 summarizes the way in which the search engine works. On the left is the simple query interface for screening on single attributes. The desired upper or lower limits for constrained properties are entered; the search engine rejects all materials with attributes that lie outside the limits. In the center is shown a second way of interrogating the data: a bar chart, constructed by the software, for any numeric property in the database. It, and the bubble chart shown on the right, are ways both of applying constraints and of ranking. For screening, a selection line or box is superimposed on the charts with edges that lie at the constrained values of the property (bar chart) or properties (bubble chart). This eliminates the materials in the shaded areas and retains the materials that meet the constraints. If instead, ranking is sought (having already applied all necessary constraints) an index-line like that shown in Figure 13 is positioned so that a small number – say, ten – materials are left in the selected area; these are the top ranked candidates. The software delivers a list of the top-ranked materials that meet all the constraints, ranked by the value of the
Figure 14. Computer-aided selection using the CES EduPack software. The schematic shows the three types of selection window. They can be used in any order and any combination. The
selection engine isolates the subset of materials that pass all selection stages.

index. Figure 15 illustrates the Results list for such a selection. Selected candidates are ranked by their value of the index.
Material Ranked by Index E/ρ CFRP 65.7 Aluminum alloys 27.7 Low alloy steel 26.9 Medium carbon steel 26.5 High carbon steel 26.4 Low carbon steel 26.4 Stainless steel 25.4 Magnesium alloys 24.1 Titanium alloy 22.6
Figure 15. Selected materials ranked by the index E/ρ.
7. Developing the science: the Elements database
The CES system builds an understanding of the science of materials as well as their selection. The embedded Science notes (Figure 10) have already been mentioned. The supporting texts (references [9] and [10]) develop this in greater depth, and a further text (reference [11]) explores the aesthetic and emotional qualities that materials can offer. In addition, the system includes, as standard, a further database, that for the elements of the Periodic Table. It contains data for all the elements that are stable enough permit characterization. There are 127 records for 111 elements (some have two or three
allotropic forms requiring separate records). There are 56 fields listing position in the Periodic Table, crystallographic, structural, mechanical, thermal, electrical and magnetic properties, diffusion data and surface energies. Figures 16 and 17 illustrate some of the ways in which it can be used. The first (Figure 16) shows a property – here, density at NTP – plotted against atomic number, illustrating the periodic fluctuations across each row of the Table. The second (Figure 17) illustrates how fundamental relationships between properties can be demonstrated. Here the thermal conductivity of the metallic elements is plotted against the electrical resistivity. There is a clear inverse-linear relationship between them, known as the Wiedemann-Franz law, arising because, in metals, electrons are responsible both for thermal and electrical conduction. Many other fundamental relationships can be explored in this way.
8. Further adaptation to – and support for – teaching needs
The needs of a course for engineers working in aerospace design differ from those of one for the design of civil structures or for product design. A benefit of computer-aided teaching is the ability to customize it, ensuring that the materials information to which the student has access is relevant to the specifics of the subject being studied. Thus a course on materials science is strengthened by a database for the elements, spanning the Periodic Table and providing crystallographic data, data on cohesion and physical properties. Aerospace engineering requires access to
Figure 16. The variation of the density at NTP of the elements across the Periodic Table. The rows of the table are distinguished by color.
10 MFA, 04/05/2007

Wiedemann-Franz law
Figure 17. The thermal conductivity of the metallic elements plotted against their electrical resistivity. The inverse linear relationship is known as the Wiedemann-Franz law.
data for light alloys and composites, and perhaps for materials that meet US military specifications (MMPDS for metals and MIL-HDBK-17 for composites). A course for civil engineers requires data for cement, concrete, structural grades of steel, aluminum and wood, and for structural sections made from these. One on product design might benefit from access to a large amount of grade-specific polymer data that meets ISO standards. All of these data sets (summarized in Table 2) exist and can be provided with the basic EduPack system allowing easy adaptation both to the level of the course and its subject matter.
Table 2: CES databases for education
Subject group Appropriate additional databases Mechanical & manufacturing engineering, Design
The basic tool set - continually developed with annual upgrade.
Materials science Add the Elements database. Properties of the elements of the Periodic Table.
Polymer engineering, Industrial design
Add the OPS, Campus and IDES databases. Records for 50,000 polymers, with processing data.
Aerospace, Motorsports, Sports science
Add the MMPDS (formerly MIL-Handbook-5) and MIL-Handbook-17 databases. US Aerospace approved data for metals and composites.
Architecture and the Built Environment
Add the Architecture and Structural Sections DBs. The materials of construction and structural sections.
Environmental engineering
Add the Eco-materials database. Geo-economic, production, processing and recycling data.
Projects and Research
Add CES Constructor. A tool to edit and extend databases and to create new ones.
An additional supporting tool, CES Constructor, enables instructors to adapt the databases to their own specific requirements. It allows the databases to be copied, edited, expanded or augmented with completely new, user-created databases. This opens up the possibility of projects of an advanced nature, creating information systems to support other design activities.
As a further aid to instructors teaching a course on any of these subjects, a comprehensive set of PowerPoint presentations (Table 3, overleaf) with supporting notes for the lecturer, case studies, and problem sets is also available. These presentations provide valuable material for lectures and classes. They dovetail with the texts [9, 10 and 11] in which the design-led approach to learning about materials is developed in full.
11 MFA, 04/05/2007

9. Closing note
The number and variety of materials available today is increasing at a rate faster than at any previous time. The next generation of engineers – the ones we are educating now – will need the ability to use materials of all sorts (conventional as well as advanced) in ways that meet more demanding technical, environmental, economic and aesthetic requirements than ever before. Forward-looking engineering education aims to provide the student with understanding, with methods to apply the understanding, and with tools to facilitate this application; examples of the last is a facility with FE, solid modeling and other CAD software.
The aims of materials teaching should, in our view, be the same. This paper describes our approach to realizing these aims, an approach that is implemented in the CES EduPack. The EduPack is a complete toolkit, with the central software supported by supplementary databases, textbooks, lectures, projects, and exercises.
The progression through the three levels of the CES EduPack provides students with the knowledge and confidence to select materials for mechanical, thermo-mechanical and electro-mechanical design, as well as processes for forming, joining and surface treating the materials. And the methodology applies not only to these functional aspects of design, but also to commercial (e.g., cost) and environmental (e.g., CO2 footprint or energy of production) aspects. The application of such materials information technology is becoming increasingly important in industry as materials and manufacturing organizations seek to optimize their materials strategies in order, for example, to control costs in global markets, or to incorporate eco-design principles in response to market demand and increased environmental regulation. Use of CES EduPack thus provides students with experience of a relevant tool that they take with them when they leave the University and start a professional career.
Acknowledgements
Many colleagues have been generous in discussion, criticism and constructive suggestions that have contributed to CES EduPack over many years. We particularly wish to acknowledge the contribution of the staff of Granta Design Ltd. who are responsible for the software and data for the CES EduPack.
Table 3: PowerPoint lecture units to accompany the
databases.
The 12 PowerPoint Lecture Units (with notes and exercises)
Unit 1. The materials and processes universe: families, classes, members, attributes
Unit 2. Materials charts: mapping the materials universe
Unit 3. Translation, Screening, Documentation: the first step in optimized selection
Unit 4. Ranking: refining the choice
Unit 5. Selecting processes: shaping, joining and surface treatment
Unit 6. Objectives in conflict: trade-off methods and penalty functions
Unit 7. The economics: cost modeling for selection
Unit 8. Eco design: environmentally informed material choice
Unit 9. Architecture and the Built Environment: materials for construction
Unit 10. Structural sections: shape in action
Unit 11. Materials in Industrial design: why do consumers buy products?
Unit 12. CES in research: editing and creating databases
Special unit: The Campus database
12 MFA, 04/05/2007

References
[1] Cottrell, A.H. (1964) “The Mechanical Properties of Matter”, John Wiley and Sons, NY, USA. Library of Congress Catalog Card No. 64-14262. (A magnificent text, a model of clear writing and physical insight, tragically out of print, but available in libraries.)
[2] Callister, W. D. Jr., (2002) Materials Science and Engineering, an Introduction. 6th edition, John Wiley and Sons, NY, USA (An enduring text, widely used in the US and Canada.)
[3] Budinsky K.G. and Budinsky M.K. (1999), “Engineering Materials, Properties and Selection”, 6th edition, Prentice Hall, London, UK.
[4] Courtney, T.H. (2000) “Mechanical Behavior of Materials”, 2nd edition, McGraw Hill, Boston, USA. ISBN 0-07-028594-2. (A broad treatment of the mechanical properties of materials – mostly metals and ceramics – focusing on the description of mechanisms and keeping the mathematical treatment at a simple level.)
[5] Farag, M.M. (1989) “Selection of Materials and Manufacturing Processes for Engineering Design”, Prentice-Hall, Englewood Cliffs, NJ, USA. ISBN 0-13-575192-6. (A Materials science approach to the selection of materials.)
[6] Dieter, G.E. (1991) “Engineering Design, A Materials and Processing Approach”, 2nd edition, McGraw-Hill, New York, USA. ISBN 0-07-100829-2. (A well-balanced and respected text focusing on the place of materials and processing in technical design.)
[7] Charles, J.A., Crane, F.A.A. and Furness, J.A.G. (1997) “Selection and Use of Engineering Materials”, 3rd Edition, Butterworth Heinemann Oxford, UK. ISBN 0-7506-3277-1. (A Materials science approach to the selection of materials.)
[8] Lewis, G. (1990) “Selection of Engineering Materials”, Prentice-Hall, Englewood Cliffs, N.J., USA. ISBN 0-13-802190-2. (A text on material selection for technical design, based largely on case studies.)
[9] Ashby M.F., Shercliff, H. and Cebon, D. (2007) “Materials: Engineering, Science, Processing and Design”, Butterworth Heinemann, Oxford, UK. ISBN-10 0-7506-8391-0; ISBN-13 978-7506-8391-3 . (An introductory text presenting the methods for selecting materials and processes discussed in this paper, with material property charts that can be copied without restriction for teaching purposes.)
[10] Ashby, M.F. (2005) “Materials Selection in Mechanical Design”, 3nd edition, Butterworth Heinemann, Oxford, UK. ISBN 0-7506-6168-2. (An advanced text presenting the methods for selecting materials and processes discussed in this paper, with material property charts that can be copied without restriction for teaching purposes.)
[11] Ashby, M.F. and Johnson, K. (2002) “Materials and Design, the Art and Science of Material Selection in Product Design”, Butterworth Heinemann, Oxford, UK. ISBN 0-7506-5554-2. (A text that complements reference [10], discussing the aesthetics, perceptions and associations of materials and their importance in product design.)
[12] Cross, N. (2000) “Engineering design methods”, 3rd edition, Wiley, Chichester UK. ISBN 0-471-87250-3. (A durable text describing the design process, with emphasis on developing and evaluating alternative solutions.)
[13] French, M.J. (1985) “Conceptual design for engineers”. The Design Council, London, UK, and Springer, Berlin, Germany. ISBN 0-85072-155-5 and 3-540-15175-3. (The origin of the “Concept – Embodiment – Detail” block diagram of the design process. The book focuses on the concept stage, demonstrating how simple physical principles guide the development of solutions to design problems.)
[14] Pahl, G. and Beitz, W. (1997) “Engineering design”, 2nd edition, translated by K. Wallace and L. Blessing, The Design Council, London, UK and Springer Verlag, Berlin, Germany. ISBN 0-85072-124-5 and 3-540-13601-0. (The Bible – or perhaps more exactly the Old Testament – of the technical design field, developing formal methods in the rigorous German tradition.)
[15] Ullman, D.G. (2003) “The mechanical design process”, 3rd edition, McGraw-Hill, N.Y., USA. ISBN 0-07-112281-8. (An American view of design, developing ways in which an initially ill-defined problem is tackled in a series of steps, much in the way suggested by Figure 3.1 of the present text.)
[16] Ulrich, K.T. and Eppinger, S.D. (1995) “Product design and development”, McGraw Hill, New York, USA. ISBN 0-07-065811-0. (A readable, comprehensible text on product design, as taught at MIT. Many helpful examples but almost no mention of materials.)
[17] The CES EduPack ’07 (2007), Granta Design Ltd., Cambridge, UK (www.grantadesign.com ). (The software, designed for undergraduate teaching at all levels, used to create the charts and property listings used in this paper.)
CES EduPack is a trademark of Granta Design Limited.
13 MFA, 04/05/2007