Embed Size (px)
Citation preview

Copyright © 2003 by Pearson Education, Inc. 2-1
TA Office Hours, STATA class
• TEACHING ASSISTANTSTiffany Chou: [email protected] Bauer: [email protected] Nelson: [email protected]
OH: Monday 7-8PM, Center 119 ; Wednesday 3:30-5, Seq. 244
** STATA Evening Class ** Jan 14: Monday 7-8PM or Monday 8-9PM; (Econ 100 computer lab)
Econometrics 120BLesson 2: Review of Probability
0. Last Class: 2 Themes1. Probability2. Random Variables3. Expected Value4. Variance, Covariance5. Random Sampling6. Sample size matters7. Working with Normal Distribution8. Central Limit Theorem9. Problem Set #1
Next Class: Statistics Review

Review: Why Econometrics? 1. Why study Econometrics?
2. Who needs data anyway?
3. If you had some, what would you do with it? Coffee example [Quantifying uncertainty]GRE example [Correlation and causality]
These two themes will recur throughout the course
4. Types of data: Experimental vs. nonexperimental data. Cross-sections, Time-Series, Panels.
5. Syllabus & logistics - econ.ucsd.edu/~elib/120b
Next Class.. Statistics ReviewDon’t forget: Problem Set #1

Copyright © 2003 by Pearson Education, Inc. 2-4
1. Probability - events best thought of as uncertain
Events:A – Chargers beat Colts (0-no,1-yes)B - Chargers win the Super BowlC - Iraq war ends by 2010D – Hilary Clinton wins Democratic nominationE - Angelina Jolie and Brad Pitt adopt a child in 2008
Joint, marginal and conditional probabilities.A 0 1
B0 .3 .55 .851 0 .15 .15
.3 .7
• what's P(A=1, B=1)? 0.15• P(A=1)? • P(B=1|A=1) = P(A=1,B=1)/P(A=1)= ?• P(A=1|B=1) = ?• P(A=1|E=1) = ?

Copyright © 2003 by Pearson Education, Inc. 2-5
2. Random Variables
• X is a random variable if for every real number a there exists a probability P(X<=a).eg's: X is touchdowns scored by LT in playoffsq – coffee demandedq(p) - coffee demanded at price p
• Last class the predicted coffee demand, slope and intercept were random variables, why? because of sampling variation.
Copyright © 2003 by Pearson Education, Inc. 2-6
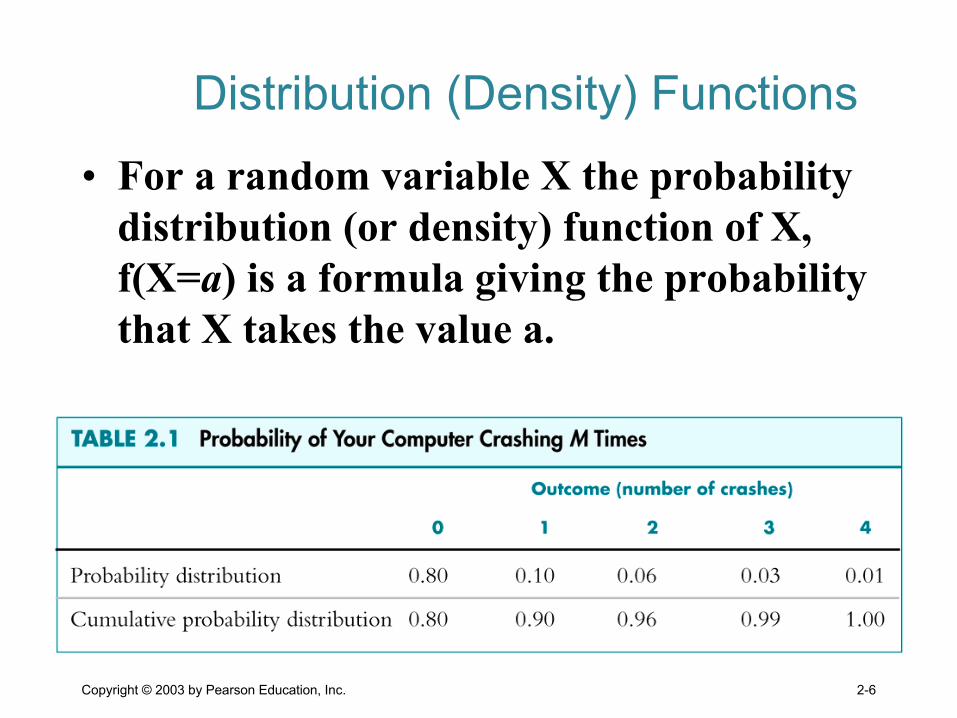
Distribution (Density) Functions
• For a random variable X the probability distribution (or density) function of X, f(X=a) is a formula giving the probability that X takes the value a.
Copyright © 2003 by Pearson Education, Inc. 2-7

Copyright © 2003 by Pearson Education, Inc. 2-8
3. Expected Value

Copyright © 2003 by Pearson Education, Inc. 2-9
Variance

Copyright © 2003 by Pearson Education, Inc. 2-10
Copyright © 2003 by Pearson Education, Inc. 2-11
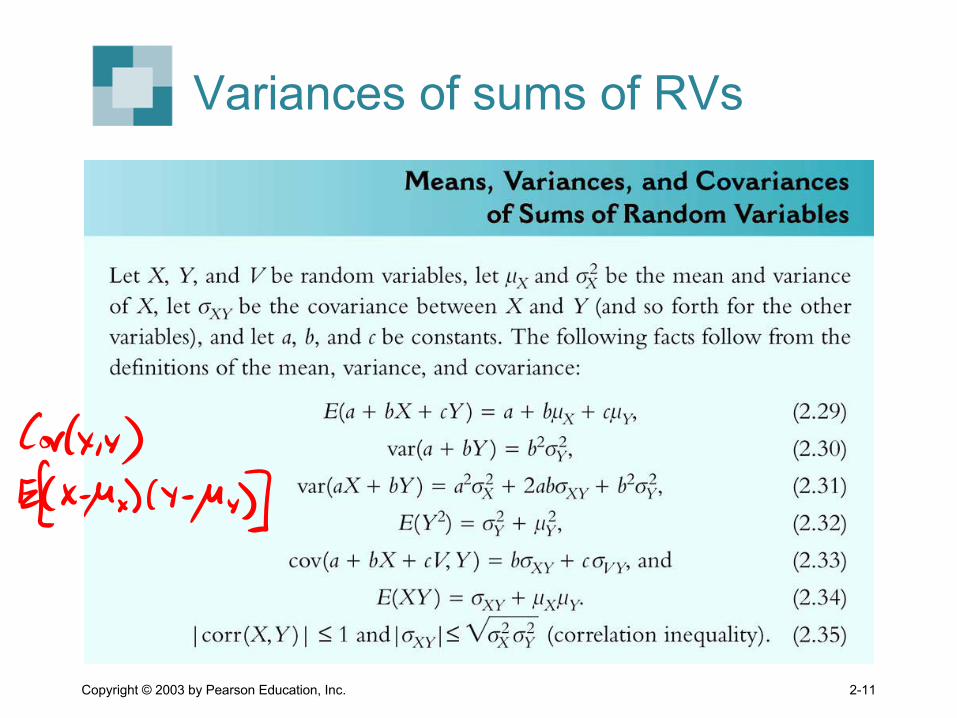
Variances of sums of RVs

Copyright © 2003 by Pearson Education, Inc. 2-12
4. Random Sampling

Copyright © 2003 by Pearson Education, Inc. 2-13
5. Sample size matters
Copyright © 2003 by Pearson Education, Inc. 2-14
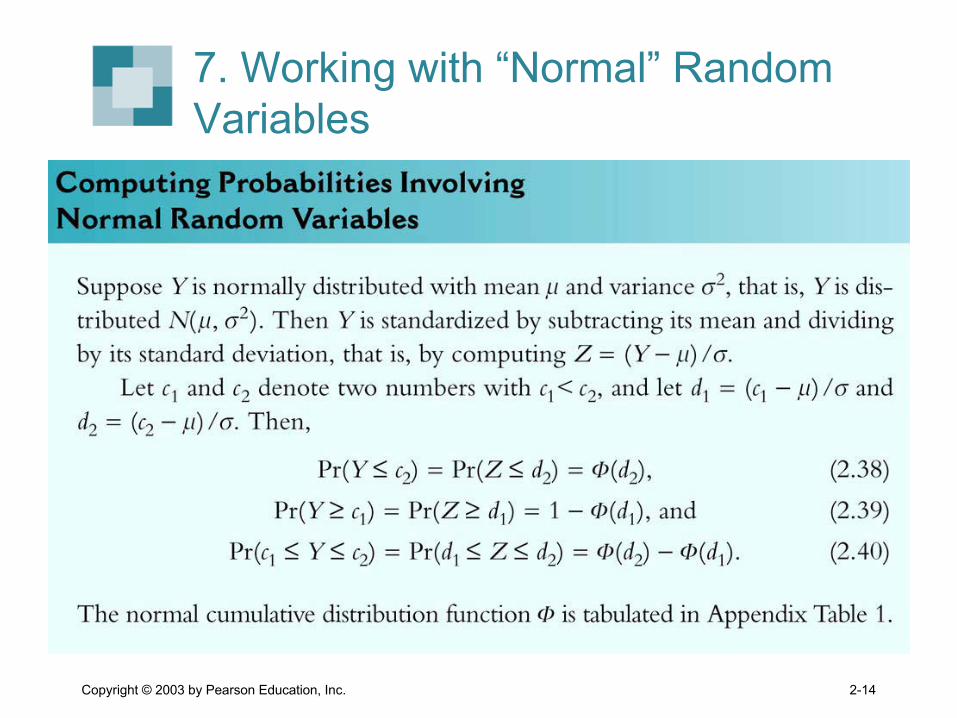
7. Working with “Normal” Random Variables

Copyright © 2003 by Pearson Education, Inc. 2-15
Three reasons to love the Normal Distribution are:1. 2. 3.

Copyright © 2003 by Pearson Education, Inc. 2-16

Copyright © 2003 by Pearson Education, Inc. 2-17
8. The Central Limit Theorem
Copyright © 2003 by Pearson Education, Inc. 2-18
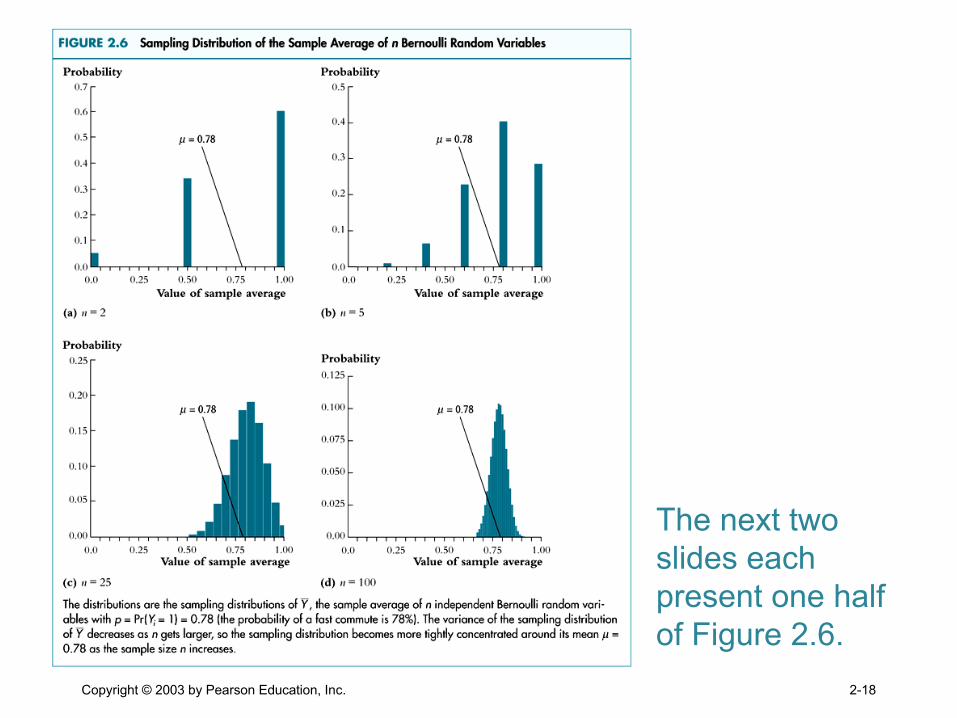
The next two slides each present one half of Figure 2.6.

Copyright © 2003 by Pearson Education, Inc. 2-19

Copyright © 2003 by Pearson Education, Inc. 2-20
Copyright © 2003 by Pearson Education, Inc. 2-21
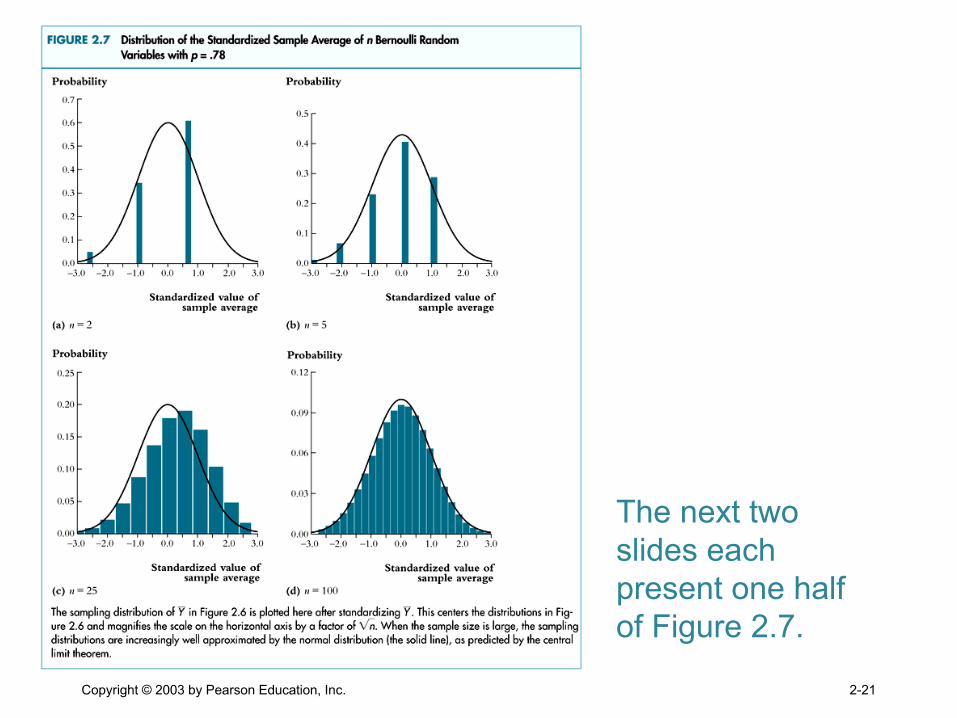
The next two slides each present one half of Figure 2.7.

Copyright © 2003 by Pearson Education, Inc. 2-22

Copyright © 2003 by Pearson Education, Inc. 2-23

Copyright © 2003 by Pearson Education, Inc. 2-24
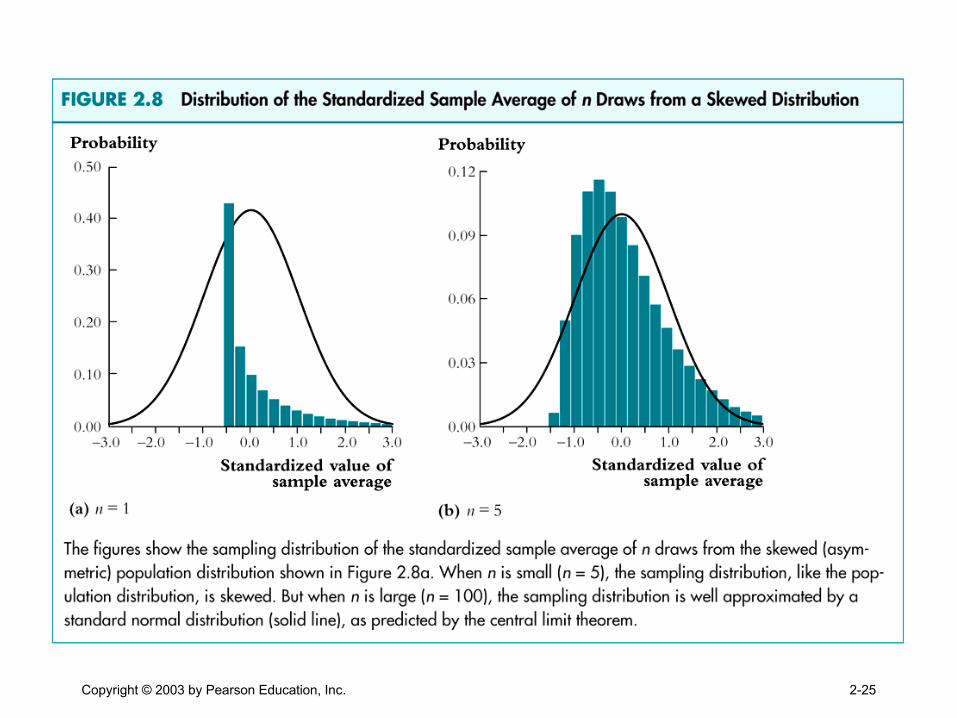
The next two slides each present one half of Figure 2.8.
Copyright © 2003 by Pearson Education, Inc. 2-25

Copyright © 2003 by Pearson Education, Inc. 2-26

Econometrics 120BSummary of Probability Lecture
1. Probability2. Random Variables3. Expected Value4. Variance, Covariance5. Random Sampling6. Sample size matters7. Working with Normal Distribution8. Central Limit Theorem
Next Class: Statistics Review

Copyright © 2003 by Pearson Education, Inc. 2-28
Problem Set #1

Copyright © 2003 by Pearson Education, Inc. 2-29
Problem Set #1: Data Gathering


![CRIMINAL CONSPIRACY [SECTION 120 A- 120B]](https://img.dokumen.tips/doc/110x75/61eb1d906d35a009b24af2f2/criminal-conspiracy-section-120-a-120b.jpg)