Embed Size (px)
Citation preview

Teachers’ Survey Report
2
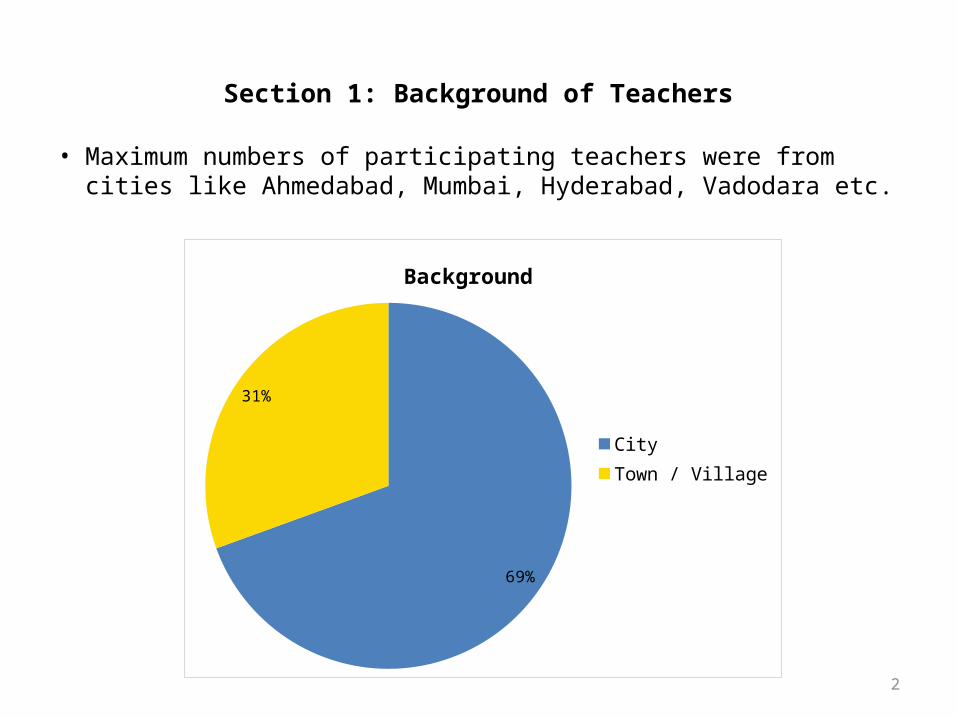
Section 1: Background of Teachers
• Maximum numbers of participating teachers were from cities like Ahmedabad, Mumbai, Hyderabad, Vadodara etc.
69%
31%
Background
CityTown / Village
3
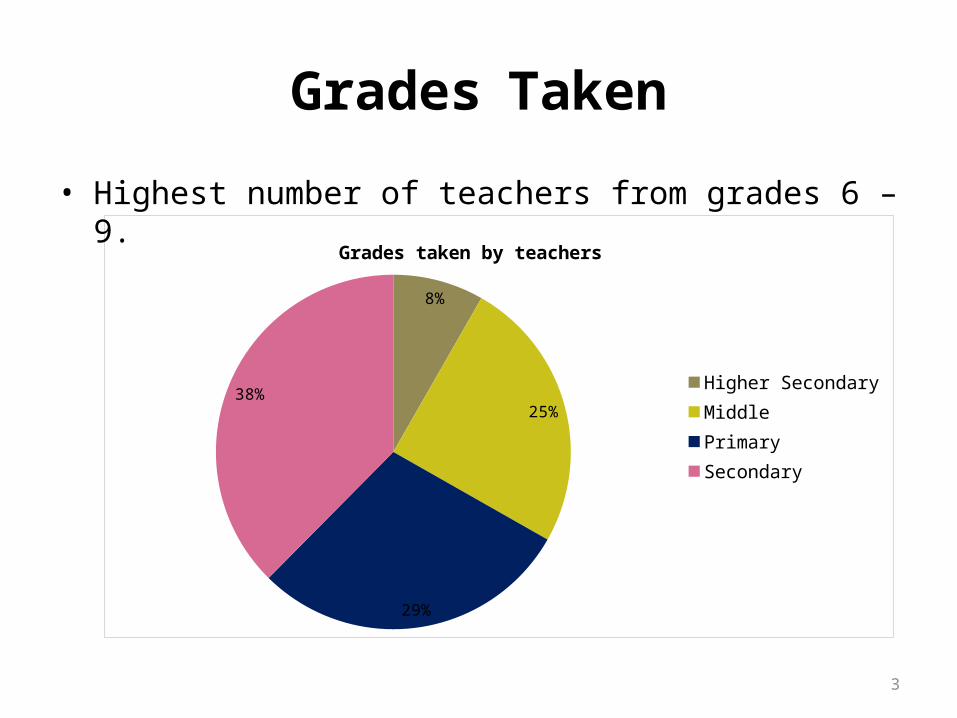
Grades Taken
8%
25%
29%
38%
Grades taken by teachers
Higher SecondaryMiddlePrimarySecondary
• Highest number of teachers from grades 6 – 9.
4
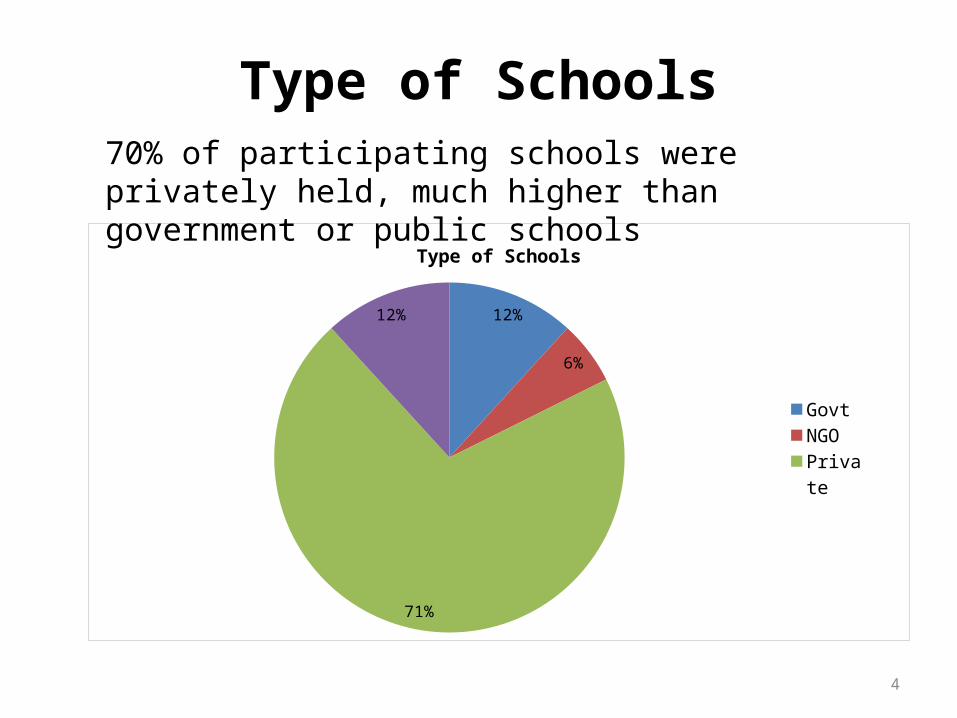
Type of Schools
12%
6%
71%
12%
Type of Schools
GovtNGOPrivatePublic
70% of participating schools were privately held, much higher than government or public schools
5
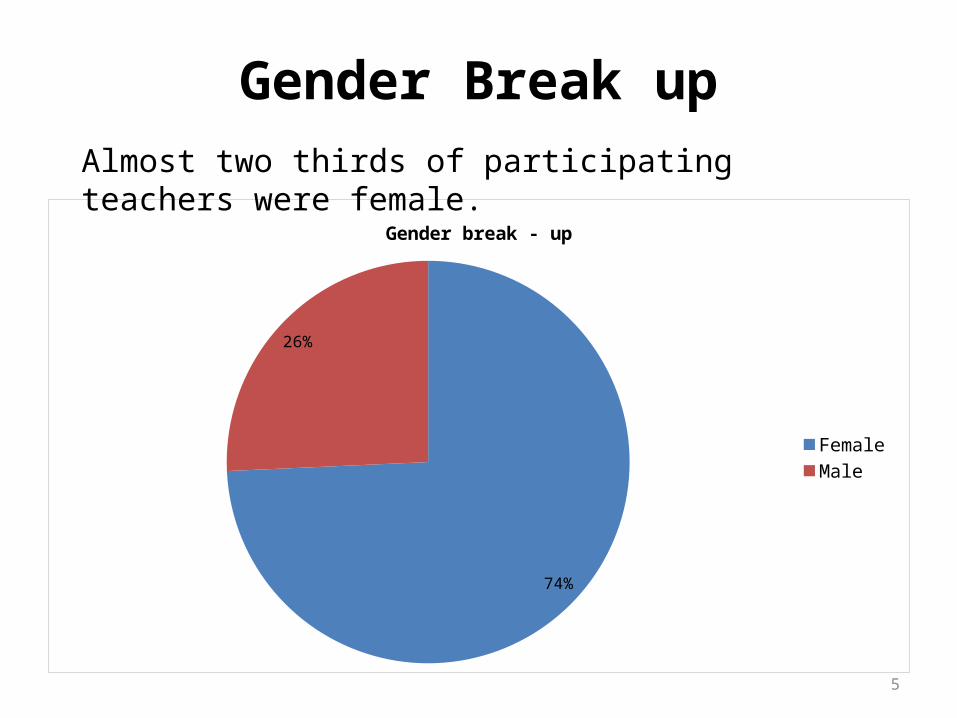
Gender Break up
74%
26%
Gender break - up
FemaleMale
Almost two thirds of participating teachers were female.
6
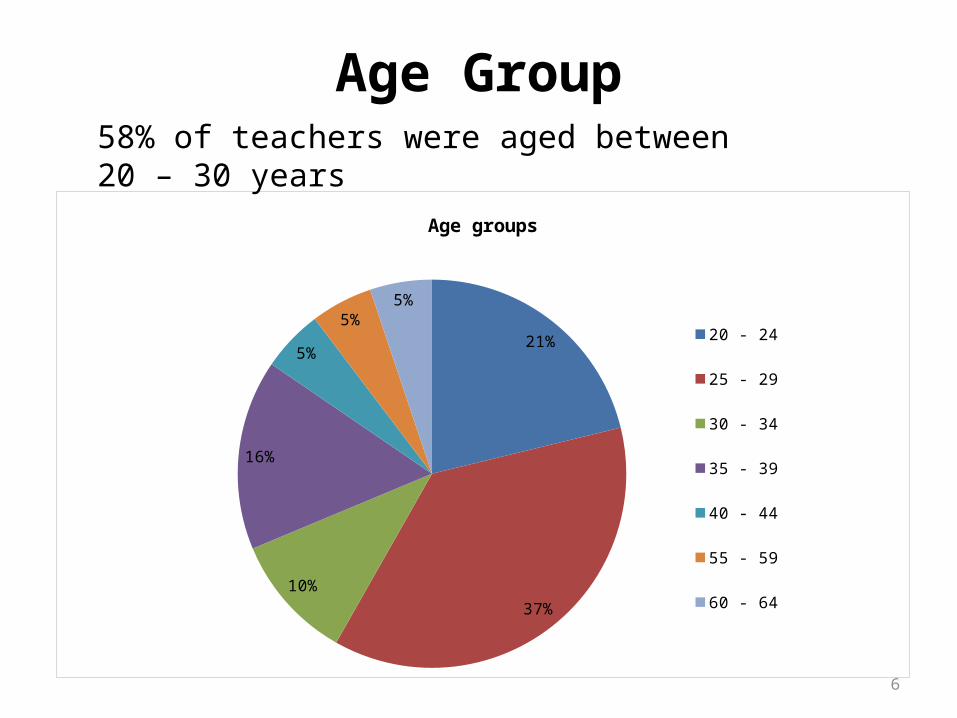
Age Group
21%
37%
10%
16%
5%
5%5%
Age groups
20 - 24
25 - 29
30 - 34
35 - 39
40 - 44
55 - 59
60 - 64
58% of teachers were aged between 20 – 30 years
7
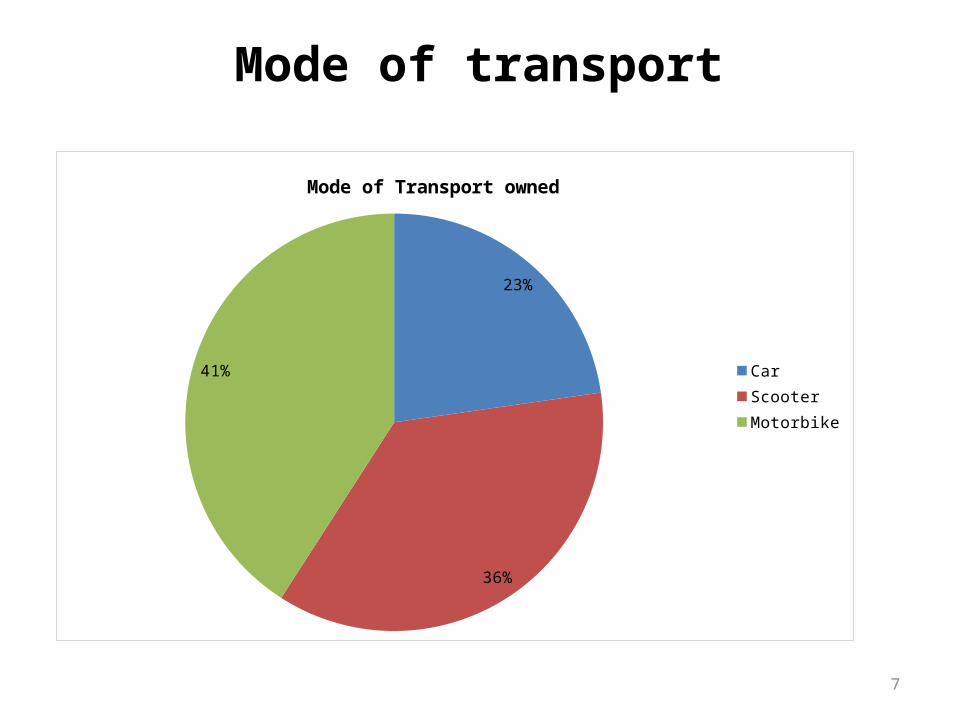
Mode of transport
23%
36%
41%
Mode of Transport owned
CarScooterMotorbike
8
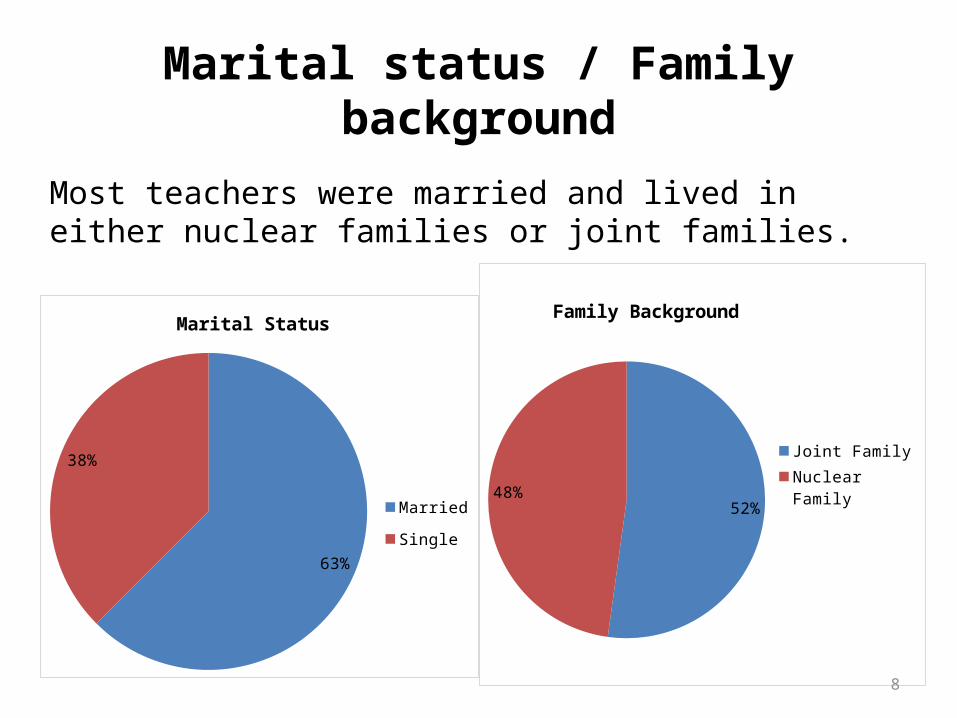
Marital status / Family background
63%
37%
Marital Status
Married
Single
Most teachers were married and lived in either nuclear families or joint families.
52%48%
Family Background
Joint FamilyNuclear Family
9
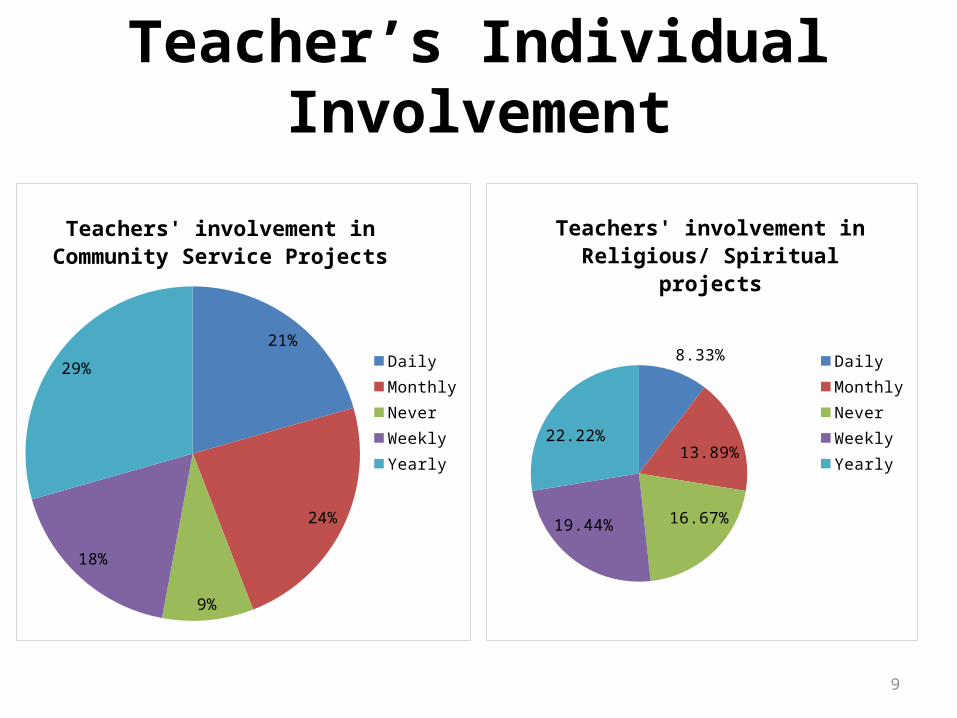
Teacher’s Individual Involvement
21%
24%
9%
18%
29%
Teachers' involvement in Community Service Projects
DailyMonthlyNeverWeeklyYearly
8.33%
13.89%
16.67%19.44%
22.22%
Teachers' involvement in Religious/ Spiritual projects
DailyMonthlyNeverWeeklyYearly
10
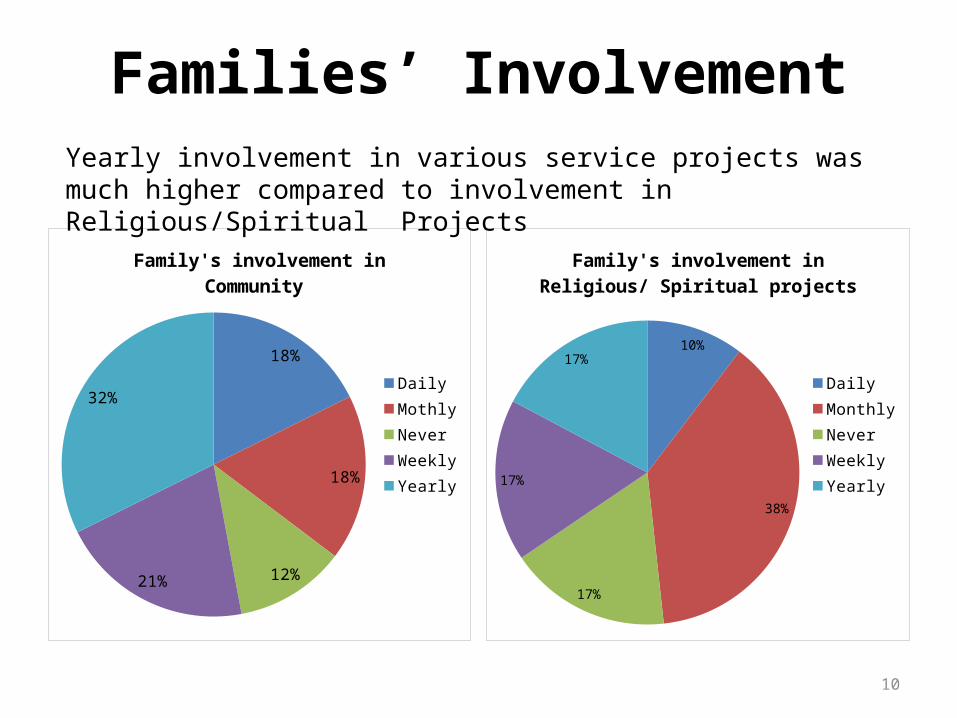
Families’ Involvement
18%
18%
12%21%
32%
Family's involvement in Community
DailyMothlyNeverWeeklyYearly
10%
38%
17%
17%
17%
Family's involvement in Religious/ Spir-itual projects
DailyMonthlyNeverWeeklyYearly
Yearly involvement in various service projects was much higher compared to involvement in Religious/Spiritual Projects
11
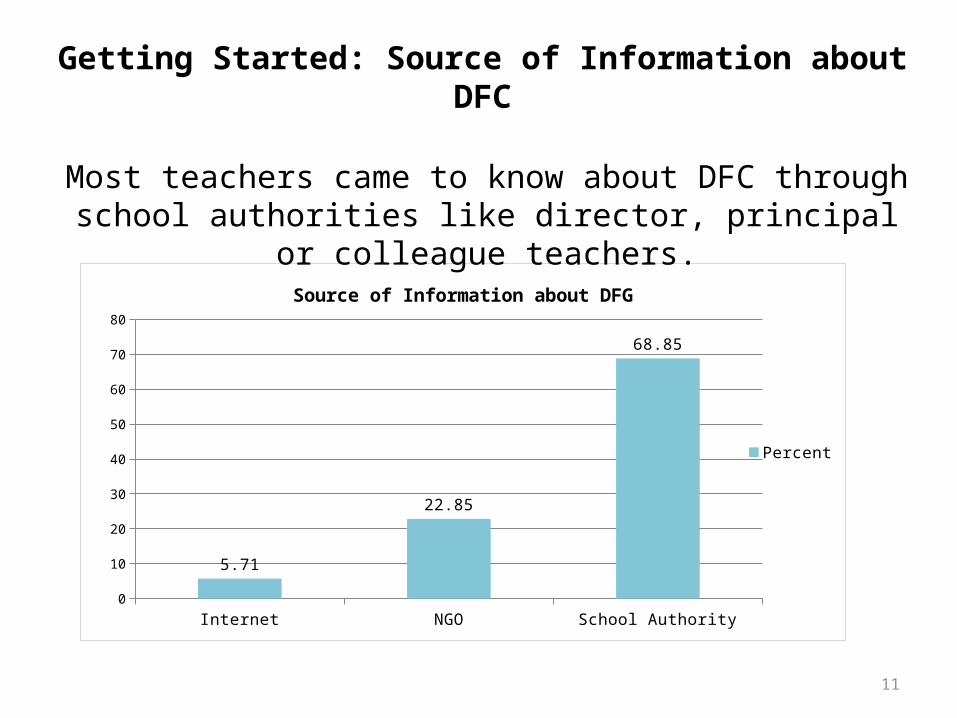
Getting Started: Source of Information about DFC
Internet NGO School Authority0
10
20
30
40
50
60
70
80
5.71
22.85
68.85
Source of Information about DFG
Percent
Most teachers came to know about DFC through school authorities like director, principal or colleague teachers.
12
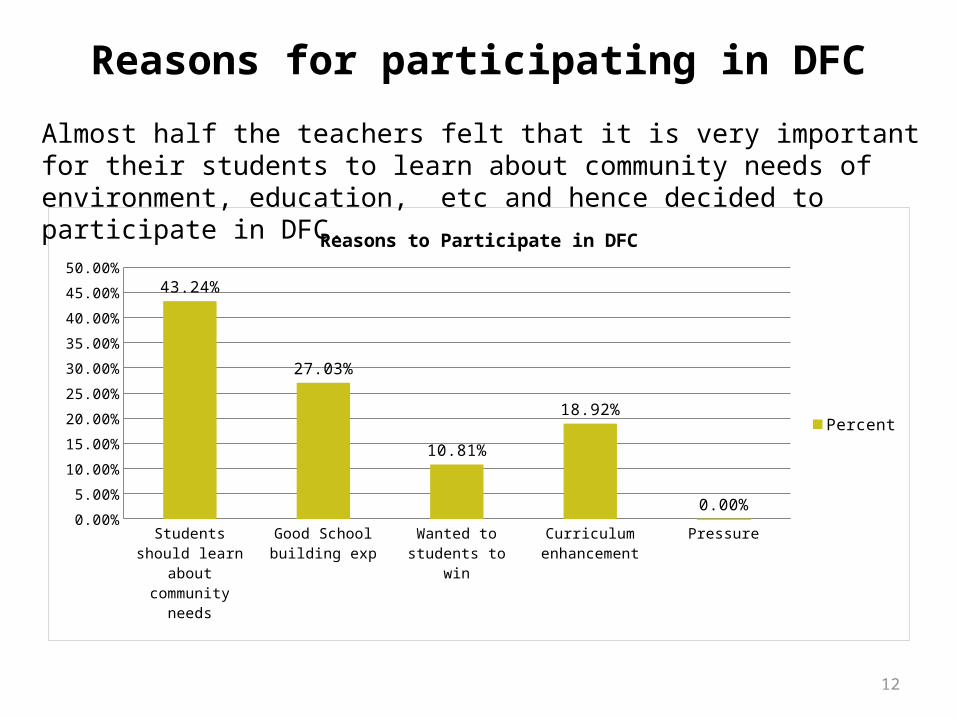
Reasons for participating in DFC
Studen
ts sh
ould learn
about community
needs
Good School b
uilding e
xp
Wan
ted to
studen
ts to
win
Curricu
lum enhan
cemen
t
Pressu
re0.00%5.00%
10.00%15.00%20.00%25.00%30.00%35.00%40.00%45.00%50.00% 43.24%
27.03%
10.81%
18.92%
0.00%
Reasons to Participate in DFC
Percent
Almost half the teachers felt that it is very important for their students to learn about community needs of environment, education, etc and hence decided to participate in DFC.
13
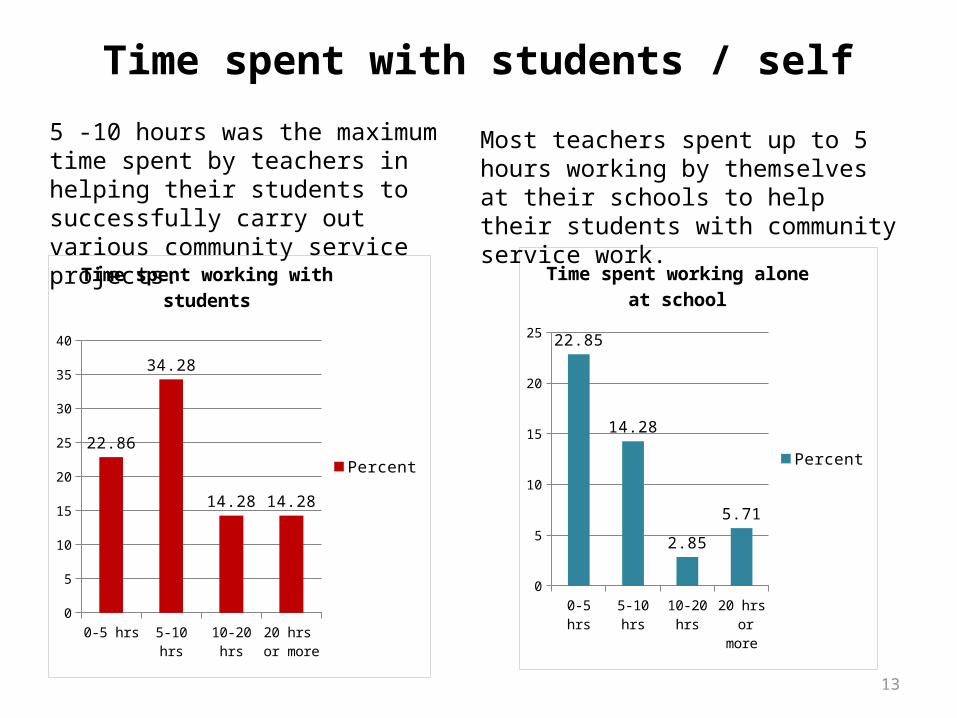
Time spent with students / self
0-5 hrs 5-10 hrs 10-20 hrs 20 hrs or more
0
5
10
15
20
2522.85
14.28
2.85
5.71
Time spent working alone at school
Percent
0-5 hrs 5-10 hrs 10-20 hrs 20 hrs or more
0
5
10
15
20
25
30
35
40
22.86
34.28
14.28 14.28
Time spent working with students
Percent
5 -10 hours was the maximum time spent by teachers in helping their students to successfully carry out various community service projects.
Most teachers spent up to 5 hours working by themselves at their schools to help their students with community service work.
14Once 5-10 times 11-20 times > 20 times0
2
4
6
8
10
12
14
9
12
23
Usage of DFG website
Frequency No resp
onse
Did not know ab
out the w
ebsit
e
No acces
s to In
ternet
0.00%
10.00%
20.00%
30.00%
40.00%
50.00%
60.00%
70.00% 65.71%
2.86%
31.43%
Reasons for not using DFG website
PercentNo Yes0
10
20
30
40
50
60
70
80
20
71.43
Usage of DFG website
Percent
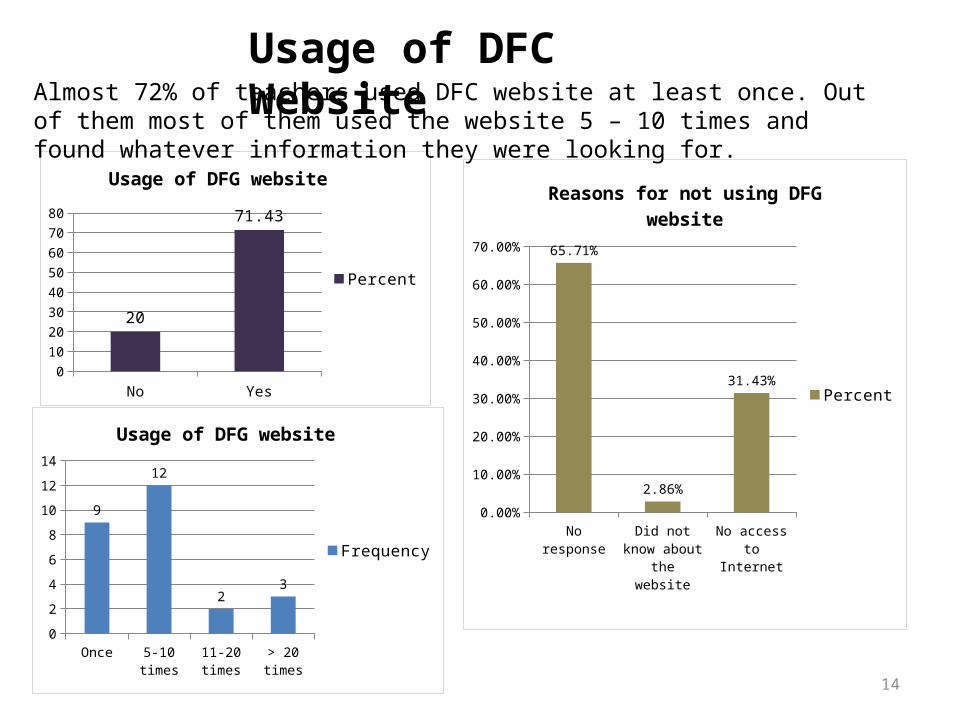
Almost 72% of teachers used DFC website at least once. Out of them most of them used the website 5 – 10 times and found whatever information they were looking for.
Usage of DFC Website
15
Nature of Community needs addressed
11%
11%
21%
29%
14%
7%
7%
Type of community projects
Addiction
Awareness
Education/ Literacy
Environmental Issues
Help challenged / lonely people
Responsible Citizen
Sanitation
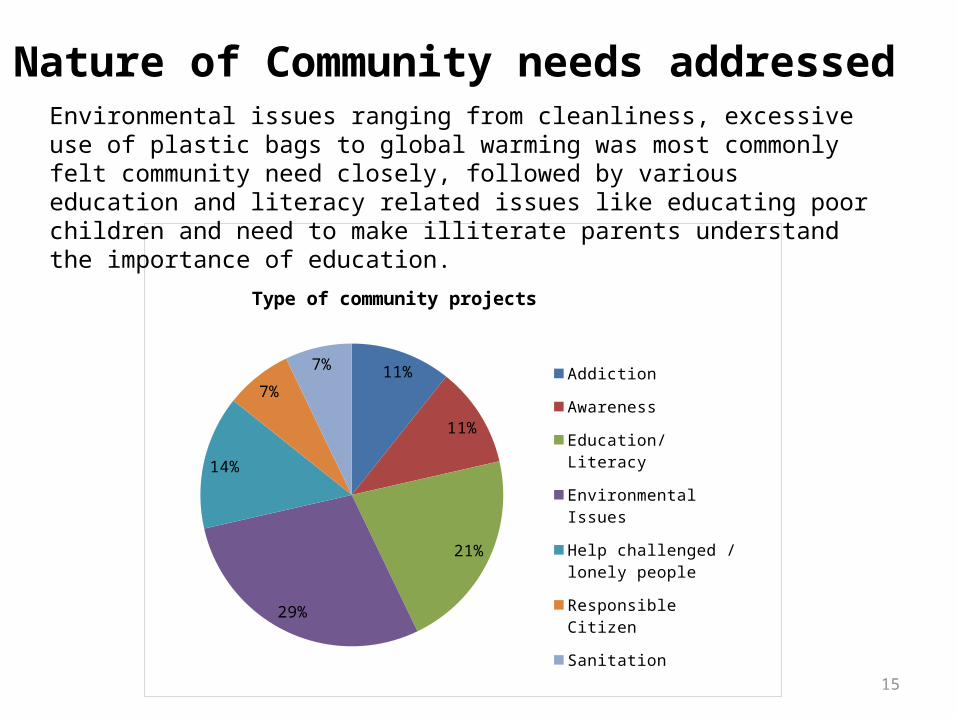
Environmental issues ranging from cleanliness, excessive use of plastic bags to global warming was most commonly felt community need closely, followed by various education and literacy related issues like educating poor children and need to make illiterate parents understand the importance of education.
16
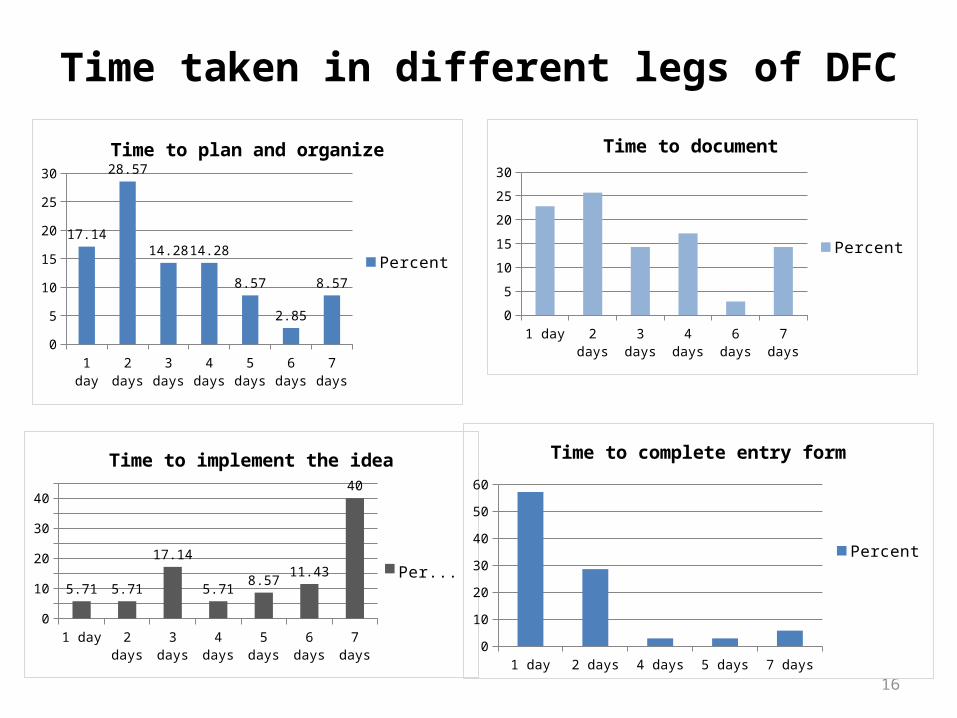
Time taken in different legs of DFC
1 day 2 days 3 days 4 days 5 days 6 days 7 days0
5
10
15
20
25
30
17.14
28.57
14.28 14.28
8.57
2.85
8.57
Time to plan and organize
Percent
1 day 2 days 3 days 4 days 5 days 6 days 7 days05
1015202530354045
5.71 5.71
17.14
5.718.57
11.43
40
Time to implement the idea
Percent
1 day 2 days 3 days 4 days 6 days 7 days0
5
10
15
20
25
30
Time to document
Percent
1 day 2 days 4 days 5 days 7 days0
10
20
30
40
50
60
Time to complete entry form
Percent
17
Work done with students
0
1
2
3
4
5
6
7
1
3
4
2
4
6
2
Rank - Work with students (most to least enjoyable on a scale of 1- 7)
Rank
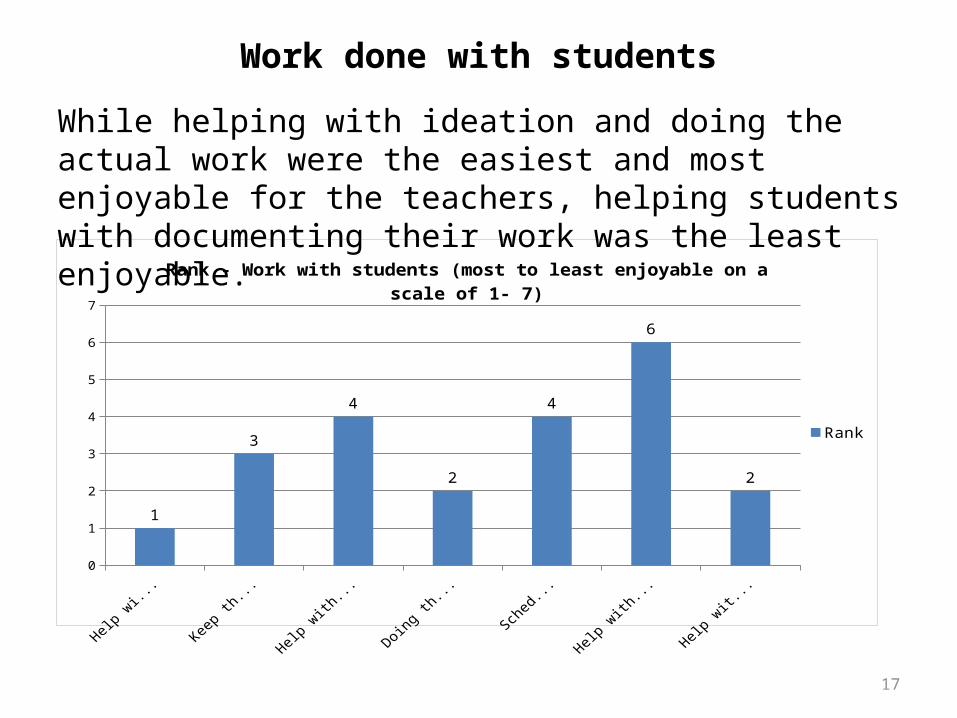
While helping with ideation and doing the actual work were the easiest and most enjoyable for the teachers, helping students with documenting their work was the least enjoyable.
18
Different legs of DFC
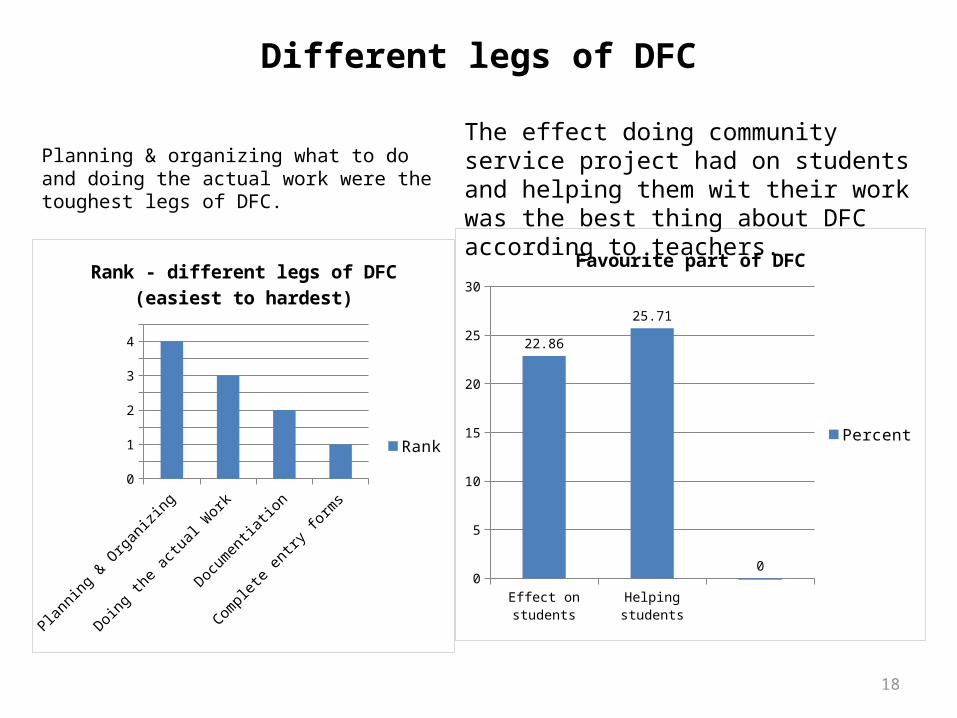
Planning & organizing what to do and doing the actual work were the toughest legs of DFC.
Planning &
Orga
nizing
Doing the a
ctual
Work
Documen
tiation
Complete e
ntry fo
rms
0
0.5
1
1.5
2
2.5
3
3.5
4
4.5
Rank - different legs of DFC (easiest to hardest)
Rank
Effect on students Helping students0
5
10
15
20
25
30
22.86
25.71
0
Favourite part of DFC
Percent
The effect doing community service project had on students and helping them wit their work was the best thing about DFC according to teachers.
19
Resources required
11.90%
16.67%
14.29%
57.14%
Resources required
More time
More help from school/community
More money
None
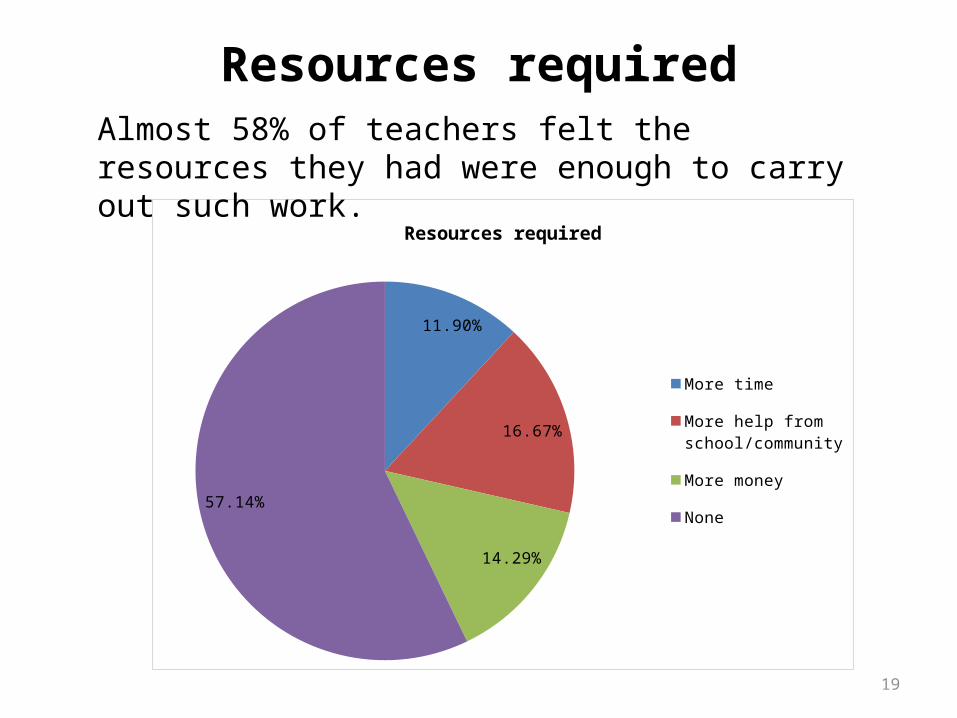
Almost 58% of teachers felt the resources they had were enough to carry out such work.
20
Ranking - the most favourite
Helping th
e community
Team w
ork
Using th
e DFG
websit
e
Sense
of acco
mplishmen
t
Studen
ts ga
ined new
skills
/ knowledge
0
1
2
3
4
5
6
Rank: least - most favourite things about DFC
Rank
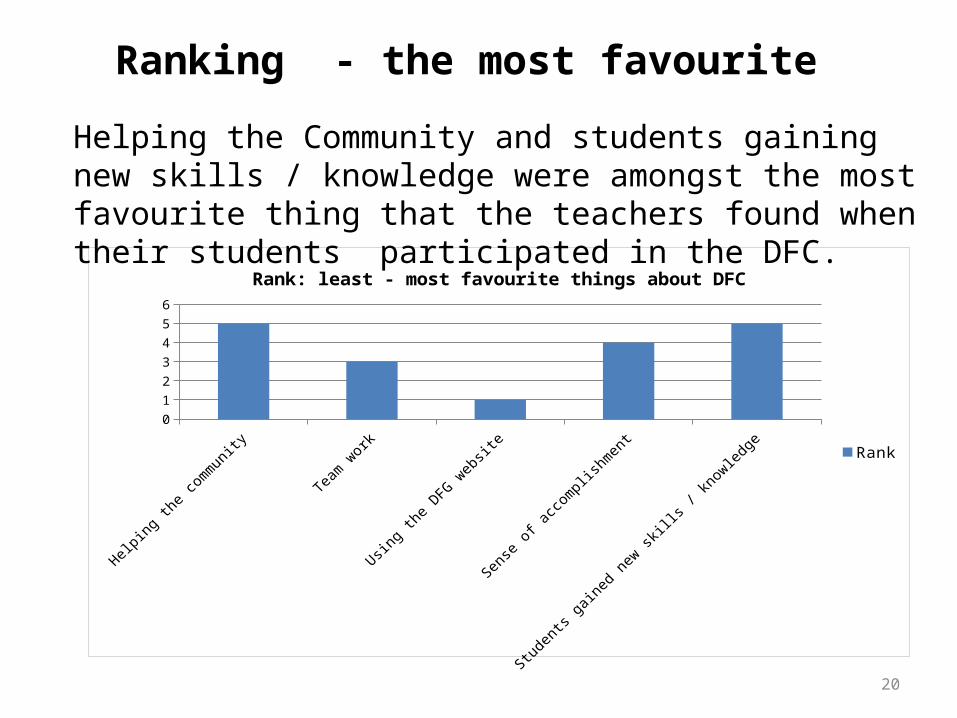
Helping the Community and students gaining new skills / knowledge were amongst the most favourite thing that the teachers found when their students participated in the DFC.
21
Reasons for Winning / Not winning
29%
6%
6%
11%
46%
3%
Reasons for winning
Creative thiningDeterminationGood Documenta-tionhelp from schoolSucessfully met community needthey successfully met a need in the community
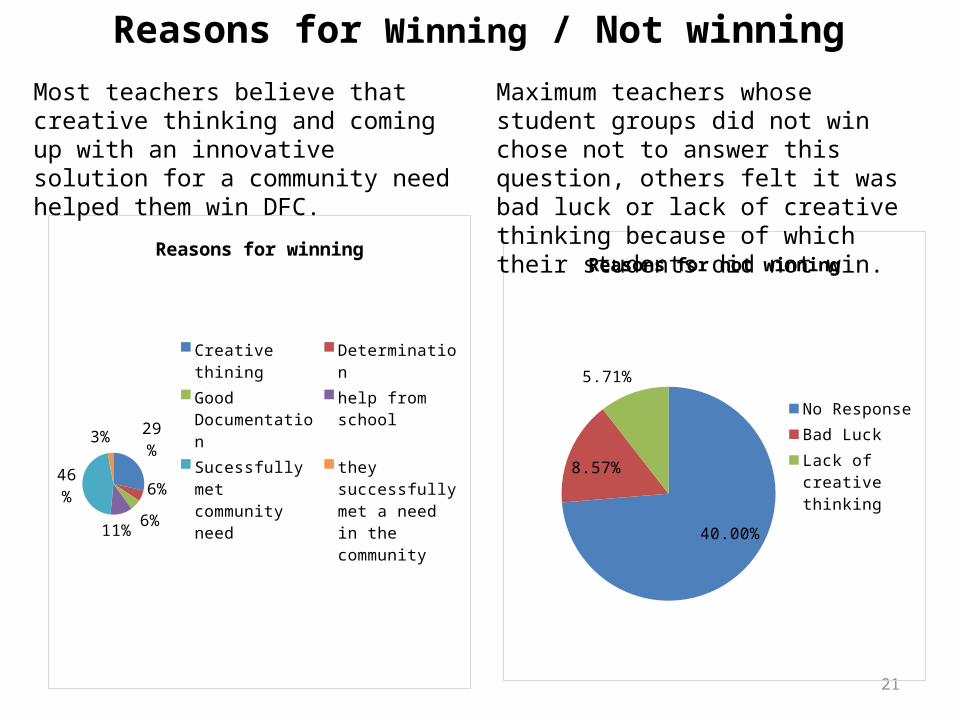
Most teachers believe that creative thinking and coming up with an innovative solution for a community need helped them win DFC.
40.00%
8.57%
5.71%
Reasons for not winning
No ResponseBad LuckLack of creative thinking
Maximum teachers whose student groups did not win chose not to answer this question, others felt it was bad luck or lack of creative thinking because of which their students did not win.
Design for Giving '09 22
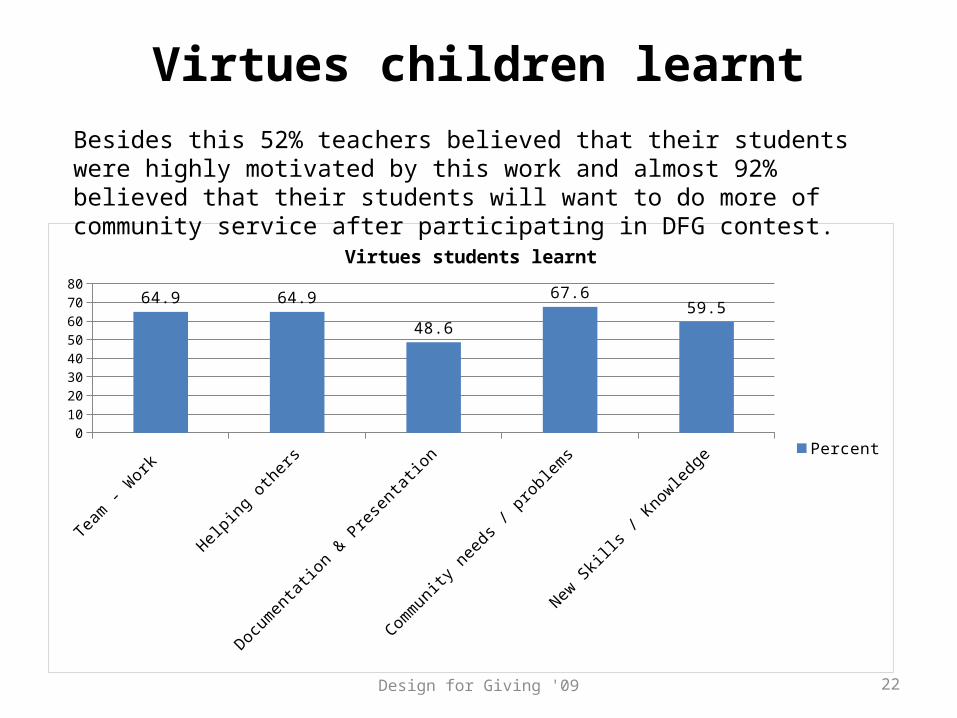
Virtues children learnt
Team - Work Helping others Documentation & Presentation
Community needs / problems
New Skills / Knowledge
0
10
20
30
40
50
60
70
80
64.9 64.9
48.6
67.6
59.5
Virtues students learnt
Percent
Besides this 52% teachers believed that their students were highly motivated by this work and almost 92% believed that their students will want to do more of community service after participating in DFG contest.
23
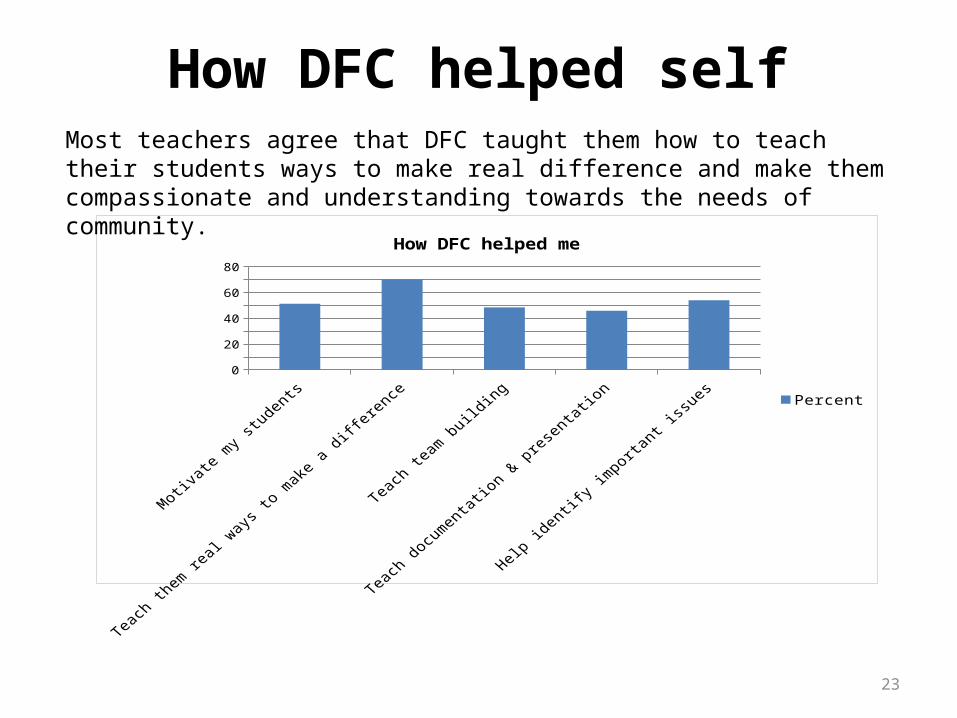
How DFC helped self
Motiva
te my s
tudents
Teach th
em real w
ays to m
ake a differe
nce
Teach te
am building
Teach docu
mentation & pre
sentation
Help identify
importa
nt issu
es0
1020304050607080
How DFC helped me
Percent
Most teachers agree that DFC taught them how to teach their students ways to make real difference and make them compassionate and understanding towards the needs of community.
Design for Giving '09 24
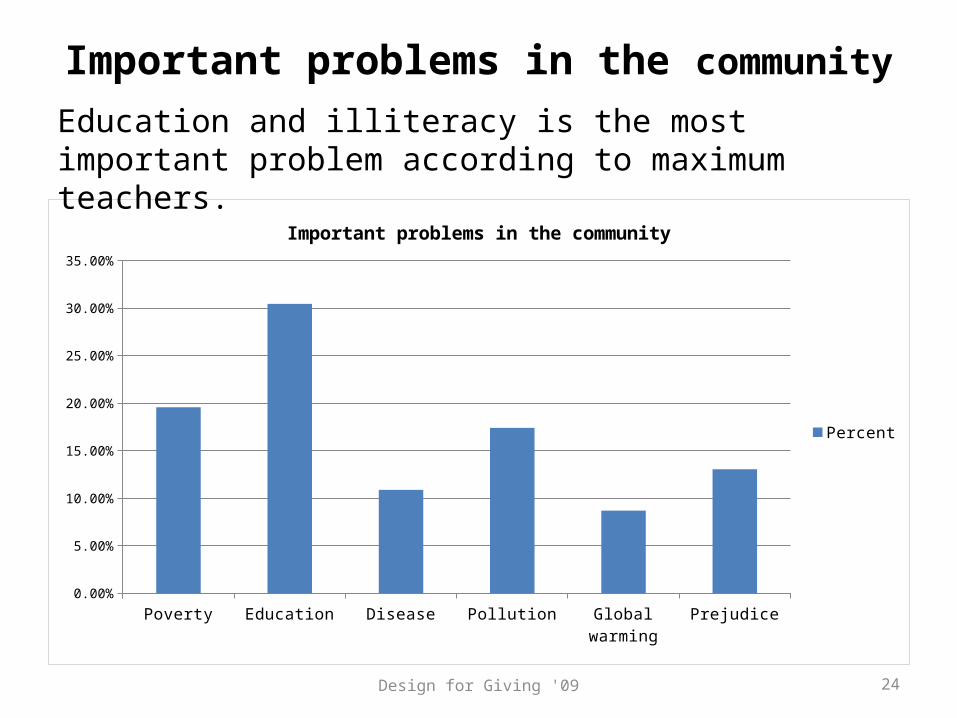
Important problems in the community
Poverty Education Disease Pollution Global warming Prejudice0.00%
5.00%
10.00%
15.00%
20.00%
25.00%
30.00%
35.00%
Important problems in the community
Percent
Education and illiteracy is the most important problem according to maximum teachers.
25
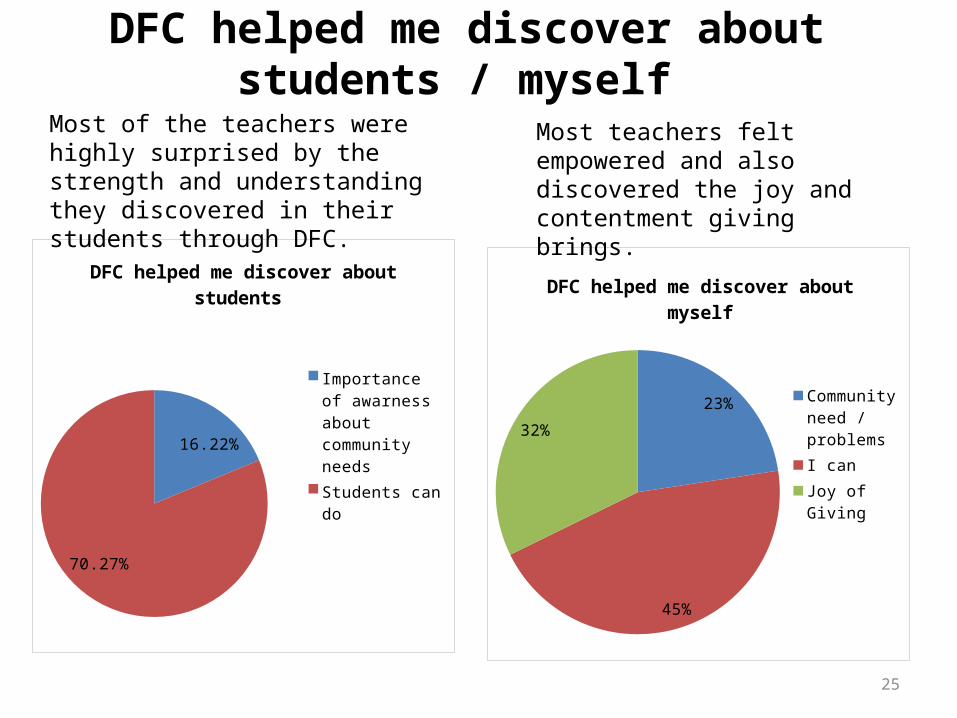
DFC helped me discover about students / myself
16.22%
70.27%
DFC helped me discover about students
Importance of awarness about community needsStudents can do
23%
45%
32%
DFC helped me discover about myself
Community need / problemsI canJoy of Giving
Most of the teachers were highly surprised by the strength and understanding they discovered in their students through DFC.
Most teachers felt empowered and also discovered the joy and contentment giving brings.

26
Thank You


![[XLS]specials.indiatoday.comspecials.indiatoday.com/petition_english/sheet11.xls · Web viewMANISH PATEL, AHMEDABAD SANTOSH HYDERABAD SALIL KUMAR RAY, KOLKATA UDAY, NEW DELHI AMIT](https://img.dokumen.tips/doc/110x75/5ae4f7487f8b9a495c8f3f34/xls-viewmanish-patel-ahmedabad-santosh-hyderabad-salil-kumar-ray-kolkata-uday.jpg)