Embed Size (px)
Citation preview
Te Rau Hinengaro: The New Zealand Mental Health Survey
Chapter 3: Twelve-month Prevalence J Elisabeth Wells Citation: Wells JE. 2006. Twelve-month prevalence. In: MA Oakley Browne, JE Wells, KM Scott (eds). Te Rau Hinengaro: The New Zealand Mental Health Survey. Wellington: Ministry of Health.
Te Rau Hinengaro: The New Zealand Mental Health Survey � 37
3 Twelve-month Prevalence
Key results
• Anxiety disorders were the most common group of disorders in the past
12 months (14.8%), followed by mood disorders (7.9%), then substance use
disorders (3.5%), with eating disorders the least common group (0.5%).
Within each group the prevalence of individual disorders varied several-fold.
• Nearly all disorders were most common in the group aged 16–24 and
prevalence declined across older age groups. This trend was most marked for
substance use disorders. Anxiety disorders and major depressive disorder were
more common in females, dysthymia and bipolar disorder occurred equally for
females and males, and there was a clear male predominance for substance use
disorders.
• Specific phobia produced the least interference with life, and mood disorders
produced the most interference. Case severity, which included the impact of a
disorder and comorbid disorders, was predominantly serious or moderate for all
disorders.
• Unadjusted prevalences, which show the burden of disorder, were generally
highest for Mäori, intermediate for Pacific people and lowest for the Other
composite ethnic group. After adjustment for age, sex, educational
qualifications and equivalised household income the results were as follows:
there was no difference across the ethnic groups in the prevalence of anxiety
disorders; Pacific people had the lowest prevalence of major depressive
disorder (3.5%) while Mäori and Others had very similar prevalences (5.7%
and 5.8%); Mäori and Pacific people had a higher prevalence of bipolar
disorder (3.4% and 2.7%) than Others (1.9%); and Mäori (6.0%) had a higher
prevalence of substance use disorders than Pacific people (3.2%) or Others
(3.0%).
3.1 Introduction
This chapter reports on 12-month prevalence for individual disorders and disorder
groups. The 12-month prevalence of a disorder is the proportion of the population who
have ever met criteria for a disorder and who have experienced symptoms or an episode
in the past 12 months (see 1.10.3 and 1.10.4). This is the period prevalence most
commonly reported in community surveys (Bijl et al 2003; Demyttenaere et al 2004;
Robins and Regier 1991). It is useful for health service planning. It also provides a
reasonable balance between recall requirements and the precision of prevalence
estimates (see 2.1). This is particularly important for estimating the prevalence of
individual disorders, some of which are uncommon.
Twelve-month Prevalence
38 � Te Rau Hinengaro: The New Zealand Mental Health Survey
Interference with life and severity are also reported for individual disorders. Secondary
analyses (Narrow et al 2002) of earlier surveys have suggested that many 12-month
cases are mild. Hence in the WMH-CIDI/CIDI 3.0 (Kessler and Ustun 2004), scales
were added to each disorder to measure impact in the past 12 months. A composite
measure of severity was developed to take account of all disorders experienced in that
period. Therefore, in New Zealand both interference with life and severity were
measured. Interference with life is reported for each disorder itself from answers to
questions about interference with home responsibilities, work or study, close
relationships and social life (see 12.12.2). In contrast, severity is defined for an
individual, not a disorder (see 2.3 and 12.12.3). When severity is reported for a
particular disorder it shows the overall levels of severity of people with that disorder,
including the impact of any comorbid disorders. It indicates the severity of the ‘cases’,
not the severity of the disorder.
Age and sex differences in prevalences of individual disorders are reported. Twelve-
month prevalence has been found to decrease with age (Kessler et al 1994; Myers et al
1984). While the overall rates of disorder are often similar for men and women, this
depends on what disorders are assessed. Men have been found to have higher
prevalence of substance use disorders, whereas women have higher prevalence of
depression and anxiety (Kohn et al 1998).
Ethnic differences, at least in the United States (US), have been somewhat inconsistent
across surveys (Breslau et al 2005; Kessler et al 1994). Non-Hispanic Blacks were
found to have lower rates of most disorders than Non-Hispanic Whites, which would
not be expected from their socioeconomic position. However, the results for Hispanics
were different across the surveys (the Epidemiologic Catchment Area Study compared
with the National Comorbidity Survey). In spite of these inconsistencies it is clear that
disadvantaged ethnic minorities do not necessarily have higher rates of disorder. In this
chapter ethnic comparisons are reported for disorder groups (anxiety disorders, mood
disorders and substance use disorders) without adjustment, with adjustment for age and
sex, and with adjustment for age, sex, educational qualifications and equivalised
household income. In addition, ethnic differences are reported for major depressive
disorder and bipolar disorder separately because of the different patterns shown for these
two mood disorders.
This chapter reports:
• 12-month prevalence overall and by age and by sex (see 3.2)
• 12-month prevalence and interference with life (see 3.3)
• 12-month prevalence and severity (see 3.4)
Twelve-month Prevalence
Te Rau Hinengaro: The New Zealand Mental Health Survey � 39
• 12-month prevalence and ethnicity (see 3.5)
• comparisons with other surveys (see 3.6).
3.2 Twelve-month prevalence overall and by age and by sex
3.2.1 Twelve-month prevalence overall
Table 3.1 shows that anxiety disorders (14.8%) were the most common disorder group,
followed by mood disorders (8.0%) and substance use disorders (3.5%), with a low
prevalence of eating disorders (0.5%). The prevalence of individual disorders ranged
from 7.3% for specific phobia to less than 0.1% for anorexia and varied several-fold
within each disorder group.
The most common anxiety disorders were specific phobia (7.3%) and social phobia
(5.1%). Agoraphobia without panic and obsessive–compulsive disorder (OCD) were
the least common (0.6%).
Major depressive disorder was the most common mood disorder (5.7%). A broad
definition of bipolar disorder was used (see 12.4.1). The diagnosis of bipolar disorder
was made on the basis of mania, hypomania or depression ever experienced: bipolar I
disorder required full criteria for mania to have been met at some time; bipolar II
disorder required hypomania and major depression. Bipolar subthreshold included
everyone else who had met criteria for hypomania without major depression. Bipolar
disorder in the past 12 months required an episode of mania, hypomania or depression
in that period. The 12-month prevalence of bipolar disorder of 2.2% can be subdivided
into bipolar I (0.6%; 0.5, 0.8), bipolar II (0.4%, 0.3, 0.6), and subthreshold (1.1%, 0.9,
1.4).
Alcohol disorders were more common than drug disorders. Alcohol abuse (2.6%) was
2.3 times more prevalent than drug abuse (1.2%) and alcohol dependence (1.3%) was
1.8 times more common than drug dependence (0.7%).
Expressing the prevalence of disorder as a percentage of users provides a different
perspective. Alcohol was used in the past 12 months by 79.1% and drugs by 13.7%.
Among those who drank alcohol in the past 12 months, 3.3% had alcohol abuse and
1.6% had dependence, whereas 8.1% of those who used drugs in that period had drug
abuse and 5.0% had drug dependence. Drug users were much more likely to experience
disorder than alcohol users, but alcohol caused more disorder in the population because
of its more widespread use.
Twelve-month Prevalence
40 � Te Rau Hinengaro: The New Zealand Mental Health Survey
Drug users tended to be young and male, both characteristics associated with abuse and
dependence of any substance. Everyone who used drugs in the past 12 months also used
alcohol, and these drug users experienced more alcohol abuse and dependence (12.7%,
6.5%) than drug abuse and dependence (8.1%, 5.0%). Therefore, these results show that
alcohol caused more disorder than did drugs both in the overall population and in the
subpopulation of drug users.
The prevalence of marijuana abuse and dependence was a little below that for drug
disorders, indicating that about 0.4% to 0.5% of the population had experienced drug
disorders without a marijuana disorder. Those with a marijuana disorder who also used
other drugs may or may not have met criteria for drug disorder because of their use of
other drugs as well as their use of marijuana; all that is known is that they were positive
for a drug diagnosis in general and for marijuana when asked about symptoms due
specifically to marijuana. Among those who used only marijuana in the past 12 months,
6.8% had marijuana abuse and 3.6% had marijuana dependence.
The prevalence of some disorders may have been underestimated. For alcohol and
separately for drugs, participants who did not report ever experiencing any symptom of
abuse were not asked dependence questions. A study by Hasin and Grant (2004)
suggests this will have resulted in underestimation. In 2005 the CIDI 3.0 was revised
because of concern about underestimation of OCD (WMH, personal communication).
The New Zealand interview was before this revision. The observed prevalence of
anorexia may have been particularly affected by refusal to participate or disclose. In
addition, the recency questions asked about when the participant was last at their lowest
weight and had problems. Someone currently at low weight with problems, but not at
their lowest weight, would not have been counted for 12-month prevalence.

Twelve-month Prevalence
Te Rau Hinengaro: The New Zealand Mental Health Survey � 41
Table 3.1: Twelve-month prevalence of mental disorders,1 overall and by age and by sex
Age group (years)
%
(95% CI)
Sex
%
(95% CI)
Disorder groups Total
%
(95% CI)
16–24 25–44 45–64 65 and
over
Male Female
Anxiety disorders
Panic disorder 1.7 (1.4, 1.9)
2.4 (1.7, 3.6)
2.1 (1.7, 2.6)
1.2 (0.9, 1.6)
0.6 (0.3, 1.1)
1.3 (1.0, 1.7)
2.0 (1.7, 2.4)
Agoraphobia without panic
0.6 (0.5, 0.8)
0.7 (0.3, 1.2)
0.8 (0.6, 1.2)
0.6 (0.3, 0.9)
0.2 (0.0, 0.5)
0.4 (0.3, 0.7)
0.8 (0.6, 1.1)
Specific phobia 7.3 (6.8, 7.8)
9.3 (7.6, 11.3)
8.3 (7.5, 9.3)
6.9 (6.0, 7.8)
3.2 (2.4, 4.3)
4.3 (3.7, 5.0)
10.1 (9.2, 10.9)
Social phobia 5.1 (4.6, 5.6)
7.0 (5.6, 8.8)
6.3 (5.6, 7.1)
4.2 (3.5, 5.1)
1.4 (1.0, 2.0)
4.5 (3.8, 5.2)
5.6 (5.0, 6.3)
Generalised anxiety disorder
2.0 (1.7, 2.3)
1.6 (0.9, 2.6)
2.8 (2.3, 3.4)
1.8 (1.3, 2.3)
1.0 (0.6, 1.5)
1.4 (1.1, 1.8)
2.6 (2.2, 3.1)
Post-traumatic stress disorder
2
3.0 (2.6, 3.4)
2.4 (1.6, 3.6)
3.5 (2.9, 4.3)
3.2 (2.5, 4.1)
1.7 (0.8, 3.0)
1.6 (1.1, 2.2)
4.2 (3.6, 4.9)
Obsessive–compulsive disorder
2
0.6 (0.4, 0.9)
1.5 (0.6, 3.0)
0.8 (0.5, 1.2)
0.2 (0.0, 0.4)
0.1 (0.0, 0.5)
0.7 (0.4, 1.2)
0.5 (0.3, 0.8)
Any anxiety disorder2 14.8
(13.9, 15.7) 17.7
(15.1, 20.6)18.2
(16.6, 19.9)13.2
(11.8, 14.7)6.0
(4.7, 7.6) 10.7
(9.5, 12.0) 18.6
(17.3, 20.0)
Mood disorders
Major depressive disorder
5.7 (5.2, 6.2)
8.7 (6.8, 11.0)
6.3 (5.6, 7.2)
5.2 (4.4, 6.2)
1.7 (1.2, 2.4)
4.2 (3.5, 5.0)
7.1 (6.3, 7.8)
Dysthymia 1.1 (0.9, 1.4)
1.5 (0.7, 2.6)
1.2 (0.9, 1.7)
1.2 (0.8, 1.6)
0.4 (0.2, 0.9)
1.0 (0.7, 1.4)
1.3 (1.0, 1.6)
Bipolar disorder 2.2 (1.9, 2.5)
3.9 (2.9, 5.4)
2.8 (2.3, 3.3)
1.4 (1.1, 1.9)
0.2 (0.1, 0.6)
2.1 (1.6, 2.6)
2.3 (1.9, 2.8)
Any mood disorder 8.0 (7.4, 8.6)
12.7 (10.4, 15.4)
9.2 (8.3, 10.2)
6.8 (5.9, 7.9)
2.0 (1.5, 2.7)
6.3 (5.5, 7.2)
9.5 (8.7, 10.5)
Substance use
disorders
Alcohol abuse 2.6 (2.3, 3.0)
7.1 (5.7, 8.9)
3.2 (2.6, 3.9)
0.8 (0.6, 1.2)
<0.1 (0.0, 0.2)
3.7 (3.1, 4.4)
1.6 (1.3, 2.1)
Alcohol dependence 1.3 (1.1, 1.5)
3.0 (2.2, 4.1)
1.7 (1.3, 2.2)
0.4 (0.2, 0.7)
<0.1 (0.0, 0.1)
1.7 (1.4, 2.2)
0.9 (0.6, 1.1)
Drug abuse 1.2 (0.9, 1.4)
3.8 (2.8, 5.1)
1.2 (0.9, 1.6)
0.2 (0.1, 0.5)
<0.1 (0.0, 0.1)
1.6 (1.2, 2.0)
0.8 (0.6, 1.1)
Drug dependence 0.7 (0.5, 0.9)
2.1 (1.3, 3.2)
0.9 (0.6, 1.2)
0.1 (0.0, 0.3)
<0.1 (0.0, 0.1)
1.1 (0.7, 1.5)
0.4 (0.2, 0.5)
Marijuana abuse3 0.9
(0.7, 1.1) 3.2
(2.3, 4.4) 0.9
(0.7, 1.3) 0.2
(0.1, 0.4) <0.1
(0.0, 0.1) 1.3
(0.9, 1.7) 0.6
(0.4, 0.9)
Marijuana dependence
3
0.5 (0.3, 0.6)
1.5 (0.9, 2.4)
0.6 (0.3, 0.9)
<0.1 (0.0, 0.2)
<0.1 (0.0, 0.1)
0.8 (0.5, 1.1)
0.2 (0.1, 0.3)
Any substance use disorder
3.5 (3.1, 4.0)
9.6 (7.9, 11.5)
4.2 (3.6, 5.0)
1.2 (0.9, 1.6)
<0.1 (0.0, 0.2)
5.0 (4.3, 5.8)
2.2 (1.8, 2.7)
Eating disorders
Anorexia nervosa2 <0.1
(0.0, 0.1) <0.1
(0.0, 0.3) <0.1
(0.0, 0.2) <0.1
(0.0, 0.1) <0.1
(0.0, 0.3) <0.1
(0.0, 0.1) <0.1
(0.0, 0.2)
Bulimia2 0.4
(0.3, 0.6) 0.6
(0.2, 1.3) 0.7
(0.4, 1.0) 0.3
(0.1, 0.6) 0.1
(0.0, 0.5) 0.3
(0.1, 0.5) 0.6
(0.4, 0.9)
Any eating disorder2 0.5
(0.3, 0.6) 0.6
(0.2, 1.3) 0.7
(0.4, 1.1) 0.3
(0.1, 0.6) 0.1
(0.0, 0.5) 0.3
(0.1, 0.5) 0.6
(0.4, 0.9)

Twelve-month Prevalence
42 � Te Rau Hinengaro: The New Zealand Mental Health Survey
Age group (years)
%
(95% CI)
Sex
%
(95% CI)
Disorder groups Total
%
(95% CI)
16–24 25–44 45–64 65 and
over
Male Female
Any disorder
Any disorder2 20.7
(19.5, 21.9) 28.6
(25.1, 32.3)25.1
(23.2, 27.1)17.4
(15.7, 19.2)7.1
(5.7, 8.8) 17.1
(15.5, 18.8) 24.0
(22.4, 25.6)
1 DSM-IV CIDI 3.0 disorders with hierarchy, see 12.4.1.
2 Assessed in the subsample who did the long form interview, see 12.4.2.
3 Those with marijuana disorder are a subgroup of those with drug use disorder. They may or may not have met criteria for abuse or dependence on other drugs.
3.2.2 Twelve-month prevalence, by age and by sex
Table 3.1 shows that the prevalence of any 12-month disorder declined across the age
groups from 28.6% in the youngest age group to 7.1% in the oldest age group. It also
shows that this pattern was seen within most individual disorders. The oldest age group
always had the lowest prevalence.
For anxiety disorders the pattern of a monotonic decline was clear (p < .0001) for panic
disorder, specific phobia, social phobia and OCD, with the youngest age group having
prevalences about three times higher than those of the oldest age group. However, the
prevalence of generalised anxiety disorder (GAD) was higher in the group aged 25–44
than in the youngest age group (2.8% compared with 1.6%; p < .02) and a similar trend
was seen for post-traumatic stress disorder (PTSD) (3.5% compared with 2.4%; p < .1).
Agoraphobia without panic differed little across the two youngest age groups (0.7%,
0.8%).
The prevalence of all three mood disorders also declined with age (p < .002 for all), with
a three-fold higher prevalence in the youngest age group relative to the oldest for
dysthymia, and a five-fold difference for major depressive disorder. For bipolar
disorder there was a similar decline in prevalence with age. Bulimia was uncommon in
all age groups but particularly in those aged 45 and over.
The 12-month prevalence of alcohol and drug disorders declined dramatically with age,
with very few cases among those aged 65 and over (p < .0001 for all). For example, for
alcohol abuse the prevalences were 7.1%, 3.2%, 0.8% and less than 0.1% across the four
age groups. For dependence, the decline with age may be exaggerated because of the
version of the CIDI interview used in New Zealand, which skipped dependence
questions if there were never symptoms of abuse. Therefore, as reported lifetime abuse
declined with age, older participants were less likely to be asked about dependence. For
drug dependence, the decline with age must also reflect the lower proportions who had
ever used drugs.

Twelve-month Prevalence
Te Rau Hinengaro: The New Zealand Mental Health Survey � 43
The overall prevalence of any 12-month disorder was higher for females than for males
(24.0% compared with 17.1%; p < .0001). However, in contrast to age, where a fairly
similar pattern was seen across disorders, sex predominance varied markedly across
disorders.
For all anxiety disorders except OCD females had significantly higher prevalences than
males. The ratio of prevalences was highest for specific phobia (10.1% compared with
4.3%; p < .0001) and PTSD (4.2% compared with 1.6%; p < .0001).
Within mood disorders two patterns of sex differences were found. Major depressive
disorder was much more common for females than for males (7.1% compared with
4.2%; p < .0001), whereas there were no significant differences between females and
males in the prevalence of dysthymia (1.3% compared with 1.0%; p = .2) or bipolar
disorder (2.3% compared with 2.1%; p = .5). Bulimia showed a higher prevalence for
females than for males (0.6% compared with 0.3%; p = .02).
For alcohol and drugs there was a clear and significant male predominance for abuse
and dependence, with males having prevalences around double those for females
(p < .0001 for all comparisons). For example, for any substance use disorder the
prevalence for males was 5.0% (4.3, 5.8) but 2.2% (1.8, 2.7) for females.
The joint effects of age and sex are such that overall prevalences can conceal markedly
higher prevalences in some subgroups. This is particularly true for substance use
disorders. The overall twelve-month prevalence of substance use disorder was 3.5% but
it was 12.5% (9.6, 15.4) in males aged 16–24 and in young Mäori males it was 22.0%
(14.8, 29.3).
3.3 Twelve-month prevalence and interference with life
Interference with life was assessed for each disorder over four domains (home
responsibilities, work or study, close relationships and social life) using a modified
version of the Sheehan Disability Scales (Demyttenaere et al 2001; Leon et al 1997).
At the end of each disorder section, participants who had experienced symptoms or
episodes in the past 12 months reported for the worst month in that period how much
that disorder had interfered with their life in each domain. The specific questions are in
12.12.2. The verbal descriptors and scores for interference with life were ‘none’ (0),
‘mild’ (1–3), ‘moderate’ (4–6), ‘severe’ (7–9) and ‘very severe’ (10). The interference
with life measure is specific to a particular disorder, in as much as people were able to
separate out what impact a single disorder had on their lives.
Twelve-month Prevalence
44 � Te Rau Hinengaro: The New Zealand Mental Health Survey
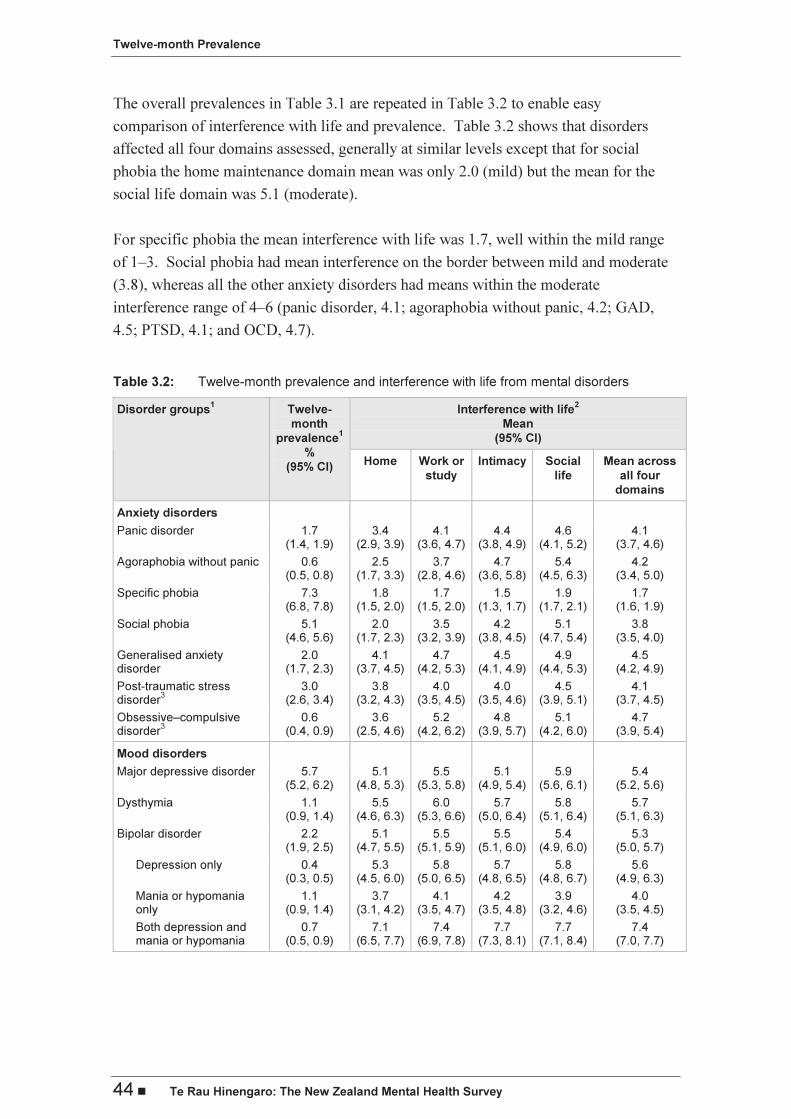
The overall prevalences in Table 3.1 are repeated in Table 3.2 to enable easy
comparison of interference with life and prevalence. Table 3.2 shows that disorders
affected all four domains assessed, generally at similar levels except that for social
phobia the home maintenance domain mean was only 2.0 (mild) but the mean for the
social life domain was 5.1 (moderate).
For specific phobia the mean interference with life was 1.7, well within the mild range
of 1–3. Social phobia had mean interference on the border between mild and moderate
(3.8), whereas all the other anxiety disorders had means within the moderate
interference range of 4–6 (panic disorder, 4.1; agoraphobia without panic, 4.2; GAD,
4.5; PTSD, 4.1; and OCD, 4.7).
Table 3.2: Twelve-month prevalence and interference with life from mental disorders
Interference with life2
Mean
(95% CI)
Disorder groups1 Twelve-
month
prevalence1
%
(95% CI) Home Work or
study
Intimacy Social
life
Mean across
all four
domains
Anxiety disorders
Panic disorder 1.7 (1.4, 1.9)
3.4 (2.9, 3.9)
4.1 (3.6, 4.7)
4.4 (3.8, 4.9)
4.6 (4.1, 5.2)
4.1 (3.7, 4.6)
Agoraphobia without panic 0.6 (0.5, 0.8)
2.5 (1.7, 3.3)
3.7 (2.8, 4.6)
4.7 (3.6, 5.8)
5.4 (4.5, 6.3)
4.2 (3.4, 5.0)
Specific phobia 7.3 (6.8, 7.8)
1.8 (1.5, 2.0)
1.7 (1.5, 2.0)
1.5 (1.3, 1.7)
1.9 (1.7, 2.1)
1.7 (1.6, 1.9)
Social phobia 5.1 (4.6, 5.6)
2.0 (1.7, 2.3)
3.5 (3.2, 3.9)
4.2 (3.8, 4.5)
5.1 (4.7, 5.4)
3.8 (3.5, 4.0)
Generalised anxiety disorder
2.0 (1.7, 2.3)
4.1 (3.7, 4.5)
4.7 (4.2, 5.3)
4.5 (4.1, 4.9)
4.9 (4.4, 5.3)
4.5 (4.2, 4.9)
Post-traumatic stress disorder
3 3.0
(2.6, 3.4) 3.8
(3.2, 4.3)4.0
(3.5, 4.5)4.0
(3.5, 4.6)4.5
(3.9, 5.1) 4.1
(3.7, 4.5)
Obsessive–compulsive disorder
3 0.6
(0.4, 0.9) 3.6
(2.5, 4.6)5.2
(4.2, 6.2)4.8
(3.9, 5.7)5.1
(4.2, 6.0) 4.7
(3.9, 5.4)
Mood disorders
Major depressive disorder 5.7 (5.2, 6.2)
5.1 (4.8, 5.3)
5.5 (5.3, 5.8)
5.1 (4.9, 5.4)
5.9 (5.6, 6.1)
5.4 (5.2, 5.6)
Dysthymia 1.1 (0.9, 1.4)
5.5 (4.6, 6.3)
6.0 (5.3, 6.6)
5.7 (5.0, 6.4)
5.8 (5.1, 6.4)
5.7 (5.1, 6.3)
Bipolar disorder 2.2 (1.9, 2.5)
5.1 (4.7, 5.5)
5.5 (5.1, 5.9)
5.5 (5.1, 6.0)
5.4 (4.9, 6.0)
5.3 (5.0, 5.7)
Depression only 0.4 (0.3, 0.5)
5.3 (4.5, 6.0)
5.8 (5.0, 6.5)
5.7 (4.8, 6.5)
5.8 (4.8, 6.7)
5.6 (4.9, 6.3)
Mania or hypomania only
1.1 (0.9, 1.4)
3.7 (3.1, 4.2)
4.1 (3.5, 4.7)
4.2 (3.5, 4.8)
3.9 (3.2, 4.6)
4.0 (3.5, 4.5)
Both depression and mania or hypomania
0.7 (0.5, 0.9)
7.1 (6.5, 7.7)
7.4 (6.9, 7.8)
7.7 (7.3, 8.1)
7.7 (7.1, 8.4)
7.4 (7.0, 7.7)

Twelve-month Prevalence
Te Rau Hinengaro: The New Zealand Mental Health Survey � 45
Interference with life2
Mean
(95% CI)
Disorder groups1 Twelve-
month
prevalence1
%
(95% CI) Home Work or
study
Intimacy Social
life
Mean across
all four
domains
Eating disorders
Anorexia3,4
< 0.1 (0.0, 0.1)
– – – – –
Bulimia3 0.4
(0.3, 0.6) 2.2
(1.2, 3.2)1.9
(1.1, 2.8)2.4
(1.4, 3.4)2.7
(1.7, 3.8) 2.3
(1.5, 3.1)
1 DSM-IV CIDI 3.0 disorders with hierarchy, see 12.4.1.
2 Based on Sheehan Disability Scales reported for an individual disorder, see 12.12.2.
3 Assessed in the subsample who did the long form of the interview, see 12.4.2.
4 A dash (–) in a cell indicates fewer than 30 with the disorder.
Within mood disorders all three disorders had means in the moderate interference range
(5.4, 5.7, 5.3). The moderate interference with life for dysthymia may have arisen from
major depressive episodes as these could not be distinguished from dysthymia in the past
12 months for those who had ever met criteria for both major depressive disorder and
dysthymia (see 12.4.1); 89.7% of those classified with 12-month dysthymia had also met
lifetime criteria for major depressive disorder. Those with 12-month dysthymia had a
mean interference with life of 5.9 (5.3, 6.5) if they had ever also had major depression
whereas those who had only ever had dysthymia had mean interference of 4.2 (3.0, 5.4).
Those with bipolar disorder were subdivided into those who experienced only depression
in the past 12 months, those who experienced only mania or hypomania, and those who
experienced both. Those with depression only had interference with life that was very
similar to that seen for people with major depressive disorder. Those with mania or
hypomania only were on the border between mild and moderate interference. Those who
had both highs and lows experienced significantly more interference with life than was
reported for any other disorder with a mean of 7.4, in the severe range of 7–9.
In the version of the interview used in New Zealand the Sheehan Disability Scales were
not used in the substance section, although they have since been added to the CIDI 3.0.
The impact of substance dependence was assessed separately for alcohol and for drugs.
Five consequences of drinking or of drug use were asked about over the past 12 months
with responses of ‘not at all’,’ a little’, ‘some’ and ‘a lot’ (see 12.12.2). These effects of
drinking and drug use are presented for alcohol dependence and for drug dependence in
Table 3.3. The full questions asked are given in 12.12.2.
Twelve-month Prevalence
46 � Te Rau Hinengaro: The New Zealand Mental Health Survey
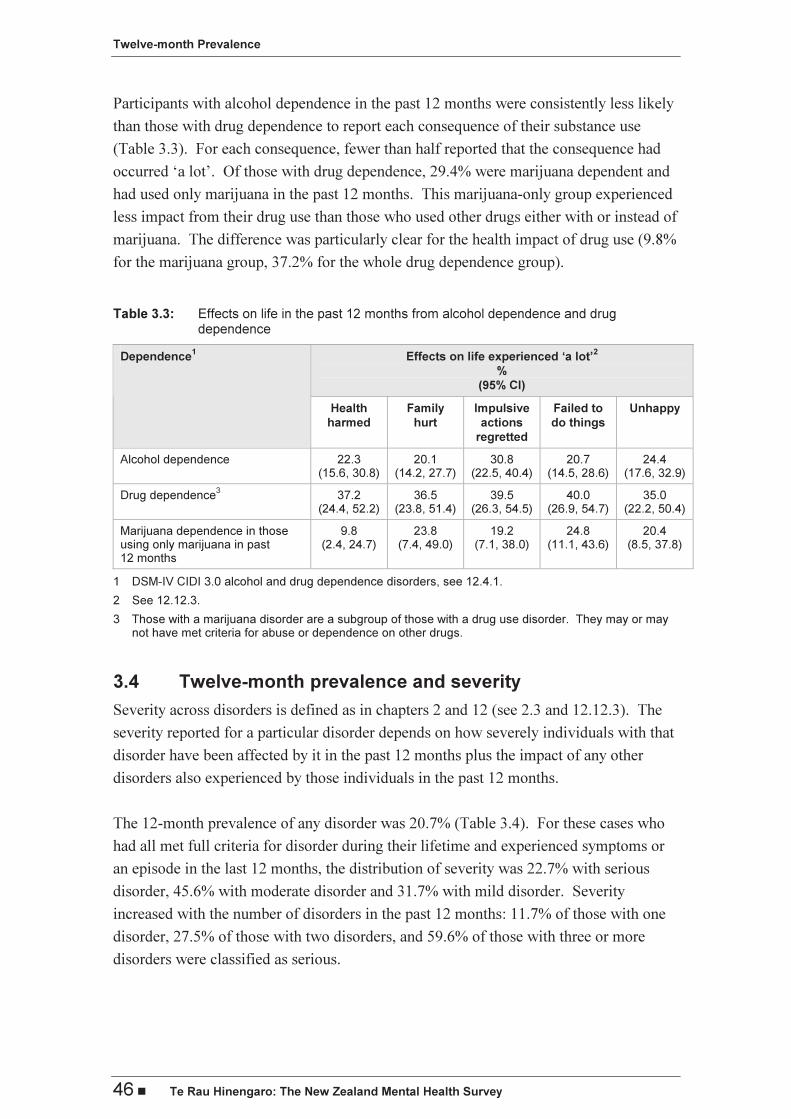
Participants with alcohol dependence in the past 12 months were consistently less likely
than those with drug dependence to report each consequence of their substance use
(Table 3.3). For each consequence, fewer than half reported that the consequence had
occurred ‘a lot’. Of those with drug dependence, 29.4% were marijuana dependent and
had used only marijuana in the past 12 months. This marijuana-only group experienced
less impact from their drug use than those who used other drugs either with or instead of
marijuana. The difference was particularly clear for the health impact of drug use (9.8%
for the marijuana group, 37.2% for the whole drug dependence group).
Table 3.3: Effects on life in the past 12 months from alcohol dependence and drug dependence
Effects on life experienced ‘a lot’2
%
(95% CI)
Dependence1
Health
harmed
Family
hurt
Impulsive
actions
regretted
Failed to
do things
Unhappy
Alcohol dependence 22.3 (15.6, 30.8)
20.1 (14.2, 27.7)
30.8 (22.5, 40.4)
20.7 (14.5, 28.6)
24.4 (17.6, 32.9)
Drug dependence3
37.2 (24.4, 52.2)
36.5 (23.8, 51.4)
39.5 (26.3, 54.5)
40.0 (26.9, 54.7)
35.0 (22.2, 50.4)
Marijuana dependence in those using only marijuana in past 12 months
9.8 (2.4, 24.7)
23.8 (7.4, 49.0)
19.2 (7.1, 38.0)
24.8 (11.1, 43.6)
20.4 (8.5, 37.8)
1 DSM-IV CIDI 3.0 alcohol and drug dependence disorders, see 12.4.1.
2 See 12.12.3.
3 Those with a marijuana disorder are a subgroup of those with a drug use disorder. They may or may not have met criteria for abuse or dependence on other drugs.
3.4 Twelve-month prevalence and severity
Severity across disorders is defined as in chapters 2 and 12 (see 2.3 and 12.12.3). The
severity reported for a particular disorder depends on how severely individuals with that
disorder have been affected by it in the past 12 months plus the impact of any other
disorders also experienced by those individuals in the past 12 months.
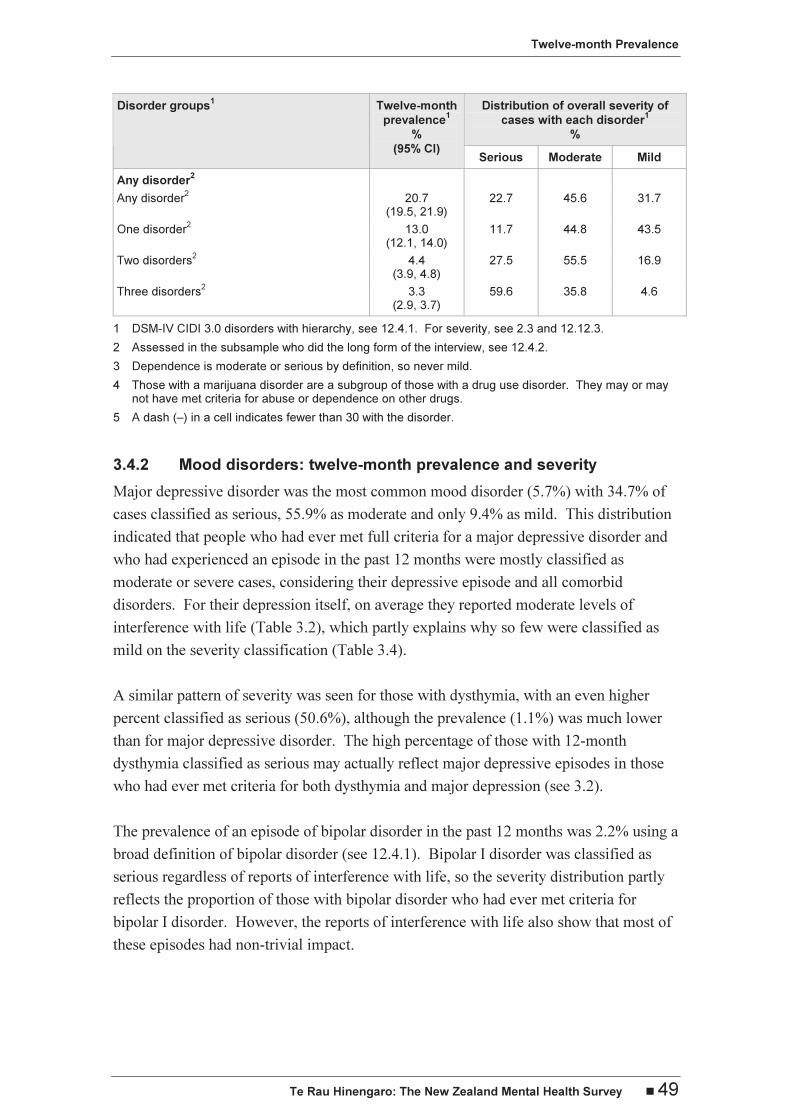
The 12-month prevalence of any disorder was 20.7% (Table 3.4). For these cases who
had all met full criteria for disorder during their lifetime and experienced symptoms or
an episode in the last 12 months, the distribution of severity was 22.7% with serious
disorder, 45.6% with moderate disorder and 31.7% with mild disorder. Severity
increased with the number of disorders in the past 12 months: 11.7% of those with one
disorder, 27.5% of those with two disorders, and 59.6% of those with three or more
disorders were classified as serious.

Twelve-month Prevalence
Te Rau Hinengaro: The New Zealand Mental Health Survey � 47
The rankings of disorders on the basis of interference with life from the disorder itself
(Table 3.2) and severity of cases (Table 3.4) are generally similar (r = 0.49 between
mean interference and percent serious). The only major exception occurred for bulimia,
which had a mean interference with life in the mild range (2.3) yet 47.8% of cases with
bulimia were classified as serious, indicating that for people with bulimia much of the
impact on their lives came from comorbid disorders rather than from bulimia itself.
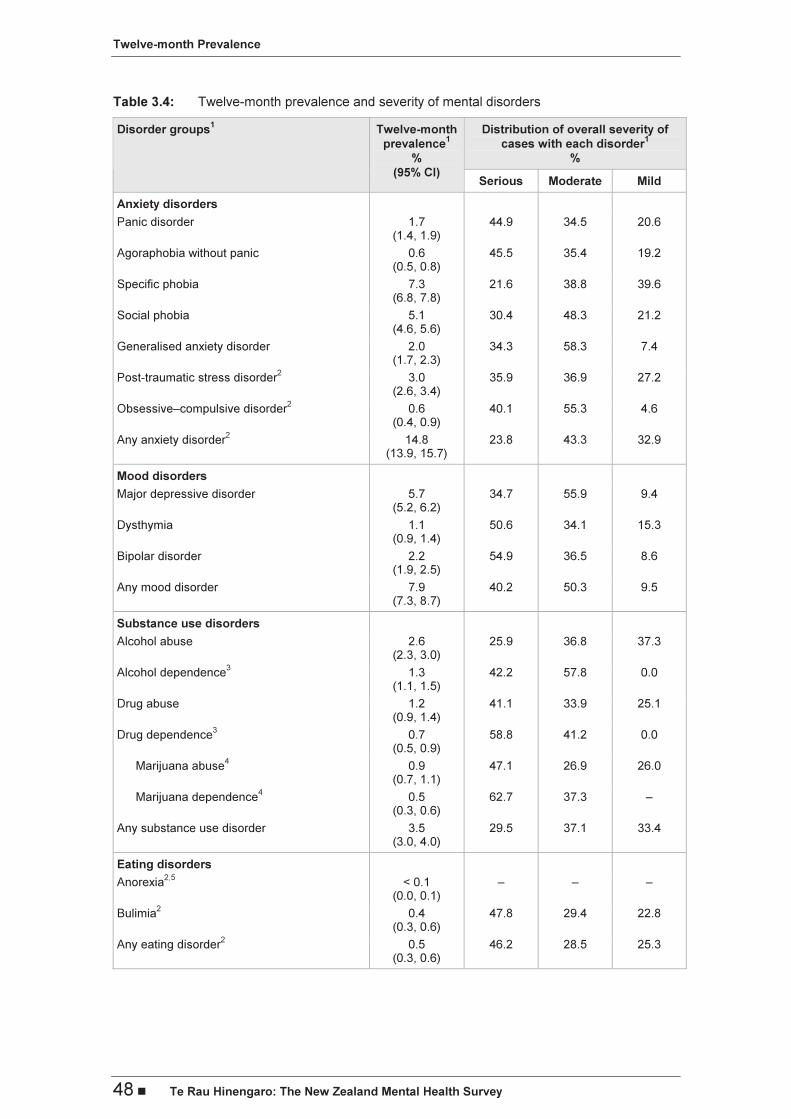
3.4.1 Anxiety disorders: twelve-month prevalence and severity
Cases with the most common disorder assessed in the survey, specific phobia, were
more likely to be mild cases (39.6%) than cases with any other disorder. Nonetheless,
21.6% of those with specific phobia were classified as serious cases; this arose because
specific phobia was often comorbid with other disorders (48.5% comorbid).
Social phobia had a prevalence of 5.1% and a mid-range severity distribution.
GAD and PTSD had similar prevalences (2.0% and 3.0%), very similar percentages of
cases with serious disorder (34.3% and 35.9%), but very different percentages who were
mild cases, with only 7.4% of GAD cases being mild whereas 27.2% of PTSD cases
were mild.
Panic disorder (1.7%), OCD (0.6%) and agoraphobia without panic (0.6%) were all
uncommon and serious, with 44.9%, 40.1% and 45.5% classified as serious cases. OCD
had the lowest percentage of cases classified as mild across all disorders (4.6%). We
have been advised by the World Mental Health (WMH) Data Coordinating Center at
Harvard University (January 2006) that clinical re-appraisals have indicated that the
version of the CIDI 3.0 we used underestimates the prevalence of OCD and that
consequently the OCD section was revised in 2005; it is likely that milder cases were
not detected in New Zealand.
Twelve-month Prevalence
48 � Te Rau Hinengaro: The New Zealand Mental Health Survey
Table 3.4: Twelve-month prevalence and severity of mental disorders
Distribution of overall severity of
cases with each disorder1
%
Disorder groups1 Twelve-month
prevalence1
%
(95% CI) Serious Moderate Mild
Anxiety disorders
Panic disorder 1.7 (1.4, 1.9)
44.9 34.5 20.6
Agoraphobia without panic 0.6 (0.5, 0.8)
45.5 35.4 19.2
Specific phobia 7.3 (6.8, 7.8)
21.6 38.8 39.6
Social phobia 5.1 (4.6, 5.6)
30.4 48.3 21.2
Generalised anxiety disorder 2.0 (1.7, 2.3)
34.3 58.3 7.4
Post-traumatic stress disorder2
3.0 (2.6, 3.4)
35.9 36.9 27.2
Obsessive–compulsive disorder2
0.6 (0.4, 0.9)
40.1 55.3 4.6
Any anxiety disorder2
14.8 (13.9, 15.7)
23.8 43.3 32.9
Mood disorders
Major depressive disorder 5.7 (5.2, 6.2)
34.7 55.9 9.4
Dysthymia 1.1 (0.9, 1.4)
50.6 34.1 15.3
Bipolar disorder 2.2 (1.9, 2.5)
54.9 36.5 8.6
Any mood disorder 7.9 (7.3, 8.7)
40.2 50.3 9.5
Substance use disorders
Alcohol abuse 2.6 (2.3, 3.0)
25.9 36.8 37.3
Alcohol dependence3
1.3 (1.1, 1.5)
42.2 57.8 0.0
Drug abuse 1.2 (0.9, 1.4)
41.1 33.9 25.1
Drug dependence3
0.7 (0.5, 0.9)
58.8 41.2 0.0
Marijuana abuse4 0.9
(0.7, 1.1) 47.1 26.9 26.0
Marijuana dependence4 0.5
(0.3, 0.6) 62.7 37.3 –
Any substance use disorder 3.5 (3.0, 4.0)
29.5 37.1 33.4
Eating disorders
Anorexia2,5
< 0.1 (0.0, 0.1)
– – –
Bulimia2
0.4 (0.3, 0.6)
47.8 29.4 22.8
Any eating disorder2
0.5 (0.3, 0.6)
46.2 28.5 25.3
Twelve-month Prevalence
Te Rau Hinengaro: The New Zealand Mental Health Survey � 49
Distribution of overall severity of
cases with each disorder1
%
Disorder groups1 Twelve-month
prevalence1
%
(95% CI) Serious Moderate Mild
Any disorder2
Any disorder2 20.7
(19.5, 21.9) 22.7 45.6 31.7
One disorder2 13.0
(12.1, 14.0) 11.7 44.8 43.5
Two disorders2 4.4
(3.9, 4.8) 27.5 55.5 16.9
Three disorders2 3.3
(2.9, 3.7) 59.6 35.8 4.6
1 DSM-IV CIDI 3.0 disorders with hierarchy, see 12.4.1. For severity, see 2.3 and 12.12.3.
2 Assessed in the subsample who did the long form of the interview, see 12.4.2.
3 Dependence is moderate or serious by definition, so never mild.
4 Those with a marijuana disorder are a subgroup of those with a drug use disorder. They may or may not have met criteria for abuse or dependence on other drugs.
5 A dash (–) in a cell indicates fewer than 30 with the disorder.
3.4.2 Mood disorders: twelve-month prevalence and severity
Major depressive disorder was the most common mood disorder (5.7%) with 34.7% of
cases classified as serious, 55.9% as moderate and only 9.4% as mild. This distribution
indicated that people who had ever met full criteria for a major depressive disorder and
who had experienced an episode in the past 12 months were mostly classified as
moderate or severe cases, considering their depressive episode and all comorbid
disorders. For their depression itself, on average they reported moderate levels of
interference with life (Table 3.2), which partly explains why so few were classified as
mild on the severity classification (Table 3.4).
A similar pattern of severity was seen for those with dysthymia, with an even higher
percent classified as serious (50.6%), although the prevalence (1.1%) was much lower
than for major depressive disorder. The high percentage of those with 12-month
dysthymia classified as serious may actually reflect major depressive episodes in those
who had ever met criteria for both dysthymia and major depression (see 3.2).
The prevalence of an episode of bipolar disorder in the past 12 months was 2.2% using a
broad definition of bipolar disorder (see 12.4.1). Bipolar I disorder was classified as
serious regardless of reports of interference with life, so the severity distribution partly
reflects the proportion of those with bipolar disorder who had ever met criteria for
bipolar I disorder. However, the reports of interference with life also show that most of
these episodes had non-trivial impact.

Twelve-month Prevalence
50 � Te Rau Hinengaro: The New Zealand Mental Health Survey
3.4.3 Substance use disorders: twelve-month prevalence and severity
Overall, cases with substance use disorders were about equally likely to be classified as
serious (29.5%), moderate (37.1%) and mild (33.4%). Alcohol disorders were more
common than drug disorders but were less likely to be classified as serious. By
definition, dependence could not be mild. The definition of serious disorder for
substance dependence (2.3, 12.12.3) was that developed for the US WMH survey, the
National Comorbidity Survey Replication (NCS-R) (Kessler et al 2005c), which
required substantial impairment in the past 12 months, not just physiological symptoms
ever as in the WMH definition. In New Zealand use of the NCS-R definition instead of
the WMH definition reduced the proportion whose substance dependence was classified
as serious from 90.4% to 25.7%, leaving the remainder with dependence classified as
moderate.
3.4.4 Eating disorders: twelve-month prevalence and severity
Eating disorders were uncommon, particularly anorexia. Participants reporting
symptoms of anorexia at any time nearly all reported that the last time when they were at
their lowest weight and had symptoms was some years ago, sometimes decades ago. It
is possible that some of them were still underweight and still had problems but were no
longer at their lowest weight. Because the recency question asked about when they were
last at their lowest weight they were not diagnosed with 12-month disorder.
Severe low prevalence disorders are always susceptible to non-response bias, both
because of refusal to participate or refusal to disclose symptoms in the interview. It is
not possible to assess the extent of such bias in this survey.
The prevalence of bulimia was 0.4%, with almost half (47.8%) classified as serious
cases. As their mean interference with life from bulimia was in the mild range (2.3, see
Table 3.2) much of this severity must come from comorbidity.
3.5 Ethnic comparisons of prevalence
Ethnic comparisons were carried out with the sequence of adjustments outlined in
chapter 2 (see 2.5) to account progressively for sociodemographic correlates. Technical
details are given in chapter 12 (see 12.10.2).
3.5.1 Ethnic comparisons for anxiety disorders
Table 3.5 shows that the prevalence of any anxiety disorder was highest for Mäori,
followed by Pacific people, with the lowest prevalence for the Other composite ethnic
group. The pattern was also seen for most individual disorders, and where it did not
hold the pattern was for Pacific people and Others to have similar prevalences.

Twelve-month Prevalence
Te Rau Hinengaro: The New Zealand Mental Health Survey � 51
Once the prevalence of any anxiety disorder was adjusted for age and sex, the
prevalence for Mäori and Pacific people decreased from the unadjusted prevalence,
whereas that for Others increased very slightly, showing that part of the differences in
prevalence between the ethnic groups was accounted for by a predominance of younger
people among Mäori and Pacific people. After further adjustment for socioeconomic
characteristics (education and income), the ethnic group differences were even smaller
and were no longer significant (p = .2).
Mäori carry a higher burden of anxiety disorders, but this is accounted for by age,
education and household income. For Pacific people the burden is not significantly
higher than for Others and after adjustment it is non-significantly lower.
Table 3.5: Ethnic comparisons of the 12-month prevalence of any anxiety disorder using prioritised ethnicity
Twelve-month prevalence of any anxiety disorder1,2
%
(95% CI)
Comparison3
Mäori Pacific Other
Unadjusted 19.4 (17.1, 21.7)
16.3 (13.8, 18.9)
14.1 (13.0, 15.1)
Adjusted for age and sex 17.6 (15.4, 19.7)
14.8 (12.4, 17.3)
14.4 (13.3, 15.5)
Adjusted for age, sex, educational qualifications
4 and equivalised household
income4
15.6 (13.6, 17.6)
12.9 (10.6, 15.1)
14.8 (13.7, 15.9)
1 DSM-IV CIDI 3.0 anxiety disorders, see 12.4.1.
2 Assessed in the subsample who did the long form of the interview, see 12.4.2.
3 For the method of adjustment, see 12.10.2.
4 Sociodemographic correlates are defined in 12.12.1.
3.5.2 Ethnic comparisons for mood disorders
Comparison of prevalences for individual mood disorders across the three ethnic groups
showed that aggregating across disorders concealed some different trends, so Table 3.6
presents results not just for any mood disorder but also for major depressive disorder
and bipolar disorder separately.
The prevalence of major depressive disorder was lowest for Pacific people for all three
types of comparison, with the difference between Pacific people and Others increasing
with each adjustment. The unadjusted prevalence for Mäori was significantly higher
than for Pacific people (p = .01) and marginally significantly higher than for Others
(p = .06). After full adjustment, prevalences for Mäori and Others were the same and
both were significantly higher than for Pacific people (p ≤.003).

Twelve-month Prevalence
52 � Te Rau Hinengaro: The New Zealand Mental Health Survey
For bipolar disorder Mäori had the highest prevalence, followed by Pacific people, with
both higher than Others for all types of comparison (p ≤ .008 overall, p ≤.006 for Mäori,
p ≤ .06 for Pacific). The difference between Mäori and Pacific people was not
significant with or without adjustment (p ≤ .3).
Table 3.6: Ethnic comparisons of the 12-month prevalence of mood disorders using prioritised ethnicity
Twelve-month prevalence of disorder
%
(95% CI)
Comparison1
Mäori Pacific Other
Any mood disorder2
Unadjusted 11.6 (10.1, 13.2)
8.3 (6.6, 10.0)
7.5 (6.8, 8.2)
Adjusted for age and sex 10.1 (8.8, 11.5)
7.2 (5.8, 8.7)
7.7 (6.9, 8.4)
Adjusted for age, sex, educational qualifications3 and
equivalised household income3
9.3 (8.0, 10.6)
6.4 (5.1, 7.8)
7.9 (7.1, 8.6)
Major depressive disorder
Unadjusted 6.9 (5.7, 8.1)
4.4 (3.0, 5.8)
5.6 (5.0, 6.2)
Adjusted for age and sex 6.0 (5.0, 7.1)
3.9 (2.7, 5.1)
5.7 (5.1, 6.4)
Adjusted for age, sex, education qualifications3 and
equivalised household income3
5.7 (4.7, 6.6)
3.5 (2.4, 4.6)
5.8 (5.2, 6.5)
Bipolar disorder
Unadjusted 4.6 (3.6, 5.6)
3.7 (2.7, 4.7)
1.8 (1.4, 2.1)
Adjusted for age and sex 3.9 (3.0, 4.7)
3.1 (2.2, 4.0)
1.8 (1.5, 2.2)
Adjusted for age, sex, educational qualifications3 and
equivalised household income3
3.4 (2.7, 4.2)
2.7 (1.9, 3.6)
1.9 (1.5, 2.3)
1 For the method of adjustment, see 12.10.2.
2 DSM-IV CIDI 3.0 mood disorders, see 12.4.1.
3 Sociodemographic correlates are defined in 12.12.1.
3.5.3 Ethnic comparisons for substance use disorders
The prevalences of abuse and dependence for alcohol and for drugs were all highest for
Mäori, intermediate for Pacific and lowest for Others.
However, for alcohol diagnoses (abuse or dependence) the Pacific prevalence (4.2%)
was midway between that for Mäori (7.4%) and that for Others (2.2%), whereas for drug
diagnoses the Pacific prevalence (1.3%) was only slightly and non-significantly higher
than that for Others (1.0%) and well below that for Mäori (4.0%). Table 3.7 presents
the ethnic comparisons for any substance use disorder.
Twelve-month Prevalence
Te Rau Hinengaro: The New Zealand Mental Health Survey � 53
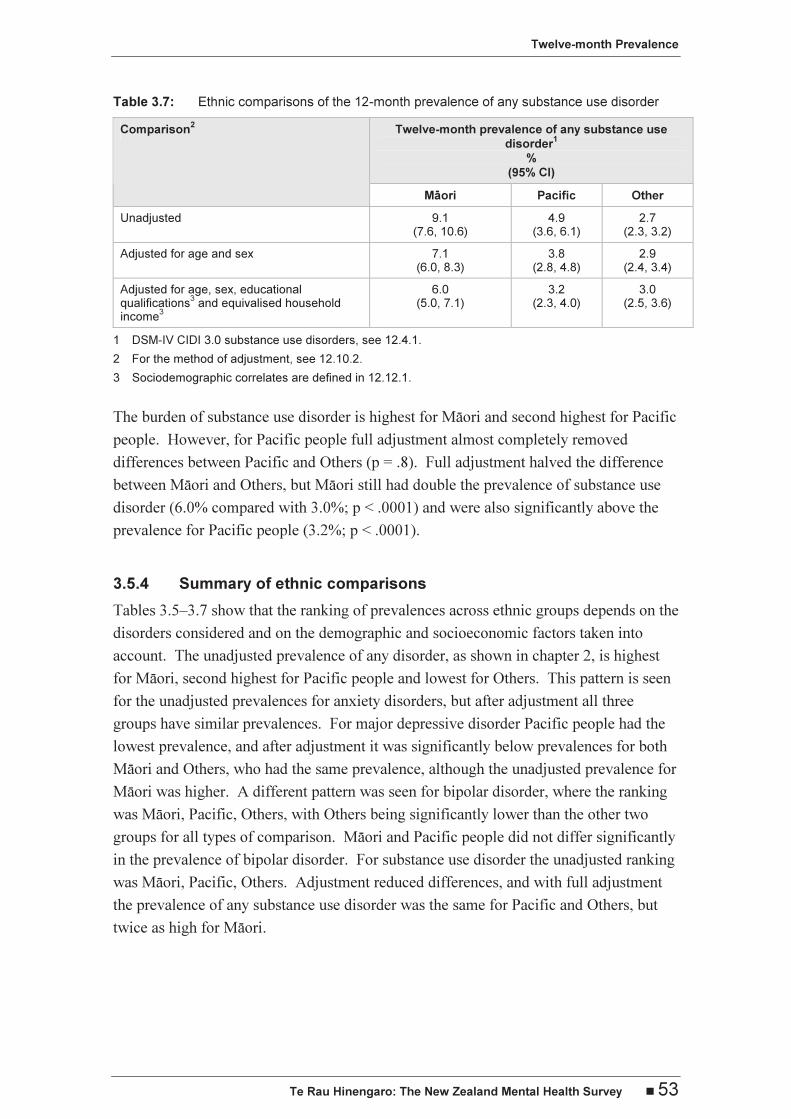
Table 3.7: Ethnic comparisons of the 12-month prevalence of any substance use disorder
Twelve-month prevalence of any substance use
disorder1
%
(95% CI)
Comparison2
Mäori Pacific Other
Unadjusted 9.1 (7.6, 10.6)
4.9 (3.6, 6.1)
2.7 (2.3, 3.2)
Adjusted for age and sex 7.1 (6.0, 8.3)
3.8 (2.8, 4.8)
2.9 (2.4, 3.4)
Adjusted for age, sex, educational qualifications
3 and equivalised household
income3
6.0 (5.0, 7.1)
3.2 (2.3, 4.0)
3.0 (2.5, 3.6)
1 DSM-IV CIDI 3.0 substance use disorders, see 12.4.1.
2 For the method of adjustment, see 12.10.2.
3 Sociodemographic correlates are defined in 12.12.1.
The burden of substance use disorder is highest for Mäori and second highest for Pacific
people. However, for Pacific people full adjustment almost completely removed
differences between Pacific and Others (p = .8). Full adjustment halved the difference
between Mäori and Others, but Mäori still had double the prevalence of substance use
disorder (6.0% compared with 3.0%; p < .0001) and were also significantly above the
prevalence for Pacific people (3.2%; p < .0001).
3.5.4 Summary of ethnic comparisons
Tables 3.5–3.7 show that the ranking of prevalences across ethnic groups depends on the
disorders considered and on the demographic and socioeconomic factors taken into
account. The unadjusted prevalence of any disorder, as shown in chapter 2, is highest
for Mäori, second highest for Pacific people and lowest for Others. This pattern is seen
for the unadjusted prevalences for anxiety disorders, but after adjustment all three
groups have similar prevalences. For major depressive disorder Pacific people had the
lowest prevalence, and after adjustment it was significantly below prevalences for both
Mäori and Others, who had the same prevalence, although the unadjusted prevalence for
Mäori was higher. A different pattern was seen for bipolar disorder, where the ranking
was Mäori, Pacific, Others, with Others being significantly lower than the other two
groups for all types of comparison. Mäori and Pacific people did not differ significantly
in the prevalence of bipolar disorder. For substance use disorder the unadjusted ranking
was Mäori, Pacific, Others. Adjustment reduced differences, and with full adjustment
the prevalence of any substance use disorder was the same for Pacific and Others, but
twice as high for Mäori.

Twelve-month Prevalence
54 � Te Rau Hinengaro: The New Zealand Mental Health Survey
3.6 Comparisons with other surveys
The prevalence of any psychiatric disorder reported from a survey depends on the
definition used for the disorder, the instrument used to measure it and the response rate,
as well as level of morbidity in the population. Therefore, comparisons of prevalence
rates from various surveys must be made with due consideration of all these factors.
Results from other WMH Survey Initiative countries are the most comparable with
those from New Zealand, as they used the same interview (CIDI 3.0), the same DSM-IV
criteria and the same algorithms to calculate diagnoses. New Zealand has high
12-month prevalences of anxiety, mood and substance use disorders relative to the
15 sites reported in 2004 (Demyttenaere et al 2004). For anxiety, New Zealand was
second to the US (14.7% compared with 18.2%), whereas for mood disorders the US,
the Ukraine and France had higher prevalences (9.6% for the US; 9.1% for the Ukraine
without bipolar disorder; 8.5% for France without bipolar disorder; 7.7% for New
Zealand).
For substance use disorder the Ukraine, which did not assess drug disorder, still had a
substantially higher prevalence (6.4%) than New Zealand (3.5%), with the US (3.8%)
non-significantly higher than New Zealand.
Prevalences for individual disorders are available for the US (Kessler et al 2005c) and
for the six European sites in the European Study of the Epidemiology of Mental
Disorders (ESEMeD) combined (Alonso et al 2004b). For every disorder assessed at
both sites, New Zealand had a slightly lower prevalence than the US, except for alcohol
dependence (1.3% for both) and drug dependence (0.7% compared with 0.4%, p≈ .05).
Comparisons with the six European countries showed New Zealand had higher
prevalences for major depressive disorder (5.7% compared with 3.9%), GAD (2.0%
compared with 1.0%), social phobia (5.1% compared with 1.2%), specific phobia (7.3%
compared with 3.5%), panic disorder (1.4% compared with 0.8%), alcohol abuse (2.6%
compared with 0.7%) and alcohol dependence (1.3% compared with 0.3%). However,
given the variation in prevalence for disorder groups across the ESEMeD countries
(Demyttenaere et al 2004), it is not straightforward to interpret the prevalences for
individual disorders that have been combined across countries. The response rates in
the ESEMeD countries varied from 46% in France to 79% in Spain, which may have
introduced bias into prevalence estimates from those countries with a low response rate.
The response rates for New Zealand and the US were 73% and 71%.
Twelve-month Prevalence
Te Rau Hinengaro: The New Zealand Mental Health Survey � 55
The 1997 Australian National Survey of Mental Health and Well-being (Andrews et al
2001) used a variant form of the CIDI interview that asked only about the past
12 months. A diagnosis was given only if all criteria were met within the past
12 months. All other versions of the CIDI ask about all of life before interview and
then, for each disorder, ask how recently symptoms or episodes had occurred. Full
criteria for a diagnosis may not have been met within the past 12 months. Therefore, the
New Zealand and Australian 12-month prevalences are ascertained in different ways.
Although the 12-month prevalences are very similar for many disorders, social phobia
and PTSD were more common in New Zealand than in Australia (5.1% compared with
1.3% for social phobia; 3.0% compared with 1.3% for PTSD). It is likely that these
differences reflect changes made to these sections in the interview, particularly to the
PTSD section, as well as the need to meet full criteria in the past 12 months in Australia.
The prevalence of DSM-IV alcohol dependence was 4.1% in the Australian study, but
only 1.3% in New Zealand. As Australia and New Zealand have similar per capita
consumption and patterns of drinking (Rehm et al 2004: Table 12.3; WARC 2004) this
difference is unexpected. The skip past dependence in the New Zealand interview may
have resulted in dependence being underestimated, but this is unlikely to account all of
the difference. Hasin and Grant (2004), using the AUDADIS-IV interview, found that
13.9% of those with lifetime alcohol dependence did not ever have alcohol abuse.
Applying such a correction would increase the lifetime prevalence of alcohol
dependence in New Zealand from 4.0% to 4.6%. Even if all those ever dependent
without abuse were still dependent in the past 12 months this would raise the New
Zealand prevalence only from 1.3% to 1.9%. It seems likely that the higher estimates of
12-month prevalence from the AUDADIS-IV of 3.8% and the CIDI 2.1 estimate of
4.1% arose because both interviews asked more specific questions.
The only previous New Zealand community-wide survey was the Christchurch
Psychiatric Epidemiology Study (CPES) (see 1.7.2) (Oakley Browne et al 1989; Wells
et al 1989a), which interviewed people aged 18–64, not 16 years and over as in the
present survey. The CPES used the Diagnostic Interview Schedule on which the first
CIDI interview was based. At that time DSM-III criteria were used for diagnosis and
there are many differences between DSM-III and DSM-IV diagnoses. One consistent
difference is that DSM-IV has a requirement for ‘substantial impairment’ in many
diagnoses. Therefore, this could reduce prevalence, as appears to have happened for
GAD (12.7% compared with 2.0%).
Twelve-month Prevalence
56 � Te Rau Hinengaro: The New Zealand Mental Health Survey
Diagnostic changes are particularly marked for substance abuse and dependence. In
DSM-III, abuse is much closer to a lay concept of abuse and consists of a considerable
list of symptoms of excessive use, any of which results in diagnosis. In DSM-IV, abuse
requires repeated failure to meet obligations, continued use despite repeated arguments
with family, friends or workmates, repeated use in situations where use could be
dangerous, or repeated contact with police. Dependence has been broadened as a
concept (Sellman 1994) but now requires that at least three symptoms must have
occurred within one year. In addition, within the version of the CIDI 3.0 used in Te Rau
Hinengaro, dependence may have been underestimated because of the failure to assess
dependence in those who did not ever meet criteria for abuse. The 12-month prevalence
of alcohol abuse or dependence was 9.3% in the CPES and 2.9% in the present survey.
In spite of all the technical reasons for an apparent decline in prevalence a real decline
may have occurred. In 1986 per capita alcohol consumption for those aged 15 and over
was 11.3 litres per year. In 2004 it was 18% lower at 9.2 litres per year, having declined
fairly steadily throughout the 1980s and 1990s until 1997, since when it has fluctuated
slightly or risen a little (http://www.stats.govt.nz/).
3.7 Conclusions
The prevalences of 12-month disorders from this national New Zealand survey, Te Rau
Hinengaro, were lower than those from the US but higher than those for most other
countries. Prevalences declined with age for almost all disorders. Females had higher
prevalences of anxiety and depression but males and females were equally likely to
experience OCD, dysthymia and bipolar disorder. Males had double the prevalence of
substance use disorders compared with females.
Across disorders the general pattern was for Mäori to have the highest prevalence,
followed by Pacific people, with the lowest prevalence for Others. However this pattern
changed after adjustment for sociodemographic correlates. The ethnic differences that
could not be accounted for by age, sex, educational qualifications and equivalised
household income were bipolar disorder (higher for Mäori and Pacific people) and
substance use disorder (higher for Mäori). For depression Mäori and Others had the
same prevalence after adjustment, but Pacific people had a lower prevalence.
Most people with disorder were classified as serious or moderate rather than mild.
Reports of interference with life were higher for mood disorders than for anxiety
disorders.