Embed Size (px)
DESCRIPTION
Vol. 28 No.3 September 2013
Citation preview

Vol. 28 No. 3 Thailand Development Research Institute September 2013
Contents
Thailand’s Economic Growth after 1992: Was that Growth Pro-poor?
by Kittipong Rueanthip, Jirawat Panpiemras, and Nonarit Bisonyabut 3
Thailand in the AEC: Myths, Realities, Opportunities, and Challenges
by Somkiat Tangkitvanich, Saowaruj Rattanakhamfu, Sunthorn Tunmuntong, and
Ploy Thammapiranon 10
It has been widely accepted among academics and policymakers that economic growth is necessary for sustainable poverty reduction. However, the important question is how much the poor benefits from it as compared to the non-poor. See related article on page 3. ISSN 0857-2968

2 TDRI Quarterly Review Vol. 28 No. 3
TDRI Council of Trustees and Board of Directors
* Mr. Kosit Panpiemras Chairman
TDRI Council of Trustees and Board of Directors; and Executive Chairman
Bangkok Bank Public Company Limited
* Dr. Ammar Siamwalla Vice Chairman
TDRI Council of Trustees and Board of Directors; and Distinguished Scholar
* Dr. Anat Arbhabhirama Director and Advisor to the
Board of Directors Bangkok Mass Transit System Public Company Limited
* Mr. Apilas Osatananda Chairman
Development Cooperation Foundation
* Dr. Bandid Nijthaworn President and CEO
Thai Institute of Directors Association
* Mr. Banyong Pongpanich Chairman
Phatra Securities Public Company Limited
H.E. Mr. Philip Calvert Ambassador of Canada to Thailand
M.R. Chatu Mongol Sonakul Chairman
M.T.R. Asset Managers Company Limited
Dr. Chirayu Isarangkun Na Ayuthaya Director-General The Crown Property Bureau Mr. Isara Vongkusolkit Chairman, Mitr Phol Group * Dr. Juree Vichit-Vadakan Chairperson, Center for Philanthropy
and Civil Society National Institute of Development Administration (NIDA)
* Dr. Kessara Thanyalakpark Assistant Professor
Faculty of Commerce and Accountancy Chulalongkorn University Mr. Teisuke Kitayama Chairman of the Board
Sumitomo Mitsui Banking Corporation, Japan
* Ms. Kobkarn Wattanavrangkul Chairperson
Toshiba Thailand Company Limited * Dr. Kobsak Pootrakool Executive Vice President Bangkok Bank Public Company
Limited
Mr. Mechai Viravaidya Chairman, Population and Community
Development Association
* Dr. Narongchai Akrasanee Chairman of the Board of Directors
Seranee Group
Dr. Pasuk Phongpaichit Professor, Faculty of Economics
Chulalongkorn University Dr. Piyasvasti Amranand Chairman
Energy for Environment Foundation * Dr. Pranee Tinakorn Professor of Economics
Faculty of Economics Thammasat University
H.E. Mr. Shigekazu Sato Ambassador of Japan to Thailand
* Dr. Snoh Unakul Chairman
TDRI Foundation
* Dr. Somkiat Tangkitvanich President, TDRI
Mr. Sompop Amatayakul President B.B. Business Management Co., Ltd.
* Dr. Twatchai Yongkittikul Secretary-General The Thai Bankers’ Association
* Dr. Virabongsa Ramangkura Chairman of the Executive Board Double A (1991) Public Company
Limited
* Prof. Dr. Yongyuth Yuthavong Senior Advisor to President
National Science and Technology Development Agency
* Indicates membership on the TDRI Board of Directors.
The Thailand Development Research Institute Foundation was established in 1984 to conduct policy research and disseminate results to the public and private sectors. TDRI was conceived, created and registered as a non-profit, non-governmental foundation, and is recognized as such by the Royal Thai Government. The Institute does technical and policy analyses to support the formulation of policies with long-term implications for sustaining social and economic development. TDRI has six research programs: Human Resources and Social Development, International Economic Relations, Macroeconomic Policy, Natural Resources and Environment, Science and Technology Development, and Sectoral Economics.
Caption: Nujpanit Narkpitaks Editor: John Loftus
Assistant: Wattana Kanchananit Head of Publications Unit: Jirakorn Yingpaiboonwong
September 2013 TDRI Quarterly Review 3
Thailand’s Economic Growth after 1992: Was that Growth Pro-poor?
Kittipong Rueanthip Jirawat Panpiemras Nonarit Bisonyabut*
* Mr. Kittipong Rueanthip, former TDRI researher, is a Ph.D. student in School of Economics at University of the Thai
Chamber of Commerce ([email protected]); Dr. Jirawat Panpiemras is Research Fellow, International Economic Relations Program; and Dr. Nonarit Bisonyabut is Research Fellow, Macroeconomic Policy Program, TDRI. The authors would like to thank Ms. Jiraporn Plangpraphan, a TDRI senior researcher, for support contributed in the preparation of this paper.
1. INTRODUCTION AND CONCEPT OF PRO-POOR GROWTH
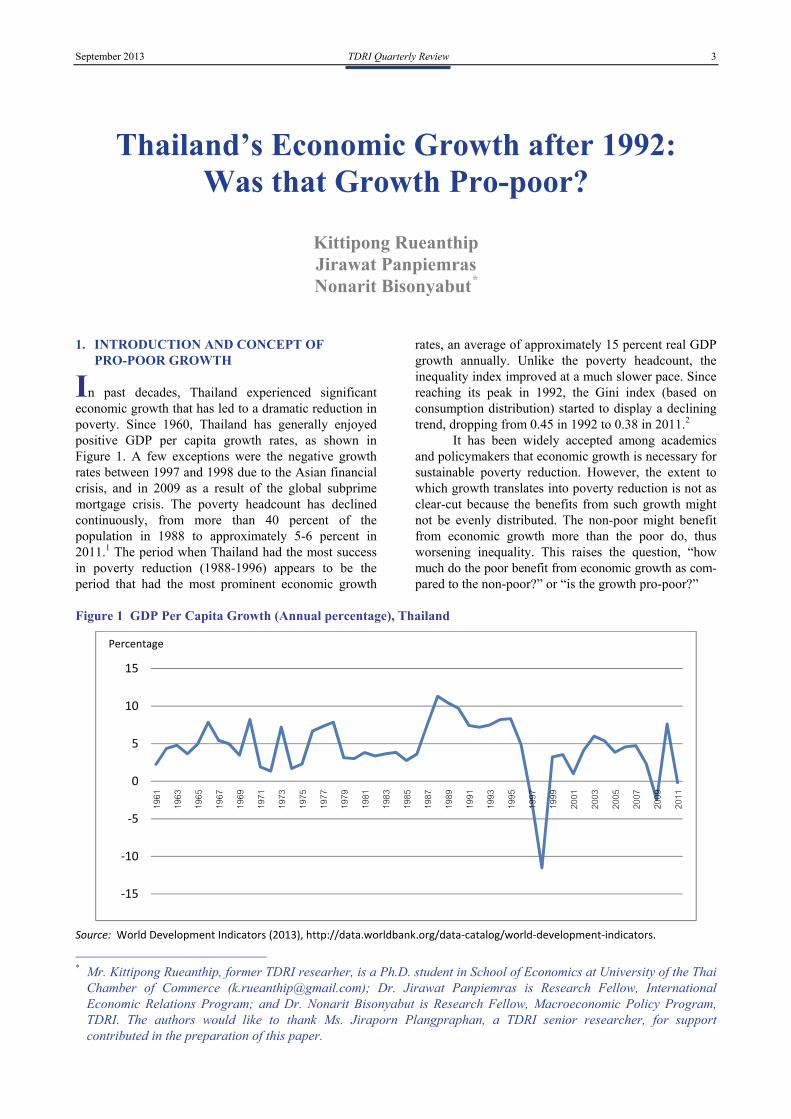
In past decades, Thailand experienced significant economic growth that has led to a dramatic reduction in poverty. Since 1960, Thailand has generally enjoyed positive GDP per capita growth rates, as shown in Figure 1. A few exceptions were the negative growth rates between 1997 and 1998 due to the Asian financial crisis, and in 2009 as a result of the global subprime mortgage crisis. The poverty headcount has declined continuously, from more than 40 percent of the population in 1988 to approximately 5-6 percent in 2011.1 The period when Thailand had the most success in poverty reduction (1988-1996) appears to be the period that had the most prominent economic growth
rates, an average of approximately 15 percent real GDP growth annually. Unlike the poverty headcount, the inequality index improved at a much slower pace. Since reaching its peak in 1992, the Gini index (based on consumption distribution) started to display a declining trend, dropping from 0.45 in 1992 to 0.38 in 2011.2
It has been widely accepted among academics and policymakers that economic growth is necessary for sustainable poverty reduction. However, the extent to which growth translates into poverty reduction is not as clear-cut because the benefits from such growth might not be evenly distributed. The non-poor might benefit from economic growth more than the poor do, thus worsening inequality. This raises the question, “how much do the poor benefit from economic growth as com- pared to the non-poor?” or “is the growth pro-poor?”
Figure 1 GDP Per Capita Growth (Annual percentage), Thailand
Source: World Development Indicators (2013), http://data.worldbank.org/data‐catalog/world‐development‐indicators.
‐15
‐10
‐5
0
5
10
15
1961
1963
1965
1967
1969
1971
1973
1975
1977
1979
1981
1983
1985
1987
1989
1991
1993
1995
1997
1999
2001
2003
2005
2007
2009
2011
Percentage
4 TDRI Quarterly Review Vol. 28 No. 3
Ravallion (2004) pointed out that there are two different definitions of pro-poor growth in the literature and policy-oriented dialogues. First, for growth to be called “pro-poor,” the welfare of the poor should improve at a higher rate than that of the non-poor. On the contrary, a recession (a period with negative growth) would be called “pro-poor” if the welfare of the poor drops proportionately less than that of the non-poor. This is the definition that we use throughout this paper. It should be noted that, under the above defini- tion, even when growth generates large absolute gains in welfare to the poor, such growth would not be consi- dered as pro-poor if the received welfare gain is rela- tively less than that of the non-poor or average growth rate. The second definition defines pro-poor growth as growth that reduces poverty, completely ignoring how the poor benefit from growth compared with the non-poor. Using a method proposed by Ravallion and Chen (2003), the authors attempt to find evidence of pro-poor growth in Thailand from 1992 to 2011, the periods with a decreasing trend in the Gini index.
The paper begins with a brief discussion of our welfare indicators in section 2. In section 3, growth is shown to be an important contributor to poverty reduction by decomposing the change in poverty from 1992 to 2011 into three components: the change in mean income/consumption growth, the change in inequality, and the change in poverty lines. In section 4, a framework is presented that was used to quantitatively measure pro-poor growth. In section 5, pro-poor growth in Thailand during the period 1992-2011 is analyzed. Section 6 concludes the paper.
2. WELFARE MEASUREMENT How to properly measure welfare is a subject
that has been widely discussed for years. There are two common indicators for measuring welfare: income and consumption. Meyer and Sullivan (2003, 2013) con- ducted an extensive literature survey and found that most of the surveyed papers favored consumption over income. According to the World Bank, provided that the information on consumption had been obtained from a sufficiently detailed household survey, consumption would be a better indicator than income for poverty measurement.3 The reasons are as follows. First, con- sumption is more closely related than income to a per- son’s well-being in the sense of having enough to meet basic needs. Second, consumption may be measured more accurately than income because income flows may
be erratic and fluctuate during the year. Last, consump- tion may better reflect standards of living compared with income since it reflects not only the goods and services that a household consumes given their current income, but also its access to credit markets or household savings. In following the major literature, we have chosen consumption as our welfare measure. We also perform analyses based on the income measure in order to see whether our results are sensitive to the choice of welfare indicators. The results based on income will be provided only if they are quantitatively different than those generated from consumption.
3. POVERTY DECOMPOSITION Using a method proposed by Kolenikov and
Shorrocks (2005), the change in poverty from 1992 to 2011 can be decomposed into three components: the change due to mean income/consumption growth, the change due to change in inequality, and the change due to change in poverty lines. The three components affect poverty in the following ways. Suppose that there is no change in the distribution of consumption and the poverty line, mean consumption growth would shift the whole consumption distribution to the right and reduce the poverty headcount. If the mean income and the poverty line are constant, an increase in inequality could thicken the left tail of the consumption distribution and result in a higher poverty headcount. Last, if other things remain constant, an increase in the poverty line will increase the poverty headcount. It should be noted that the national poverty line has been adjusted annually and has moved up continuously from 633 baht per month in 1988 to 1,781 baht per month in 2011.4 Consequently, if other things remain the same, the change in the national poverty line will result in a continuous increase in the poverty headcount. The decomposition results are shown in Table 1. Both poverty line and consumption used in the calculation are in real terms.
From 1992 to 2011, the poverty headcount (consumption) decreased by almost 23 percent. If the consumption distribution and the poverty line are held constant, the increase in the mean consumption alone would reduce the headcount by 22.17 percent. The change in consumption distribution alone would de- crease the headcount by 10.27 percentage points, while the change in the poverty line alone would increase the headcount by 9.48 percentage points. This suggests that mean consumption growth is the most dominant
Table 1: Poverty Decomposition, 1992-2011
Source: Authors’ calculation.
1992 ‐ 2011 Income ConsumptionGrowth (%) –25.65 –22.17 Redistribution (%) –8.59 –10.27 Poverty line (%) 8.02 9.48 Total change in poverty headcount (%) –26.21 –22.96
September 2013 TDRI Quarterly Review 5
factor contributing to the reduction in the poverty headcount. The analysis based on income also provides a quantitatively similar result.
4. MEASUREMENT OF PRO-POOR GROWTH
According to Ravallion and Chen (2003) and the
World Bank,5 households’ consumption growth in any consumption quantile can be observed through the “growth incidence curve” (GIC), which plots the growth rate at each quantile of per capita consumption,
. The growth rate at each quantile of per capita consumption over a period is
1,
where p is the quantile p of households’ per capita consumption, ranked from the smallest to the largest; yo(p)is the mean of per capita consumption for a given quantile p in the initial year; yn(p) is the mean of per capita consumption for a given quantile p in the final year of the period of interest; and n is the number of years in the period. GIC enables comparison of the consumption growth in poorer quantiles with that of richer quantiles or with the growth rate of mean consumption.
Although GIC provides useful information regarding the growth of the mean of consumption per capita in each quantile, it cannot determine whether or not economic growth is pro-poor. One way to determine whether the growth rate benefits the poor more than the non-poor is to use the concept of the “rate of pro-poor growth” defined by Ravallion and Chen (2003). The rate of pro-poor growth refers to the growth rate in the mean consumption of the poor. In practice, the rate of pro-poor growth can be calculated by finding the mean of the growth rates for each quantile up to the head- count. In other words, the rate of pro-poor growth can be found by taking the integral of the GIC up to the poverty headcount of the initial year and then divide it by the headcount index. Comparison of the rate of pro-poor growth with the growth rate of mean consumption yields an indication of the pro-poor growth in a relative sense. If the rate of pro-poor growth is more than the growth rate of mean consumption, this indicates that the poor benefit from economic growth more than the non-poor or that the growth is pro-poor. In contrast, if the rate of pro-poor growth is less than the growth rate of mean consumption, this indicates that, while the poor benefit from economic growth, the non-poor benefit more.
It is important to note that the data used in this analysis are from the Socio-Economic Survey (SES). Generally, in a repeated cross-sectional survey, house- holds appearing in each survey are different. For example, households at the 20th percentile of the initial year are generally not the same as those at the 20th percentile of the final year of the period. Therefore,
when economic growth is positive for the 20th percentile, it cannot be said that all households at the 20th percentile of the initial year are better off. This situation can indicate only that welfare increases at the 20th percentile. Along the same line, when consumption growth is positive for all quantiles, we cannot conclude that all households’ welfare increases. We can only conclude that welfare increases at each quantile.
5. PRO-POOR GROWTH IN THAILAND DURING THE PERIOD 1992-2011
Some studies exist that discuss pro-poor growth
in Thailand. Somchai (2006) applied a poverty-elasticity method using both income and consumption and found that between 1992 and 1996, an economic boom period, the poor benefited from economic growth more than the rich did. As a consequence, Thailand’s poverty rate dropped greatly during the period. Although Thailand had experienced a negative growth rate during the 1997/98 financial crisis, the poor also suffered less than the non-poor. Son (2004) used income data and the poverty growth curve (PGC) method and found a similar result during the boom period. However, he argued that the financial/economic crises during the periods 1996-1998 and 1998-2000 hurt the poor more than others.
In this paper, we use GIC and the rate of pro-poor growth, explained in detail in section 4, to examine pro-poor growth in Thailand during the period 1992-2011. Data on households’ per capita consumption used in this section are from SES. Data on poverty lines and poverty incidence (headcount) were collected from NESDB.6 Both consumption and poverty lines were transformed into real terms using 2007 as the base year.
Following Warr (2004), we divided our studied periods into four sub-periods as follows:
Sub-period I (1992-1996): a boom period during which inequality began to decline;
Sub-period II (1996-1998): financial/eco- nomic crises period;
Sub-period III (1998-2007): recovery and steady period; and
Sub-period IV (2007-2011): fluctuating eco- nomic growth period.
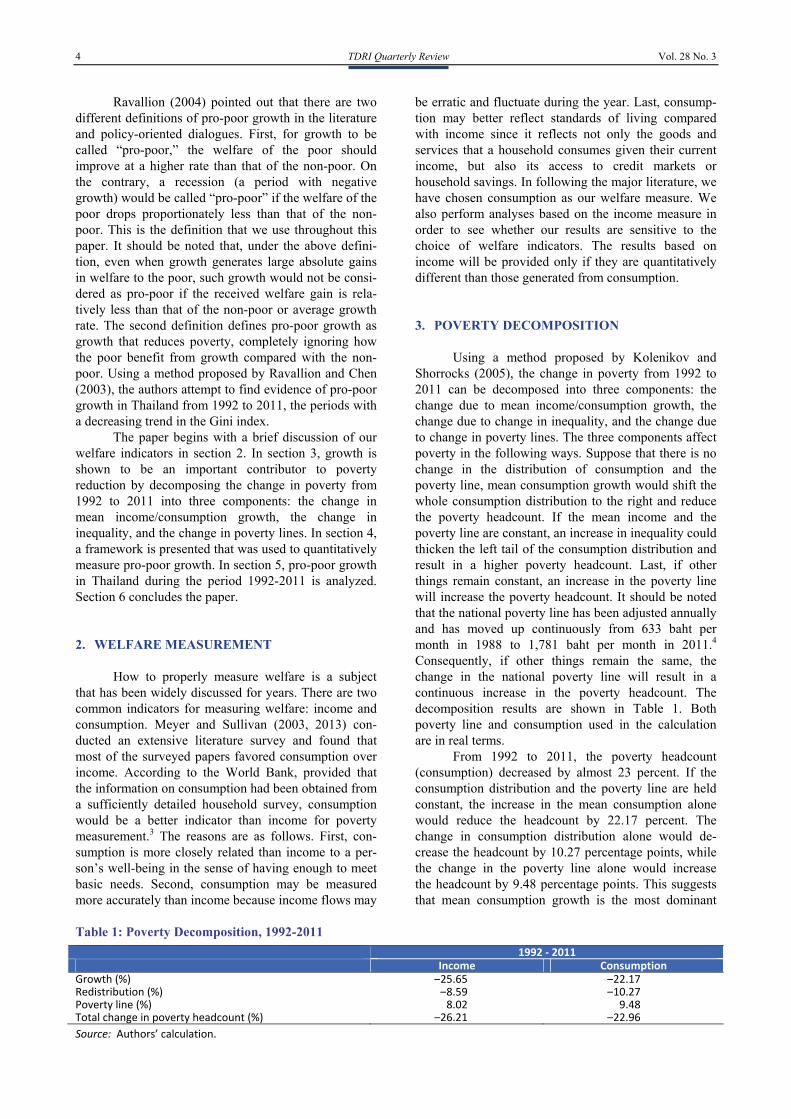
In Figures 2-6, GIC presents the growth of each percentile. The gray-shaded area around GIC demon- strates the 95 percent confidence interval of growth.7 The vertical dashed line indicates the poverty headcount ratio at national poverty line (% of population). The households located to the left-hand side of the vertical line are those of the poor. The horizontal line represents the growth rate in means of all household consumption per capita. Figure 2 shows GIC during the period 1992-2011. The growth rate in mean per capita consumption was 2.58 percent, while the rate of pro-poor growth was 3.85 percent (see Table 2). This implies that growth was pro-poor during that period.

6 TDRI Quarterly Review Vol. 28 No. 3
Figure 2: Growth Incidence Curve, 1992-2011
Source: Authors’ calculation.
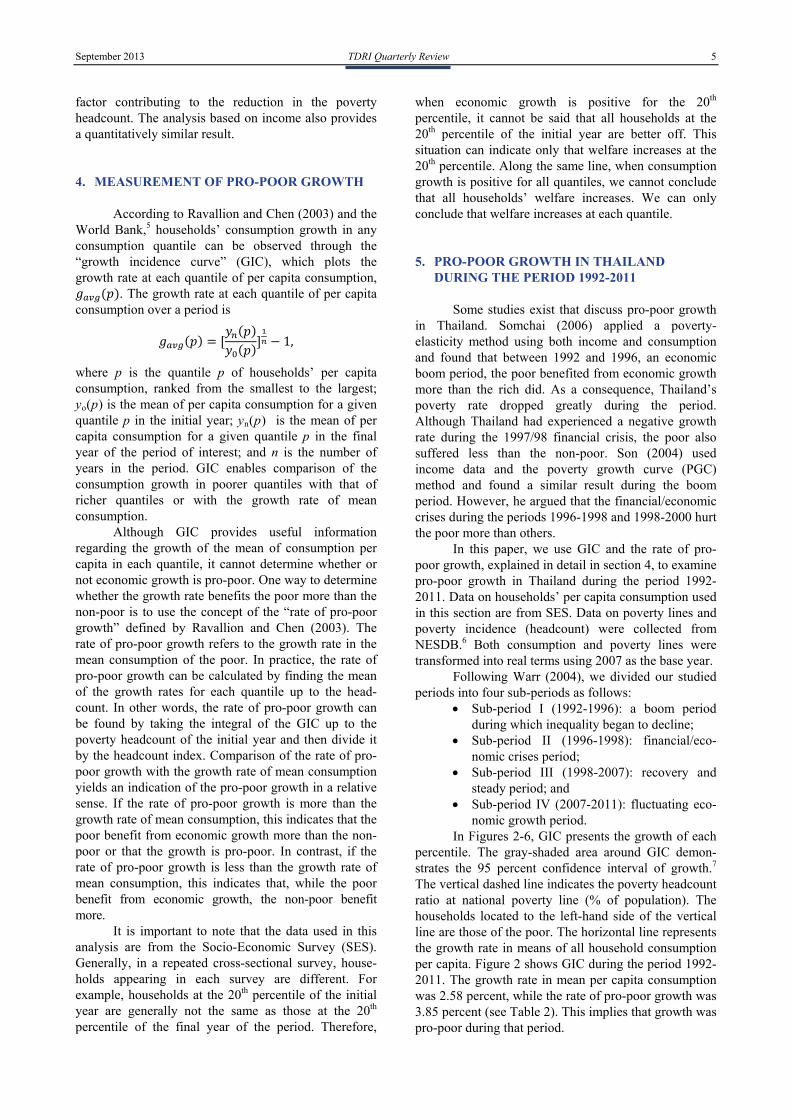
Figure 3: Growth Incidence Curve, 1992-1996
Source: Authors’ calculation.
12
34
5G
row
th rat
e (c
onsu
mpt
ion)
0 20 40 60 80 100Percentiles of population, ranked from poorest to richest
GIC Growth rate in mean95% confidence interval
02
46
8G
row
th rat
e (c
onsu
mpt
ion)
0 20 40 60 80 100Percentiles of population, ranked from poorest to richest
GIC Growth rate in mean95% confidence interval
Poverty headcount ratio (consumption) 1992 = 28.4%
Poverty headcount ratio (consumption) 1992 = 28.4%
Percentage
Percentage
September 2013 TDRI Quarterly Review 7
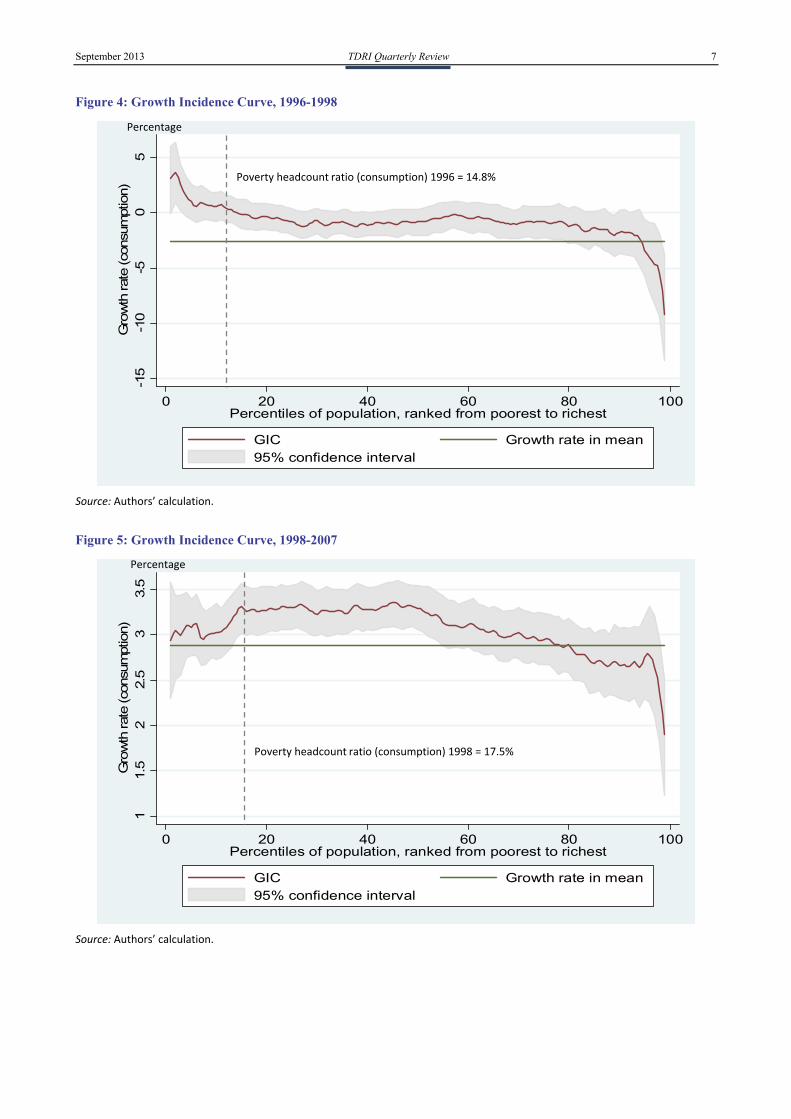
Figure 4: Growth Incidence Curve, 1996-1998
Source: Authors’ calculation.
Figure 5: Growth Incidence Curve, 1998-2007
Source: Authors’ calculation.
-15
-10
-50
5G
row
th rat
e (c
onsu
mpt
ion)
0 20 40 60 80 100Percentiles of population, ranked from poorest to richest
GIC Growth rate in mean95% confidence interval
11.
52
2.5
33.
5G
row
th rat
e (c
onsu
mpt
ion)
0 20 40 60 80 100Percentiles of population, ranked from poorest to richest
GIC Growth rate in mean95% confidence interval
Poverty headcount ratio (consumption) 1998 = 17.5%
Poverty headcount ratio (consumption) 1996 = 14.8%
Percentage
Percentage

8 TDRI Quarterly Review Vol. 28 No. 3
Figure 6: Growth Incidence Curve, 2007-2011
Source: Authors’ calculation.
Table 2: Growth Rate in Mean and Pro-Poor Growth
1992‐2011 1992‐1996 1996‐1998 1998‐2007 2007‐2011
Income Consumption Income Consumption Income Consumption Income Consumption Income Consumption
Growth rate in mean (%) 3.81 2.58 6.91 4.14 ‐0.61 ‐2.55 3.41 2.88 3.9 3.02
Pro‐poor growth (%) 5.02 3.85 8.35 5.55 0.84 1.12 3.28 3.00 7.68 5.76
Poverty headcount ratio (%) in initial year 32.5 28.4 32.5 28.4 17 14.8 18.8 17.5 10.5 8.5
Source: Authors’ calculation.
Breaking the period into four sub-periods
provides some interesting results. Pro-poor growth cannot be observed in all sub-periods. The GIC during Sub-periods I-IV (1992-1996, 1996-1998, 1998-2007, and 2007-2011) are shown in Figures 3-6 respectively. Table 2 provides the rates of pro-poor growth, the growth rate in mean per capita consumption and poverty headcount ratio in each sub-period. During the sub-period 1992-1996, an economic boom period, economic growth was pro-poor as the rates of pro-poor growth (5.55%) exceeded the mean growth rate (4.14%). During the financial/economic crises, 1996-1998, the welfare of the poor increased at a higher rate compared with that of the non-poor. The rate of pro-poor growth in this sub-period was positive (1.12%), while the mean growth rate was negative (–2.55%). Therefore, growth was pro-poor during the recession. Our result confirms the findings of Somchai (2006).
During the sub-periods covering the years 1998-2007, the Thai economy recovered from the recession and maintained positive growth rates throughout the sub-periods. The middle-middle and middle-low
consumption groups benefited more from growth than the other groups did. The rate of pro-poor growth was 3 percent, while the mean growth rate was a little bit lower at 2.88 percent. The comparison implies that growth in these sub-periods was also pro-poor. However, the results of the analysis based on income measures show the opposite direction. The rate of pro-poor growth measured by income (3.28%) was slightly lower than the mean growth rate (3.41%), implying that growth in these sub-periods was not pro-poor. Because the rate of pro-poor growth is close to the growth rate at mean in both cases, it is very difficult to conclude definitely whether economic growth in these sub-periods was pro-poor.
In the last sub-period, 2007-2011, Thailand experienced fluctuation in economic growth. The global economic crisis suppressed the Thai economy so that it grew by 2.5 percent in 2008 and shrank by –2.3 percent in 2009. In 2010, the growth rate quickly rebounded to 7.8 percent. However, in 2011, a major flood severely affected the Thai economy, forcing the economic growth rate down, so that it grew by a mere 0.08
02
46
8G
row
th rat
e (c
onsu
mpt
ion)
0 20 40 60 80 100Percentiles of population, ranked from poorest to richest
GIC Growth rate in mean95% confidence interval
Poverty headcount ratio (consumption) 2007 = 8.5%
Percentage

September 2013 TDRI Quarterly Review 9
percent. Despite these ups and downs, the mean growth rate in this sub-period stayed at 3 percent; the rate of pro-poor growth was 5.8 percent. Comparison of the two rates suggests that growth was pro-poor in this sub-period. One point of concern is that, if the price differences between areas and groups are taken into account, the pro-poor growth rate might be lessened, as Kittipong (2012) found: they hindered an improvement in income inequality in 2009 and 2011. This is because the consumer price levels of the poor in urban areas and households in rural areas had increased faster than in urban areas since 2007.
6. CONCLUSION AND REMARKS Since 1960, although Thailand has experienced
remarkable economic growth and poverty reduction, the level of inequality (measured by consumption) had just begun to decline in 1992 but the rate of decrease is low. This paper is aimed at quantitatively examining whether economic growth and improvement in overcoming inequality truly contribute more benefits to the poor than the non-poor. In addition, even though the analysis based on consumption data is more favorable than income, income data are also applied to check whether both welfare indicators provide similar results.
The results from the poverty decomposition method proposed by Kolenikov and Shorrocks (2005) suggest that the most dominant factor contributing to poverty reduction is economic growth (both income and consumption). As regards pro-poor growth, the con- cepts of the GIC and rate of pro-poor growth (Ravallion and Chen 2003; World Bank)8 are applied to check whether the economic growth after income/consump- tion inequality reached its peak in 1992 was pro-poor. As a result, this study found that Thailand’s growth, in general, was pro-poor for the entire period 1992-2011. However, careful examination of the sub-periods indicates that the evidence of pro-poor growth in Thailand during the sub-period 1998-2007 is not conclusive.
Our analysis implies that positive growth is not a pre-condition for pro-poor growth. During periods of positive economic growth, pro-poor growth was not necessarily observed. In addition, pro-poor growth could be observed even during a recession. Further- more, our study is focused on finding evidence of pro-poor growth but is silent on what causes pro-poor growth in a particular period. We strongly believe that pro-poor growth is not accidental. For growth to be pro-poor, the critical factor depends on the institutions and political economy influencing the design and implementation of pro-poor policies. We suggest that this important topic be further examined in future research.
ENDNOTES
1 The poverty headcount ratio is the percentage of the population whose expenditure is lower than the national poverty line. Data are from Office of the National Economic and Social Development Board (NESDB).
2 Data are from NESDB. 3 http://web.worldbank.org/WBSITE/EXTERNAL/
TOPICS/EXTPOVERTY/EXTPA/0,,contentMDK:20242876~isCURL:Y~menuPK:492130~pagePK:148956~piPK:216618~theSitePK:430367~isCURL:Y,00.html.
4 http://www.nesdb.go.th/ [accessed on January 14, 2013].
5 http://go.worldbank.org/J70VTQSAK0 [accessed in January 2013].
6 http://www.nesdb.go.th/ [accessed on January 14, 2013].
7 At the end of the distribution, the confidence interval tends to widen since the number of observations (poorest and richest group) is smaller.
8 http://go.worldbank.org/J70VTQSAK0 [accessed in January 2013].
REFERENCES
Kittipong Rueanthip. 2012. “The Urban-Rural Income Inequality in Thailand: 1996–2011.” The Economic Science 60(2): 25-43.
Kolenikov, S. and A. Shorrocks. 2005. “A Decompo- sition Analysis of Regional Poverty in Russia.” Review of Development Economics 9(1): 25-46.
Meyer, M. and J. Sullivan. 2003. “Measuring the Well-being of the Poor Using Income and Consumption.” Journal of Human Resources 38(Supplement): 1180-1220.
__________. 2013. Winning the War: Poverty from the Great Society to the Great Recession. Working Paper No. 18718, National Bureau of Economic Research.
Ravallion, M. 2004. Pro-Poor Growth: A Primer. Policy Research Working Paper No. 3242, World Bank.
Ravallion, M. and S. Chen. 2003. “Measuring Pro-Poor Growth.” Economics Letters 78: 93-99.
Somchai Jitsuchon. 2006. “Sources and Pro-poorness of Thailand’s Economic Growth.” Thammasat Economic Journal 24(3): 68-107.
Son, H. 2004. “A Note on Pro-poor Growth.” Economics Letters 82: 307-314.
Warr, P. 2004. “Globalization, Growth, and Poverty Reduction in Thailand.” ASEAN Economic Bulletin 21(1): 1-18.

10 TDRI Quarterly Review Vol. 28 No. 3
Thailand in the AEC: Myths, Realities, Opportunities, and Challenges*
Somkiat Tangkitvanich
Saowaruj Rattanakhamfu Sunthorn Tunmuntong Ploy Thammapiranon**
* We would like to express our sincere gratitude to Dr. Snoh Unakul, Dr. Narongchai Akrasanee, Dr. Wisarn
Pupphavesa, Dr. Anek Laothamatas and Dr. Titanun Mallikamas for their guidance and constructive comments. ** Dr. Somkiat Tangkitvanich is TDRI President, Dr. Saowaruj Rattanakhamfu is Research Fellow, Mr. Sunthorn
Tunmuntong and Ms. Ploy Thammapiranon are Researchers, Science and Technology Development Program, TDRI.
“Geography makes us neighbors, Culture gives us common heritage, Technology provides us connectivity, History makes us enemy, and Mentality keeps us apart.”
Dr. Narongchai Akarasanee on ASEAN integration
1. INTRODUCTION
Thai people and the media have paid enormous attention to Thailand’s integration into the ASEAN Economic Community (AEC), as evidenced by the large volume of daily news articles and commentaries related to the projected impact of AEC on Thailand. Unfor- tunately, many beliefs propagated by the media are “myths,” rather than facts. These myths tend to cause unwarranted concern and, more importantly, divert the attention of business away from the opportunities arising from the planned integration.
This paper is aimed at demystifying the myths related to the Association of Southeast Asian Nations (ASEAN) economic integration and presenting the “realities” about the ongoing integration in ASEAN, especially among the countries in the Greater Mekong Subregion (GMS). It will also answer what the AEC means to Thailand, and what the Thai government and private sector must do to reap benefits from the AEC. 2. MYTHS
In analyzing commentaries from politicians, top
bureaucrats, columnists, leaders of civil society and the business community, as reported by the Thai media, we found many common misunderstandings, or myths, about the AEC. In this section, we will present four
such myths, provide examples of them and explain why they are incorrect.
Myth 1: In 2015, Thailand will be significantly changed as a result of the establishment of the AEC.
“In 2015, barriers to international trade and
regional economy in ASEAN will be eliminated due to the establishment of the AEC. At that time, there will be enormous changes….brought about by the birth of a single market and production base, free movement of goods and services, free movement of investment and capital, and free movement of skilled labor.” (Columnist, Thai Rath Daily, July 18, 2012)
“With the establishment of the AEC in 2015, the immediate impact is that there will be no international border among all 10 members of ASEAN. Capital and people will move freely.” (Columnist, Siam Rath Daily, September 10, 2012)
According to the AEC Blueprint, the ASEAN single market and its production base consist of five core elements: (a) free flow of goods; (b) free flow of services; (c) free flow of investment; (d) freer flow of capital; and (e) free flow of skilled labor. The key milestone for establishing the AEC has been set to be 2015. Previously, it was widely interpreted that integration would begin on January 1, 2015 but ASEAN leaders later made clear that the beginning date will be December 31, 2015.
Despite all the excitement about the establish- ment of the AEC, our analysis reveals that there will be no significant changes for Thailand in 2015 for several reasons. First, Thailand’s commitment to reduce its
September 2013 TDRI Quarterly Review 11
tariff under the Common Effective Preferential Tariff (CEPT) agreement of the ASEAN Free Trade Area (AFTA) has already been fulfilled, and no further action is needed. Thus, contrary to what many believe, Thailand will not experience any significant surge in imports from other ASEAN countries. On the other hand, Thai exporters will have more opportunities for selling their products to Cambodia, the Lao People’s Democratic Republic (Lao PDR), Myanmar and Vietnam (CLMV), as these new ASEAN members have to reduce to zero by 2015 the tariffs on most of their products.
While tariffs have already been cut for some and will be reduced for all ASEAN members in 2015, non-tariff measures (NTMs) may prove to be harder nuts to crack. The solution to the NTMs has been proposed under the ASEAN Trade in Goods Agreement, or ATIGA, which entered into force on May 17, 2010. Nonetheless, reduction of the NTMs is on a voluntary basis. As a result, no significant changes are expected by 2015 and in the foreseeable future.
Second, there will be little progress in the liberalization of trade in services and investment by 2015. Thus, there will be no significant impacts from the service liberalization (see Myth 3).
Third, only eight professional services are subject to Mutual Recognition Arrangements (MRAs) to facilitate the movement of skilled labor. In addition, the implementation of the MRAs and removal of other barriers to the movement of labor remain extremely slow. Thus, there will be no significant impacts from the liberalization of labor movement (see Myth 2).
As a result, the postponement in establishing the AEC from January 1 to December 31, 2015 will not make a tangible difference. The problems arise not only from the slow pace of liberalization but also from the lack of strong commitments among ASEAN countries to liberalization.
To sum up, even though the goal of the AEC is to set up a single market and production base by allowing the free flow of goods, services, and investment as well as skilled labor and freer flow of capital, there would be no significant impacts on the Thai economy in 2015 and the foreseeable future.
Myth 2: AEC will lead to free movement of labor.
“When the AEC is formed, Thai skilled labor in
the agricultural, construction and manufacturing sectors will be courted away en masse. Unskilled labor from neighboring countries will then move in freely in large numbers. It is terrifying just to think that Bangkok will be congested, garbage will be overwhelming and terrorists will be able to enter Bangkok and Thailand much more easi- ly.” (Columnist, Naew Na Daily, April 15, 2012)
“Soon Thai people will be out of a job, unable to compete with more skillful labor from neighboring countries.” (Columnist, Khao Sod Daily, August 10, 2012)
“Now there are many foreign doctors working as assistants to doctors and medical advisors because the law does not allow them to work as doctors. But when skilled labor movement is liberalized, they will suddenly work as doctors.” (Permanent Secretary of a Ministry, Daily World Today, January 17, 2012)
According to the AEC Blueprint, free mobility of labor covers only skilled labor, currently comprising engineers, physicians, dentists, nurses, architects, surveyors, accountants and tourism professionals.
The AEC adopts the approach of MRAs to promote the mobility of such professionals. However, ASEAN professionals intending to work in other member countries are required to comply with domestic regulations of the host countries. For Thailand, the requirements imposed on foreign professionals, includ- ing those from ASEAN countries, reflect the country’s unwillingness to welcome them (Table 1). Many ASEAN countries have similar requirements. As a result, the belief that AEC will allow mass movement of professionals is unwarranted.
Myth 3: ASEAN investors can invest freely in all services sectors.
“From 2015, there will be no shareholding
limits on foreigners…Thai service operators will be able to invest in neighboring countries without restrictions in holding shares.” (Minister of an Economic Ministry, Siam Business, August 31, 2012)
According to the AEC Blueprint, ASEAN inves- tors can hold at least 70 percent of shares in a service business. The Blueprint relies on the ASEAN Frame- work Agreement on Services, or AFAS, as a mecha- nism for liberalization. Currently, five sectors, namely air transportation, information and communication technology (ICT), health care, tourism and logistics, are set as priority areas for liberalization (Table 2).

12 TDRI Quarterly Review Vol. 28 No. 3
Table 1 Requirements for certain professionals to work in Thailand
Professions Requirement under domestic regulations
Engineer Foreign professionals are allowed to work jointly with Thai professionals. To conduct an independent practice, they have to pass assessment by professional regulatory bodies that would certify whether they fully understand the codes of practice and regulations written in the Thai language. Architect
Nurse
Foreign professionals must pass a written exam in the Thai language to get licenses. Dentist
Physician
Accountant Foreign accountants must understand Thai accounting standards and tax laws and show that they can do accounting in the Thai language. Similarly, foreign auditors must be able to conduct their audits and write reports in Thai.
Table 2 Percentage share ownership allowed for ASEAN investors
Service sector Before 2008 (%) Before 2010 (%) Before 2013 (%) Before 2015 (%)
Four priority sectors At least 51 At least 70
Logistics At least 49 At least 51 At least 70
Others At least 49 At least 51 At least 70
Source: ASEAN Economic Community Blueprint (2008).
However, service liberalization under the AEC is
very flexible in terms of time frame and the sectors offered for liberalization. For telecom services, for example, Thailand has so far offered to liberalize only services related to telegraph, teletype, teletext and facsimile. Important services, such as mobile telephony, high-speed Internet services and satellite services, have never been subject to liberalization under the World Trade Organization (WTO) and ASEAN. There is also no commitment to address behind-the-border issues, e.g., interconnection for telecom services, to create effectively competitive markets.
Thus, the belief that the AEC will enable ASEAN investors to invest freely in the service sectors is only a myth.
Myth 4: Integration under the AEC is similar to that of the European Union (EU). Therefore, the AEC is prone to suffer similar problems faced by the EU.
“The AEC copies everything from the EU.
The EU collapsed in front of us. Soon ASEAN will.” (Columnist, Baan Muang Daily, September 13, 2012)
“The AEC copies from the EU, bringing all ten ASEAN nations into one community. There will be liberalization of capital flow, labor movement, all at free will.” (Colum- nist, Baan Muang Daily, February 27, 2012)
Some Thai people believe that integration under the AEC is similar to that of the EU. They think that, as a result, the AEC is likely to suffer similar problems currently faced by the EU. As cited in the above
examples, some implicitly worry that ASEAN may risk having a crisis stemming from the use of a common currency. This is certainly an easy myth to dispel since the AEC does not mandate the use of a common currency. In fact, integration under the AEC differs significantly from that of the EU in at least two aspects: the depth of integration and the accompanying governance structure.
Despite many rounds of negotiation, ASEAN has remained mostly just a free-trade area: ASEAN mem- bers have agreed to reduce tariffs and quotas on traded goods but without committing to much liberalization in other areas. The EU, on the contrary, constitutes an economic union, mandating not only the liberalization of trade in goods in the form of a customs union, but also allowing free trade in services, the free flow of capital, the free movement of labor and a common monetary policy (see Jovanovic, 2011, for a definition of economic unions and free-trade areas).
In terms of governance structure, the EU has set up a number of supra-national bodies, such as the European Commission, the European Council, the European Parliament, and the European Court of Justice. The European Commission can issue regula- tions and directives that have binding power on its members. On the other hand, the governance structure of ASEAN is set up far more loosely. The working of ASEAN is based on the cooperation of its member countries, which maintain full sovereignty and delegate no power to any supra-national bodies. Because all decisions must be based on consensus among the mem- ber countries, it becomes difficult to agree on anything significant. Thus, the risks facing ASEAN are not those brought about by overly tight economic integration but by the inability of members to move forward. This is clearly reflected in the slow progress of the AEC.

September 2013 TDRI Quarterly Review 13
3. REALITIES While the progress of ASEAN countries has
been slow in implementing AEC targets, de facto economic integration has already happened in the areas of trade, investment, and labor mobility. 3.1 Trade
As mentioned in the previous section, trade
liberalization in ASEAN has taken place since the 1990s. In particular, tariff reduction under the AFTA has been effective since 1993, and is almost finished. Table 3 shows that, for the old ASEAN members (or the ASEAN 6),1 the tariffs on 99 percent of their product items have been reduced to zero. The new ASEAN members (or CLMV) 2 have reduced their tariffs to 0-5 percent for 93 percent of their product items. On the other hand, there has been little progress in eliminating non-tariff barriers (NTBs).
Due to the tariff reductions, the trade values between Thailand and the ASEAN countries, especially CLMV, have significantly increased. During the period 2001-2011, the trade values between Thailand and all ASEAN countries more than doubled, from 1.0 trillion baht in 2001 to 2.8 trillion baht in 2011 (Figure 1). During the same period, the trade value between Thailand and CLMV more than quadrupled, from 1.45 trillion baht to 6.72 trillion baht. As a result, the trade shares of Thailand with CLMV rose from 14 percent to 24 percent.
3.2 Foreign direct investment
Outward direct investment from Thailand to
ASEAN countries has overtaken the inflow since 2009, as shown in Figure 2. In 2011, the value of direct investment outflow from Thailand to ASEAN countries reached 511 billion baht, while the value of inflow from ASEAN countries to Thailand was only 153 billion baht.
Table 3 Proportion of product items (at 6-digit HS code) with tariff reduction
Country
Tariff rate (percentage)
Total (%) 0% 1‐5% More than 5%
Singapore 100.0 0.0 0.0 100
Thailand 99.8 0.0 0.2 100
Brunei Darussalam 99.5 0.0 0.5 100
Philippines 99.1 0.0 0.9 100
Indonesia 99.2 0.0 0.8 100
Malaysia 98.9 0.0 1.1 100
Lao People’s Democratic Republic 73.7 22.5 3.8 100
Vietnam 58.9 39.8 1.3 100
Cambodia 8.7 72.3 19.0 100
Myanmar 4.4 92.6 3.0 100
ASEAN‐6 (average) 99.4 0.0 0.6 100
CLMV (average) 36.4 56.8 6.8 100
ASEAN‐10 (average) 74.2 22.7 3.1 100
Source: Ministry of Commerce and Customs Department (2012).
Figure 1 Trade between Thailand and ASEAN countries
Source: Ministry of Commerce and National Economic and Social Development Board.
145 148 174 230 309 376 392 518 484 557 672
859 9021,033
1,263
1,536 1,559 1,609
1,803
1,473
1,818
2,09114 14 1415
17
19 20
22
2523
24
0
5
10
15
20
25
30
0
500
1,000
1,500
2,000
2,500
3,000
2001 2002 2003 2004 2005 2006 2007 2008 2009 2010 2011
Percen
tageBillions of baht
Trade value with CLMV Trade value with ASEAN(5) Share of trade value with CLMV to total tradeShare of trade value with CLMV to total trade

14 TDRI Quarterly Review Vol. 28 No. 3
Figure 2 Value of foreign direct investment between Thailand and ASEAN countries
Source: Bank of Thailand.
ASEAN countries have become the most important investment destination for Thai companies. Among the 100 largest companies listed on the Stock Exchange of Thailand (SET) by market capitalization in 2011, or the “SET 100,” 48 have invested in foreign countries by setting up 521 subsidiaries or joint ventures. Among these, 216 have been established in ASEAN countries. Many of these are in the energy and public utility sector (53 companies), followed by those in the construction materials sector (38 companies) and the petrochemical and chemical product sector (28 companies) (Table 4).
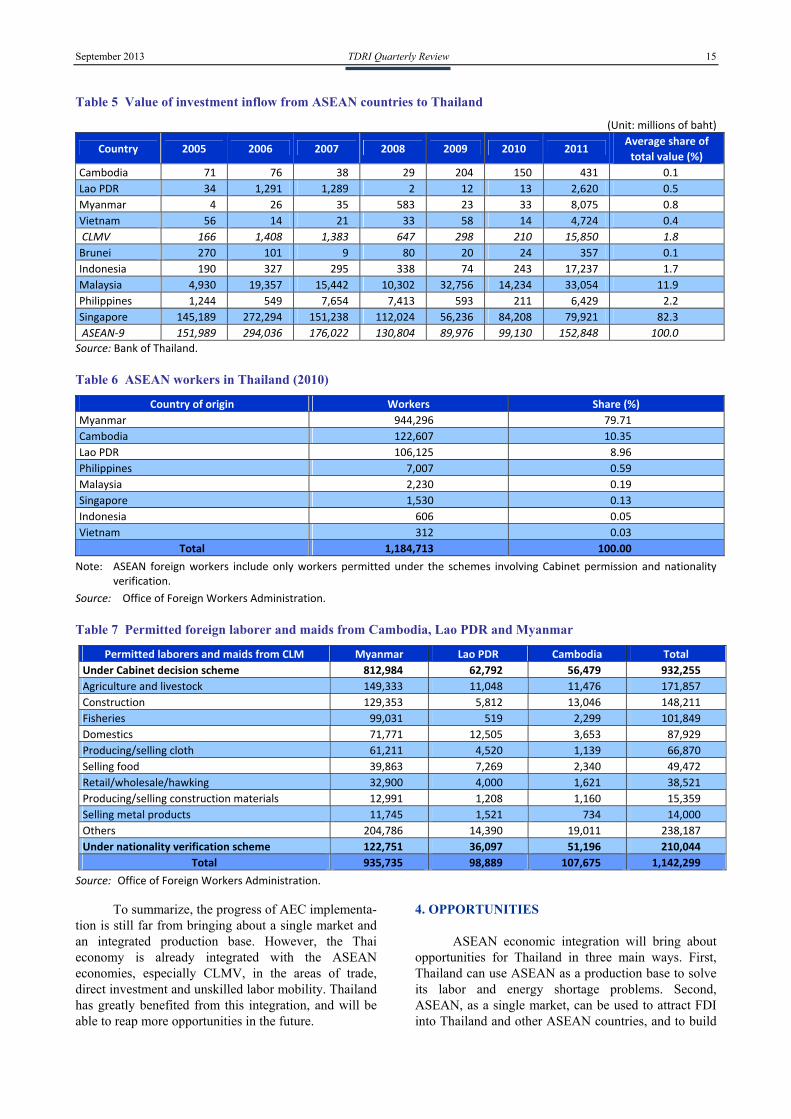
For inward investment, ASEAN constitutes the second largest source of investment in Thailand, accounting for 19 percent of total foreign direct invest- ment (FDI). Among ASEAN members, the country with the highest value of direct investment inflow into
Thailand during the period 2005-2011 was Singapore (82%), followed by Malaysia (12%) and the Philippines (2%), as shown in Table 5. The investment inflow from CLMV constituted only 2 percent of the total direct investment from ASEAN countries in Thailand.
3.3 Labor mobility
While negotiations in the AEC focus exclusively on the movement of professionals, unskilled labor accounts for the majority of the movement. In 2010, there were 1.18 million workers from ASEAN countries working in Thailand, constituting 87 percent of the total permitted foreign workers in the country (Table 6). Of these, 1.14 million were from Cambodia, Lao PDR and Myanmar (CLM), and worked as laborers or house- maids (Table 7).
Table 4 Outward investment of the SET100 companies: 2011
Business sector* Subsidiaries and joint ventures
ASEAN‐6 CLMV Total
Energy and public utilities 31 22 53
Construction materials 24 14 38
Petrochemicals and chemical products 24 4 28
Commerce 11 6 17
Real estate development 6 11 17
Others** 4 9 13
Agribusiness 8 4 12
Transportation and logistics 8 3 11
ICT 4 7 11
Food and beverages 2 3 5
Electronic components 4 ‐ 4
Banking 2 2 4
Health care ‐ 2 2
Tourism ‐ 1 1
Total 88 128 216
Note: * Business sectors refer to those of subsidiaries or joint ventures, not their parent companies. ** Other sectors include aluminum ore mining, paper, and packaging, etc. Source: Compiled from the 56‐1 reports submitted to the Securities and Exchange Commission.
30 34 93 119
115 110
511
152
294
176131
90 99
153
0
100
200
300
400
500
600
2005 2006 2007 2008 2009 2010 2011
Billionsof baht
Outflow investment from Thailand to ASEAN countries
Inflow investment from ASEAN countries to Thailand
September 2013 TDRI Quarterly Review 15
Table 5 Value of investment inflow from ASEAN countries to Thailand
(Unit: millions of baht)
Country 2005 2006 2007 2008 2009 2010 2011 Average share of
total value (%)
Cambodia 71 76 38 29 204 150 431 0.1
Lao PDR 34 1,291 1,289 2 12 13 2,620 0.5
Myanmar 4 26 35 583 23 33 8,075 0.8
Vietnam 56 14 21 33 58 14 4,724 0.4
CLMV 166 1,408 1,383 647 298 210 15,850 1.8
Brunei 270 101 9 80 20 24 357 0.1
Indonesia 190 327 295 338 74 243 17,237 1.7
Malaysia 4,930 19,357 15,442 10,302 32,756 14,234 33,054 11.9
Philippines 1,244 549 7,654 7,413 593 211 6,429 2.2
Singapore 145,189 272,294 151,238 112,024 56,236 84,208 79,921 82.3
ASEAN‐9 151,989 294,036 176,022 130,804 89,976 99,130 152,848 100.0
Source: Bank of Thailand.
Table 6 ASEAN workers in Thailand (2010)
Country of origin Workers Share (%)
Myanmar 944,296 79.71
Cambodia 122,607 10.35
Lao PDR 106,125 8.96
Philippines 7,007 0.59
Malaysia 2,230 0.19
Singapore 1,530 0.13
Indonesia 606 0.05
Vietnam 312 0.03
Total 1,184,713 100.00
Note: ASEAN foreign workers include only workers permitted under the schemes involving Cabinet permission and nationality verification.
Source: Office of Foreign Workers Administration.
Table 7 Permitted foreign laborer and maids from Cambodia, Lao PDR and Myanmar
Permitted laborers and maids from CLM Myanmar Lao PDR Cambodia Total
Under Cabinet decision scheme 812,984 62,792 56,479 932,255
Agriculture and livestock 149,333 11,048 11,476 171,857
Construction 129,353 5,812 13,046 148,211
Fisheries 99,031 519 2,299 101,849
Domestics 71,771 12,505 3,653 87,929
Producing/selling cloth 61,211 4,520 1,139 66,870
Selling food 39,863 7,269 2,340 49,472
Retail/wholesale/hawking 32,900 4,000 1,621 38,521
Producing/selling construction materials 12,991 1,208 1,160 15,359
Selling metal products 11,745 1,521 734 14,000
Others 204,786 14,390 19,011 238,187
Under nationality verification scheme 122,751 36,097 51,196 210,044
Total 935,735 98,889 107,675 1,142,299
Source: Office of Foreign Workers Administration.
To summarize, the progress of AEC implementa- tion is still far from bringing about a single market and an integrated production base. However, the Thai economy is already integrated with the ASEAN economies, especially CLMV, in the areas of trade, direct investment and unskilled labor mobility. Thailand has greatly benefited from this integration, and will be able to reap more opportunities in the future.
4. OPPORTUNITIES ASEAN economic integration will bring about
opportunities for Thailand in three main ways. First, Thailand can use ASEAN as a production base to solve its labor and energy shortage problems. Second, ASEAN, as a single market, can be used to attract FDI into Thailand and other ASEAN countries, and to build
16 TDRI Quarterly Review Vol. 28 No. 3
regional brands for Thai products. Finally, ASEAN can be used as a platform for further regional integration, especially of ASEAN+3 and ASEAN+6, or the Re- gional Comprehensive Economic Partnership (RCEP). Thailand also stands to benefit from ASEAN integration due to its strategic geographical location as a major hub in the region.
4.1 ASEAN as a production base
Thailand can use ASEAN as a production base
to solve its labor and energy shortages, which are chronic problems suffered by the Thai manufacturing and other sectors.
Labor shortages
Thailand has faced the problem of labor shortages for a long time, as reflected by its very low
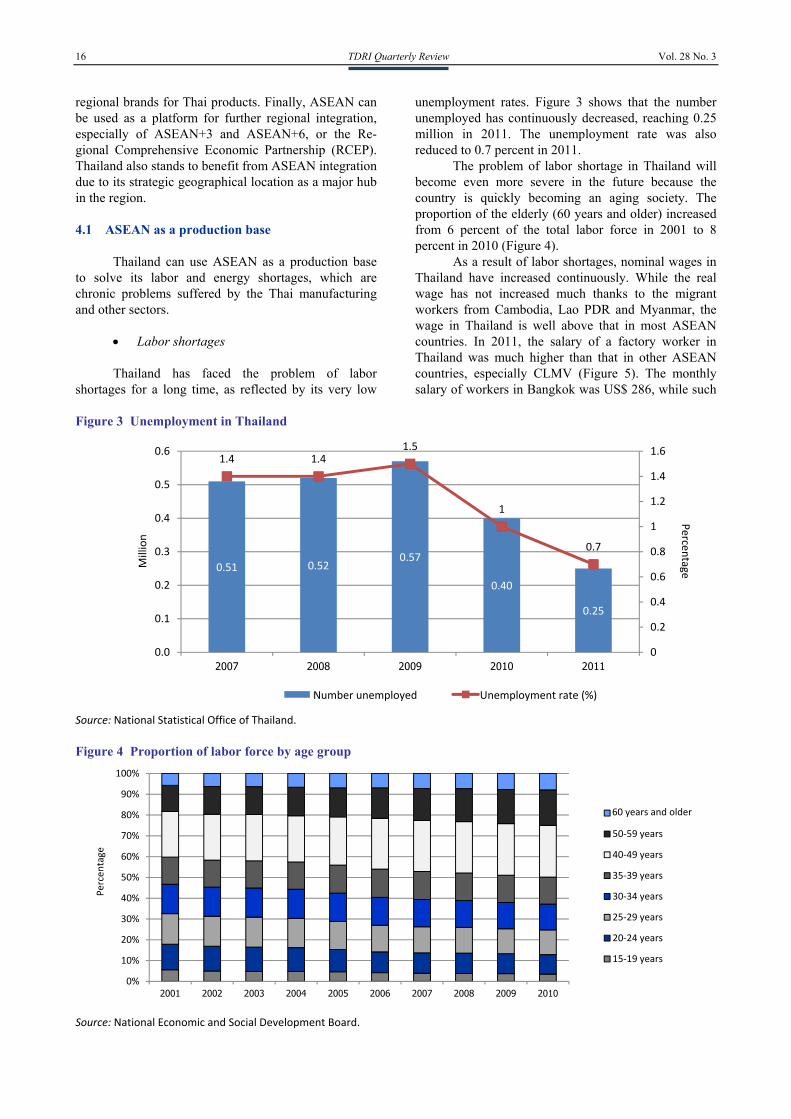
unemployment rates. Figure 3 shows that the number unemployed has continuously decreased, reaching 0.25 million in 2011. The unemployment rate was also reduced to 0.7 percent in 2011.
The problem of labor shortage in Thailand will become even more severe in the future because the country is quickly becoming an aging society. The proportion of the elderly (60 years and older) increased from 6 percent of the total labor force in 2001 to 8 percent in 2010 (Figure 4).
As a result of labor shortages, nominal wages in Thailand have increased continuously. While the real wage has not increased much thanks to the migrant workers from Cambodia, Lao PDR and Myanmar, the wage in Thailand is well above that in most ASEAN countries. In 2011, the salary of a factory worker in Thailand was much higher than that in other ASEAN countries, especially CLMV (Figure 5). The monthly salary of workers in Bangkok was US$ 286, while such
Figure 3 Unemployment in Thailand
Source: National Statistical Office of Thailand.
Figure 4 Proportion of labor force by age group
Source: National Economic and Social Development Board.
0.51 0.520.57
0.40
0.25
1.4 1.41.5
1
0.7
0
0.2
0.4
0.6
0.8
1
1.2
1.4
1.6
0.0
0.1
0.2
0.3
0.4
0.5
0.6
2007 2008 2009 2010 2011
Perce
ntageMillion
number of unemployed unemployment rate
0%
10%
20%
30%
40%
50%
60%
70%
80%
90%
100%
2001 2002 2003 2004 2005 2006 2007 2008 2009 2010
Percentage
60 years and above
50‐59 years
40‐49 years
35‐39 years
30‐34 years
25‐29 years
20‐24 years
15‐19 years
Number unemployed Unemployment rate (%)
60 years and older

September 2013 TDRI Quarterly Review 17
Figure 5 Monthly wages of factory workers in ASEAN capitals
Source: JETRO. The 19th–22nd Survey of Investment Related Costs in Asia and Oceania (2008‐2011).
salaries in Jakarta, Ho Chi Minh City, and Yangon were US$ 209, $130, and $68, respectively. Lower wages in these ASEAN countries are due to the fact that the countries have an abundant labor force. Indonesia alone has 116 million workers, followed by Vietnam (52.1 million) and Myanmar (30.5 million) (Table 8). Thai companies in labor-intensive industries can thus relocate their production bases to neighboring countries, such as Myanmar and Vietnam.
Energy shortages
Due to its sustained economic growth, Thailand is consuming increasingly more energy. Because its energy production capacity is limited, Thailand has to rely on imported energy from foreign countries. In addition to importing oil from members of the
Organization of Petroleum Exporting Countries, Thailand also imports electricity from Lao PDR, natural gas from Myanmar, and coal and lignite from Indonesia (Table 9).
4.2 ASEAN as a single market
Integration in ASEAN will eventually bring
about a single market, in which Thailand would have an advantage in accessing and building regional brands for Thai products. Thailand and other member countries can also use ASEAN to attract FDI due to the size of the integrated market. In 2011, the population of ASEAN countries was 598 million, or 9 times that of Thailand. ASEAN’s total GDP amounted to US$ 1.85 trillion, or 5 times that of the Thai economy.
Table 8 Labor force in ASEAN countries with low wages (2011) Country Labor force (millions) Unemployment rate (%)
Cambodia 8.3 0.2
Myanmar 30.5 4.0a
Lao PDR 3.2 1.4b
Vietnam 52.1 2
Indonesia 115.9 6.6
Thailand 38.7 0.7
Note: a Data for 2007. b Data for 2005.
Source: World Bank and ASEAN Secretariat.
Table 9 Thailand’s energy consumption and imports Items Electricitya Natural gasb Coal and lignitec
Total domestic consumption 148,855 4,113 35,299
Total imports from foreign countries 10,825 830 16,337
‐ Imports from ASEAN members 10,825 830 12,892
‐ Imports from ASEAN members, by country 10,710 (Lao PDR) 115 (Malaysia)
830 (Myanmar) 12,275 (Indonesia) 406 (Lao PDR) 246 (Vietnam) 55 (Others)
Note: a Millions of kilowatt hours. b Millions of standard cubic feet per day. c Thousands of tons. Source: Ministry of Energy and Electricity Generating Authority of Thailand.
290
256
298
344
194
295
236
325
241 230
263286
131147
186209
95 99114
130
16 22 4168
117.610182
0
50
100
150
200
250
300
350
400
2008 2009 2010 2011
United
States Dollars
Ho Chi Minh City
Jakarta
Bangkok
Manila Kuala Lumpur
Yangon
Vientiane
Phnom Penh

18 TDRI Quarterly Review Vol. 28 No. 3
4.3 ASEAN as a platform for further regional integration
ASEAN can also be used as a platform for
further regional economic integration. Among the possible unions for such integration are ASEAN+3, which integrates ASEAN with the East Asian economies, and ASEAN+6 (RCEP), which integrates ASEAN economies with Asian and Pacific economies. In 2011, the populations of the former and the latter were 33 and 53 times larger, respectively, than that of Thailand. In terms of GDP, ASEAN+3 and RCEP are 40 and 48 times larger, respectively, than that of Thailand. Such regional economic integration will further expand intraregional trade. Figure 6 shows that the proportion of intraregional trade to total trade has increased continuously. In 2010, the proportion of intra-ASEAN trade reached 25 percent of the total trade, while the intra-East Asian trade (ASEAN+3) and the intra-Asia-Pacific trade (ASEAN+6) reached 39 percent and 44 percent, respectively.
4.4 Thailand’s strategic geographical location
Thailand will become one of the main
beneficiaries of the regional integration in ASEAN due to its strategic location. In particular, 33 provinces of Thailand border its neighboring countries. More importantly, Thailand hosts the intersection points of the planned economic corridors, including the East-West corridor (connecting Myanmar, Thailand, Lao PDR and Vietnam), the North-South corridor (connect- ing the Southern provinces of China, Myanmar, Thai- land, Lao PDR and Malaysia) and the Southern corridor (connecting the Dawei deep sea port of Myanmar, the Laem Chabang deep sea port of Thailand, and Cambodia), as shown in Figure 7.
With its regional hub status, Thailand stands to benefit from the AEC in many ways. First, Thai companies can relocate or expand their low value-added production activities to neighboring countries, while upgrading their domestic production to higher value-added activities. As the center of economic corridors, companies in Thailand can link their production network through transportation and logistics networks.
Second, the transportation network passing through Thailand creates opportunities for various service businesses, such as transportation, logistics, hotel, tourism and health care.
Finally, Thailand can promote the use of the Thai Baht as a regional trade currency, along with the US dollar. This will reduce the transaction costs for businesses locating in Thailand. However, this benefit must be weighed against the risk of exposing the Thai Baht to potential speculators.
5. CHALLENGES What must Thailand do to maximize the benefits
from regional integration? As discussed in the previous section, the benefits for Thailand from the AEC are threefold: using neighboring countries as extended production bases; using the AEC to attract FDI and to build regional brands for Thai products; and using ASEAN as a platform for further regional integration toward ASEAN+3 and ASEAN+6.
To reap these potential benefits, the Thai govern- ment and private sector should implement drastic domestic reform to support regional economic integra- tion, promote sustainable development in neighboring countries and promote an international mindset among Thai business communities.
Figure 6 Proportion of intraregional trade as a percentage of the total trade value
Source: JETRO (2012).
15.9 17.0
21.022.7
24.9 24.628.9 28.6
36.9 37.439.1 38.733.2 33.0
40.3 40.643.0 44.1
0
10
20
30
40
50
1980 1990 1995 2000 2005 2010
Percentage
ASEAN+6
ASEAN+3
ASEAN


20 TDRI Quarterly Review Vol. 28 No. 3
assistance (ODA) to neighboring countries in the form of technical and financial assistance to create physical and social infrastructures.
Second, the Thai government should provide sufficient protection to foreign laborers working in Thailand by providing them with health care and education for their children.
Third, the Thai government should ensure that investment projects of the Thai private sector in neighboring countries are responsible and promote sustainable development. Thai investors should be made aware of the impact of their investments on the environment and communities in host countries.
Fourth, the Thai government should cooperate with ASEAN counterparts to tackle cross-border problems that are likely to expand with increasing economic integration. These include transnational organized crime, trade in narcotics, human trafficking and cross-border pollution.
5.3 Nurturing an international mindset among Thai
companies and people
Because Thai companies have a greater regional presence through trade and direct investment, it becomes imperative that Thai business people and the general public adopt a more international mindset. In particular, they must respect the values of other countries and become more sensitive to cultural differences. In this regard, study of the history and the culture of ASEAN countries should be encouraged.
One obvious way to promote mutual cultural understanding is through language. Unfortunately, Thai people have not performed well with respect to learning foreign languages, as exemplified by their low TOEFL test scores. In fact, Thailand ranked the lowest among ASEAN countries, with an average score of 489 points in paper-based TOEFL tests in 2011. Furthermore, Thai students do not show much interest in learning the languages used in ASEAN countries. For example, the total number of students in Chulalongkorn University enrolled in ASEAN language courses in the first semester of 2012 was just 226 out of 25,154, or less than 1 percent. This is certainly an area that needs urgent improvement.
6. CONCLUSION The general public is highly aware of Thailand’s
integration into the AEC. Unfortunately, many beliefs
propagated by the media are based on myths, rather than facts. These myths cause unwarranted concern and divert attention from the on-going de facto integration in the region. In this paper, it is argued that integration will bring about many benefits for Thailand. These include using neighboring countries as production bases, using the AEC to attract FDI and to build regional brands for Thai products, and using ASEAN as a platform for further regional integration toward ASEAN+3 and RCEP.
With its strategic geographical location, Thailand is well suited to benefit from its role as a major hub of the burgeoning ASEAN economic community. However, the benefits from integration will not come automatically. Thailand must formulate and implement proper policies and take appropriate action to enjoy the benefits. Structural reform, especially the liberalization of the service sector, is a top priority. It is also important to promote responsible investment and sustainable development, and to nurture an international mindset among the Thai business community and the general public.
ENDNOTES
1 Old ASEAN members or ASEAN 6 comprise Brunei Darussalam, Indonesia, Malaysia, the Philippines, Singapore and Thailand.
2 New ASEAN members, or CLMV, consist of Cambodia, the Lao People’s Democratic Republic, Myanmar and Vietnam.
REFERENCES
The Japan External Trade Organization (JETRO). 2012. “2012 JETRO Global Trade and Investment Report—Firms and People Move Forward Towards Globalization.” Presentation Document, Overseas Research Department, JETRO.
__________. Various years. The 19th–22nd Survey of Investment Related Costs in Asia and Oceania, Overseas Research Department, JETRO.
Somchai Jitsuchon. 2012. “Impact on Social Changes and Income Gap.” TDRI 2012 Annual Conference Paper. (in Thai)
Jovanovic, Miroslav N. (ed.) 2011. International Hand- book on the Economics of Integration, volume III. Massachusetts: Edward Elgar Publishing Limited.
Thailand Development Research Institute 565 Ramkhamhaeng Soi 39, Wangthonglang District, Bangkok 10310 Thailand Tel: 66 2 718 5460; Fax: 66 2 718 5461-62 Email: [email protected]; Web site: http://www.tdri.or.th