Embed Size (px)
Citation preview

- 1 -
T cell receptor (TCR) and transforming growth factor beta (TGF-) signaling converge on DNA (cytosine-5)-methyltransferase to control forkhead box protein 3 (foxp3) locus methylation and inducible
regulatory T cell differentiation*
Chaoran Li1, Peter J.R. Ebert2, and Qi-Jing Li1
1Department of Immunology, Duke University Medical Center, Durham, NC 27710
2Genentech, 1 DNA Way, South San Francisco, CA 94080
*Running title: TCR signal regulates DNMT to control foxp3 methylation
To whom correspondence should be addressed: Qi-Jing Li, Department of Immunology, Duke University Medical Center, 207 Research Drive, Durham, NC, USA, Tel: 919-668-4070; Fax: 919-613-6602; Email: [email protected] Keywords: DNA methylation; DNMT1; Foxp3; TCR signaling; TGF-β Background: TCR and TGF- signaling regulate the differentiation of Foxp3+ inducible regulatory T cells. Result: Through posttranscriptional regulation of DNMTs, TCR and TGF- signaling control foxp3 promoter methylation. Conclusion: During antigen-induced proliferation, TCR and TGF- signaling program T cells epigenetically to achieve heritage maintenance. Significance: Our results illustrate a single mechanism that can comprehensively underpin the interplay between antigen and environment in guiding iTreg differentiation. SUMMARY
Naïve T cells can be induced to differentiate into Foxp3+ regulatory T cells (iTregs) upon suboptimal T cell receptor (TCR) stimulus, or TCR stimulus in conjunction with TGF- signaling; however, we do not fully understand how these signals coordinately control foxp3 expression. Here, we show that strong TCR activation—in terms of both duration and ligand affinity—causes the accumulation of DNA (cytosine-5)-methyltransferase 1 (DNMT1) and DNMT3b, and their specific enrichment at the foxp3 locus, which leads to increased CpG methylation and inhibits foxp3 transcription. During this process, the augmentation of DNMT1 is regulated through at least two post-transcriptional mechanisms: strong TCR signal inactivates GSK3 to rescue
DNMT1 protein from proteasomal degradation; and, strong TCR signal suppresses miR-148a to derepress DNMT1 mRNA translation. Meanwhile, TGF- signaling antagonizes DNMT1 accumulation via activation of p38 MAP kinase. Thus, independent of transcription factor activation, TCR and TGF- signals converge on DNMT1 to modulate the expression of foxp3 epigenetically, which marks mother cells’ iTreg lineage choice within the genome of differentiating daughter cells.
Recognition of a peptide-major histo-
compatibility complex (pMHC) displayed on the surface of antigen-presenting cells (APCs) by a specific T cell receptor (TCR) initiates the T cell response. Upon pMHC:TCR engagement, coordinated downstream signaling cascades promote naïve CD4 T cells to undergo massive expansion and differentiation into distinct T helper (Th) subsets, such as Th1, Th2, Th17, and inducible regulatory T cells (iTreg)(1). Although the requirement for TCR signals in lineage commitment is universal, accumulating evidence indicates that, besides varying cytokine environments, differences in the strength of TCR signaling can also have a tremendous impact on CD4 T cells’ fate determination. This was initially discovered by Bottomly and colleagues and further confirmed by others: in general, weak TCR signals are thought to bias T cells toward the Th2 lineage while strong TCR signals facilitate the formation
http://www.jbc.org/cgi/doi/10.1074/jbc.M113.453357The latest version is at JBC Papers in Press. Published on May 16, 2013 as Manuscript M113.453357
Copyright 2013 by The American Society for Biochemistry and Molecular Biology, Inc.
by guest on May 28, 2018
http://ww
w.jbc.org/
Dow
nloaded from
- 2 -
of the Th1 subset(2-4). Recently, it was shown that the differentiation of Th17 cells could also be promoted by weak TCR activation(5). However, the molecular mechanism governing this fate determination remains largely unknown.
In addition to effector Th cells, TCR signal strength influences the differentiation of CD4+Foxp3+ regulatory T cells (Tregs). Tregs are suppressor T cells that play a dominant role in the maintenance of peripheral tolerance and immune homeostasis(6). These cells express the master transcription factor Foxp3, which is essential for their differentiation, maintenance and suppressive function(7-10). Mutation of the foxp3 gene in humans and mice results in lymphoproliferative disease that leads to severe inflammation in multiple organs and tissues(11,12). Based on their origin of development, Tregs have been categorized into two types: thymic natural Tregs (nTregs) generated after thymocyte selection, and peripheral inducible Tregs (iTregs) derived from CD4+CD25- conventional naïve T cells(13). nTregs and iTregs share several common mechanisms in terms of their development and differentiation, such as their reliance on TCR, IL-2 and TGF-signaling. TCR stimulation leads to the activation of various transcription factors including nuclear factor of activated T-cells (NFAT)(14), activator protein 1 (AP1)(14), cAMP response element-binding (CREB)(15), and nuclear factor (NF)-B(16), all of which have been shown to bind to the foxp3 locus directly and regulate its transcription. Paradoxically, this NFAT-AP1-NFB panel is also fully or partially employed for effector T cell proliferation, as well as the expression of lineage specific cytokines, cytokine receptors and master transcription factors that control Th1 differentiation(1). How, then, do T cells determine whether they should express Foxp3? In a conventional view, this problem is solved by TGF- signaling, which provides a unique transcription factor, Smad3, as a crucial addition to the NFAT-AP1-NFB panel in guiding T cells’ lineage decision(17). However, in the presence of TGF-Smad3-deficient T cells only displayed a 50% reduction in iTreg differentiation(18). Thus the currently known transcriptional machinery is inadequate to explain how naïve T cells commit to the iTreg versus Th lineage.
In addition to the regulation of foxp3 by well-documented transcription factors, recent studies showed that foxp3 transcription is also regulated by epigenetic mechanisms(19,20). It was shown that both the promoter and conserved non-coding sequence 1 (CNS1) of the foxp3 gene are more accessible in Tregs than in conventional effector T cells, as indicated by increased local histone acetylation in Tregs. Besides histone modifications, foxp3 expression is also directly regulated at the DNA level by CpG methylation. The CpG islands within the promoter region of foxp3 were almost completely demethylated in nTregs, while those in conventional effector T cells showed partial methylation(15,21). In foxp3’s CNS2 region, the difference in methylation is even more striking: it was fully demethylated in nTregs but completely methylated in effector T cells(15,22). Interestingly, and consistent with their transient and unstable Foxp3 expression, iTregs had foxp3 CpG islands that were only partially demethylated in the CNS2 region(15). Experiments using inhibitors to block methylation showed that changes in CpG methylation motifs did affect transcription factor binding and foxp3 expression in antigen-stimulated conventional T cells. However, it was not clear how this methylation is regulated during the iTreg differentiation process.
Here, we show that strong TCR signaling, which is elicited by high affinity ligand or by extended ligand exposure, inhibits foxp3 expression in conventional T cells at the epigenetic level. This is coordinately achieved by (i) PLC- and PI3K-dependent signaling downstream of TCR, which blocks the GSK3-dependent, proteasome-mediated degradation of DNMT1 protein; and (ii) by dampening miR-148a, the microRNA (miRNA) that targets DNMT1 mRNA. DNMT1, together with DNMT3b, is then able to methylate and suppress the foxp3 locus. Meanwhile, TGF- directly antagonizes these TCR signals by promoting drastic downregulation of DNMT1 via activation of p38. Thus, DNMT1 represents a crucial node where TCR and TGF signals converge to control iTreg fate. EXPERIMENTAL PROCESURES
Mice- All animal work was conducted according to protocols approved by the
by guest on May 28, 2018
http://ww
w.jbc.org/
Dow
nloaded from
- 3 -
Institutional Animal Care and Use Committee at Duke University. 5C.C7 TCR transgenic mice were from Taconic (B10.ARag2tm1Fwa H2-T18a Tg (Tcra5CC7, Tcrb5CC7)lwep). WT B10.A mice were also from Taconic. Wild type C57BL/6 mice were from The Jackson Laboratory. Foxp3-GFP-Cre BAC transgenic mice were kindly provided by Dr. Xiaoping Zhong from the Duke University Medical Center.
T cell activation and differentiation- 2×10⁶ sorted CD4+CD25- LN T cells from 5C.C7 TCR transgenic mice were labeled with 10 μM CFSE, and stimulated by 2×10⁶ T cell depleted syngeneic splenocytes loaded with peptides MCC (1 μM) or 102S (1 μM). Anti-I-Ek antibody (14.4.4), anti-I-Ek-MCC (D4) or small molecule inhibitors that block specific pathways were added at different time points. The percentages of CD4+Foxp3+ T cells were analyzed by intracellular staining with eBioscience Foxp3 / Transcription Factor Staining Buffer Set (Cat. 00-5523-00) and flow cytometry at 72hrs. 14.4.4 and D4 antibodies were purified from hybridoma culture supernatant and used at a concentration of 20ug/mL. LY 294002 (Cat. 440202), rapamycin (Cat. 553210), PIK-75 (Cat. 528116), cyclosporin A (Cat. 239835), IKK inhibitor III (Cat. 401480), MG-132 (Cat. 474790), SB-216763 (Cat. 361566), ERK inhibitor II (Cat. 328007), JNK inhibitor II (Cat. 420119), p38 MAP Kinase inhibitor III (Cat. 506121) were purchased from EMD Biosciences. U-73122 (Cat. U6756) was purchased from Sigma. Recombinant human TGF- and IL-2 were purchased from Peprotech.
Quantiative PCR and western blot- Total RNA was isolated with the miRVana extraction kit (Ambion, Cat. AM1561) according to the manufacturer's instructions. Reverse transcription was performed with qScript™ cDNA SuperMix (Quanta Biosciences, Cat. 95048) or qScript™ Flex cDNA Kit (Quanta Biosciences, Cat. 95049). Gene expression was quantified by SYBR Green based qPCR analysis. Western blot was performed according to standard protocols with the following primary antibodies: DNMT1 (D63A6) XP® rabbit mAb (Cell signaling, Cat. 5032), DNMT3b rabbit polyclonal antibody (Abgent, Cat. Ab1035a), goat anti-β-Actin antibody (Sigma). Anti-rabbit-Alexa680 and anti-goat-Alexa680 (Invitrogen) were used as secondary antibodies and the
fluorescence intensity was measured on an Odyssey system (Licor).
Intracellular staining and fluorescence microscopy- For flow cytometry analysis, cells were fixed with 2% paraformaldehyde in PBS, permeabilized with 90% methanol in PBS, and stained with anti-DNMT1 mAb, anti-Phospho-p44/42 MAPK (Erk1/2) at Thr202 and Tyr204, anti-Phospho-Akt at Thr308 (Cell Signaling) or isotype control. A Pacific Blue goat anti-rabbit antibody was used as secondary antibody and the expression of DNMT1 at the single cell level was measured by flow cytometry. Gating of the DNMT1+ cells was based on the staining with isotype control antibodies. For imaging of DNMT1 protein in cells, 5C.C7 T cells that were stimulated with different peptides for defined durations were fixed with 4% paraformaldehyde on coverslips, permeabilized with 0.5% Triton X-100 in PBS, and stained with anti-DNMT1 mAb (Cell signaling). A Cy3 donkey anti-rabbit antibody was used as secondary antibody for fluorescence microscopy. Imaging was performed on a Zeiss Axiovert-100TV station equipped with a Zeiss 40X EC Plan-Neofluar objective lens (NA=1.30), a CoolSNAPHQ CCD camera (Roper Scientific) and a high-speed piezzo Z-motor for Z stack recording as described previously(23).
DNA methylation analysis and chromatin immunoprecipitation- Genomic DNA was purified with GenElute™ Mammalian Genomic DNA Miniprep Kit (Sigma, Cat. G1N79). Methylation analysis was quantified by sequencing of genomic DNA after bisulfite conversion using the MethylDetector kit (Active Motif), PCR amplification and cloning. Chromatin immunoprecipitation was done based on a standard protocol with rabbit anti-DNMT1 (H300) antibody, mouse anti-DNMT3b mAb (52A1018) (Santa Cruz Biotechnology), or a nonspecific rabbit anti-mouse IgG (Jackson ImmunoResearch Laboratories).
Statistical analysis- Unpaired two-tailed t tests were utilized to determine whether the difference between a given set of means was statistically significant. Differences with p values of less than 0.05 were considered statistically significant. RESULTS
by guest on May 28, 2018
http://ww
w.jbc.org/
Dow
nloaded from

- 4 -
iTreg differentiation is controlled by both strength and duration of TCR signalling through the PI3K-Akt-mTOR and PLC pathways- While dissecting the functions of the microRNAs within the miR-17-92 cluster, we identified miR-19b as an inhibitor of iTreg differentiation. Further mechanistic analysis indicated that this was mediated through inhibition of PTEN expression and the consequent prolonged PI3K activation upon TCR/CD28 signaling(23). Abbreviated anti-CD3/CD28 stimulation facilitates in vitro iTreg differentiation(24); and previous adoptive transfer studies have shown that low doses of antigen and lack of costimulation favor induction of iTregs in vivo(25). Therefore, we hypothesized that iTreg lineage differentiation would be determined by the integrated strength of TCR signaling based on both pMHC ligand affinity and the duration of ligand availability. To parse out the impacts of ligand affinity and stimulation duration in regulating iTreg differentiation, we utilized CD4 T cells from 5C.C7 TCR transgenic mice, in which every primary T cell carries a unique TCR(26) recognizing a range of biochemically and biophysically well-characterized natural and synthetic variants of the moth cytochrome C (88-103) peptide in the context of the MHC II molecule I-Ek (27). To determine the role of ligand strength in regulating iTreg differentiation, we stimulated sorted CD4+CD25- 5C.C7 T cells using syngeneic APCs loaded with either the strong agonist MCC, or a weak agonist 102S(28). To interrogate how the duration of stimulation influences iTreg induction, I-Ek-specific antibodies were added at different time points after the onset of stimulation (e.g. 6hrs, 18hrs); this treatment blocks TCR engagement with pMHC within minutes(29). Under these two regimes, and without addition of exogenous cytokines, we analyzed the percentages of Foxp3+ CD4 T cells 72hrs after initial TCR stimulation (Fig. 1A). Consistent with our hypothesis, a minimal percentage of T cells upregulated Foxp3 when stimulated for a prolonged period (72hrs), regardless of whether a strong or weak antigenic peptide was used. However, when cells were stimulated with the weak agonist 102S for a shorter period of time (6hrs or 18hrs), we observed a substantial frequency of iTreg conversion (Fig. 1B&1D). With both 6hr and 18hr stimulation, this elevation of Foxp3 expression occurred at the
transcript level (Fig. 1C). In contrast, even with the shortest tested duration of stimulation, MCC was unable to induce Foxp3 expression (Fig. 1B&1D). These data indicate that although brief exposure to weak TCR signaling is required for Foxp3 induction, extensive signaling generated from high affinity ligands and/or a longer duration of antigen exposure actually inhibits foxp3 expression and iTreg differentiation.
We further evaluated the impact of TCR signalling strength and duration in regulating iTreg differentiation with CD4 T cells from wild type C57BL/6 mice upon anti-CD3 and anti-CD28 antibodies stimulation. As expected, when sorted CD4+CD25- T cells were stimulated for 72 hours, very few Foxp3+ cells were generated. In contrast, when cells were activated for 18 hours and then maintained without TCR stimulation for additional 54 hours, a substantial fraction of cells differentiated into Tregs (Fig. 1E). Furthermore, reducing the concentration of anti-CD3 antibody further enhanced Foxp3 induction and iTreg differentiation (Fig. 1E). These data confirmed that both TCR signalling strength and duration contribute to the negative regulation of iTreg differentiation by extensive TCR stimulation.
Previous studies have suggested an inverse correlation of cell division and iTreg differentiation following adoptive transfer of CD4+CD25- cells(25). Since T cells stimulated with 102S for 18hrs proliferated significantly less than those activated either for a longer period of time (72hrs) or with a stronger agonist (MCC for 18hrs) (Fig. S1A), we explored whether the weaker proliferative response could account for improved iTreg conversion in the briefly 102S-stimulated cells. Using a CFSE label to distinguish cell generations, we observed that T cells that had undergone fewer divisions did in fact convert into Foxp3+ cells more efficiently (Fig. S1B). However, our results also showed that even when considering T cells that had undergone the same number of divisions, brief 102S stimulation conditions produced a higher frequency of Foxp3+ cells: that is, 18hr 102S stimulation induced 15-fold more Foxp3+ cells than 18hr MCC stimulation, even when considering only singly-divided cells. Most importantly, 4-fold more Foxp3+ cells were generated among undivided cells (Fig. 1B&S1B). Thus, we reasoned that there are cell-cycle-independent mechanisms that inhibit Foxp3
by guest on May 28, 2018
http://ww
w.jbc.org/
Dow
nloaded from

- 5 -
expression and iTreg differentiation under the circumstance of extensive TCR signaling.
Although we do not know precisely how TCR signal strength is translated into cell fate decisions, several previous studies indicate that the PI3K-Akt-mTOR axis downstream of TCR activation might be critical. Blocking of this pathway with LY294002 or rapamycin after 18hrs of TCR stimulation resulted in robust Foxp3 induction in vitro(24). In addition, expression of a constitutively active form of Akt in T cells diminished Foxp3 expression in peripheral T cells both in vitro and in vivo, suggesting that the activation of the PI3K-Akt-mTOR axis could contribute to the negative regulation of iTreg differentiation by strong TCR signaling(30). To determine key signaling events preventing foxp3 expression upon extensive antigen stimulation, we repeated our iTreg induction experiments in the presence of a series of small pharmaceutical inhibitors to block specific pathways downstream of TCR activation. We first chose the regime of extended weak TCR stimulus (72hr 102S), which normally results in very little iTreg induction. In this setting, consistent with previous findings that prolonged PI3K-Akt-mTOR activation inhibits iTreg differentiation, we detected a substantial increase in iTreg conversion when cells were treated with LY294002, a small inhibitor that blocks both PI3 kinase and mTOR activity (Fig. 2A). We further dissected these two pathways by treating cells with PIK-75, which specifically inhibits the P110α and P110γ subunits of PI3K at the dose used, and with rapamycin, which inhibits mTOR specifically (Fig. 2A). We noted that both inhibitors could significantly potentiate iTreg differentiation. Meanwhile, despite having a dramatic impact on T cell proliferation(31), inhibition of calcineurin-NFAT signaling, NFB function, or ERK activation had a minimal effect on Foxp3 induction (Fig. 2A). Interestingly, we found that U-73122, a specific inhibitor of the PLC-dependent hydrolysis of PIP2 to IP3, could also enhance iTreg conversion to a similar extent as PI3K-mTOR inhibition (Fig. 2A).
We next investigated whether inhibition of the PI3K-Akt-mTOR or ZAP70-PLCpathway can induce iTregs when TCRs are engaged with strong agonist. As expected, in comparison to 102S peptide, MCC induced stronger Akt activaion, calcium signaling, as well as ERK1/2
phosphorylation (Fig. S2). When we inhibited the PI3K and PLC pathway with specific inhibitors at 18 hours after TCR engagement, cells stimulated with MCC expressed significantly less Foxp3 than those stimulated with 102S (Fig. 2B&C). On the other hand, blocking ERK activation did not have any effects on iTreg conversion (Fig. 2B&C). These data indicated that a short period (18hrs) of strong PI3K and PLC activation with MCC peptide is sufficient to inhibit iTreg induction. Furthermore, it strongly suggested that both the PI3K-Akt-mTOR axis and the ZAP70-PLC pathway are specifically involved in the negative regulation of iTreg differentiation in response to extensive TCR signalling mediated by higher ligand affinity or prolonged duration.
TCR signaling regulates CpG methylation at
the foxp3 locus- During iTreg differentiation, foxp3 gene expression is driven by the activation of the transcription factors STAT5, Smad3, NFAT, AP1, CREB1 and NFB(32); the latter four of which are collectively potentiated by strong and sustained TCR signaling. Paradoxically, in the absence of TGF-TCR signaling of this magnitude instead suppresses the transcription of foxp3. This apparent conundrum suggested that, in parallel with transcription factor activation, extensive TCR signaling must target a distinct regulatory mechanism. DNA methylation controls the accessibility of general and gene-specific transcription factors toward the regulatory regions of genes, and this has been demonstrated to be one of the central mechanisms controlling foxp3 transcription(19). We hypothesized that, during iTreg differentiation, differences in strength and duration of TCR signaling would result in differential DNA methylation within the foxp3 regulatory regions.
To examine this, we evaluated the methylation status of the foxp3 gene in different T cell populations from male 5C.C7 mice, including naïve T cells, T cells activated with 102S or MCC for 6hrs, and T cells activated with 102S peptide for 72hrs. As we sought modifications that could explain Foxp3 induction prior to iTreg commitment, we analysed the whole population (within which the highest ratio of differentiated iTregs is less than 20%), rather than purified iTreg cells under these various conditions. In agreement with previous reports(15,21), we found that in
by guest on May 28, 2018
http://ww
w.jbc.org/
Dow
nloaded from
- 6 -
naïve CD4 T cells, CpG islands residing in foxp3’s promoter region were largely unmethylated (Fig. 3A). While a short and weak stimulation did not alter the overall methylation pattern of the promoter, stronger stimulation in terms of duration and ligand affinity significantly elevated foxp3 promoter methylation (Fig. 3A), and this methylation pattern mirrored the final expression level of Foxp3 protein (Fig. 1B). In addition, the CpG islands within foxp3’s CNS2 region were completely methylated in naïve T cells and T cells that had experienced various TCR stimulations (Fig. 3B). It was not surprising to observe that the methylation status in CNS2 was largely unchanged in conventional CD4 T cells: It has been shown that even in fully-differentiated iTregs induced by TGF- and IL-2 treatment, the CpG islands within CNS2 still remains largely methylated(15). Furthermore, while the genetic modification demonstrates that CNS2 is rather essential for the maintenance of Foxp3 expression in mature nTregs (33), our data validate that CNS2 is likely dispensable for Foxp3 induction during iTreg induction. To further functionally determine whether extensive TCR stimulation blocks foxp3 expression through DNA methylation, we stimulated 5C.C7 T cells with 102S for 72hrs, while also treating samples at 18hrs post stimulation with 5-azacytidine, a cytosine nucleoside analogue that inhibits DNA methylation. In agreement with our methylation data, 5-azacytidine treatment abrogated the inhibition of Foxp3 expression by prolonged TCR signaling (Fig. 3C). These data indicate that extensive TCR stimulation suppresses iTreg differentiation by enhancing CpG methylation in the foxp3 gene’s regulatory regions.
TCR signaling augments levels of DNMT
proteins and their bindings to the foxp3 locus- We next examined how TCR signaling controls DNA methylation within the foxp3 locus. As one of the major DNA methyltransferases in mammalian cells, DNMT1 was recently linked to the regulation of Foxp3 expression in T cells (34). In addition to its well-known function in maintaining DNA methylation during cell proliferation, DNMT1 has also been shown to be associated with DNMT3 to induce de novo methylation in CpG islands(35) and silence genes in human cells(36). Since we observed a substantial change
in DNA methylation in foxp3’s regulatory regions, we hypothesized that extensive TCR signaling modulates foxp3 gene methylation by controlling the level of DNMTs. Under various stimulatory conditions that we employed for iTreg induction, mRNA levels of DNMT1 (Fig. 4A) and DNMT3b (Fig. 4B) largely remained steady. However, at the protein level, DNMT1 was slightly elevated with a short duration of 102S stimulation, and was dramatically increased when this stimulation was prolonged (Fig. 4C). Similarly, DNMT3b protein was also significantly elevated with as short as 6 hours of moderate TCR stimulation (Fig. 4D). Consistent with our hypothesis that DNMT1 mediates iTreg differentiation through interpretation of TCR signalling strength and duration, similar magnitudes of DNMT1 elevation were caused by prolonged stimulus with a weak agonist (102S), as by a shorter stimulation with a strong agonist (MCC) (Fig. 4E&4F). To examine whether DNMT1 and Foxp3 expression are inversely correlated under the permissive condition for iTreg conversion, we directly compared DNMT1 levels between Foxp3+ and Foxp3- populations in CD4 T cells with the same TCR priming. We employed a BAC transgenic mice expressing the GFP-Cre fusion protein under the control of the foxp3 promoter, in which GFP expression faithfully reflects endogenous Foxp3 expression (37). We then stimulated sorted CD4+GFP- conventional T cells from these mice with the permissive condition optimized in Fig. 1E. GFP- (Foxp3-) and converted GFP+ (Foxp3+) CD4 T cells were then sorted to determine DNMT1 expression (Fig. 4G). In agreement with a critical role of DNMT1 in negatively controlling Foxp3 expression, we detected significant lower DNMT1 levels in GFP+ cells as compared to the GFP- population (Fig. 4H).
We next examined whether the overall accumulation of DNMT1 and DNMT3b protein by strong TCR signaling leads to enhanced enrichment of these two enzymes at the foxp3 locus, which could account for the increased CpG methylation status in the promoter of the foxp3 gene. As shown by our immunocytochemistry experiments, DNMT1 protein resides in small punctate structures within naïve CD4 T cells’ nuclei (Fig. 5A). In agreement with our western blot results, the total signal intensity of DNMT1 staining rose sharply upon stimulation in a TCR-
by guest on May 28, 2018
http://ww
w.jbc.org/
Dow
nloaded from

- 7 -
signal-strength-dependent manner. Moreover, in contrast to a few concentrated DNMT1 punctae observed in naïve cells (TCR-0h) or cells given a short and weak priming (102S-6h), T cells with strong TCR signaling (102S-72h, MCC-6h/72h) had significantly increased nuclear DNMT1 staining not only with respect to the intensity of each individual puncta, but also the number of punctae (Fig. 5A). We predicted that this increased quantity and broadened distribution would impact the occupancy of DNMT1 on the foxp3 gene’s regulatory regions. The locus-specific recruitment of DNMT1 and DNMT3b was quantified by chromatin immunoprecipitation (ChIP). Consistent with the overall demethylated status of promoter CpG islands in unstimulated and weakly stimulated CD4 T cells, we did not detect any specific DNMT1 or DNMT3b binding to the foxp3 promoter in these two populations (Fig. 5B&5E). In contrast, cells that were suboptimally stimulated—either with weak agonist for a long duration or with strong agonist for a short duration—showed significantly enhanced binding of DNMT1 and DNMT3b to foxp3’s CpG islands (Fig. 5B&5E). Interestingly, strong TCR signaling also enhanced DNMT1 occupancy at the CNS2 region, but not DNMT3b occupancy (Fig. 5C&5F). Importantly, as implied by the local accumulation of DNMT1 at punctae within the nucleus, we could demonstrate a degree of specificity in the local recruitment of DNMT1 to the foxp3 locus. In agreement with the fact that strong stimulation of 5C.C7 T cells favours their Th1 lineage differentiation, no significant DNMT1 binding was detected within the CNS-6 region of the ifng gene after MCC stimulation (Fig. 5D), which was methylated in naïve cells but completely demethylated and accessible to support IFN production in Th1 cells(38). This biochemical evidence, combined with the associated epigenetic and functional outcomes, indicates that strong TCR signaling blocks the accessibility of the foxp3 locus through the elevation of DNMT1 and DNMT3b protein levels, delivery of these two enzymes to foxp3’s regulatory region, and the resultant enhanced local methylation.
TCR signaling stabilizes DNMT1 protein
through inhibition of Gsk3 activity and protection from proteasome-mediated
degradation- Based on the data presented above, we hypothesized that there must be a signaling node that is capable of receiving signals from both PI3K and PLC pathways downstream of TCR, and then integrating these signals to post-translationally modify the level of DNMT1 protein. Within the TCR signaling network, a good candidate for such a modulator is glycogen synthase kinase 3 beta (Gsk3Gsk3is a constitutively active serine/threonine protein kinase in resting cells(39). Upon receptor signaling, its activity can be silenced by phosphorylation mediated through PI3K-Akt(40) and/or PLC-PKC signaling(41). Interestingly, in some human tumor cell lines, suppression of Gsk3activity upon PI3K activation has been implicated as the cause for stabilized DNMT1 protein levels: PI3K prohibits Gsk3-mediated phosphorylation of DNMT1 and thus protects it from ubiquitin-mediated proteasomal degradation (42). We examined whether this DNMT1 stabilization mechanism is exploited by TCR signaling. T cells were stimulated with 102S peptide antigen for 18hrs, and then treated with a specific proteasome inhibitor, MG-132 or SB-216763, a specific inhibitor of Gsk3activity(42). When these cells were analyzed at the 72hr endpoint, both inhibitor treatments partially but significantly enhanced the level of DNMT1 protein in response to weak TCR signaling (Fig. 6A). Reciprocally, whereas blocking TCR engagement, PI3K activation, or PLC activity at the18hr point led to a substantial Foxp3 induction, the addition of Gsk3inhibitor could partially diminish this effect (Fig. 6B). Overall, these data suggest that extensive TCR signaling stabilizes DNMT1 protein by inhibiting Gsk3mediated phosphorylation and proteasomal degradation of DNMT1.
TCR signaling elevates DNMT1 protein levels
by dampening its microRNA modulator, miR-148a- The fact that MG-132 and Gsk3inhibitor could only partially rescue the level of DNMT1 protein led us to speculate that there is another layer of control, possibly at the level of DNMT1 translation. miRNAs are small non-coding RNAs that regulate gene expression posttranscriptionally, via a combination of mRNA degradation and/or translational repression, depending on the
by guest on May 28, 2018
http://ww
w.jbc.org/
Dow
nloaded from

- 8 -
particular microRNA(43). Since DNMT1 transcript levels were not altered in our T cells, we explored the possibility that TCR signaling could release miRNA-mediated translational inhibition of DNMT1 expression. Two members of the miR-148 family, miR-148a(44) and miR-152(45), were previously suggested to be direct modulators of DNMT1 expression, and we verified this in our transgenic T cell system (Fig. S3A). Upon TCR engagement, expression levels of all three miRNAs within this family, miR-148a, miR-148b, and miR-152 were suppressed (Fig. 5C). When ectopically expressed using a retroviral tool during T cell activation, all three failed to suppress DNMT1 mRNA levels (Fig. S3B). However, one of the three—miR-148a—significantly suppressed DNMT1 expression at the protein level (Fig. 6D). Furthermore, CD4 T cells that forcibly overexpressed miR-148a enhanced their Foxp3 induction significantly (Fig. 6E&6F). This suggested that dampening of miR-148a expression is a complimentary pathway that contributes to TCR-mediated epigenetic regulation of the foxp3 gene.
TGF- antagonizes TCR signaling by targeting
DNMT1 for degradation via p38 activation- In addition to TCR signal strength, TGF- signaling also strongly modulates iTreg induction. Although 72 hours of 102S stimulation normally leads to very few iTregs, TGF- can exert a dominant effect which increases the proportion of iTregs substantially (Fig. 7A). It is known that TGF- acts through its receptor complex to trigger the activation of Smad3 protein, which then translocates to the nucleus and promotes foxp3 transcription(17). However, this classical pathway cannot explain how TGF- overcomes methylation-mediated transcriptional silencing within the foxp3 locus under the circumstance of strong TCR signaling. We thus investigated the direct impact of TGF- on epigenetic regulation of the foxp3 gene. When strong signals from both the TCR and TGF receptors were induced simultaneously, the TCR-mediated accumulation of DNMT1 protein was abolished (Fig. 7A&7B). The dampening of DNMT1 protein levels was also not related to TGF-’s inhibitory effects on T cell proliferation: a reduction of DNMT1 was observed in each successive generation when TGF- was
present (Fig. 7B). The regulation of DNMT1 by TGF- mainly occurred at the protein level, as the DNMT1 mRNA level was not affected by TGF- treatment (Fig. S4A). As could be expected from the reduced protein level of DNMT1, TGF- treatment also resulted in reduced CpG methylation within both the promoter (Fig. 7C) and CNS2 region of foxp3 (Fig. S4B).
We also examined whether TGF- signaling can effectively antagonize strong agonist-induced DNMT1 accumulation and iTreg differentiation. CD4 T cells stimulated with MCC alone for 72 hours have more DNMT1 protein accumulated than those stimulated with 102S for 72 hours (Fig. S5A). Similarly, in contrast to a relatively strong impact of TGF- signaling on DNMT1 accumulation in 102S-stimulated cells, TGF- could only moderately downregulate the DNMT1 protein in cells stimulated with MCC (Fig. S5A). In agreement with this, when same concentrations of TGF-were supplemented, MCC induced significantly less Foxp3+ cells (Fig. S5B). This suggested that excessive TCR signalling can antagonize TGF-effects on iTreg differentiation.
In addition to Smad-mediated transcriptional regulation, TGF-can also initiate alternative signalling via the Ras-ERK, TAK-MKK4-JNK, and TAK-MKK3-6-p38 pathways(46). During TCR stimulation of naïve T cells , ERK activation is inhibited by TGF-treatment(47), and this curtailed ERK signaling failed to increase foxp3 expression (Fig. 2A). We thus investigated the potential roles of the other two MAPK pathways in potentially linking TGF receptors to DNMT1 using well-established specific inhibitors. Whereas treatment with a specific JNK inhibitor had no effect, treatment with a p38 inhibitor completely abolished TGF--induced DNMT1 downregulation, as shown by both the frequency of DNMT1+ cells and the intensity of DNMT1 staining at the single-cell level (Fig. 7D). Consistent with these increased DNMT1 protein levels, blockade of the p38 pathway also resulted in a significant reduction of Foxp3 induction by TGF-Fig. 7E. These data suggest that TGF-β signaling antagonizes the effect of TCR signaling on DNMT1 stabilization and foxp3 gene methylation through the activation of p38.
DISCUSSION
by guest on May 28, 2018
http://ww
w.jbc.org/
Dow
nloaded from
- 9 -
Since it was first appreciated that Tregs could
be induced from naïve T cell precursors (48), the combinatorial roles of strong TCR signaling and strong TGF- receptor signaling have been well established as important determinants of foxp3 transcriptional activation(14-17). Here we have identified multiple pathways by which signaling through TCR and TGFbR converge to control the protein level of DNMT1, an epigenetic modifier that we and others(34) have shown to strongly influence foxp3 locus accessibility and iTreg differentiation. Our data suggest that DNMT1-mediated methylation in foxp3 locus is likely aided by DNMT3b. Upon short TCR stimulation, prior to strong DNMT1 elevation, a significant accumulation of DNMT3b protein is observed (Fig. 4C&4D). However, this cellular accumulation does not translate into increased DNMT3b occupancy within the foxp3 promoter region, which was only observed in cells receiving a prolonged stimulation (Fig. 5E). This suggests that there are additional factors required for the recruitment of DNMT3b to the foxp3 promoter. Previous studies showed that DNMT1 and DNMT3b co-localize and directly associate with each other through the N-terminal domain(35), which indicates that sufficient accumulation of DNMT1 triggered by a prolonged TCR stimulation may be required to recruit or anchor DNMT3b to the foxp3 locus. Therefore, our model suggests DNMT1 serves as the key modulator controlling transcriptional accessibility to foxp3’s regulatory regions.
One important function of DNMT1 is to maintain CpG methylation during DNA replication in the S-phase(49,50), and accordingly, the transcription of DNMT1 is regulated in a cell-cycle dependent manner(51). We observed a gradual enrichment of DNMT1 protein with the progression of cell divisions (Fig. 4C&7B), and a corresponding reduction of foxp3 expression in T cells from late generations (Fig. S1B). However, in the absence of TGF- and under different stimulatory conditions, strong TCR signaling suppresses Foxp3 expression to a similar extent in every generation, including undivided cells and the first generation of daughter cells (Fig. S1B). This indicates that DNMT1 could begin to accumulate in response to TCR signals even prior to the earliest cell cycle; and, that this is sufficient
to eventually suppress foxp3 expression. In addition, under various conditions of antigen stimulation, we did not detect any change in the mRNA level of DNMT1. We cannot exclude the contribution of cell cycle-dependent transcriptional regulation (especially in late T cell generations)(32,34), and the detailed mapping of GSK3- and p38-targeted phosphorylation sites on DNMT1 is still ongoing. However, taken together, our results argue for molecular mechanisms that involve direct post-translational modification of DNMT1 downstream of TCR and TGF- receptor signaling.
In its role as a signal integrator, we believe that DNMT1 represents the node where TCR-based self/non-self discrimination converges with environmentally-cued danger signals. TCR signals mitigate miR-148a-mediated DNMT1 translation inhibition, and also relieve GSK3-mediated DNMT1 protein degradation via PI3K and PLC- signaling (Fig. 6). Because TCRs with high avidity for self-antigens are preferentially deleted or converted to nTregs in the thymus, stronger TCR signaling can be interpreted via higher DNMT1 levels as an indication of foreignness, which then favors foxp3 methylation. CD28 costimulation can provide an independent indication of foreignness, as its ligands are induced on APCs by signaling in response to microbial and viral products. CD28 signaling can then also feed in to regulation of DNMT1 by enhancing TCR-induced PI3K activity, inhibiting GSK3, stabilizing DNMT1, and further favoring foxp3 methylation. Meanwhile, naïve T cells maintain an only partially methylated foxp3 promoter, presumably because the level of DNMT1 attained by tonic/homeostatic TCR signaling is below the threshold needed for foxp3 methylation. Finally, healthy or tumor tissues can exert influence on T cell priming by secreting TGF-which can act via p38 to antagonize strong TCR signaling by diminishing DNMT1 protein, impeding foxp3 methylation, and pushing the balance of immunity toward iTreg-mediated tolerance.
Whereas transcription factors such as NFAT can be activated within minutes, and less than one hour of TCR signaling is sufficient to drive T cells into the proliferative cycle(29), DNMT1 accumulates and methylates foxp3 over the course
by guest on May 28, 2018
http://ww
w.jbc.org/
Dow
nloaded from

- 10 -
of days. This mechanistic and temporal segregation of epigenetic control from transcription factor-mediated control could allow T cells to gauge the duration of TCR signaling over long periods (which likely represents the persistence of antigen). Furthermore, by segregating the commitment to proliferation from the commitment to silence foxp3, T cells can make the decision for clonal expansion shortly upon antigen encounter, but can integrate signals over the following days before finalizing their iTreg vs. Th fate. This dichotomous commitment process may thus support the adaptive immune response’s dual requirement for rapidity of response on the one hand, and accuracy of pathogenic discrimination on the other. In line with this possibility, it is noteworthy that human naïve T cells transiently express Foxp3 during priming, even when their eventual fate is an effector Th lineage(52,53). In the DNMT1-centric view, this would represent the early activity of NFAT/NFB/AP1 on a naïve T cell’s partially-methylated foxp3 promoter, which would only be completely repressed by DNMT1-mediated methylation after a much longer course of TCR signaling.
Overall, it is a well-appreciated concept that T cells interpret subtle differences between antigens and between antigens’ contextual cues to enact their fate decision; and, that it is epigenetic modifications that enforce the heritage of differentiated T cells(54-57). Our data illustrate a mechanism whereby TCR signaling and
environmental cues can target the epigenetic machinery directly in order to instruct differentiating T cells. Unlike most cell types, in which differentiation and proliferation are in general mutually exclusive, T cells acquire their identities in the midst of rapid proliferation. It would be difficult to imagine how T cells could employ transcription factor activation as a heritable mechanism: first, in the absence of ligands, the activation status of TCR(29) or transcription factors (e.g. NFAT(58)) can only be maintained within the range of minutes following ligand withdrawal, and so would be unlikely to preserve their activation state between mother and daughter cells; second, the newly divided daughter cell makes brief contact with APCs in vivo(59), which likely gives them different antigen experience than their mother cells. In contrast, direct TCR-driven epigenetic reprogramming can mark mother cells’ antigen experiences in the genome during the commitment to cell division, which then keeps daughter T cells poised according to their mothers’ lineage choice. These features are also not likely to be exclusive to the iTreg lineage choice. The Th2 and Th17 lineages are also antagonized by strong TCR signal strength, and il-4 and il-17 are both expressed in a methylation-sensitive manner(2-5). Thus, upon TCR activation, it may be possible that DNMT1 or another epigenetic mechanism also controls master transcription factors or signature cytokines of Th2 and Th17 lineages in a manner analogous to foxp3.
by guest on May 28, 2018
http://ww
w.jbc.org/
Dow
nloaded from

- 11 -
REFERENCES 1. Zhu, J., Yamane, H., and Paul, W. E. (2010) Annual review of immunology 28, 445-489 2. Yamane, H., Zhu, J., and Paul, W. E. (2005) The Journal of experimental medicine 202,
793-804 3. Tao, X., Grant, C., Constant, S., and Bottomly, K. (1997) Journal of immunology 158,
4237-4244 4. Constant, S., Pfeiffer, C., Woodard, A., Pasqualini, T., and Bottomly, K. (1995) The
Journal of experimental medicine 182, 1591-1596 5. Purvis, H. A., Stoop, J. N., Mann, J., Woods, S., Kozijn, A. E., Hambleton, S., Robinson,
J. H., Isaacs, J. D., Anderson, A. E., and Hilkens, C. M. (2010) Blood 116, 4829-4837 6. Sakaguchi, S., Yamaguchi, T., Nomura, T., and Ono, M. (2008) Cell 133, 775-787 7. Fontenot, J. D., Gavin, M. A., and Rudensky, A. Y. (2003) Nature immunology 4, 330-
336 8. Hori, S., Nomura, T., and Sakaguchi, S. (2003) Science 299, 1057-1061 9. Khattri, R., Cox, T., Yasayko, S. A., and Ramsdell, F. (2003) Nature immunology 4, 337-
342 10. Williams, L. M., and Rudensky, A. Y. (2007) Nature immunology 8, 277-284 11. Bennett, C. L., Christie, J., Ramsdell, F., Brunkow, M. E., Ferguson, P. J., Whitesell, L.,
Kelly, T. E., Saulsbury, F. T., Chance, P. F., and Ochs, H. D. (2001) Nature genetics 27, 20-21
12. Brunkow, M. E., Jeffery, E. W., Hjerrild, K. A., Paeper, B., Clark, L. B., Yasayko, S. A., Wilkinson, J. E., Galas, D., Ziegler, S. F., and Ramsdell, F. (2001) Nature genetics 27, 68-73
13. Curotto de Lafaille, M. A., and Lafaille, J. J. (2009) Immunity 30, 626-635 14. Mantel, P. Y., Ouaked, N., Ruckert, B., Karagiannidis, C., Welz, R., Blaser, K., and
Schmidt-Weber, C. B. (2006) Journal of immunology 176, 3593-3602 15. Kim, H. P., and Leonard, W. J. (2007) The Journal of experimental medicine 204, 1543-
1551 16. Long, M., Park, S. G., Strickland, I., Hayden, M. S., and Ghosh, S. (2009) Immunity 31,
921-931 17. Tone, Y., Furuuchi, K., Kojima, Y., Tykocinski, M. L., Greene, M. I., and Tone, M.
(2008) Nature immunology 9, 194-202 18. Martinez, G. J., Zhang, Z., Chung, Y., Reynolds, J. M., Lin, X., Jetten, A. M., Feng, X.
H., and Dong, C. (2009) The Journal of biological chemistry 284, 35283-35286 19. Huehn, J., Polansky, J. K., and Hamann, A. (2009) Nature reviews. Immunology 9, 83-89 20. Lal, G., and Bromberg, J. S. (2009) Blood 114, 3727-3735 21. Janson, P. C., Winerdal, M. E., Marits, P., Thorn, M., Ohlsson, R., and Winqvist, O.
(2008) PloS one 3, e1612 22. Floess, S., Freyer, J., Siewert, C., Baron, U., Olek, S., Polansky, J., Schlawe, K., Chang,
H. D., Bopp, T., Schmitt, E., Klein-Hessling, S., Serfling, E., Hamann, A., and Huehn, J. (2007) PLoS biology 5, e38
23. Jiang, S., Li, C., Olive, V., Lykken, E., Feng, F., Sevilla, J., Wan, Y., He, L., and Li, Q. J. (2011) Blood 118, 5487-5497
24. Sauer, S., Bruno, L., Hertweck, A., Finlay, D., Leleu, M., Spivakov, M., Knight, Z. A., Cobb, B. S., Cantrell, D., O'Connor, E., Shokat, K. M., Fisher, A. G., and
by guest on May 28, 2018
http://ww
w.jbc.org/
Dow
nloaded from

- 12 -
Merkenschlager, M. (2008) Proceedings of the National Academy of Sciences of the United States of America 105, 7797-7802
25. Kretschmer, K., Apostolou, I., Hawiger, D., Khazaie, K., Nussenzweig, M. C., and von Boehmer, H. (2005) Nature immunology 6, 1219-1227
26. Seder, R. A., Paul, W. E., Davis, M. M., and Fazekas de St Groth, B. (1992) The Journal of experimental medicine 176, 1091-1098
27. Davis, M. M., Boniface, J. J., Reich, Z., Lyons, D., Hampl, J., Arden, B., and Chien, Y. (1998) Annual review of immunology 16, 523-544
28. Reay, P. A., Kantor, R. M., and Davis, M. M. (1994) Journal of immunology 152, 3946-3957
29. Huppa, J. B., Gleimer, M., Sumen, C., and Davis, M. M. (2003) Nature immunology 4, 749-755
30. Haxhinasto, S., Mathis, D., and Benoist, C. (2008) The Journal of experimental medicine 205, 565-574
31. Smith-Garvin, J. E., Koretzky, G. A., and Jordan, M. S. (2009) Annual review of immunology 27, 591-619
32. Josefowicz, S. Z., and Rudensky, A. (2009) Immunity 30, 616-625 33. Zheng, Y., Josefowicz, S., Chaudhry, A., Peng, X. P., Forbush, K., and Rudensky, A. Y.
(2010) Nature 463, 808-812 34. Josefowicz, S. Z., Wilson, C. B., and Rudensky, A. Y. (2009) Journal of immunology
182, 6648-6652 35. Kim, G. D., Ni, J., Kelesoglu, N., Roberts, R. J., and Pradhan, S. (2002) The EMBO
journal 21, 4183-4195 36. Rhee, I., Bachman, K. E., Park, B. H., Jair, K. W., Yen, R. W., Schuebel, K. E., Cui, H.,
Feinberg, A. P., Lengauer, C., Kinzler, K. W., Baylin, S. B., and Vogelstein, B. (2002) Nature 416, 552-556
37. Zhou, X., Jeker, L. T., Fife, B. T., Zhu, S., Anderson, M. S., McManus, M. T., and Bluestone, J. A. (2008) The Journal of experimental medicine 205, 1983-1991
38. Schoenborn, J. R., Dorschner, M. O., Sekimata, M., Santer, D. M., Shnyreva, M., Fitzpatrick, D. R., Stamatoyannopoulos, J. A., and Wilson, C. B. (2007) Nature immunology 8, 732-742
39. Cohen, P., and Frame, S. (2001) Nature reviews. Molecular cell biology 2, 769-776 40. Cross, D. A., Alessi, D. R., Cohen, P., Andjelkovich, M., and Hemmings, B. A. (1995)
Nature 378, 785-789 41. Goode, N., Hughes, K., Woodgett, J. R., and Parker, P. J. (1992) The Journal of
biological chemistry 267, 16878-16882 42. Sun, L., Zhao, H., Xu, Z., Liu, Q., Liang, Y., Wang, L., Cai, X., Zhang, L., Hu, L., Wang,
G., and Zha, X. (2007) Cellular signalling 19, 2255-2263 43. Fabian, M. R., Sonenberg, N., and Filipowicz, W. (2010) Annual review of biochemistry
79, 351-379 44. Pan, W., Zhu, S., Yuan, M., Cui, H., Wang, L., Luo, X., Li, J., Zhou, H., Tang, Y., and
Shen, N. (2010) Journal of immunology 184, 6773-6781 45. Huang, J., Wang, Y., Guo, Y., and Sun, S. (2010) Hepatology 52, 60-70 46. Li, M. O., Wan, Y. Y., Sanjabi, S., Robertson, A. K., and Flavell, R. A. (2006) Annual
review of immunology 24, 99-146
by guest on May 28, 2018
http://ww
w.jbc.org/
Dow
nloaded from

- 13 -
47. Luo, X., Zhang, Q., Liu, V., Xia, Z., Pothoven, K. L., and Lee, C. (2008) Journal of immunology 180, 2757-2761
48. Chen, W., Jin, W., Hardegen, N., Lei, K. J., Li, L., Marinos, N., McGrady, G., and Wahl, S. M. (2003) The Journal of experimental medicine 198, 1875-1886
49. Li, E., Bestor, T. H., and Jaenisch, R. (1992) Cell 69, 915-926 50. Jackson-Grusby, L., Beard, C., Possemato, R., Tudor, M., Fambrough, D., Csankovszki,
G., Dausman, J., Lee, P., Wilson, C., Lander, E., and Jaenisch, R. (2001) Nature genetics 27, 31-39
51. Szyf, M., Bozovic, V., and Tanigawa, G. (1991) The Journal of biological chemistry 266, 10027-10030
52. Pillai, V., Ortega, S. B., Wang, C. K., and Karandikar, N. J. (2007) Clinical immunology 123, 18-29
53. Wang, J., Ioan-Facsinay, A., van der Voort, E. I., Huizinga, T. W., and Toes, R. E. (2007) European journal of immunology 37, 129-138
54. Wei, G., Wei, L., Zhu, J., Zang, C., Hu-Li, J., Yao, Z., Cui, K., Kanno, Y., Roh, T. Y., Watford, W. T., Schones, D. E., Peng, W., Sun, H. W., Paul, W. E., O'Shea, J. J., and Zhao, K. (2009) Immunity 30, 155-167
55. Mukasa, R., Balasubramani, A., Lee, Y. K., Whitley, S. K., Weaver, B. T., Shibata, Y., Crawford, G. E., Hatton, R. D., and Weaver, C. T. (2010) Immunity 32, 616-627
56. Youngblood, B., Oestreich, K. J., Ha, S. J., Duraiswamy, J., Akondy, R. S., West, E. E., Wei, Z., Lu, P., Austin, J. W., Riley, J. L., Boss, J. M., and Ahmed, R. (2011) Immunity 35, 400-412
57. Vijayanand, P., Seumois, G., Simpson, L. J., Abdul-Wajid, S., Baumjohann, D., Panduro, M., Huang, X., Interlandi, J., Djuretic, I. M., Brown, D. R., Sharpe, A. H., Rao, A., and Ansel, K. M. (2012) Immunity 36, 175-187
58. Ebert, P. J., Ehrlich, L. I., and Davis, M. M. (2008) Immunity 29, 734-745 59. Mempel, T. R., Henrickson, S. E., and Von Andrian, U. H. (2004) Nature 427, 154-159 Acknowledgments- We are in debt to Dr. Mark Davis (Stanford) for pMHC blocking antibodies used in this study. We thank Jose Sevilla for his help with all animal work. FOOTNOTES *Q.-J.L. is a Whitehead Family Foundation Scholar and this work was supported by grants from the American Diabetes Association (1-10-JF-28), the American Cancer Society (RSG-10-157-01-LIB), and NIAID, NIH (RAI091878A and RAI091878B). 1To whom correspondence should be addressed: Qi-Jing Li, Department of Immunology, Duke University Medical Center, 207 Research Drive, Durham, NC, USA, Tel: 919-668-4070; Fax: 919-613-6602; Email: [email protected] 2Genentech, 1 DNA Way, South San Francisco, CA 94080, USA 3The abbreviations used are TCR, T cell antigen receptor; TGF-β, Transforming growth factor beta; DNMT, DNA (cytosine-5)-methyltransferase; foxp3, Forkhead box P3; GSK3 Glycogen synthase kinase 3 beta; CFSE, Carboxyfluorescein succinimidyl ester
by guest on May 28, 2018
http://ww
w.jbc.org/
Dow
nloaded from
- 14 -
FIGURE LEGENDS Figure 1. Suboptimal TCR activation in terms of both strength and duration favors iTreg differentiation. (A) Schematic view of the workflow for analyzing the role of TCR strength and duration in iTreg differentiation. Briefly, sorted CD4+CD25- T cells from the lymph nodes of 5C.C7 TCR transgenic mice were labeled with Carboxyfluorescein succinimidyl ester (CFSE), cultured with syngeneic T cell-depleted splenocytes without peptide in the presence of 10ng/ml recombinant IL-7, or stimulated by syngeneic T cell-depleted splenocytes loaded with a strong agonist peptide MCC (1 μM) or a weak agonist 102S (1 μM). Anti-I-Ek antibody or small molecule inhibitors that block specific pathways were added at the indicated time points. The percentages of CD4+Foxp3+ T cells were analyzed by intracellular staining and flow cytometry at 72hrs. (B&D) Percentages of iTregs generated with the indicated TCR stimulatory strength and duration. (B) Representative FACS plot. (D) Statistical analysis. Data show means ± SEM from three independent experiments. (C) At the end of culture, CD4 T cells were FACS sorted and total RNA was extracted for qPCR analysis. Data show means ± SEM from three independent experiments. (E) Sorted CD4+CD25- T cells from the lymph nodes of C57BL/6 mice were labeled with CFSE, and then stimulated with various concentrations of plate-bound anti-CD3 and anti-CD28 antibody for 18 hours. After this, the cells were either further stimulated with anti-CD3 and anti-CD28 for 54 hours (TCR 72 hours total), or maintained without TCR stimulation for 54 hours (TCR 18 hours). The induction of Foxp3 was then examined by intracellular staining. Data represent three independent experiments. Figure 2. PI3K-Akt-mTOR and PLC pathways downstream of TCR signaling negatively regulate iTreg differentiation. (A) Sorted CD4+CD25- T cells from 5C.C7 transgenic mice were stimulated with 1μM 102S for 72hrs as described in Fig.1A. LY 294002 (10μM), rapamycin (25nM), CsA (Cyclosporin A, 1μg/ml), IKK (IKK inhibitor III, BMS-345541, 1μM), ERK (ERK inhibitor II, FR180204, 1μM), PI3K (PIK-75, 100nM), or PLC (U-73122, 1μM) were added at the indicated time points to block specific pathways downstream of TCR signaling. The percentages of CD4+Foxp3+ T cells were analyzed by flow cytometry at 72hrs after TCR activation. The bar graph shows means ± SEM from three independent experiments. (B&C) Sorted CD4+CD25- T cells from 5C.C7 transgenic mice were stimulated with 1μM 102S or MCC for 72hrs. Inhibitors that specifically block the PI3K, PLC or ERK pathways were added at 18hrs after TCR stimulation. The percentages of CD4+Foxp3+ T cells were analyzed by flow cytometry at 72hrs after TCR activation. (B) Representative FACS plots. (C) The bar graph shows means ± SEM from three independent experiments. Figure 3. Strong TCR signaling enhances CpG methylation within the foxp3 locus. (A&B) CD4+CD25- T cells from male 5C.C7 transgenic mice were stimulated as described in Fig.1A. The methylation status of CpG islands within the foxp3 promoter (A) or foxp3 CNS2 (B) from these cells was determined by bisulfite sequencing analysis. Each row represents one DNA strand. The number on top indicates the position of CpGs relative to the transcription start site of the foxp3 gene. Open circle: unmethylated CpGs; filled circle: methylated CpGs. Data represent three independent experiments. (C) 5C.C7 T cells were activated with 102S for 72hrs, while also being treated with 5-azacytidine at 18hrs post-stimulation. The percentages of CD4+Foxp3+ T cells were analyzed by flow cytometry at 72hrs after TCR activation. Data represent three independent experiments. Figure 4. DNMT1 and DNMT3b are posttranscriptionally upregulated by TCR signaling in a strength- and duration-dependent manner. (A&B) CD4+CD25- T cells from 5C.C7 transgenic mice were left unstimulated (TCR-0h), or stimulated with 1μM 102S for 6hrs (TCR 6h) or 72hrs (TCR 72h), and then sorted by FACS. Total RNA and protein were extracted, and relative expression of (A) dnmt1 mRNA (B) dnmt3b mRNA, and (C) DNMT1 protein (D) DNMT3b protein were determined by qPCR and western blot analysis. In (A&B), data show
by guest on May 28, 2018
http://ww
w.jbc.org/
Dow
nloaded from

- 15 -
means ± SEM from three independent experiments. (E&F) CD4+CD25- T cells from 5C.C7 transgenic mice were labeled with CFSE and stimulated as described in Fig.1A. The expression of DNMT1 protein at the single cell level was determined by intracellular staining. (E) Representative FACS plots. (F) Statistical analysis. Data show means ± SEM from three independent experiments. (G&H) Sorted CD4+GFP- T cells from the lymph nodes of Foxp3-GFP-Cre mice were stimulated with 0.1ug/ml plate-bound anti-CD3 and 1ug/ml anti-CD28 antibody for 18 hours, and then maintained without further TCR stimulation for 54 hours. GFP+ and GFP- CD4 T cells were then sorted (G) for examination of DNMT1 protein by western blot (H). Figure 5. Strong TCR signaling causes enhanced enrichment of DNMT1 and DNMT3b at the foxp3 locus. (A) Representative images showing the nuclear localization of DNMT1. CD4+CD25- T cells from 5C.C7 transgenic mice were stimulated as described in Fig.1A. The cells were then fixed with 4% PFA on cover slips and stained for intracellular DNMT1. DAPI was used to label the nucleus. Data represent three independent experiments. (B-F) Chromatin immunoprecipitation analysis for the enrichment of DNMT1 at (B) foxp3 promoter, (C) foxp3 CNS2, and (D) Ifng CNS-6, or DNMT3b at (E) foxp3 promoter, and (F) foxp3 CNS2 in 5C.C7 transgenic CD4+CD25- T cells that were left unstimulated (TCR-0h), or stimulated as in (A). The amount of DNA immunoprecipitated by the DNMT1or DNMT3b-specific antibody or a nonspecific control IgG antibody was quantified by qPCR using primers specific for the indicated gene-regulatory regions and normalized to the input prior to immunoprecipitation. Data show the means ± SEM from three independent experiments. Figure 6. TCR signaling stabilizes DNMT1 by inhibiting GSK3-induced proteasomal degradation of DNMT1 and repressing miR-148a-mediated inhibition of DNMT1 translation. (A) CD4+CD25- T cells from 5C.C7 transgenic mice were stimulated with 1μM 102S for 18hrs, and treated with 0.4μM MG-132 or 1μM GSK3-β inhibitor SB-216763 at 18hrs post-TCR stimulation. The expression of DNMT1 protein at 72hrs was quantified by intracellular staining of DNMT1 followed by flow cytometry analysis. Cells that were activated with 1μM 102S for 72hrs or 1μM MCC for 18hrs without other treatment were used as controls. Data show means ± SEM from three independent experiments. (B) CD4+CD25- T cells from 5C.C7 transgenic mice were labeled with CFSE and stimulated with 1μM 102S for the indicated durations. 1μM GSK3-β inhibitor or its non-functional analog were added at 18hrs together with either 100nM PIK-75 (PI3K-18h) or 1μM U-73122 (PLC-18h). The percentages of CD4+Foxp3+ T cells were analyzed by flow cytometry at 72hrs after TCR activation. Data represent three independent experiments. (C) 5C.C7 CD4+CD25- T cells were stimulated with 1μM 102S for the indicated durations. The CD4 T cells were then FACS-sorted and total RNA was extracted. The relative expression of miR-148a, miR-148b, and miR-152 transcript was quantified by qPCR analysis. Data show the means ± SEM from three independent experiments. (D) 5C.C7 CD4+CD25- T cells were activated with 1μM 102S and transduced with retrovirus that encodes GFP only (mock), miR-148a together with GFP (miR-148a), miR-148b together with GFP (miR-148b), and miR-152 together with GFP (miR-152). Three days after transduction, CD4+GFP+ T cells were sorted and extracted for total protein. DNMT1 protein level was quantified by western blot analysis. Data represent three independent experiments. (E&F) 5C.C7 CD4+CD25- T cells were primed and transduced with mock virus or miR-148a as described, and then cultured in the presence of 50unit/ml IL-2 and 2ng/ml TGF-for 4 days. The percentages of CD25+Foxp3+ T cells were analyzed by flow cytometry. (E) representative FACS plot; (F) Statistical analysis. Data show means ± SEM from three independent experiments. Figure 7. TGF- signaling antagonizes TCR-signal-mediated DNMT1 stabilization via the p38 pathway. (A&B) CD4+CD25- T cells from 5C.C7 transgenic mice were labeled with CFSE, and stimulated with 1μM 102S in the absence (TCR) or presence of 5ng/ml TGF-CR+TGF-for 72hrs. The expression
by guest on May 28, 2018
http://ww
w.jbc.org/
Dow
nloaded from

- 16 -
of DNMT1 and Foxp3 at the single cell level was quantified by intracellular staining. (A) Representative FACS plots. (B) Statistical analysis. Data show means ± SEM from three independent experiments. (C) The methylation status of CpG islands in these cells’ foxp3 promoters was determined by bisulfite sequencing analysis. Data represent three independent experiments. (D) CD4+CD25- T cells from 5C.C7 transgenic mice were stimulated with 1μM 102S and 5ng/ml TGF-in the presence of 1μM JNK inhibitor II (SP600125) or 10μM p38 MAP kinase inhibitor III (ML3403) for 72hrs. The expression of DNMT1 was determined by intracellular staining. MFI: mean fluorescence intensity. Top: representative FACS plot; Bottom: Statistical analysis. Data show means ± SEM from three independent experiments. (E) 5C.C7 transgenic CD4+CD25- T cells were stimulated with 1μM 102S and 5ng/ml TGF-in the presence of 10μM p38 MAP kinase inhibitor III (ML3403) or DMSO for 72hrs. The percentages of CD4+Foxp3+ T cells were analyzed by flow cytometry. Top: representative FACS plot. Bottom: Statistical analysis. Data show means ± SEM from four independent experiments.
by guest on May 28, 2018
http://ww
w.jbc.org/
Dow
nloaded from

Fig.1
B
C D
CD4+CD25- 5C.C7 T cellsstimulated with peptides
(no addition of TGFb)
anti-I-Ekor inhibitor
anti-I-Ekor inhibitor
anti-I-Ekor inhibitor
6h 18h 48h 72h 0h
Cell harvested and analyzed for Foxp3 expressionA
TCR 6h TCR 18h TCR 72h
1μM MCC
1μM 102S
TCR 0h
CFSE
Foxp
3
2.8311.4
0.8 0.6
0.019 6.74
2.03
E
TCR-0h 102-6h 102s-72h MCC-6h0
1
2
3
4
Rel
ativ
e Ex
pres
sion
of f
oxp3
mR
NA
P=0.0007 P=0.0003
0.53 8.55 26.25.12
anti-CD3:anti-CD28:
1ug/ml1ug/ml
1ug/ml1ug/ml
0.2ug/ml1ug/ml
0.1ug/ml1ug/ml
72hrs 18hrs
Violet Live/Death
Foxp
3
P<0.0001
P=0.0016P=0.0405
TCR-0h
no pe
ptide
102S
-6hrs
102S
-18hrs
102S
-72hrs
MCC-18hrs
MCC-72hrs
0123456789
1011
% o
f Fox
p3+ C
D4
T ce
lls
by guest on May 28, 2018
http://ww
w.jbc.org/
Dow
nloaded from

A
B C
Fig.3-2
01-7
1-6
2-5
3-5
0-3
5
TCR-0h
-201
-71
-62
-53
-50
-35
102s-6h
-201
-71
-62
-53
-50
-35
102s-72h
-201
-71
-62
-53
-50
-35
MCC-6h
CD25
0.81
no treatment
26.6
5-Aza
Foxp
3
+427
5+4
311
+432
7+4
361
+438
8+4
393
102s-6h
+444
2+4
461
+446
6+4
473
+427
5+4
311
+432
7+4
361
+438
8+4
393
TCR-0h
+444
2+4
461
+446
6+4
473
+427
5+4
311
+432
7+4
361
+438
8+4
393
102S-72h
+444
2+4
461
+446
6+4
473
+427
5+4
311
+432
7+4
361
+438
8+4
393
MCC-6h
+444
2+4
461
+446
6+4
473
CNS2 of foxp3 gene
Promoter of foxp3 gene by guest on M
ay 28, 2018http://w
ww
.jbc.org/D
ownloaded from

Fig.4
E
isotype DNMT1
102S
MCC
18hrs
isotype DNMT1
72hrs
isotype DNMT1
0h
CFSE
anti-
rabb
it-P
B
0.2 0.5 1.24 22.8 2.61 47.3
3.14 51 1.36 48.5
F
GFP- (Foxp3-)GFP+(Foxp3+)
Foxp3-GFP
Post SortGFP+
(Foxp3+)
DNMT1
b-actin
G H
DNMT1 mRNA
TCR-0h 102s-6h 102s-72h0.0
0.2
0.4
0.6
0.8
1.0
A B
DNMT1
b-actin
TCR 102s 102s 0h 6h 72h
C
b-actin
DNMT3b
TCR 0h
102s 6h
102s 72h
DNMT3b mRNA
TCR-0h 102s-6h 102s-72h0.0
0.2
0.4
0.6
0.8
1.0
1.2
rela
tive
expr
essi
on le
vel
D
P=0.039P=0.0003
TCR 0h
no peptid
e
102S
-18hrs
102S
-72hrs
MCC-18hrs
MCC-72hrs
0
20
40
60
% o
f DN
MT1
+ CD
4 T
cells
P<0.0001
GFP-(Foxp3-)
by guest on May 28, 2018
http://ww
w.jbc.org/
Dow
nloaded from

Figure 5
A B
C
TCR-0h 102S-6h 102S-72h
MCC-6h MCC-72hBlue: DAPIRed: DNMT1
0.00.10.20.30.40.50.60.70.80.9 DNMT1
IgG
0.00.10.20.30.40.50.6
0.0
0.1
0.2
0.3
0.4
0.5
0.6
0.7
0.8 DNMT1IgG
0.0
0.1
0.2
0.3
0.4
0.5
D
0.00
0.25
0.50
0.75
1.00DNMT1IgG
0.00
0.25
0.50
foxp3 Promoter
p=0.0003p=0.0378
foxp3 CNS2
p=0.0172p=0.0483
ifng CNS-6
nsns
E Ffoxp3 Promoter
TCR-0h
102s
-6h
102s
-72h
MCC-6h0.0
0.1
0.2
0.3
0.4
0.5 DNMT3bIgG
% o
f inp
ut
p=0.003p=0.0037
ns
ns
foxp3 CNS2
TCR-oh
102s
-6h
102s
-72h
MCC-6h0.0
0.2
0.4
0.6
0.8DNMT3bIgG
% o
f inp
ut
by guest on May 28, 2018
http://ww
w.jbc.org/
Dow
nloaded from
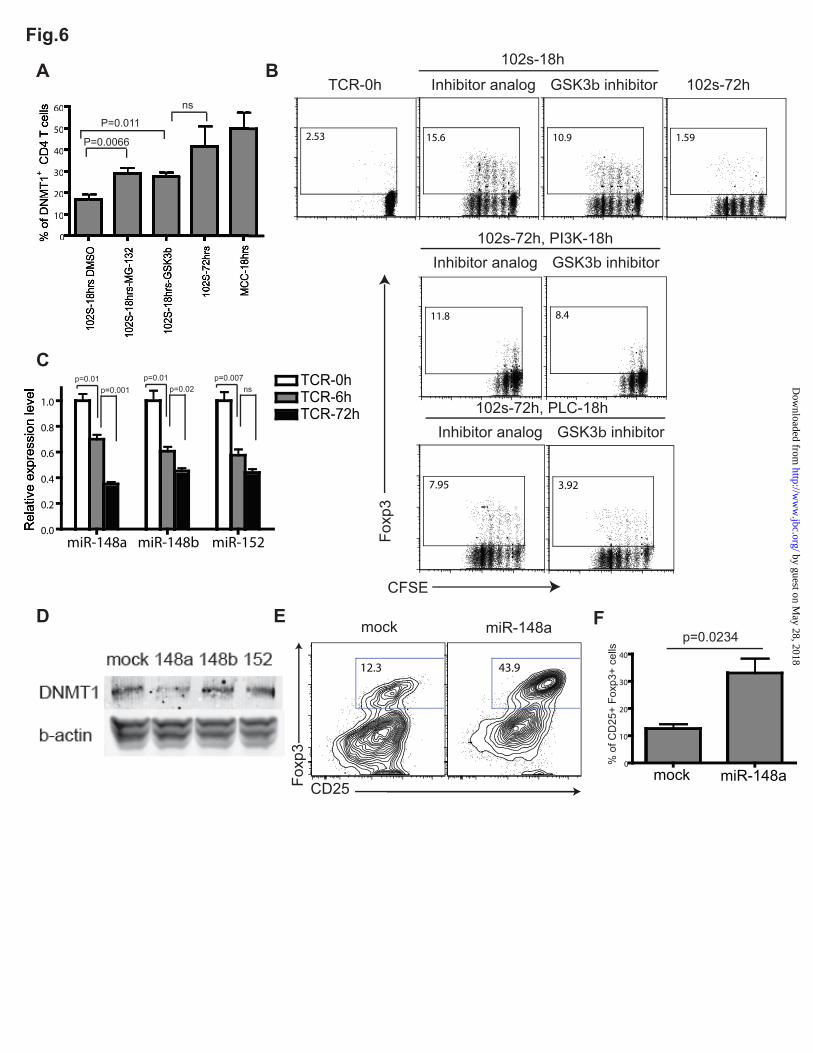
Fig.6
A B
C
TCR-0h Inhibitor analog GSK3b inhibitor
102s-18h
Inhibitor analog GSK3b inhibitor102s-72h, PI3K-18h
Inhibitor analog GSK3b inhibitor102s-72h, PLC-18h
102s-72h
CFSE
Foxp
3
0
10
20
30
40
50
60
0
10
20
30
40
50
60
P=0.0066
P=0.011
ns
D E
miR-148a miR-148b miR-1520.0
0.2
0.4
0.6
0.8
1.0
TCR-0hTCR-6hTCR-72h
p=0.01p=0.001
p=0.01p=0.02
p=0.007ns
12.3 43.9
CD25Foxp
3
mock miR-148a F
mock miR-148a0
10
20
30
40
p=0.0234
% o
f CD
25+
Foxp
3+ c
ells
2.53 10.915.6 1.59
8.411.8
3.927.95
by guest on May 28, 2018
http://ww
w.jbc.org/
Dow
nloaded from

Fig.7A
0
5
10
15
20
25
30
35
-TGFb +TGFb
div 0 div 1 div 2 div 3 div 40
10
20
30
40
50
60-TGFβ+TGFβ
B
C D
E
21.242.9
Foxp3
DMSO P38 inhibitor
DMSO P38 inhibitor05
1015202530354045
1.4 37.5 10.9
isotype TCR TCR+TGFb
CFSE
DN
MT1
1.12 55.2
Foxp
3
CFSE
05
1015202530354045
05
1015202530354045
P=0.0042
P<0.0001
P=0.0019
-201
-71
-62
-53
-50
-35
TCR-72h
-201
-71
-62
-53
-50
-35
TCR+TGFb-72h
MFI: 877TCR+TGFb-72h DMSO DNMT1
TCR+TGFb-72h isotype MFI: 508TCR+TGFb-72h JNK DNMT1 MFI: 797
MFI: 877TCR+TGFb-72h DMSO DNMT1TCR+TGFb-72h P38 DNMT1 MFI: 1424TCR+TGFb-72h isotype MFI: 508
DNMT1
DNMT1
by guest on May 28, 2018
http://ww
w.jbc.org/
Dow
nloaded from

Chaoran Li, Peter J. R. Ebert and Qi-Jing Li(foxp3) locus methylation and inducible regulatory T cell differentiation
converge on DNA (cytosine-5)-methyltransferase to control forkhead box protein 3 ) signalingβT cell receptor (TCR) and transforming growth factor beta (TGF-
published online May 16, 2013J. Biol. Chem.
10.1074/jbc.M113.453357Access the most updated version of this article at doi:
Alerts:
When a correction for this article is posted•
When this article is cited•
to choose from all of JBC's e-mail alertsClick here
Supplemental material:
http://www.jbc.org/content/suppl/2013/05/16/M113.453357.DC1
by guest on May 28, 2018
http://ww
w.jbc.org/
Dow
nloaded from


![IMMUNOGLOBULINE E T CELL RECEPTOR T. Strachan e A.P. … · B cell antigen receptor tetramero [ IgH 2 + IgL 2 (Ig oppure Ig )] T cell receptor (TCR) eterodimero TCR /TCR TCR /TCR](https://img.dokumen.tips/doc/110x75/5c017b5c09d3f26f1e8cc6a0/immunoglobuline-e-t-cell-receptor-t-strachan-e-ap-b-cell-antigen-receptor.jpg)