Embed Size (px)
Citation preview

BlackRock TCP Capital Corp. Investor PresentationMarch 31, 2020

2
Prospective investors considering an investment in BlackRock TCP Capital Corp. should consider the investment objectives, risks
and expenses of the Company carefully before investing. This information and other information about the Company are
available in the Company's filings with the Securities and Exchange Commission ("SEC"). Copies are available on the SEC's
website at www.sec.gov and the Company's website at www.tcpcapital.com. Prospective investors should read these materials
carefully before investing.
This presentation may contain forward-looking statements within the meaning of the Private Securities Litigation Reform Act of
1995. Forward-looking statements are based on estimates, projections, beliefs and assumptions of management of the Company
at the time of such statements and are not guarantees of future performance. Forward-looking statements involve risks and
uncertainties in predicting future results and conditions. These forward-looking statements do not meet the safe harbor for
forward-looking statements pursuant to Section 27A of the Securities Act or Section 21E of the Securities Exchange Act. Actual
results could differ materially from those projected in these forward-looking statements due to a variety of factors, including,
without limitation, changes in general economic conditions or changes in the conditions of the industries in which the Company
makes investments, risks associated with the availability and terms of financing, changes in interest rates, availability of
transactions, and regulatory changes. Certain factors that could cause actual results to differ materially from those contained in
the forward-looking statements are included in the "Risks" section of the Company’s prospectus dated August 16, 2019 and its
prospectus supplement dated November 19, 2019, the “Risk Factors” section of the Company’s Form 10-K for the year ended
December 31, 2019, and the Company's subsequent periodic filings with the SEC. Copies are available on the SEC's website at
www.sec.gov and the Company's website at www.tcpcapital.com. Forward-looking statements are made as of the date of this
presentation, or as of the prior date referenced in this presentation, and are subject to change without notice. The Company has
no duty and does not undertake any obligation to update or revise any forward-looking statements based on the occurrence of
future events, the receipt of new information, or otherwise.
Forward Looking Statements

3
BlackRock TCP Capital Corp - Response to COVID-19
As of March 31, 2020
Our Team Our Portfolio Our Firm
Leveraging our team’s more than 20 years’ experience investing across
market cycles , as well as our special situations expertise
Thorough and ongoing analysis of every company in our portfolio to
proactively address COVID-19 impacts
Business continuity procedures fully operational – employees have access to BlackRock tools, technology and
connectivity from home
Additional resources, including technology and benefits, committed across BlackRock for the safety and
well-being of employees
Working alongside management
teams and sponsors to identify issues
quickly and help borrowers navigate
the current environment
Utilizing resources throughout the BlackRock platform, including
expertise across asset classes, broad market access and corporate
relationships

4
First Quarter 2020 Financial and Portfolio Overview
Flexible Capital With
Available Liquidity
▪ Diverse leverage program totaling $1.2 billion, with no near-term maturities
▪ 53% of outstanding liabilities consist of unsecured debt
▪ $259 million of available credit facility capacity
▪ Net regulatory leverage ratio of 1.22x, well within our 2:1 leverage limitation
▪ Repurchased 1 million shares; NAV contribution of $0.09 per share
Diversified Portfolio with an
Emphasis on Non-Cyclical
Businesses
▪ Total portfolio fair value of $1.6 billion diversified across 108 portfolio companies
▪ Top five portfolio companies just 16% of the total portfolio
▪ 93% invested in senior secured debt, 83% of the debt portfolio is 1st lien
▪ Weighted average yield of the portfolio is 10.3%(1)
▪ No new non-accruals in the first quarter; non-accruals 0.2% of the portfolio at fair value
Well-Resourced Platform
▪ Advisor has more than 2 decades of experience across multiple market cycles
▪ BlackRock platform provides access to technology capabilities, knowledge and global resources
across asset classes and sectors
As of March 31, 2020
(1) Weighted average annual effective yield includes amortization of deferred debt origination and end-of-term fees and accretion of original issue discount, but excludes market discount, any prepayment and make-whole fee income, and any debt investments that are distressed or on non-accrual status. Weighted average effective yield on the total portfolio (including debt investments that are distressed or on non-accrual status and equity investments) was 9.8% as of 3/31/2020.
Past performance does not guarantee future returns.

5
Commercial Services and Supplies 1.8%
Pharmaceuticals 1.3%
Electrical Equipment 1.0%
Internet Software and Services 12.0%
Diversified Financial Services 11.1%
Professional Services 5.7%
Textiles, Apparel and Luxury Goods 6.2%
Software 6.4%
Media 4.3%
Automobiles 4.2%Diversified Consumer Services 4.0%
Diversified Telecommunication Services 3.9%
IT Services 3.8%
Airlines 3.3%
Insurance 3.8%
Consumer Finance 2.9%
Building Products 2.2%
Health Care Technology 2.3%
Energy Equipment and Services 1.8%
Thrifts and Mortgage Finance 1.7%
Hotels, Restaurants and Leisure 2.6%
Tobacco Related 1.6%
Road and Rail 1.1%
Capital Markets 2.6%
Aerospace and Defense 1.6%
Other 6.8%
Diversified Portfolio: Emphasis on Non-Cyclical Businesses
(1) Industry classification system generally categorizes portfolio companies based on the primary end market served, rather than the product or service directed to those end markets.Past performance does not guarantee future returns.
Industry Diversification(1)
Substantially all investments subject to independent 3rd party valuation process every quarter
Emphasis on Non-Cyclical Businesses
▪ Robust downside analysis performed at underwriting, with an emphasis on companies and industries that can withstand periods of economic stress
▪ Portfolio emphasis on non-cyclical companies with strong covenants; investments in cyclical companies typically structured with significant collateral protections
▪ Each portfolio company investment subject to rigorous review at the start of the COVID-19 pandemic to identify and address risks, including future capital needs or potential covenant breaches

6
Diversified Portfolio: Conservatively Positioned
(1) Weighted average annual effective yield includes amortization of deferred debt origination and end-of-term fees and accretion of original issue discount, but excludes market discount, any prepayment and make-whole fee income, and any debt investments that are distressed or on non-accrual status. Weighted average effective yield on the total portfolio (including debt investments that are distressed or on non-accrual status and equity investments) was 9.8% as of 3/31/2020.
(2) Excludes non-income producing equity investmentsPast performance does not guarantee future returns.
$1.6 billionportfolio fair value
93% of portfoliois senior secured debt
Majority of our portfolio companies contribute
<1% to recurring income
10.3% weightedaverage effective yield
on debt portfolio(1)
Diversified Income Contribution
55
27
3 4
<1% 1% - 2% 2% - 3% 3%
# o
f p
ort
foli
o c
om
pa
nie
sco
ntr
ibu
tin
g (2
)
% contribution to recurring income

7
Strategically Positioned Balance Sheet
Predominantly First-lien,
Floating Rate Asset PortfolioDiverse Liability Structure
SBA Debentures
14%
Credit Facilities
33%
Unsecured Debt53%
Fixed / Floating(1)
Floating Rate 92%
Fixed Rate 8%
Seniority(1)
First Lien 83%
Second Lien 16%
Junior 1%
(1) As a percent of total debt investments at fair value as of March 31, 2020.

8
Diversified Sources of Funding
(1) $140 million par. Carrying value shown.(2) $175 million par. Carrying value shown. (3) $200 million par. Carrying value shown.(4) As of March 31, 2020, $8.2 million of the outstanding amount bore interest at a rate of EURIBOR + 2.00%(5) Subject to certain funding requirements. (6) Weighted average interest rate, excluding fees of 0.36% or 0.35%. (7) Combined weighted-average interest rate on amounts outstanding as of March 31, 2020. (8) In April 2020, the maturity was extended to May 6, 2024.
As of March 31, 2020, $ in millions
Source Capacity Drawn Amount Available Pricing Maturity
SVCP Facility $ 270.0 $ 108.4 $ 161.6 L + 2.00% (4) May-23 (8)
TCPC Funding Facility 300.0 215.0 85.0 L + 2.00% (5) May-23(9)
SBA Debentures 150.0 138.0 12.0 2.63% (6) 2024-2029
2022 Convertible Notes 138.7 (1) 138.7 - 4.625% Mar-22(9)
2022 Notes 174.7 (2) 174.7 - 4.125% Aug-22(9)
2024 Notes 197.9 (3) 197.9 - 3.900% Aug-24(9)
Total leverage $ 1,231.3 $ 972.7 $ 258.6 3.73% (7)
Cash 8.6)
Net settlements (4.3)
Unamortized debt issuance costs (7.2)
Net leverage $ 965.5 $ 262.9
TCPC is investment grade rated by Fitch and Moody’s

9
Well-Covered and Consistent Dividend
2012(1,2) 2013 2014 2015 2016 2017 2018 20192020
Q1
Per Share
Regular dividend $1.04 $1.43 $1.44 $1.44 $1.44 $1.44 $1.44 $1.44 $0.36
Net investment income $1.42 $1.65 $1.55 $1.64 $1.51 $1.59 $1.59 $1.61 $0.38
Regular dividend coverage 137% 115% 108% 114% 105% 110% 110% 112% 106%
Special dividend $0.05 $0.10 $0.10
Dividend covered in all 32 quarters since inception
Net investment income of $0.38 per share
in Q1 2020
Out-earned quarterly dividend of $0.36 per share paid
on March 31, 2020
Declared Q2 2020 dividend of $0.36
per share
Payable on June 30, 2020 to holders of record
as of June 16, 2020
(1) Incentive compensation was waived from the date of the IPO to January 1, 2013.(2) Dividends and net investment income in 2012 reflect the 3 quarters post-IPO (Q2, Q3 and Q4).
There is no guarantee that quarterly distributions will continue to be made at historical levels.

10
Limited Exposure to Further Interest Rate Declines
Annual impact on net income of changes in interest rates(1)
Basis Point Change Net Investment Income Net Investment Income Per Share
Up 300 basis points +$34,228,024 +$0.59
Up 200 basis points +$21,923,726 +$0.38
Up 100 basis points +$9,903,173 +$0.17
Down 100 basis points ($2,187,381) ($0.04)
Down 200 basis points ($2,267,268) ($0.04)
(1) Considers interest rate floors for variable rate instruments and assumes concurrent contractual rate resets for assets and liabilities, and excludes the related incentive compensation impact. Actual results may differ. Please refer to page 71 of the Company’s 10-Q as of March 31, 2020.
Decrease in LIBOR
▪ 3-month LIBOR declined 135 basis points since
12/31/2018 (from 2.80% to 1.45% as of 3/31/2020)
▪ The cumulative decline in LIBOR over this period has
resulted in a total impact to net investment income of
$0.08/sh per quarter
▪ 66% of our floating rate debt investments had interest
rate floors as of 3/31/2020, limiting exposure to any
further declines in interest rates
0.00
0.50
1.00
1.50
2.00
2.50
3.00
3-Month LIBOR

11
Competitive Advantages of BlackRock
Global Credit Expertise
▪ $103 billion(1) in AUM across credit
asset classes globally
▪ 212(1) Global Credit investment
professionals
Information Edge
▪ Broad access to management teams
▪ Expertise across asset classes,
investment styles, products and
industries
One Stop Shop
▪ Full range of strategies and
risk profiles
▪ Global presence: North America,
Europe and Asia
Dedicated Team
with Experience
▪ Cycle-tested team organized along 19
industry verticals with an emphasis on
less competitive situations
▪ Over two decades managing global
credit strategies
Differentiated Sourcing
▪ One of the largest credit
counterparties globally
▪ Strong market access and corporate
relationships
Strong Risk Management
▪ Firm-wide culture of risk management
▪ Dedicated risk professionals with
independent reporting lines
(1) As of March 31, 2020
BlackRock’s $6.47 trillion(1) investment platform creates substantial scale and scope that provides insight, access, and expertise in sourcing, underwriting and managing differentiated investments

12
Breadth and Depth of BlackRock’s Global Credit Platform
▪ Pan-Credit Solutions
▪ Hedge Fund Strategies
▪ High Yield
▪ Bank Loans
▪ CLOs
▪ Direct Lending
▪ Opportunistic Credit
▪ Specialty Finance
Leveraged Finance Multi-Strategy Credit Private Credit
BlackRock leverages expertise across liquid and illiquid credit and seeks to deliver optimal solutions for its clients
BlackRock Investment Institute, Risk and Quantitative Analysis, Aladdin Investment Platform
Global Credit AUM: $103 billion(1)
(1) As of March 31, 2020

13
Well Positioned to Manage Through the Cycle
Source: BlackRock. As of March 31, 2020
Late Cycle Early CycleDownturn Mid Cycle
Tight Financing
Easy Financing
Excess Capacity Excess Demand
Strategy attributes are well-positioned to withstand a downturn
✓Senior secured, top of the capital structure
✓Significant cushion below investment (generally, 40-60%)
✓Financial and maintenance covenants
✓Diverse portfolio by issuer, industry, and sector
✓ Investment segment governed by consistent and predictable bankruptcy laws
✓Cycle-tested team with proven track record
✓Depth of workout and restructuring expertise
✓Repeat borrowers are an important source of originations, accounting for nearly half of new investments in the last twelve months(1)

14
Investor Friendly Advisory Fee Structure
(1) Source: SEC filings. Represents average fee structure for publicly traded, externally managed BDCs with a market capitalization of more than $200 million. As of March 31, 2020.
BlackRock TCP Capital Corp. Average Externally Managed BDC(1)
Base Management Fee
◼ 1.5% up to 1.0x debt to equity; 1.0% above 1.0x debt to equity. Based on gross assets (less cash and cash equivalents)
◼ 1.50% - 1.75% on gross assets (up to 1.0x debt to equity; 1.0% above 1.0x debt to equity for those BDCs that have adopted a reduced minimum asset coverage ratio)
Incentive Fee Hurdle ◼ 7% annualized total return on NAV,
cumulative (infinite) lookback◼ 7% annualized NII return on NAV, no
lookback
Incentive Compensation
◼ Capital Gains: 17.5% of cumulative net realized gains less net unrealized depreciation, subject to a cumulative (infinite), annualized 7% total return hurdle
◼ Ordinary Income: 17.5% subject to a cumulative (infinite), annualized 7% total return hurdle
◼ Capital Gains: 20% of cumulative net realized gains less net unrealized depreciation
◼ Ordinary Income: 20% subject to quarterly hurdle rate calculated quarterly

15
Quarterly Operating Results
2020 2019Unaudited ($ in thousands, except per share amounts) Q1 Q4 Q3 Q2 Q1
Investment income
Interest income $ 40,632 $ 47,123 $ 49,854 $ 47,631 $ 46,977
Lease income 38 74 74 74 74
Dividend income 428 605 914 392 480
Other income 153 8 798 78 9
Total investment income 41,251 47,810 51,640 48,175 47,540
Expenses
Interest and other debt expenses 10,956 12,147 12,419 11,145 10,688
Management and advisory fees 6,117 6,350 6,357 6,119 6,035
Incentive fee - 4,754 5,370 4,831 5,353
Administrative expenses 540 540 600 600 599
Legal fees, professional fees and due diligence expenses 498 396 493 431 437
Other expenses 1,087 1,213 1,087 1,235 1,108
Total expenses 19,198 25,400 26,326 24,361 24,220
Net investment income before taxes 22,053 22,410 25,314 23,814 23,320
Excise taxes - - - - -
Net investment income 22,053 22,410 25,314 23,814 23,320
Net realized and unrealized gain (loss) (91,534) (23,565) (6,876) (34,638) 802
Net increase (decrease) in net assets to common equity $ (69,481) $ (1,155) $ 18,438 $ (10,824) $ 24,122
Earnings (loss) per share $ (1.18) $(0.02) $ 0.31 $(0.18) $ 0.41
Net investment income per share(1) $ 0.38 $ 0.38 $ 0.43 $ 0.41 $ 0.40
Dividend per share $ 0.36 $ 0.36 $ 0.36 $ 0.36 $ 0.36
Weighted average common shares outstanding 58,668,432 58,766,217 58,766,002 58,765,802 58,767,442
Ending common shares outstanding 57,766,912 58,766,426 58,766,002 58,766,000 58,765,800
(1) After incentive compensation and taxes
16
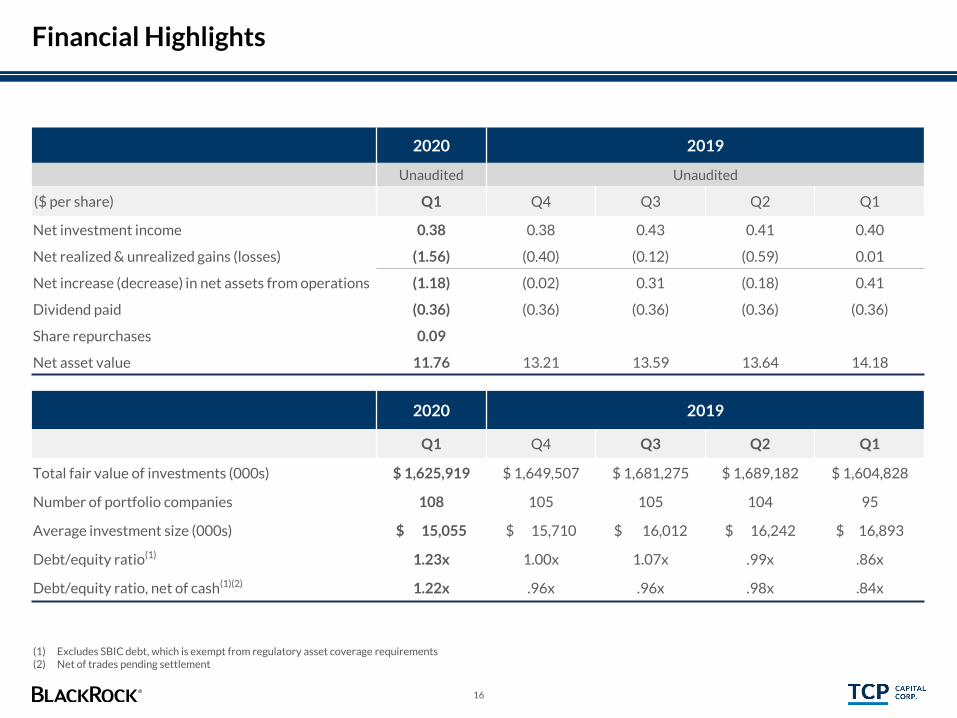
Financial Highlights
2020 2019
Unaudited Unaudited
($ per share) Q1 Q4 Q3 Q2 Q1
Net investment income 0.38 0.38 0.43 0.41 0.40
Net realized & unrealized gains (losses) (1.56) (0.40) (0.12) (0.59) 0.01
Net increase (decrease) in net assets from operations (1.18) (0.02) 0.31 (0.18) 0.41
Dividend paid (0.36) (0.36) (0.36) (0.36) (0.36)
Share repurchases 0.09
Net asset value 11.76 13.21 13.59 13.64 14.18
2020 2019
Q1 Q4 Q3 Q2 Q1
Total fair value of investments (000s) $ 1,625,919 $ 1,649,507 $ 1,681,275 $ 1,689,182 $ 1,604,828
Number of portfolio companies 108 105 105 104 95
Average investment size (000s) $ 15,055 $ 15,710 $ 16,012 $ 16,242 $ 16,893
Debt/equity ratio(1) 1.23x 1.00x 1.07x .99x .86x
Debt/equity ratio, net of cash(1)(2) 1.22x .96x .96x .98x .84x
(1) Excludes SBIC debt, which is exempt from regulatory asset coverage requirements(2) Net of trades pending settlement

17
Portfolio Highlights
2020 2019
Asset Mix of the Investment Portfolio (in thousands)
Q1 Q4 Q3 Q2 Q1
Senior secured debt $ 1,503,280 $ 1,513,909 $ 1,555,934 $ 1,558,763 $ 1,476,326
Junior debt 18,755 21,285 20,768 50,331 43,722
Equity 103,884 114,313 104,573 80,088 84,780
Total investments $ 1,625,919 $ 1,649,507 $ 1,681,275 $ 1,689,182 $ 1,604,828
2020 2019
Portfolio Activity (in thousands)
Q1 Q4 Q3 Q2 Q1
Gross acquisitions $ 142,969 $ 141,634 $ 176,016 $ 232,232 $ 150,142
Exits (includes repayments) 76,881 152,305 180,605 117,112 146,352
Net acquisitions (exits) $ 66,088 $ (10,671) $ (4,589) $ 115,120 $ 3,790

18
Quarterly Balance Sheets
2020 2019
(in thousands, except per share data) Unaudited Audited Unaudited Unaudited Unaudited
ASSETS Q1 Q4 Q3 Q2 Q1
Investments at fair value $ 1,625,919 $ 1,649,507 $ 1,681,275 $ 1,689,182 $ 1,604,828
Cash and cash equivalents 8,575 44,849 80,069 21,858 26,752
Accrued interest income 18,409 17,908 19,917 20,340 21,861
Receivable for investments sold 511 1,317 7,434 434 434
Other assets 9,991 8,488 12,023 10,663 9,224
Total assets 1,663,405 1,722,069 1,800,718 1,742,477 1,663,099
LIABILITIES
Debt, net of unamortized issuance costs $ 965,458 $ 907,802 $ 985,042 $ 907,390 $ 805,548
Payable for investments purchased 4,825 13,057 1,860 12,002 10,720
Interest payable 4,425 10,837 6,621 8,731 5,792
Incentive compensation payable - 4,754 5,370 4,831 5,353
Other liabilities 9,113 9,301 3,199 8,182 2,368
Total liabilities 983,821 945,751 1,002,092 941,136 829,781
NET ASSETS $ 679,584 $ 776,318 $ 798,626 $ 801,341 $ 833,318
NET ASSETS PER SHARE $ 11.76 $ 13.21 $ 13.59 $ 13.64 $ 14.18

19
Corporate Information
NASDAQ: TCPC
▪ Bank of America Merrill Lynch
▪ D.A. Davidson
▪ Deutsche Bank
▪ JMP Securities
▪ Keefe, Bruyette & Woods
▪ Ladenburg Thalmann
▪ Oppenheimer
▪ Raymond James
▪ Wells Fargo
Equiniti Shareholder Services
(800) 468-9716 (from U.S.)
(651) 450-4064 (from outside U.S.)
www.shareowneronline.com
2951 28th Street
Suite 1000
Santa Monica, CA 90405
Katie McGlynn
(310) 566-1094
www.tcpcapital.com
Securities Listing
Research Coverage
Transfer Agent
Corporate Headquarters
Investor Relations