Embed Size (px)
Citation preview

TBE
Technology Bridge to Employment
Project
ATTAIN (Advance Technology Training and Information
Networking)

Definition: “the existing gap in access to information services between those who could afford to purchase the computer hardware and software necessary to participate in the global information network, and low income families and communities that cannot”
(Dragulanescu, 2002, 139).
Digital Divide

Five dimensions of the divide
1. Technical
2. Autonomy of use
3. Use of patterns
4. Social support networks
5. Skill
(Hargittai, 2002 p.1)
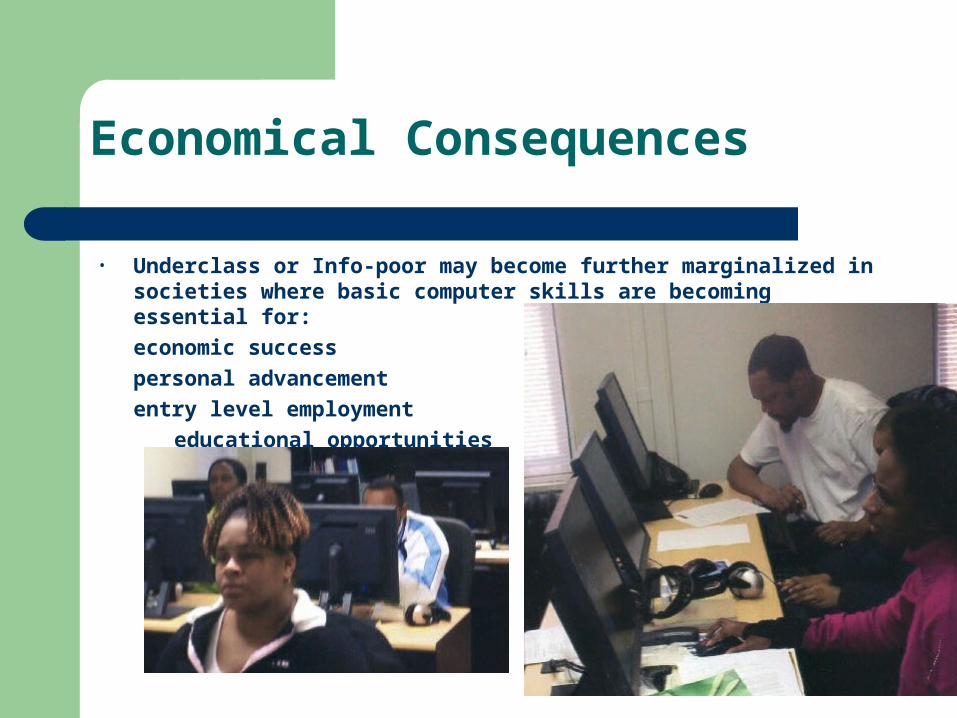
• Underclass or Info-poor may become further marginalized in societies where basic computer skills are becoming essential for:
economic success
personal advancement
entry level employment
educational opportunities
Economical Consequences

Falling Through the Net: Toward Digital Inclusion 2000
Data shows: People who are economically advantaged tend to have household computers and Internet access.
People who are less economically advantaged have a lower rate of household computers and Internet access.
(Shapiro and Rhode 2000)
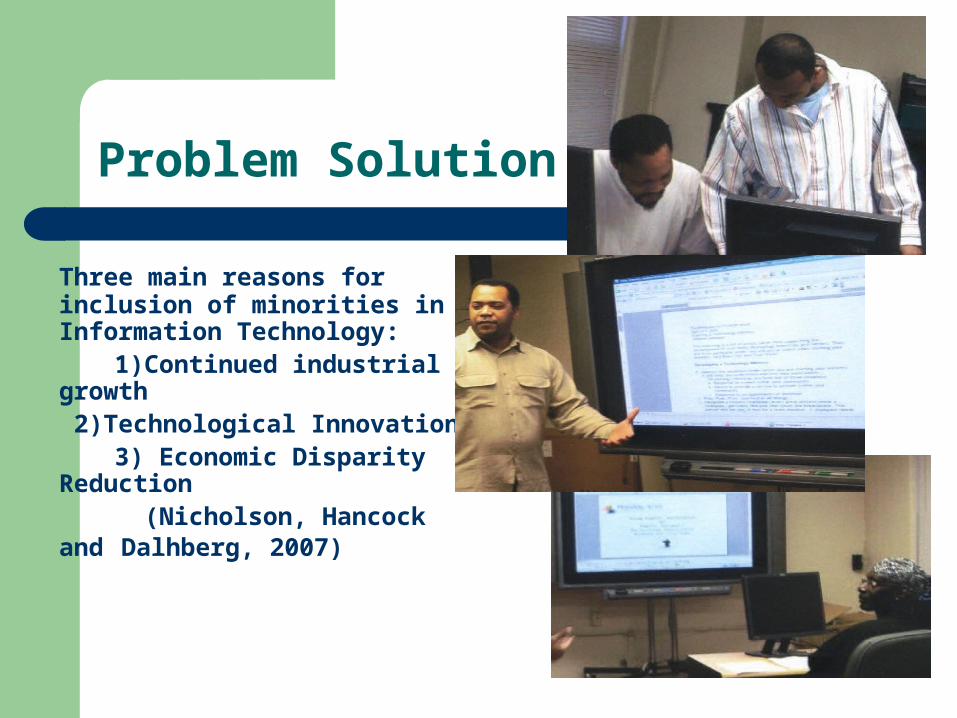
Three main reasons for inclusion of minorities in Information Technology:
1)Continued industrial growth 2)Technological Innovation
3) Economic Disparity Reduction
(Nicholson, Hancock and Dalhberg, 2007)
Problem Solution

Solution Approach
With proper Information Technology Training minorities, women and the poor can take advantage of the future jobs, have higher salaries, can increase income assets. (Kuttan and Peters, 2003)

Community Technology Centers(CTCs)
Three major types:
1. Stand-alone centers
2. multi-service agencies
3. network
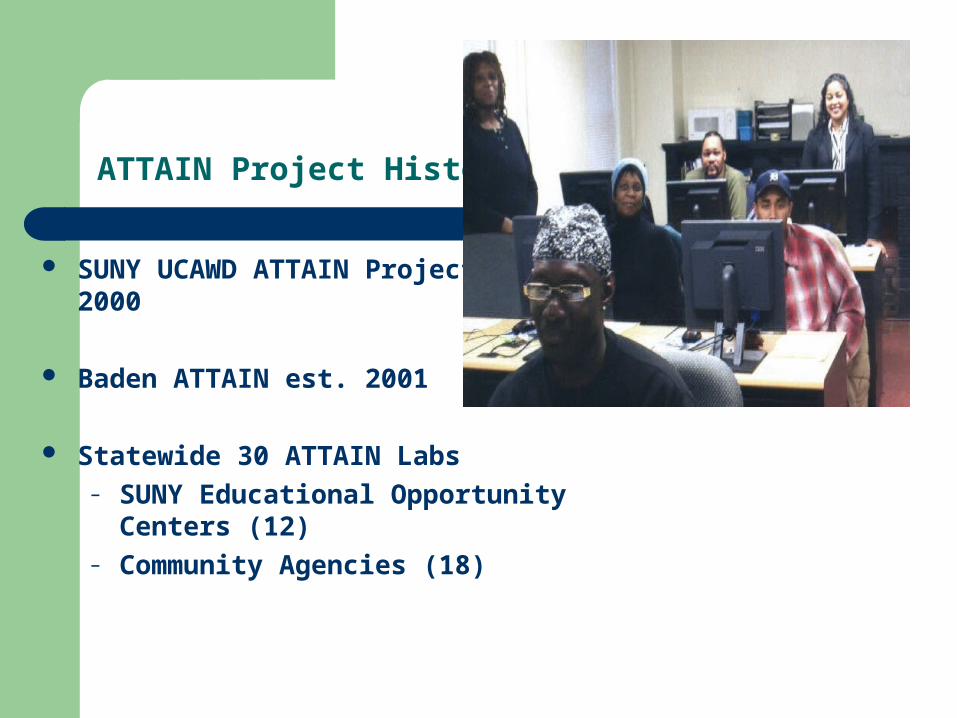
ATTAIN Project History
SUNY UCAWD ATTAIN Project est. 2000
Baden ATTAIN est. 2001
Statewide 30 ATTAIN Labs– SUNY Educational Opportunity
Centers (12)– Community Agencies (18)
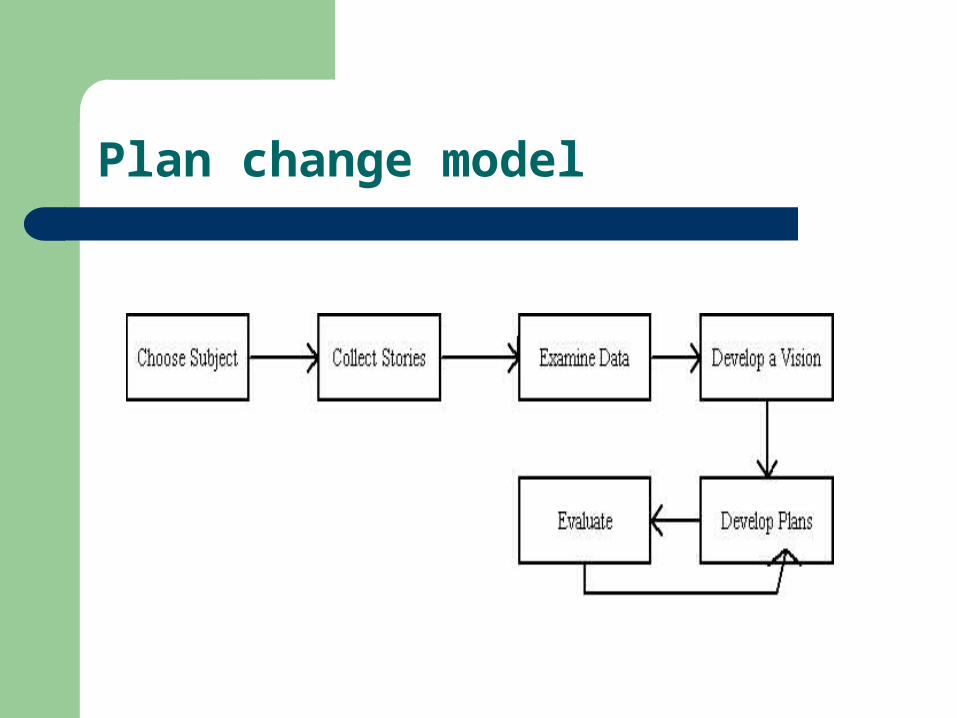
Plan change model

Life Skills Job Readiness Professional Development
Course Outline

Life Skills
You Can Make It Happen– Motivational Software – Written by Stedman
Graham– Developed by
Instructional Systems, Inc. Personal Development
– Instructional Software– Developed by
Instructional Systems, Inc.

Job Readiness
Self-Assessment– Onetcenter.org
Resumes and Cover Letters– Microsoft Word
Job Interview Techniques– Careerbuilder.com
Dress for Success

Basic Computer Literacy– Microsoft Unlimited Potential Tools– Caaelii.org
Working With People– Instructional Systems, Inc.
Professional Development
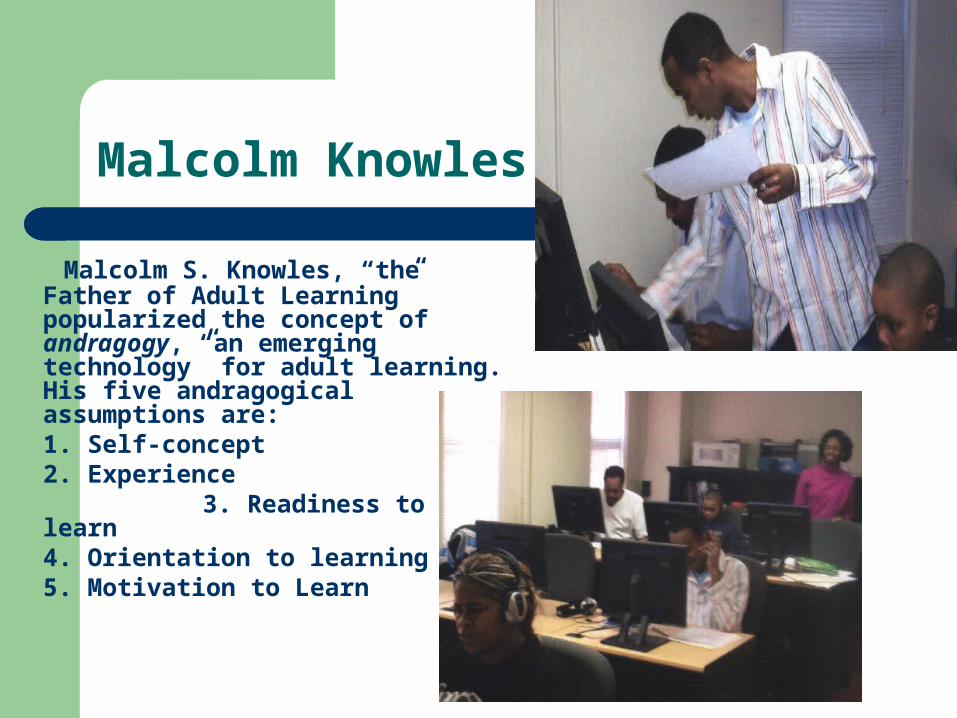
Malcolm Knowles
Malcolm S. Knowles, “the Father of Adult Learning” popularized the concept of andragogy, “an emerging technology” for adult learning. His five andragogical assumptions are:
1. Self-concept 2. Experience
3. Readiness to learn 4. Orientation to learning 5. Motivation to Learn

Malcolm KnowlesEducation Strategies
His suggestion is that educators should:– arrange for a diagnosis of learner needs and interests– enable the formulation of learning objectives based on the
diagnosed needs and interests– design sequential activities for achieving the objectives– execute the design by selecting methods, materials, and
resources; and – evaluate the quality of the learning experience while re-
diagnosing needs for further learning. (Dover, 1999)

Curriculum
Current Week
Weeks
Tasks
03/05 to 03/12
03/12 to 03/19
03/19 to 03/26
03/26 to 04/02
04/02 to 04/09
04/09 to 04/16
04/16 to 04/23
04/23 to 04/30
Technology Bridge to Employment Orientation/CAAELII Pre-test
The Success Process/Introduction to Keyboard and other output devices
Developing Your Plan/ Intro to resume writing /Computer Basics
Introduction to Windows XP
Microsoft Word/Revising and editing resumes
Internet Explorer
Judge Mia Dickson Topic from poverty to Prosperity
Job Interest Profilers CAAELII Post-Test
Tasks
Weeks
03/05 to 03/12
03/12 to 03/19
03/19 to 03/26
03/26 to 04/02
04/02 to 04/09
04/09 to 04/16
04/16 to 04/23
04/23 to 04/30

Coalition of African, Asian, European and Latino Immigrants of Illinois (CAAELII)
0
10
20
30
40
50
60
Sc
ore
s
1 2 3 4 5 6
Number of Students
CAAELII Pre/Post Survey
12-Mar
23-Apr

Project Results
Microsoft Word Pre/Post Windows XP pre/post Internet Demographics Summary Anderson Normality

Microsoft Word Pre/Post
M ic r o s o f t W o r d
0
1 0
2 0
3 0
4 0
5 0
6 0
7 0
1 2 3 4
% T
es
t S
co
re
P re - -Te s t
P o s t Te s t
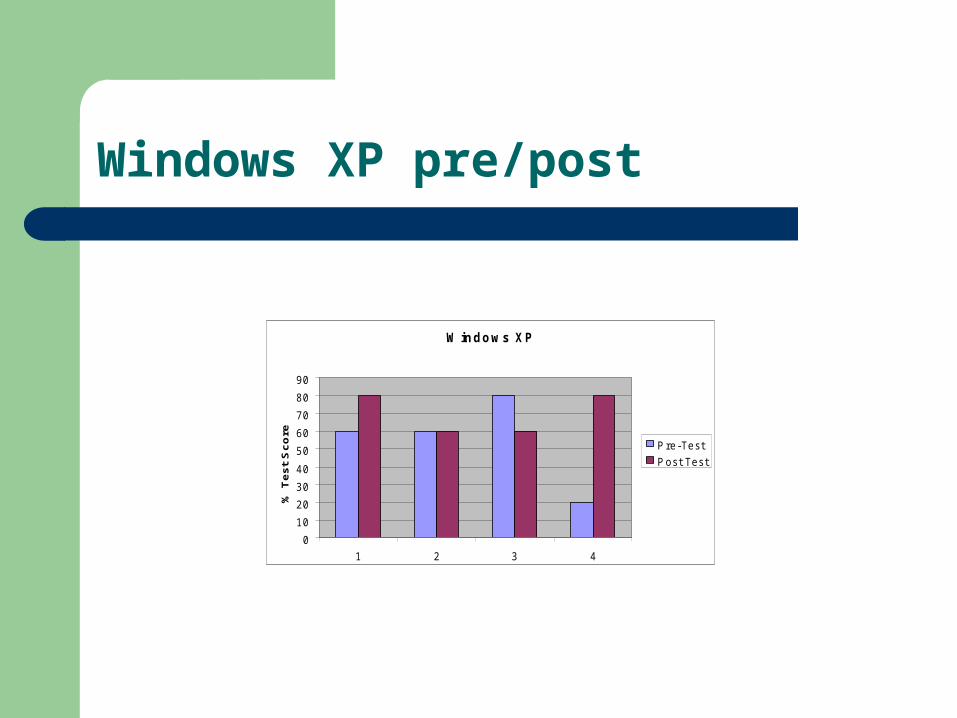
Windows XP pre/post
W in d o w s X P
0
1 0
2 0
3 0
4 0
5 0
6 0
7 0
8 0
9 0
1 2 3 4
% T
es
t S
co
re
P re -Te s t
P o s t Te s t

Internet
In te r n e t
0
2 0
4 0
6 0
8 0
1 0 0
1 2 0
1 2 3
% T
es
t S
co
re
P re -Te s t
P o s t Te s t

Demographics
4, 50.0%2
4, 50.0%1
Gender
2, 28.6%*
3, 42.9%0
2, 28.6%1
Employed
1, 12.5%*
3, 37.5%0
4, 50.0%1
Vocational
7, 87.5%0
1, 12.5%1
GED
3, 37.5%0
5, 62.5%1
Diploma
Category120*
Pie Chart of Gender, Employed, Vocational, GED, Diploma

Summary of Pre-test
80706050403020
Median
Mean
70656055504540
Anderson-Darling Normality Test
Variance 365.455Skewness -0.321840
Kurtosis -0.548625N 11
Minimum 20.000
A-Squared
1st Quartile 40.000
Median 60.0003rd Quartile 60.000Maximum 80.000
95% Confidence I nterval for Mean
40.793
0.55
66.479
95% Confidence I nterval for Median
39.178 61.644
95% Confidence I nterval for StDev
13.357 33.549
P-Value 0.119
Mean 53.636StDev 19.117
95% Confidence Intervals
Summary for pre-test

Summary of Post
10080604020
Median
Mean
10090807060
Anderson-Darling Normality Test
Variance 327.273
Skewness 0.64695Kurtosis -1.54815N 11
Minimum 60.000
A-Squared
1st Quartile 60.000Median 60.0003rd Quartile 100.000Maximum 100.000
95% Confidence I nterval for Mean
62.392
1.29
86.699
95% Confidence I nterval for Median
60.000 100.000
95% Confidence I nterval for StDev
12.640 31.748
P-Value < 0.005
Mean 74.545StDev 18.091
95% Confidence Intervals
Summary for post

Boxplot
Data
postpre
100
90
80
70
60
50
40
30
20
10
Boxplot of pre, post

Probability Plot
dif
Perc
ent
100500-50
99
95
90
80
70
605040
30
20
10
5
1
Mean
0.451
20.91StDev 25.48N 11AD 0.330P-Value
Probability Plot of difNormal - 95% CI

Scatterplot
pre
dif
80706050403020
60
50
40
30
20
10
0
-10
-20
-30
Scatterplot of dif vs pre

Conclusion
Digital divide closes windows for social and economic equality.
Today’s information poor will be tomorrow’s information impoverished.
With proper IT training Computers and the Internet give more chances to move people out of poverty.
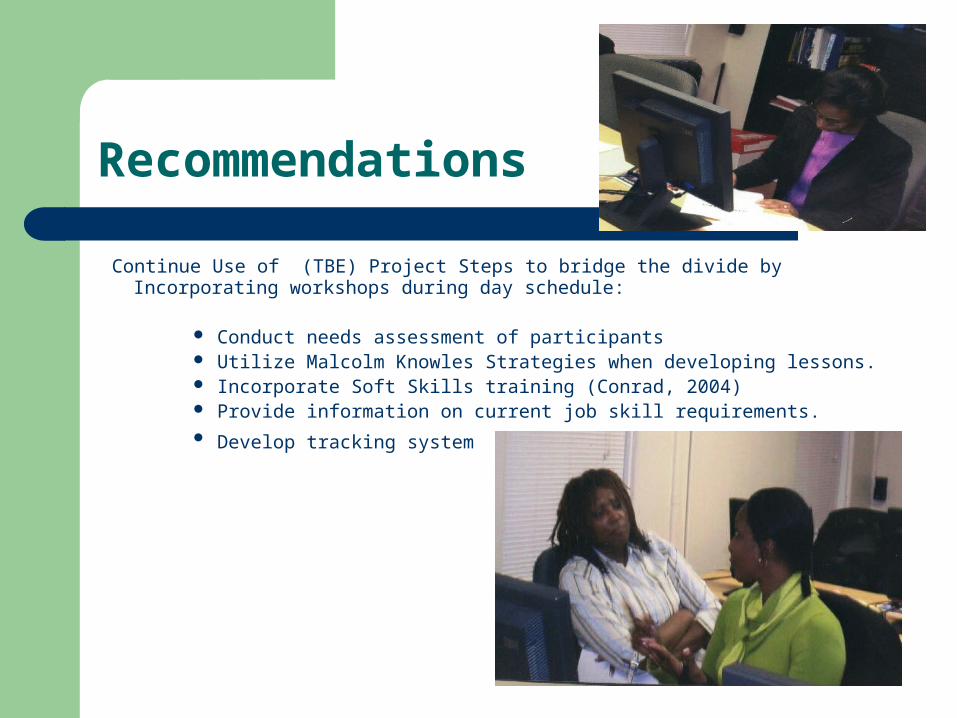
Recommendations
Continue Use of (TBE) Project Steps to bridge the divide by Incorporating workshops during day schedule:
Conduct needs assessment of participants Utilize Malcolm Knowles Strategies when developing lessons. Incorporate Soft Skills training (Conrad, 2004) Provide information on current job skill requirements. Develop tracking system

Question’s?