Embed Size (px)
Citation preview

Missouri Department of Health and SeniorServices (DHSS)
1
Weekly Communicable Disease Report
Missouri Department of Health and SeniorServices (DHSS)
1
Weekly Communicable Disease Report
Missouri Department of Health and Senior Services (DHSS)
Weekly Communicable Disease Report
Disease or Condition:
Tb Infection
Report for Week 44 of 2017Run Date = 07NOV17
For DHSS and LPHA Internal Use Only.Data Included in This Report is Provisional.
Data Source: Confirmed and Probable Cases of Diseases & Conditionsentered into the Missouri Health Surveillance Information System (WEBSURV)

2First Week Reported in 2017
The Year-to-Date (YTD) count is above the 5-year Maximum.The Year-to-Date (YTD) count is above the 5-year 3rd quartile for a period of three weeks.The Year-to-Date (YTD) count is above the 5-year 3rd quartile for a period of one or two weeks.The Year-to-Date (YTD) count is above the 5-year median.
1Analysis Results Legend:
Missouri Department of Health and Senior Services (DHSS) 2Weekly Communicable Disease Report
Quartile Analysis of Year-to-date Counts for Week 44, 2017
Tb Infection
County
Week44
YTD1
Week43
YTD1
Week42
YTD1
FiveYear
1st
Quartile
FiveYear
Median
FiveYear
3rd
Quartile
Changefrom
Week 43 toWeek
44
ChangefromWeek44 to
5-YearMedian
Rateper
100,000Week
44
RelativeRate
Week 44
FirstWeek
Reported2
LastWeek
Reported
Adair 26 26 25 10 10 14 0.0% 160.0% 102.45 3.15 1 43
Andrew 1 1 1 1 2 2 0.0% ( 50.0%) 5.78 0.18 1 1
Audrain 4 4 4 4 4 5 0.0% 0.0% 15.33 0.47 1 37
Barry 8 8 7 5 6 7 0.0% 33.3% 22.33 0.69 16 43
Bates 2 2 2 2 2 2 0.0% 0.0% 12.16 0.37 9 28
Benton 2 2 2 2 3 4 0.0% ( 33.3%) 10.71 0.33 18 28
Bollinger 1 1 1 4 5 10 0.0% ( 77.8%) 8.21 0.25 2 2
Boone 124 124 122 136 142 200 0.0% ( 12.7%) 70.87 2.18 1 43
Buchanan 10 10 10 20 25 34 0.0% ( 60.0%) 11.22 0.35 2 42
Butler 6 6 6 15 16 23 0.0% ( 62.5%) 13.97 0.43 5 38
Caldwell 1 1 1 1 1 1 0.0% 0.0% 11.09 0.34 20 20
Callaway 4 4 4 11 14 15 0.0% ( 71.4%) 8.92 0.27 14 26
Camden 6 6 6 6 9 9 0.0% ( 33.3%) 13.56 0.42 7 33
Cape Girardeau 11 11 11 22 27 29 0.0% ( 59.3%) 14.00 0.43 16 41
Cass 9 9 9 14 17 19 0.0% ( 47.1%) 8.88 0.27 4 39
Cedar 3 3 3 1 2 3 0.0% 100.0% 21.53 0.66 2 29
Christian 11 11 11 8 8 9 0.0% 37.5% 13.21 0.41 5 42
Clay 17 17 16 19 20 26 0.0% ( 15.0%) 14.77 0.45 8 43
Cole 19 19 19 28 29 38 0.0% ( 34.5%) 24.77 0.76 1 36
Cooper 2 2 2 2 2 6 0.0% 0.0% 11.34 0.35 5 17
Crawford 3 3 3 3 3 4 0.0% 0.0% 12.23 0.38 15 39
Dallas 1 1 1 1 1 3 0.0% 0.0% 6.10 0.19 8 8
Dent 3 3 3 2 2 3 0.0% 50.0% 19.24 0.59 14 33
Douglas 1 1 1 1 1 2 0.0% 0.0% 7.48 0.23 27 27
Dunklin 4 4 4 2 2 2 0.0% 100.0% 12.95 0.40 6 26
Franklin 23 23 23 8 10 17 0.0% 130.0% 22.46 0.69 2 42
Greene 127 127 126 102 126 130 0.0% 0.8% 44.09 1.36 1 43
Grundy 1 1 1 2 2 3 0.0% ( 50.0%) 9.90 0.30 3 3
Harrison 1 1 1 1 2 2 0.0% ( 33.3%) 11.61 0.36 9 9
Henry 1 1 1 2 2 3 0.0% ( 50.0%) 4.60 0.14 11 11
Howard 1 1 1 1 2 2 0.0% ( 33.3%) 9.86 0.30 22 22
Howell 4 4 4 5 5 15 0.0% ( 20.0%) 9.97 0.31 20 33
Jackson 101 98 95 110 121 136 3.1% ( 16.5%) 38.53 1.19 1 44
Jasper 19 19 19 24 33 34 0.0% ( 42.4%) 25.73 0.79 3 42
Jefferson 13 13 13 38 38 39 0.0% ( 65.8%) 5.80 0.18 6 40

2First Week Reported in 2017
The Year-to-Date (YTD) count is above the 5-year Maximum.The Year-to-Date (YTD) count is above the 5-year 3rd quartile for a period of three weeks.The Year-to-Date (YTD) count is above the 5-year 3rd quartile for a period of one or two weeks.The Year-to-Date (YTD) count is above the 5-year median.
1Analysis Results Legend:
Missouri Department of Health and Senior Services (DHSS) 3Weekly Communicable Disease Report
Quartile Analysis of Year-to-date Counts for Week 44, 2017
Tb Infection
County
Week44
YTD1
Week43
YTD1
Week42
YTD1
FiveYear
1st
Quartile
FiveYear
Median
FiveYear
3rd
Quartile
Changefrom
Week 43 toWeek
44
ChangefromWeek44 to
5-YearMedian
Rateper
100,000Week
44
RelativeRate
Week 44
FirstWeek
Reported2
LastWeek
Reported
Johnson 39 39 39 26 64 91 0.0% ( 39.1%) 72.29 2.23 3 39
Laclede 2 2 2 2 4 5 0.0% ( 50.0%) 5.64 0.17 20 36
Lafayette 2 2 2 1 3 5 0.0% ( 33.3%) 6.12 0.19 32 35
Lawrence 4 4 4 7 7 9 0.0% ( 42.9%) 10.48 0.32 6 41
Lincoln 6 6 6 9 9 11 0.0% ( 33.3%) 10.97 0.34 1 32
Livingston 2 2 2 1 2 4 0.0% 0.0% 13.31 0.41 7 21
Mcdonald 9 9 9 15 15 17 0.0% ( 40.0%) 39.75 1.22 3 19
Macon 1 1 1 1 2 2 0.0% ( 33.3%) 6.52 0.20 39 39
Madison 1 1 1 1 2 2 0.0% ( 50.0%) 8.06 0.25 5 5
Maries 1 1 1 1 1 1 0.0% 0.0% 11.16 0.34 7 7
Marion 6 6 4 2 3 3 0.0% 100.0% 20.78 0.64 14 43
Miller 6 6 6 1 1 2 0.0% 500.0% 23.89 0.74 9 39
Mississippi 1 1 1 1 2 2 0.0% ( 50.0%) 7.12 0.22 17 17
Monroe 2 2 2 1 1 1 0.0% 100.0% 23.30 0.72 12 39
Morgan 3 3 3 1 2 2 0.0% 100.0% 14.87 0.46 21 32
New Madrid 2 2 2 2 2 3 0.0% 0.0% 10.98 0.34 2 30
Newton 7 7 7 13 15 16 0.0% ( 53.3%) 13.58 0.42 4 24
Nodaway 10 10 10 3 27 78 0.0% ( 63.0%) 43.84 1.35 1 36
Oregon 1 1 1 2 3 3 0.0% ( 66.7%) 9.13 0.28 3 3
Pemiscot 5 5 5 5 8 14 0.0% ( 33.3%) 28.60 0.88 3 19
Perry 1 1 1 2 4 4 0.0% ( 75.0%) 5.21 0.16 37 37
Pettis 13 13 13 6 6 7 0.0% 116.7% 30.77 0.95 1 39
Phelps 26 26 26 32 38 39 0.0% ( 31.6%) 58.04 1.79 3 41
Pike 4 4 4 2 3 4 0.0% 33.3% 21.80 0.67 28 39
Platte 7 7 7 5 9 10 0.0% ( 22.2%) 14.09 0.43 5 39
Pulaski 12 12 12 3 8 9 0.0% 50.0% 22.55 0.69 8 38
Randolph 4 4 4 1 1 3 0.0% 300.0% 15.93 0.49 10 36
Reynolds 1 1 1 4 4 4 0.0% ( 75.0%) 15.55 0.48 25 25
St Charles 78 77 75 66 69 86 1.3% 13.0% 20.23 0.62 1 44
Ste Genevieve 3 3 3 1 1 3 0.0% 200.0% 16.74 0.52 4 33
St Francois 22 22 22 13 19 24 0.0% 15.8% 33.07 1.02 2 40
St Louis 404 393 389 371 456 479 2.8% ( 11.4%) 40.26 1.24 1 44
Saline 2 2 2 4 5 5 0.0% ( 60.0%) 8.60 0.26 4 15
Scott 8 8 8 5 7 8 0.0% 14.3% 20.51 0.63 3 42
Shelby 1 1 1 1 1 2 0.0% 0.0% 16.32 0.50 42 42

2First Week Reported in 2017
The Year-to-Date (YTD) count is above the 5-year Maximum.The Year-to-Date (YTD) count is above the 5-year 3rd quartile for a period of three weeks.The Year-to-Date (YTD) count is above the 5-year 3rd quartile for a period of one or two weeks.The Year-to-Date (YTD) count is above the 5-year median.
1Analysis Results Legend:
Missouri Department of Health and Senior Services (DHSS) 4Weekly Communicable Disease Report
Quartile Analysis of Year-to-date Counts for Week 44, 2017
Tb Infection
County
Week44
YTD1
Week43
YTD1
Week42
YTD1
FiveYear
1st
Quartile
FiveYear
Median
FiveYear
3rd
Quartile
Changefrom
Week 43 toWeek
44
ChangefromWeek44 to
5-YearMedian
Rateper
100,000Week
44
RelativeRate
Week 44
FirstWeek
Reported2
LastWeek
Reported
Stoddard 5 5 5 4 4 5 0.0% 25.0% 16.74 0.52 1 32
Sullivan 4 4 4 3 3 3 0.0% 33.3% 62.96 1.94 11 29
Taney 6 6 6 8 8 10 0.0% ( 25.0%) 10.99 0.34 12 39
Texas 2 2 2 4 5 6 0.0% ( 60.0%) 7.79 0.24 36 40
Vernon 7 7 7 4 4 6 0.0% 75.0% 33.61 1.03 11 38
Washington 1 1 1 1 1 4 0.0% 0.0% 4.03 0.12 3 3
Wayne 2 2 2 2 3 5 0.0% ( 20.0%) 14.92 0.46 14 30
Webster 3 3 3 3 3 6 0.0% 0.0% 8.00 0.25 9 19
Wright 2 2 2 1 1 2 0.0% 100.0% 10.95 0.34 4 34
St Louis City 256 255 252 400 493 522 0.4% ( 48.1%) 81.09 2.50 1 44
Independence 3 3 3 3 4 4 0.0% ( 25.0%) 2.56 0.08 17 24
Joplin 26 26 26 18 29 32 0.0% ( 10.3%) 50.18 1.54 3 41
Kansas City 300 294 291 397 530 549 2.0% ( 43.4%) 63.11 1.94 1 44
514 93 93 92 81 99 109 0.0% ( 6.1%) 0.00 0.00 1 43
Troop A Total 498 489 482 613 805 876 1.8% ( 38.1%) 36.57 1.13 1 44
Troop B Total 44 44 41 22 22 26 0.0% 100.0% 24.32 0.75 1 43
Troop C Total 811 798 789 951 991 1,159 1.6% ( 18.2%) 35.79 1.10 1 44
Troop D Total 231 231 229 239 260 270 0.0% ( 11.2%) 25.99 0.80 1 43
Troop E Total 46 46 46 62 77 102 0.0% ( 40.3%) 13.82 0.43 1 42
Troop F Total 169 169 167 199 212 296 0.0% ( 20.3%) 34.07 1.05 1 43
Troop G Total 11 11 11 17 18 24 0.0% ( 38.9%) 7.93 0.24 3 40
Troop H Total 26 26 26 40 62 95 0.0% ( 58.1%) 11.03 0.34 1 42
Troop I Total 47 47 47 52 52 53 0.0% ( 9.6%) 25.74 0.79 3 41
State Total 1,976 1,954 1,930 2,554 2,778 2,800 1.1% ( 28.9%) 32.48 1.00 1 44

Elevated=above 3rd
quartile and Very Elevated=Above Maximum.
6Based on Quartile Analysis from Current Report where: Below Normal=below median, Above Normal= above median,
5Based on Change in Count Current Report vs Last Report
4Week 43 Quartile Results are from the Last Report
3Week 44 Quartile Results are from the Current Report
2First Week Reported and/or First Occurence of Disease or Condition in 2017
1Data Status: Old=Continuing Occurence in 2017, New=First Occurence in 2017 and Out=Case was Removed from WEBSURV
Missouri Department of Health and Senior Services (DHSS) 5Weekly Communicable Disease Report for Week 44, 2017
Disease or Condition AnalysisCompared to Last Report run on 10/31/2017 for Week 43, 2017
Tb Infection
County
Data
Status1,2
1st
WeekReportedCurrentReport
1st
WeekReported
LastReport
Changein
Count
Week 44Quartile
Results3
Week 43Quartile
Results4
DataTrend
Analysis5
DataElevation
Analysis6
Adair Old 1 1 2 Above Maximum Above Maximum Increase Very Elevated
Andrew Old 1 1 0 Below Median Below Median Flat Below Normal
Audrain Old 1 1 0 Below Median Below Median Flat Below Normal
Barry Old 16 16 1 Above 3rd
Quartile Above Median Increase Elevated
Bates Old 9 9 0 Below Median Below Median Flat Below Normal
Benton Old 18 18 0 Below Median Below Median Flat Below Normal
Bollinger Old 2 2 0 Below Median Below Median Flat Below Normal
Boone Old 1 1 7 Below Median Below Median Increase Below Normal
Buchanan Old 2 2 1 Below Median Below Median Increase Below Normal
Butler Old 5 5 0 Below Median Below Median Flat Below Normal
Caldwell Old 20 20 0 Below Median Below Median Flat Below Normal
Callaway Old 14 14 0 Below Median Below Median Flat Below Normal
Camden Old 7 7 0 Below Median Below Median Flat Below Normal
Cape Girardeau Old 16 16 1 Below Median Below Median Increase Below Normal
Cass Old 4 4 0 Below Median Below Median Flat Below Normal
Cedar Old 2 2 0 Above 3rd
Quartile Above 3rd
Quartile Flat Elevated
Christian Old 5 5 0 Above 3rd
Quartile Above 3rd
Quartile Flat Elevated
Clay Old 8 8 0 Below Median Below Median Flat Below Normal
Cole Old 1 1 0 Below Median Below Median Flat Below Normal
Cooper Old 5 5 0 Below Median Below Median Flat Below Normal
Crawford Old 15 15 0 Below Median Below Median Flat Below Normal
Dallas Old 8 8 0 Below Median Below Median Flat Below Normal
Dent Old 14 14 0 Above 3rd
Quartile Above 3rd
Quartile Flat Elevated
Douglas Old 27 27 0 Below Median Below Median Flat Below Normal
Dunklin Old 6 6 0 Above 3rd
Quartile Above 3rd
Quartile Flat Elevated
Franklin Old 2 2 1 Above Maximum Above Maximum Increase Very Elevated
Greene Old 1 1 7 Above Median Below Median Increase Above Normal

Elevated=above 3rd
quartile and Very Elevated=Above Maximum.
6Based on Quartile Analysis from Current Report where: Below Normal=below median, Above Normal= above median,
5Based on Change in Count Current Report vs Last Report
4Week 43 Quartile Results are from the Last Report
3Week 44 Quartile Results are from the Current Report
2First Week Reported and/or First Occurence of Disease or Condition in 2017
1Data Status: Old=Continuing Occurence in 2017, New=First Occurence in 2017 and Out=Case was Removed from WEBSURV
Missouri Department of Health and Senior Services (DHSS) 6Weekly Communicable Disease Report for Week 44, 2017
Disease or Condition AnalysisCompared to Last Report run on 10/31/2017 for Week 43, 2017
Tb Infection
County
Data
Status1,2
1st
WeekReportedCurrentReport
1st
WeekReported
LastReport
Changein
Count
Week 44Quartile
Results3
Week 43Quartile
Results4
DataTrend
Analysis5
DataElevation
Analysis6
Grundy Old 3 3 0 Below Median Below Median Flat Below Normal
Harrison Old 9 9 0 Below Median Below Median Flat Below Normal
Henry Old 11 11 0 Below Median Below Median Flat Below Normal
Howard Old 22 22 0 Below Median Below Median Flat Below Normal
Howell Old 20 20 0 Below Median Below Median Flat Below Normal
Jackson Old 1 1 4 Below Median Below Median Increase Below Normal
Jasper Old 3 3 1 Below Median Below Median Increase Below Normal
Jefferson Old 6 6 0 Below Median Below Median Flat Below Normal
Johnson Old 3 3 0 Below Median Below Median Flat Below Normal
Laclede Old 20 20 0 Below Median Below Median Flat Below Normal
Lafayette Old 32 32 0 Below Median Below Median Flat Below Normal
Lawrence Old 6 6 0 Below Median Below Median Flat Below Normal
Lincoln Old 1 1 0 Below Median Below Median Flat Below Normal
Livingston Old 7 7 0 Below Median Below Median Flat Below Normal
Mcdonald Old 3 3 0 Below Median Below Median Flat Below Normal
Macon Old 39 39 0 Below Median Below Median Flat Below Normal
Madison Old 5 5 0 Below Median Below Median Flat Below Normal
Maries Old 7 7 0 Below Median Below Median Flat Below Normal
Marion Old 14 14 2 Above Maximum Above 3rd
Quartile Increase Very Elevated
Miller Old 9 9 0 Above Maximum Above Maximum Flat Very Elevated
Mississippi Old 17 17 0 Below Median Below Median Flat Below Normal
Monroe Old 12 12 0 Above Maximum Above Maximum Flat Very Elevated
Morgan Old 21 21 0 Above Maximum Above Maximum Flat Very Elevated
New Madrid Old 2 2 0 Below Median Below Median Flat Below Normal
Newton Old 4 4 0 Below Median Below Median Flat Below Normal
Nodaway Old 1 1 0 Below Median Below Median Flat Below Normal
Oregon Old 3 3 0 Below Median Below Median Flat Below Normal
Pemiscot Old 3 3 -1 Below Median Below Median Decrease Below Normal
Perry Old 37 37 0 Below Median Below Median Flat Below Normal

Elevated=above 3rd
quartile and Very Elevated=Above Maximum.
6Based on Quartile Analysis from Current Report where: Below Normal=below median, Above Normal= above median,
5Based on Change in Count Current Report vs Last Report
4Week 43 Quartile Results are from the Last Report
3Week 44 Quartile Results are from the Current Report
2First Week Reported and/or First Occurence of Disease or Condition in 2017
1Data Status: Old=Continuing Occurence in 2017, New=First Occurence in 2017 and Out=Case was Removed from WEBSURV
Missouri Department of Health and Senior Services (DHSS) 7Weekly Communicable Disease Report for Week 44, 2017
Disease or Condition AnalysisCompared to Last Report run on 10/31/2017 for Week 43, 2017
Tb Infection
County
Data
Status1,2
1st
WeekReportedCurrentReport
1st
WeekReported
LastReport
Changein
Count
Week 44Quartile
Results3
Week 43Quartile
Results4
DataTrend
Analysis5
DataElevation
Analysis6
Pettis Old 1 1 1 Above Maximum Above 3rd
Quartile Increase Very Elevated
Phelps Old 3 3 0 Below Median Below Median Flat Below Normal
Pike Old 28 28 0 Above Median Above Median Flat Above Normal
Platte Old 5 5 0 Below Median Below Median Flat Below Normal
Pulaski Old 8 8 0 Above 3rd
Quartile Above 3rd
Quartile Flat Elevated
Randolph Old 10 10 0 Above 3rd
Quartile Above 3rd
Quartile Flat Elevated
Reynolds Old 25 25 0 Below Median Below Median Flat Below Normal
St Charles Old 1 1 4 Above Median Above Median Increase Above Normal
Ste Genevieve Old 4 4 0 Above Median Above Median Flat Above Normal
St Francois Old 2 2 0 Above 3rd
Quartile Above 3rd
Quartile Flat Elevated
St Louis Old 1 1 19 Below Median Below Median Increase Below Normal
Saline Old 4 4 0 Below Median Below Median Flat Below Normal
Scott Old 3 3 1 Above Median Below Median Increase Above Normal
Shelby Old 42 No Data 1 Below Median Below Median Increase Below Normal
Stoddard Old 1 1 0 Above Median Above Median Flat Above Normal
Sullivan Old 11 11 0 Above Maximum Above Maximum Flat Very Elevated
Taney Old 12 12 0 Below Median Below Median Flat Below Normal
Texas Old 36 36 0 Below Median Below Median Flat Below Normal
Vernon Old 11 11 0 Above 3rd
Quartile Above 3rd
Quartile Flat Elevated
Washington Old 3 3 0 Below Median Below Median Flat Below Normal
Wayne Old 14 14 0 Below Median Below Median Flat Below Normal
Webster Old 9 9 0 Below Median Below Median Flat Below Normal
Wright Old 4 4 0 Above Median Above Median Flat Above Normal
St Louis City Old 1 1 4 Below Median Below Median Increase Below Normal
Independence Old 17 17 0 Below Median Below Median Flat Below Normal
Joplin Old 3 3 1 Below Median Below Median Increase Below Normal
Kansas City Old 1 1 9 Below Median Below Median Increase Below Normal

Elevated=above 3rd
quartile and Very Elevated=Above Maximum.
6Based on Quartile Analysis from Current Report where: Below Normal=below median, Above Normal= above median,
5Based on Change in Count Current Report vs Last Report
4Week 43 Quartile Results are from the Last Report
3Week 44 Quartile Results are from the Current Report
2First Week Reported and/or First Occurence of Disease or Condition in 2017
1Data Status: Old=Continuing Occurence in 2017, New=First Occurence in 2017 and Out=Case was Removed from WEBSURV
Missouri Department of Health and Senior Services (DHSS) 8Weekly Communicable Disease Report for Week 44, 2017
Disease or Condition AnalysisCompared to Last Report run on 10/31/2017 for Week 43, 2017
Tb Infection
County
Data
Status1,2
1st
WeekReportedCurrentReport
1st
WeekReported
LastReport
Changein
Count
Week 44Quartile
Results3
Week 43Quartile
Results4
DataTrend
Analysis5
DataElevation
Analysis6
514 Old 1 1 8 Below Median Below Median Increase Below Normal
Troop A Total Old 1 1 14 Below Median Below Median Increase Below Normal
Troop B Total Old 1 1 5 Above Maximum Above Maximum Increase Very Elevated
Troop C Total Old 1 1 28 Below Median Below Median Increase Below Normal
Troop D Total Old 1 1 10 Below Median Below Median Increase Below Normal
Troop E Total Old 1 1 1 Below Median Below Median Increase Below Normal
Troop F Total Old 1 1 7 Below Median Below Median Increase Below Normal
Troop G Total Old 3 3 0 Below Median Below Median Flat Below Normal
Troop H Total Old 1 1 1 Below Median Below Median Increase Below Normal
Troop I Total Old 3 3 0 Below Median Below Median Flat Below Normal
State Total Old 1 1 74 Below Median Below Median Increase Below Normal

Missouri Department of Health and Senior Services (DHSS) 9Weekly Communicable Disease Report
Quartile Analysis of Year-to-Date Counts for Week 44, 2017
Tb InfectionYTD Count in 2017 YTD Median (2012 to 2016)
YTD Third Quartile (2012 to 2016) YTD Maximum (2012 to 2016)
Missouri Department of Health and Senior Services (DHSS) 9Weekly Communicable Disease Report
Quartile Analysis of Year-to-Date Counts for Week 44, 2017
Tb InfectionYTD Count in 2017 YTD Median (2012 to 2016)
YTD Third Quartile (2012 to 2016) YTD Maximum (2012 to 2016)

The mean plus three standard deviations based on the current week, 7 previous weeks and 4 subsequents or leading weeks forthe past five years
The mean plus two standard deviations based on the current week, 7 previous weeks and 4 subsequents or leading weeks for thepast five years
4-week count mean based on the current and 3 previous weeks
Missouri Department of Health and Senior Services (DHSS) 10Weekly Communicable Disease Report for
Comparison of Confirmed and Probable 4-week Count Mean Week 44, 2017
Tb Infection4-week Count Mean Historical Limit(2 std) Historical Limit(3 std)
4Last Report was run on 10/31/2017 for Week 43, 2017
3Current Report was run on 11/07/2017 for Week 44, 2017
2The relative rate is computed as the county or district rate divided by the overall state rate
1Rates are Year-to-Date Counts per 100,000 population for Week 44, 2017
Missouri Department of Health and Senior Services (DHSS) 10Weekly Communicable Disease Report
Year-to-Date Counts and Rates for Week 44 , 2017
Tb Infection
County
Week44
YTD
Week44
Rate1
Week 44
Relative
Rate2
Changein
CountFrom
Current
Report3
Changein
CountFromLast
Report4
Adair 26 102.5 3.2 0 2
Andrew 1 5.8 0.2 0 0
Audrain 4 15.3 0.5 0 0
Barry 8 22.3 0.7 0 1
Bates 2 12.2 0.4 0 0
Benton 2 10.7 0.3 0 0
Bollinger 1 8.2 0.3 0 0
Boone 124 70.9 2.2 0 7
Buchanan 10 11.2 0.3 0 1
Butler 6 14.0 0.4 0 0
Caldwell 1 11.1 0.3 0 0
Callaway 4 8.9 0.3 0 0
Camden 6 13.6 0.4 0 0
Cape Girardeau 11 14.0 0.4 0 1
Cass 9 8.9 0.3 0 0
Cedar 3 21.5 0.7 0 0
Christian 11 13.2 0.4 0 0
Clay 17 14.8 0.5 0 0
Cole 19 24.8 0.8 0 0
Cooper 2 11.3 0.3 0 0
Crawford 3 12.2 0.4 0 0
Dallas 1 6.1 0.2 0 0
Dent 3 19.2 0.6 0 0
Douglas 1 7.5 0.2 0 0
Dunklin 4 12.9 0.4 0 0
Franklin 23 22.5 0.7 0 1
Greene 127 44.1 1.4 0 7
Grundy 1 9.9 0.3 0 0
Harrison 1 11.6 0.4 0 0
Henry 1 4.6 0.1 0 0
Howard 1 9.9 0.3 0 0
Howell 4 10.0 0.3 0 0
Jackson 101 38.5 1.2 3 4
Jasper 19 25.7 0.8 0 1
Jefferson 13 5.8 0.2 0 0

4Last Report was run on 10/31/2017 for Week 43, 2017
3Current Report was run on 11/07/2017 for Week 44, 2017
2The relative rate is computed as the county or district rate divided by the overall state rate
1Rates are Year-to-Date Counts per 100,000 population for Week 44, 2017
Missouri Department of Health and Senior Services (DHSS) 11Weekly Communicable Disease Report
Year-to-Date Counts and Rates for Week 44 , 2017
Tb Infection
County
Week44
YTD
Week44
Rate1
Week 44
Relative
Rate2
Changein
CountFrom
Current
Report3
Changein
CountFromLast
Report4
Johnson 39 72.3 2.2 0 0
Laclede 2 5.6 0.2 0 0
Lafayette 2 6.1 0.2 0 0
Lawrence 4 10.5 0.3 0 0
Lincoln 6 11.0 0.3 0 0
Livingston 2 13.3 0.4 0 0
Mcdonald 9 39.7 1.2 0 0
Macon 1 6.5 0.2 0 0
Madison 1 8.1 0.2 0 0
Maries 1 11.2 0.3 0 0
Marion 6 20.8 0.6 0 2
Miller 6 23.9 0.7 0 0
Mississippi 1 7.1 0.2 0 0
Monroe 2 23.3 0.7 0 0
Morgan 3 14.9 0.5 0 0
New Madrid 2 11.0 0.3 0 0
Newton 7 13.6 0.4 0 0
Nodaway 10 43.8 1.3 0 0
Oregon 1 9.1 0.3 0 0
Pemiscot 5 28.6 0.9 0 -1
Perry 1 5.2 0.2 0 0
Pettis 13 30.8 0.9 0 1
Phelps 26 58.0 1.8 0 0
Pike 4 21.8 0.7 0 0
Platte 7 14.1 0.4 0 0
Pulaski 12 22.5 0.7 0 0
Randolph 4 15.9 0.5 0 0
Reynolds 1 15.5 0.5 0 0
St Charles 78 20.2 0.6 1 4
Ste Genevieve 3 16.7 0.5 0 0
St Francois 22 33.1 1.0 0 0
St Louis 404 40.3 1.2 11 19
Saline 2 8.6 0.3 0 0
Scott 8 20.5 0.6 0 1
Shelby 1 16.3 0.5 0 1

4Last Report was run on 10/31/2017 for Week 43, 2017
3Current Report was run on 11/07/2017 for Week 44, 2017
2The relative rate is computed as the county or district rate divided by the overall state rate
1Rates are Year-to-Date Counts per 100,000 population for Week 44, 2017
Missouri Department of Health and Senior Services (DHSS) 12Weekly Communicable Disease Report
Year-to-Date Counts and Rates for Week 44 , 2017
Tb Infection
County
Week44
YTD
Week44
Rate1
Week 44
Relative
Rate2
Changein
CountFrom
Current
Report3
Changein
CountFromLast
Report4
Stoddard 5 16.7 0.5 0 0
Sullivan 4 63.0 1.9 0 0
Taney 6 11.0 0.3 0 0
Texas 2 7.8 0.2 0 0
Vernon 7 33.6 1.0 0 0
Washington 1 4.0 0.1 0 0
Wayne 2 14.9 0.5 0 0
Webster 3 8.0 0.2 0 0
Wright 2 10.9 0.3 0 0
St Louis City 256 81.1 2.5 1 4
Independence 3 2.6 0.1 0 0
Joplin 26 50.2 1.5 0 1
Kansas City 300 63.1 1.9 6 9
514 93 0.0 0.0 0 8

Missouri Department of Health and Senior Services (DHSS)13
Weekly Communicable Disease ReportYTD Count for Week 44, 2017
Tb Infection
Missouri Department of Health and Senior Services (DHSS)13
Weekly Communicable Disease ReportYTD Count for Week 44, 2017
Tb InfectionMissouri Department of Health and Senior Services (DHSS)
Weekly Communicable Disease ReportYTD Count for Week 44, 2017
Tb Infection
Count 0 - 0 1 - 1 2 - 23 - 5 6 - 12 13 - 404

Rates are Year-to-Date Counts per 100,000 population for Week 44, 2017
Missouri Department of Health and Senior Services (DHSS)14
Weekly Communicable Disease ReportRates for Week 44, 2017
Tb Infection
Rates are Year-to-Date Counts per 100,000 population for Week 44, 2017
Missouri Department of Health and Senior Services (DHSS)14
Weekly Communicable Disease ReportRates for Week 44, 2017
Tb InfectionMissouri Department of Health and Senior Services (DHSS)
Weekly Communicable Disease ReportRates for Week 44, 2017
Tb Infection
Rates are Year-to-Date Counts per 100,000 population for Week 44, 2017
Rate 0.0 - 0.0 2.6 - 8.2 8.6 - 11.211.3 - 15.5 15.9 - 25.7 28.6 - 102.5

The relative rate is computed as the county or district rate divided by the overall state rate
Missouri Department of Health and Senior Services (DHSS)15
Weekly Communicable Disease ReportRelative Rates for Week 44, 2017
Tb InfectionState Rate per 100,000 = 32.5
The relative rate is computed as the county or district rate divided by the overall state rate
Missouri Department of Health and Senior Services (DHSS)15
Weekly Communicable Disease ReportRelative Rates for Week 44, 2017
Tb InfectionState Rate per 100,000 = 32.5
Missouri Department of Health and Senior Services (DHSS)Weekly Communicable Disease Report
Relative Rates for Week 44, 2017Tb Infection
State Rate per 100,000 = 32.5
The relative rate is computed as the county or district rate divided by the overall state rate
Relative Rates 0.0 - 0.0 0.1 - 0.3 0.3 - 0.30.3 - 0.5 0.5 - 0.8 0.9 - 3.2

Last Report was run on 10/31/2017 for Week 43, 2017
Missouri Department of Health and Senior Services (DHSS)16
Weekly Communicable Disease ReportChange in Count Compared to Last Report
Tb Infection
Last Report was run on 10/31/2017 for Week 43, 2017
Missouri Department of Health and Senior Services (DHSS)16
Weekly Communicable Disease ReportChange in Count Compared to Last Report
Tb InfectionMissouri Department of Health and Senior Services (DHSS)
Weekly Communicable Disease ReportChange in Count Compared to Last Report
Tb Infection
Last Report was run on 10/31/2017 for Week 43, 2017
Change in Count -1 - -1 0 - 0 1 - 12 - 2 4 - 4 7 - 19
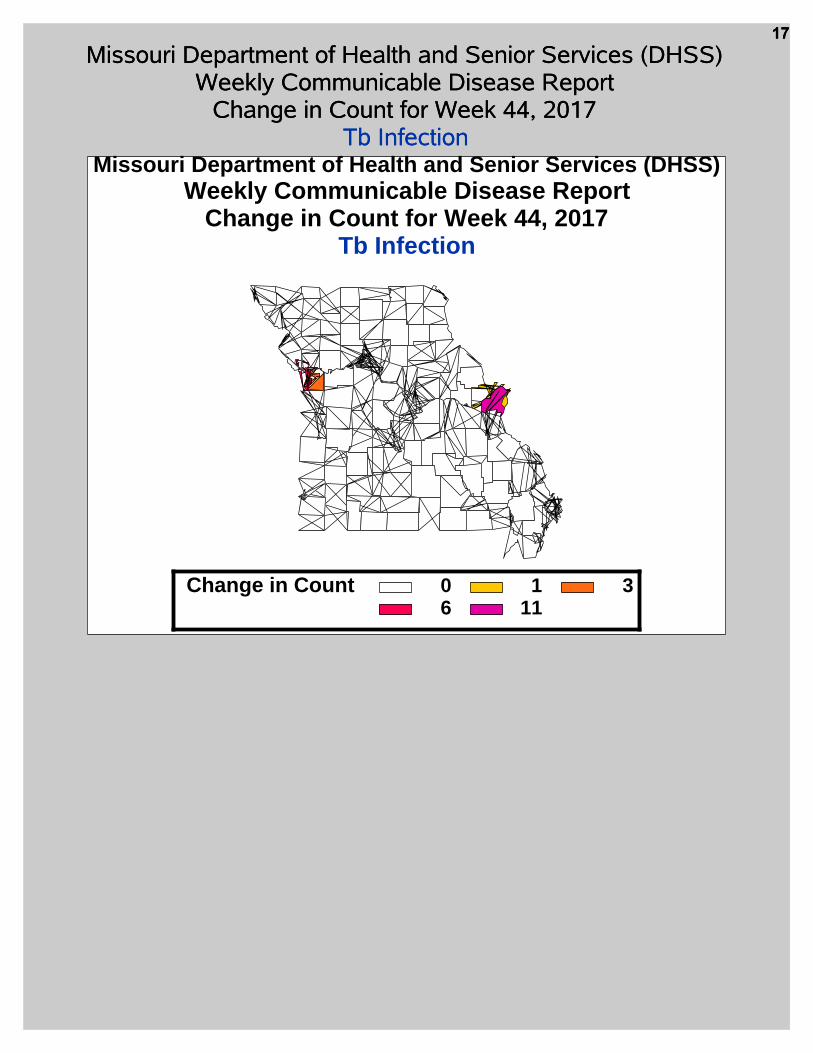
Missouri Department of Health and Senior Services (DHSS)17
Weekly Communicable Disease ReportChange in Count for Week 44, 2017
Tb Infection
Missouri Department of Health and Senior Services (DHSS)17
Weekly Communicable Disease ReportChange in Count for Week 44, 2017
Tb InfectionMissouri Department of Health and Senior Services (DHSS)
Weekly Communicable Disease ReportChange in Count for Week 44, 2017
Tb Infection
Change in Count 0 1 36 11
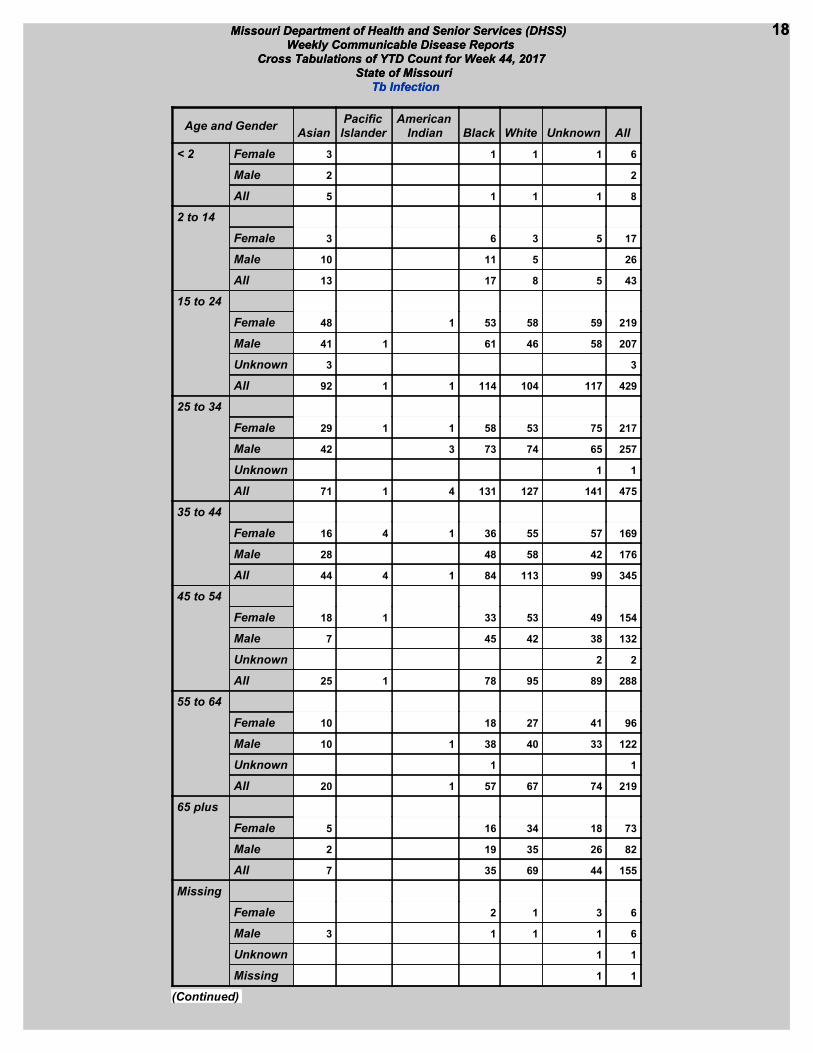
Missouri Department of Health and Senior Services (DHSS) 18Weekly Communicable Disease Reports
Cross Tabulations of YTD Count for Week 44, 2017State of Missouri
Tb Infection
Missouri Department of Health and Senior Services (DHSS) 18Weekly Communicable Disease Reports
Cross Tabulations of YTD Count for Week 44, 2017State of Missouri
Tb Infection
Age and GenderAsian
PacificIslander
AmericanIndian Black White Unknown All
< 2 Female 3 1 1 1 6
Male 2 2
All 5 1 1 1 8
2 to 14
Female 3 6 3 5 17
Male 10 11 5 26
All 13 17 8 5 43
15 to 24
Female 48 1 53 58 59 219
Male 41 1 61 46 58 207
Unknown 3 3
All 92 1 1 114 104 117 429
25 to 34
Female 29 1 1 58 53 75 217
Male 42 3 73 74 65 257
Unknown 1 1
All 71 1 4 131 127 141 475
35 to 44
Female 16 4 1 36 55 57 169
Male 28 48 58 42 176
All 44 4 1 84 113 99 345
45 to 54
Female 18 1 33 53 49 154
Male 7 45 42 38 132
Unknown 2 2
All 25 1 78 95 89 288
55 to 64
Female 10 18 27 41 96
Male 10 1 38 40 33 122
Unknown 1 1
All 20 1 57 67 74 219
65 plus
Female 5 16 34 18 73
Male 2 19 35 26 82
All 7 35 69 44 155
Missing
Female 2 1 3 6
Male 3 1 1 1 6
Unknown 1 1
Missing 1 1
(Continued)

Missouri Department of Health and Senior Services (DHSS) 19Weekly Communicable Disease Reports
Cross Tabulations of YTD Count for Week 44, 2017State of Missouri
Tb Infection
Age and GenderAsian
PacificIslander
AmericanIndian Black White Unknown All
All 3 3 2 6 14Missing
All 280 7 7 520 586 576 1,976

Missouri Department of Health and Senior Services (DHSS) 20Weekly Communicable Disease Reports
Cross Tabulations of YTD Count for Week 44, 2017State of Missouri
Tb Infection
Missouri Department of Health and Senior Services (DHSS) 20Weekly Communicable Disease Reports
Cross Tabulations of YTD Count for Week 44, 2017State of Missouri
Tb Infection

Missouri Department of Health and Senior Services (DHSS) 21Weekly Communicable Disease Reports
Cross Tabulations of YTD Count for Week 44, 2017State of Missouri
Tb Infection
Missouri Department of Health and Senior Services (DHSS) 21Weekly Communicable Disease Reports
Cross Tabulations of YTD Count for Week 44, 2017State of Missouri
Tb Infection


![TB Infection Preventionnid]/5...TB Infection Prevention Objectives Identify 3 of 6 contributing factors to possible TB transmission. Name two new practices you can add for safely collecting](https://img.dokumen.tips/doc/110x75/5ea2d828977e0d293d157610/tb-infection-prevention-nid5-tb-infection-prevention-objectives-identify-3.jpg)