Embed Size (px)
Citation preview

TB and HIVTuberculosis Workshop
Shanghai, 12-22 May 2008
Philippe GlaziouWorld Health Organization
Outline
• Epidemiology• Interventions• Response• Challenges and
Opportunities
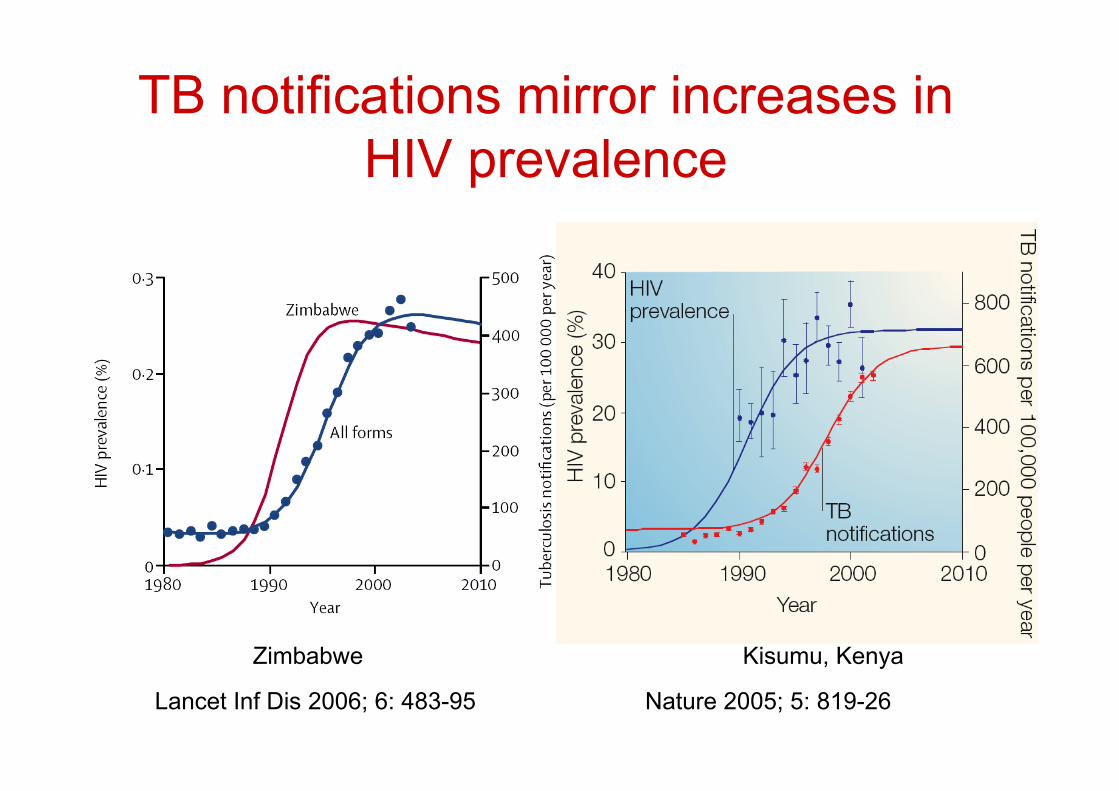
TB notifications mirror increases inHIV prevalence
Lancet Inf Dis 2006; 6: 483-95 Nature 2005; 5: 819-26
Zimbabwe Kisumu, Kenya
0
50
100
150
200
250
300
350
400
1990
1992
1994
1996
1998
2000
2002
2004
2006
Cas
es p
er 1
00,0
00 p
opul
atio
n
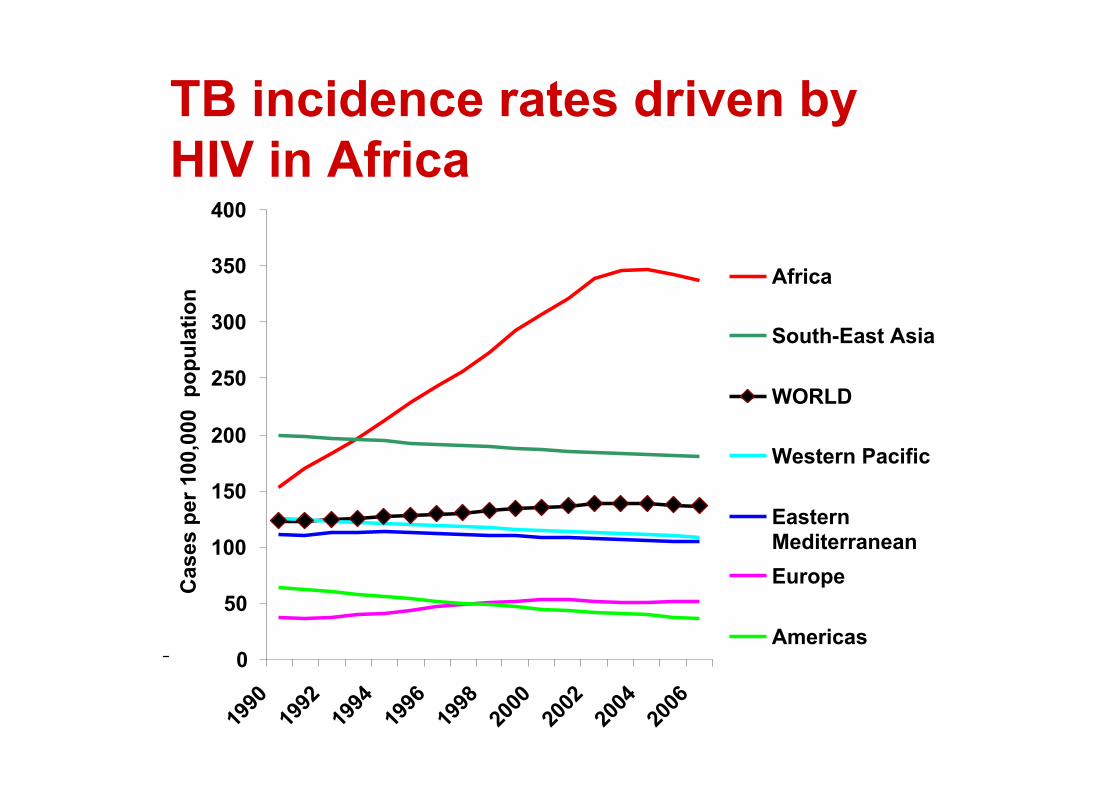
Africa
South-East Asia
WORLD
Western Pacific
EasternMediterraneanEurope
Americas
TB incidence rates driven byHIV in Africa

The TB-HIV link• 5-15% /yr reactivation of TB infection1
• > 11 million at risk of developing TB (1/3 of33.2 million HIV-infected prevalent cases2)
• 9% new TB attributable to HIV in 22 HBCs3
• 224,000 deaths in 20064
• 6-39% case fatality in Africa5, 26-50% inSouth East Asia6
1. Nunn P et al. Nature 2005; 5: 819-26; 2. AIDS Epidemic Update 2007.UNAIDS/07.27E/JC1322E; 3. WHO. TSRU meeting 2007; 4. Floyd K. UnionConference, Cape Town 2007 5. AIDS 2001; 15(2): 143-152; 6. J AcquirImmune Defic Syndr 2006; 43(1)

Global TB-HIV Burden 2006• 2.5 million new HIV infections
• 9.2 million new TB cases– 706,000 TB cases in people living with HIV
• On average 37% of adult TB patients have HIV in
sub-Saharan Africa-nearly 80% in some East and Southern African countries
• Estimated 11% of AIDS deaths due to TBglobally, one third in worst affected countries

TB in people living with HIV• Higher chance for smear negative disease
– Smear negative pulmonary = 24 – 61%– Extrapulmonary = 4 – 40%
• Autopsy studies show undiagnosed TBcaused death in 14 – 54%
• Huge delay in diagnosis (even under idealconditions ranges between 11-34 days)

Opportunistic Illnesses

Indirect estimation of HIVprevalence among incident TB
)1(1 !+
"=
IRRp
IRRpI
HIV
HIVTBHIV
pHIV = prevalence of HIV in adult population
IRR = (TB incidence in HIV+) / (TB incidence in HIV-)
Problem: how to estimate IRR (Incidence Rate Ratio)?
IRR = 30 [21-39] for established market economies
IRR = 6 [3.5 – 8] for all other countries
Source: Corbett et al. Arch Int Med 2003; 163: 1009-1021
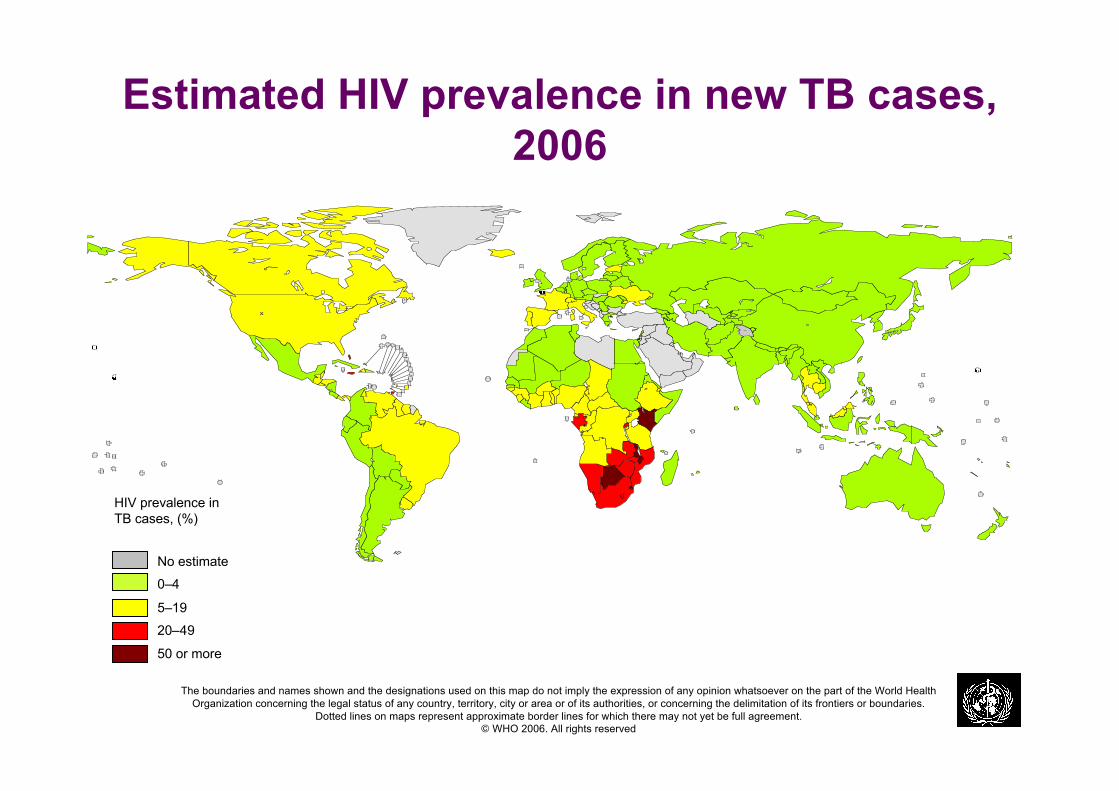
Estimated HIV prevalence in new TB cases,2006
No estimate
0–4
20–49
50 or more
5–19
HIV prevalence inTB cases, (%)
The boundaries and names shown and the designations used on this map do not imply the expression of any opinion whatsoever on the part of the World HealthOrganization concerning the legal status of any country, territory, city or area or of its authorities, or concerning the delimitation of its frontiers or boundaries.
Dotted lines on maps represent approximate border lines for which there may not yet be full agreement.© WHO 2006. All rights reserved

0 2 0 0 4 0 0 6 0 0 8 0 0 1 0 0 0 1 2 0 0 1 4 0 0
Rwanda
Congo
Côte d'Ivoire
Mozambique
Cambodia
Sierra Leone
Botswana
Zambia
Timor-Leste
Zimbabwe
Lesotho
Namibia
Djibouti
South Africa
Swaziland
All TB
TB with HIV infection
Fifteen countries with the highest estimated TB incidencerates per capita and corresponding incidence rates of HIV-
positive TB cases, 2006

Ethiopia
3%
Kenya
10%
Malawi
5%
Mozambique
4%Nigeria
6%
South Africa
29%
Zambia
3%
Zimbabwe
4%
AFR*
10%
DR Congo
3%
Côte d'Ivoire
2%
UR Tanzania
3%
Swaziland
1%
Uganda
2%
Others
15%
Brazil
AMR*
Russian
Federatn
EUR*
India
SEAR*
WPR
EMR
0
5
10
15
20
Geographical distribution of
HIV-positive TB cases, 2006
For each country or region, the number of incident TBcases arising in people with HIV is shown as a percentageof the global total of such cases. AFR* is all countries inthe WHO African Region except those shown separately;AMR* excludes Brazil; EUR* excludes the RussianFederation; SEAR* excludes India.
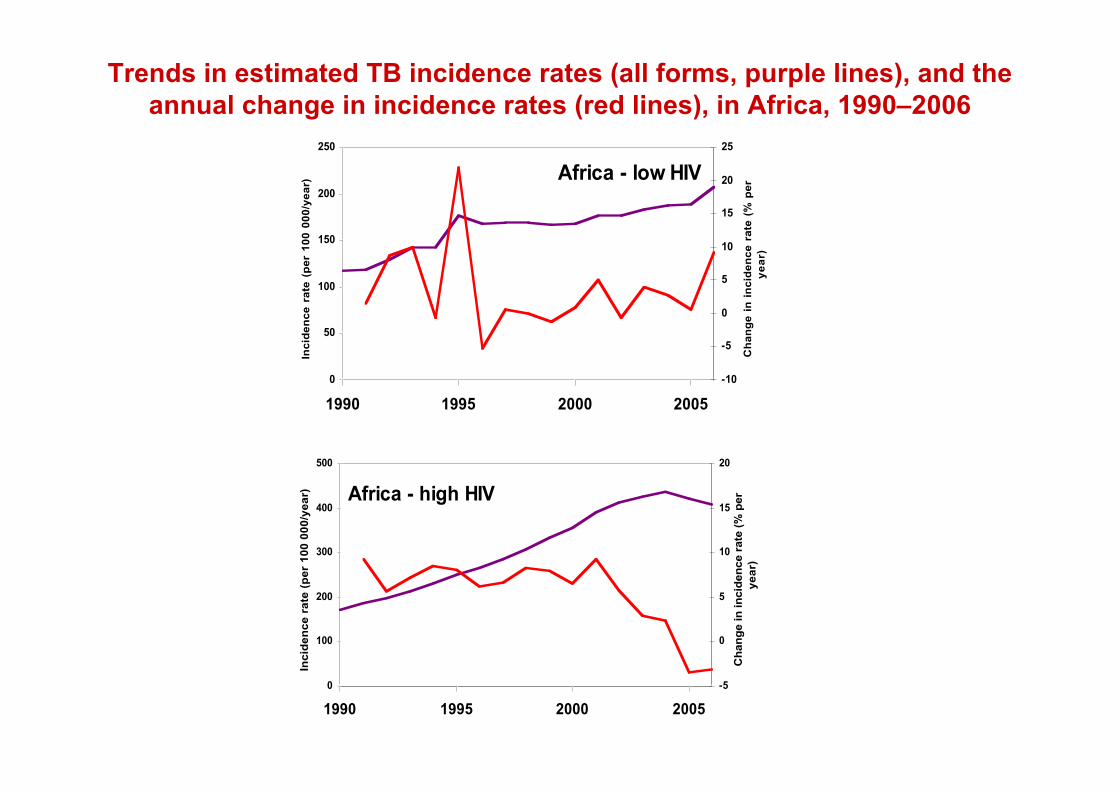
Trends in estimated TB incidence rates (all forms, purple lines), and theannual change in incidence rates (red lines), in Africa, 1990–2006
Africa - low HIV
0
50
100
150
200
250
1990 1995 2000 2005
Inc
ide
nc
e r
ate
(p
er
10
0 0
00
/ye
ar)
-10
-5
0
5
10
15
20
25
Ch
an
ge
in
in
cid
en
ce
ra
te (
% p
er
ye
ar)
Africa - high HIV
0
100
200
300
400
500
1990 1995 2000 2005
Inc
ide
nc
e r
ate
(p
er
10
0 0
00
/ye
ar)
-5
0
5
10
15
20
Ch
an
ge in
in
cid
en
ce r
ate
(%
per
ye
ar)

-10
-5
0
5
10
15
20
25
30
1991 1993 1995 1997 1999 2001 2003 2005
% annual change in estimated HIV prevalence
% annual change in TB notification rate
Annual changes (%) in estimated HIV prevalence rate in thegeneral population and the TB case notification rate for sub-
region Africa high-HIV, 1990–2006
Changes are always relative to the preceding year. Estimates of HIV prevalence are from UNAIDS (personal communication)
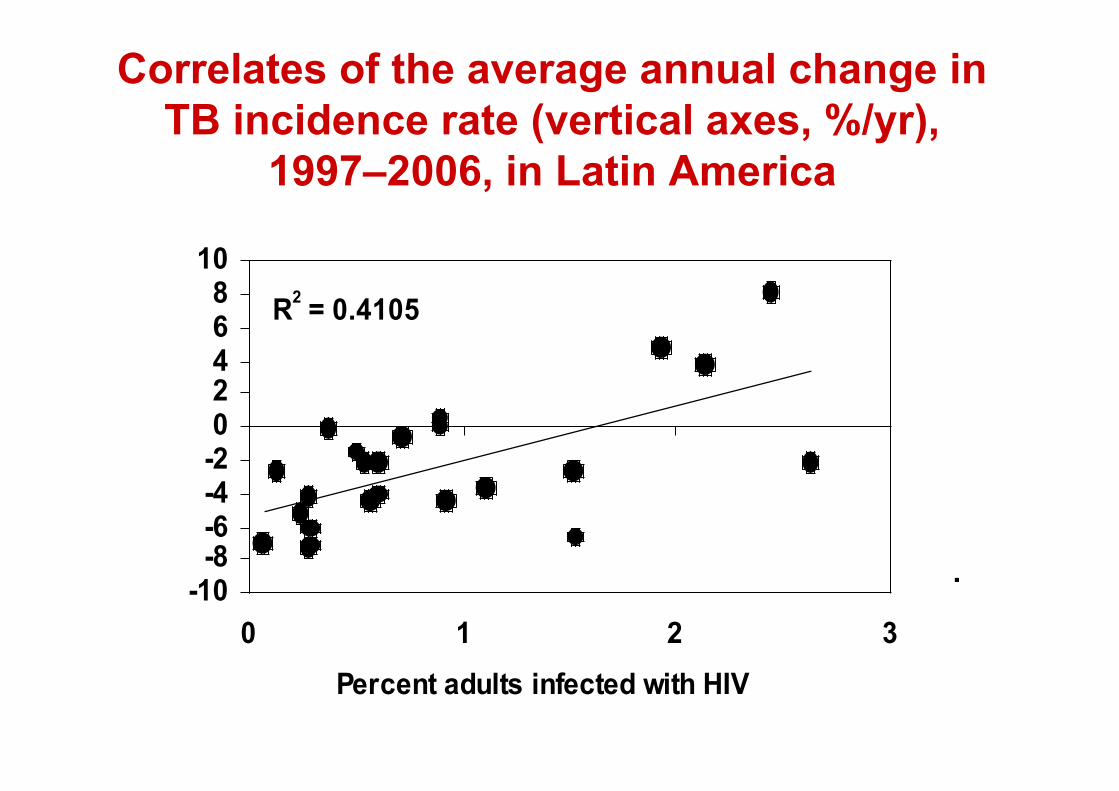
Correlates of the average annual change inTB incidence rate (vertical axes, %/yr),
1997–2006, in Latin America
r2 = 0.66
-12
-8
-4
0
4
8
12
10 100 1000 10000
Health expenditure per capita ($PPP)
(c) Central and Eastern
Europe
(b) High-income countries
r2 = 0.44
-12
-8
-4
0
4
0 20 40 60 80
Percent of TB cases foreign born
(d) Eastern Mediterranean
r 2 = 0.53
-12
-8
-4
0
4
2 4 6 8 10 12
Health expenditure as percentage of GDP
(a) Latin America
R2 = 0.4105
-10-8-6-4-202468
10
0 1 2 3
Percent adults infected with HIV
(f) Central and Eastern Europe
r2 = 0.67
-12
-8
-4
0
4
8
12
0 10 20 30
Percent of women that smoke
(e) Sub-Saharan Africa
r2 = 0.49
-4
0
4
8
12
10 100 1000
TB expenditure per capita ($PPP)
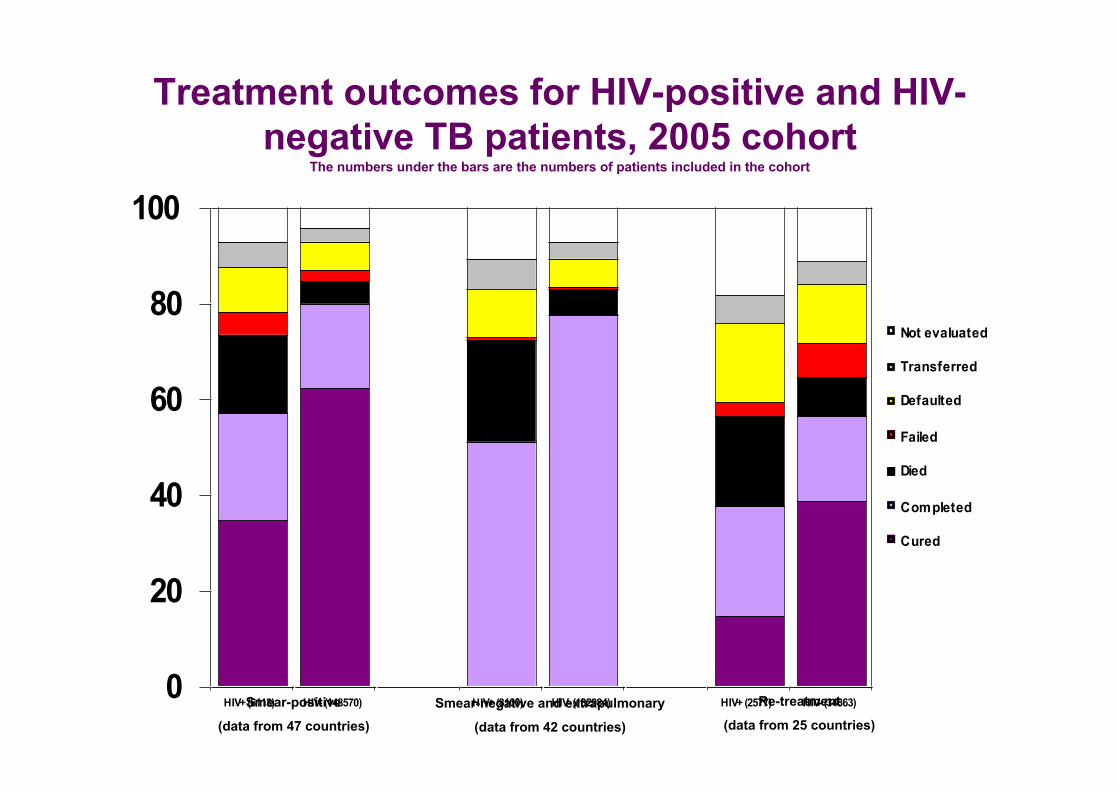
Treatment outcomes for HIV-positive and HIV-negative TB patients, 2005 cohort
The numbers under the bars are the numbers of patients included in the cohort
0
20
40
60
80
100
HIV+ (6113) HIV- (148570) HIV+ (8100) HIV- (132984) HIV+ (2577) HIV- (34863)
Not evaluated
Transferred
Defaulted
Failed
Died
Completed
Cured
Smear-positive
(data from 47 countries)Smear-negative and extrapulmonary
(data from 42 countries)
Re-treatment
(data from 25 countries)

Decline in HIV incidence, butprevalence stable
AIDS Epidemic Update 2007. UNAIDS/07.27E/JC1322E
Outline
• Epidemiology• Interventions• Response• Challenges and Opportunities
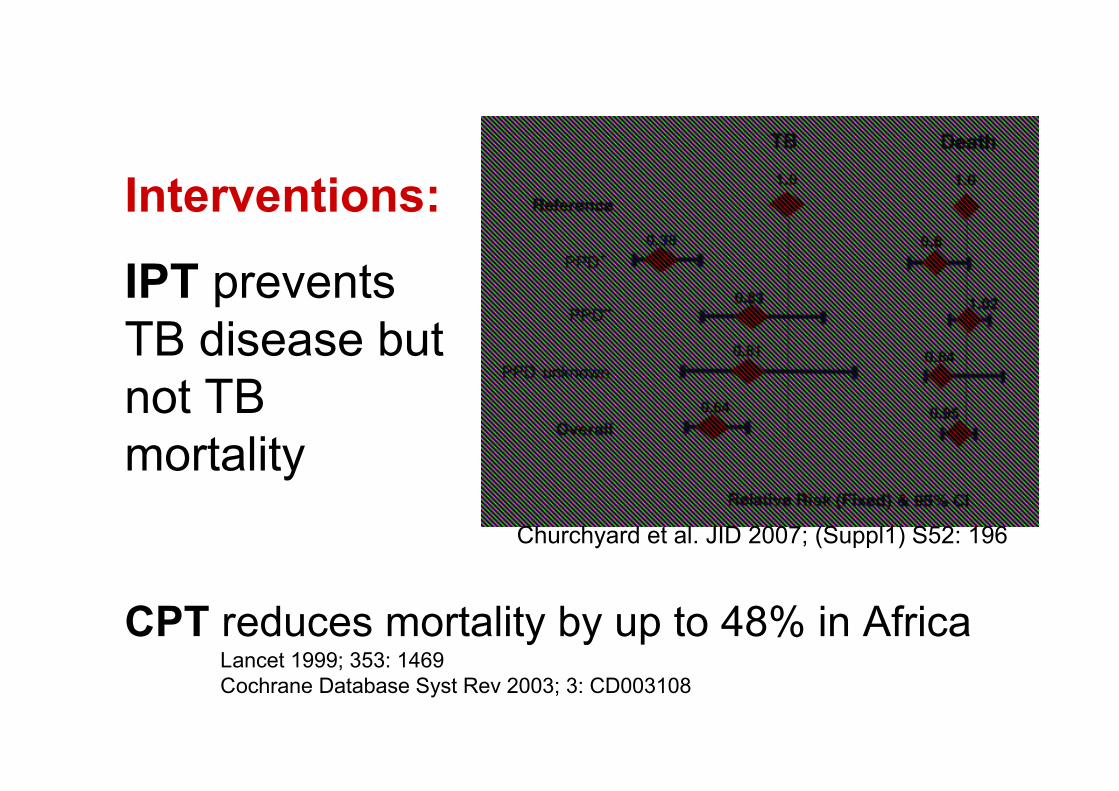
Churchyard et al. JID 2007; (Suppl1) S52: 196
Interventions:
IPT preventsTB disease butnot TBmortality
CPT reduces mortality by up to 48% in AfricaLancet 1999; 353: 1469Cochrane Database Syst Rev 2003; 3: CD003108
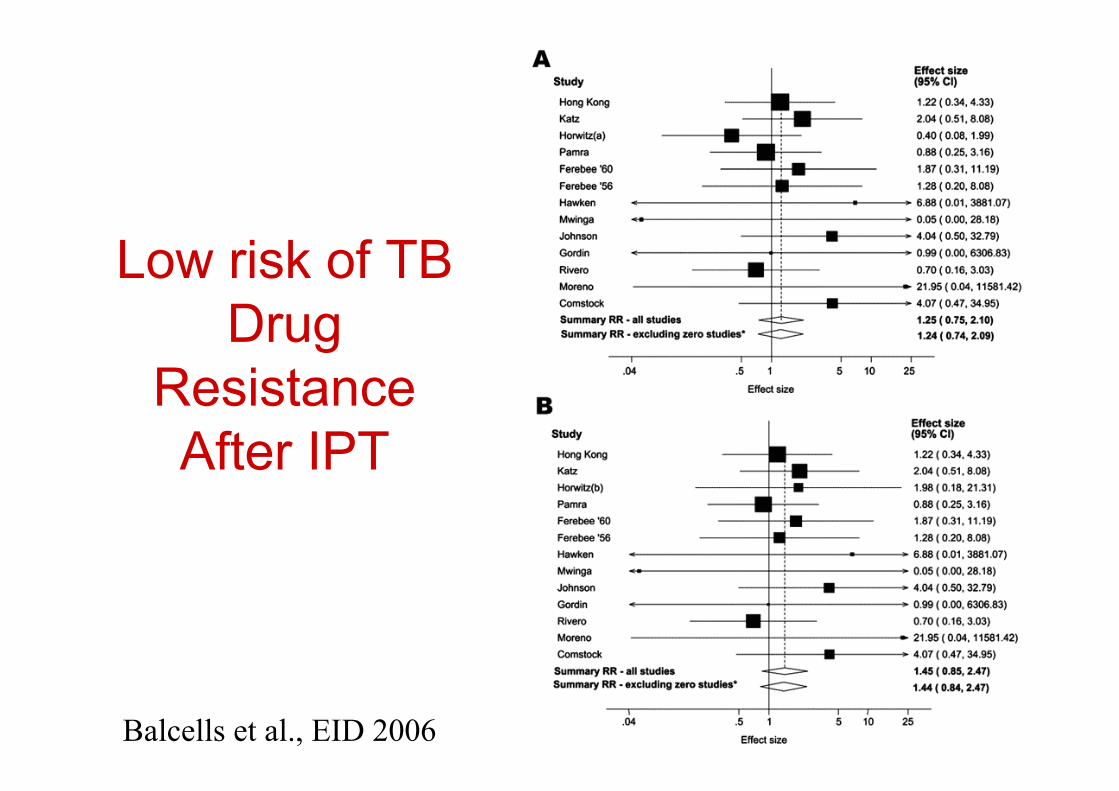
Low risk of TBDrug
ResistanceAfter IPT
Balcells et al., EID 2006

HAART prevents TB-HIV mortality inThailand
Acquire Immune Defic Syndr 2006; 43: 1-5
50% case fatality

HAART prevents TB disease in Brazil,but TB incidence remains high
Miranda et al. PLOS 2007; 9, e826
n=306
n=81
n=76
Inc = 1.2 / 100 person-years
Inc = 13.4 / 100 p-y
Inc = 4.9 / 100 p-y

PreventionOptimal timing of ART initiation in those on TB
treatment?
EARLY DELAYED
IRIS and otherconcerns
Risk ofdiseaseprogressionand death

Outline
• Epidemiology• Interventions• Response• Challenges and
Opportunities

Collaborative TB/HIV activities
Interim Policy on Collaborative TB/HIV Activities. WHO Geneva 2004.
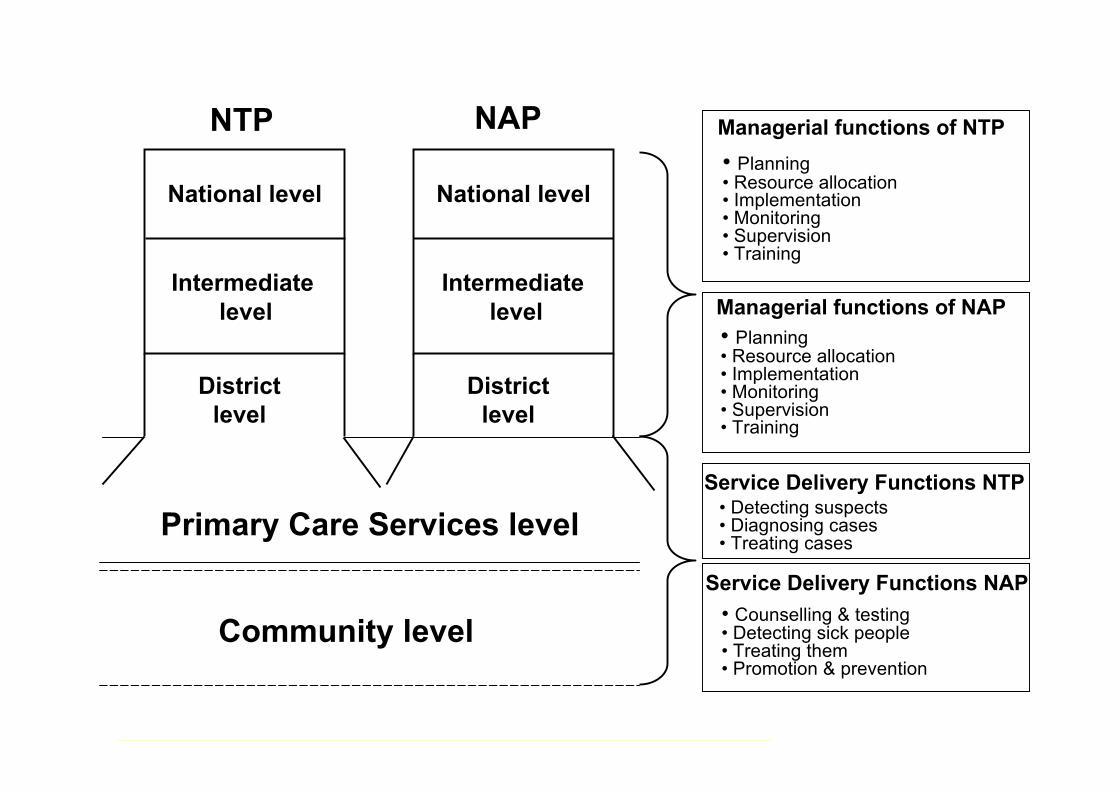
National level
Intermediate level
Districtlevel
Primary Care Services level
Community level
Managerial functions of NTP• Planning• Resource allocation• Implementation• Monitoring• Supervision• Training
Service Delivery Functions NTP• Detecting suspects• Diagnosing cases• Treating cases
NTP
National level
Intermediate level
Districtlevel
NAP
Service Delivery Functions NAP• Counselling & testing• Detecting sick people• Treating them• Promotion & prevention
Managerial functions of NAP• Planning• Resource allocation• Implementation• Monitoring• Supervision• Training
National level
Intermediate level
Districtlevel
Primary Care Services level
Community level
NTP
National level
Intermediate level
Districtlevel
NAP
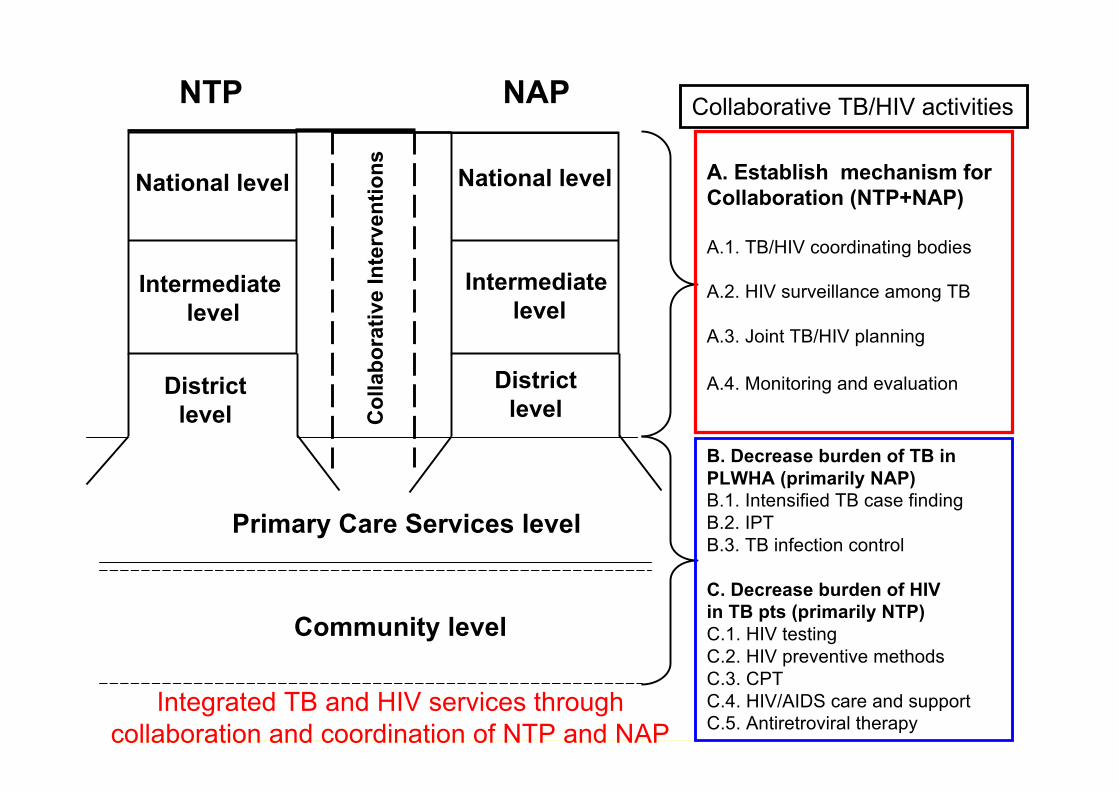
Col
labo
rativ
e In
terv
entio
ns A. Establish mechanism forCollaboration (NTP+NAP)
A.1. TB/HIV coordinating bodies
A.2. HIV surveillance among TB
A.3. Joint TB/HIV planning
A.4. Monitoring and evaluation
B. Decrease burden of TB inPLWHA (primarily NAP)B.1. Intensified TB case findingB.2. IPTB.3. TB infection control
C. Decrease burden of HIVin TB pts (primarily NTP)C.1. HIV testingC.2. HIV preventive methodsC.3. CPTC.4. HIV/AIDS care and supportC.5. Antiretroviral therapy
Collaborative TB/HIV activities
Integrated TB and HIV services throughcollaboration and coordination of NTP and NAP

Mechanisms for collaboration and policies for collaborativeTB/HIV activities, 63 priority countries, 2005–2006
0
10
20
30
40
50
60
Coord inating
body (56%)
Jo in t NTP
and NAP p lan
(91%)
HIV
surveillance
among TB
patien ts
(54%)
HIV
counselling
and testing
o f TB
patien ts
(94%)
CPT fo r HIV-
positive TB
patien ts
(94%)
ART fo r HIV-
positive TB
patien ts
(94%)
In tensified
TB case
find ing
among HIV-
positive
peop le (89%)
Ison iazid
preven tive
therapy (66%)
In fection
contro l (41%)
2005
2006
35
42
34
43
28
43
38
49
38
49
42
52
24
44
2426
20
31
0
100
200
300
400
500
600
700
800
2002(9, 37%) 2003(92, 53%) 2004(84, 61%) 2005(118, 83%) 2006(112, 90%)
Th
ou
san
ds
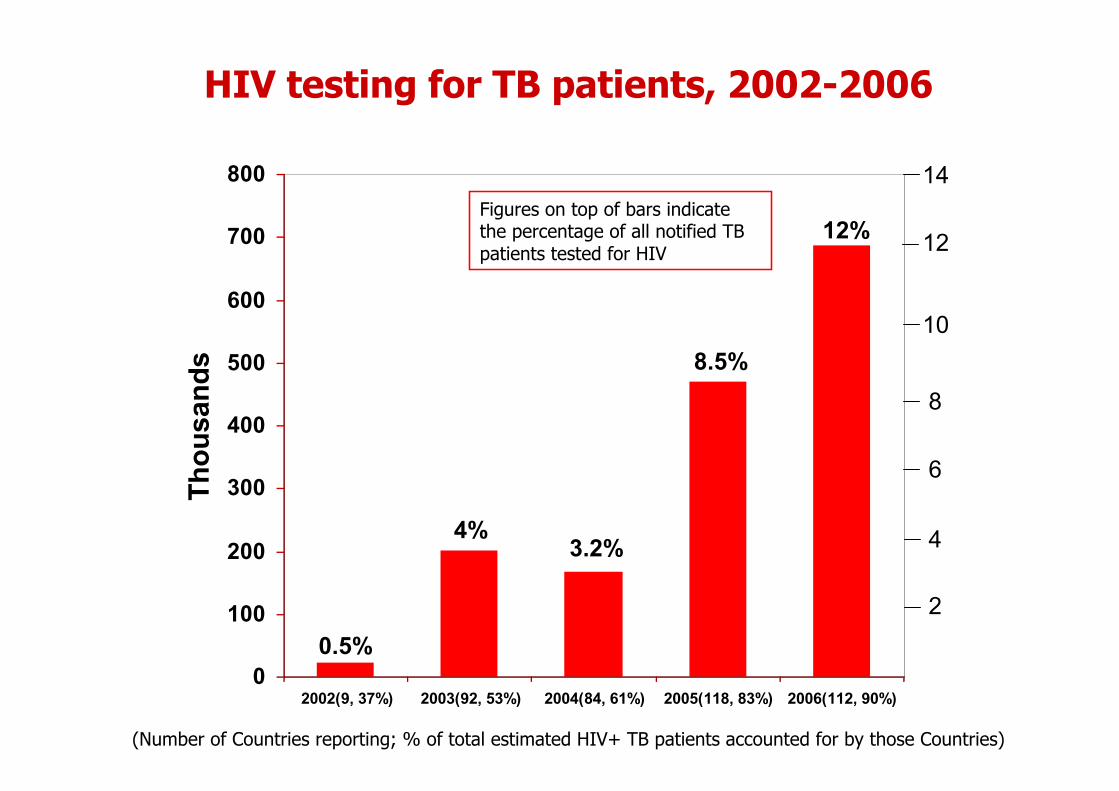
HIV testing for TB patients, 2002-2006
2
4
6
8
10
12
14
0.5%
4%3.2%
8.5%
12%Figures on top of bars indicatethe percentage of all notified TBpatients tested for HIV
(Number of Countries reporting; % of total estimated HIV+ TB patients accounted for by those Countries)

HIV testing for TB patientsin selected countries, 2006
0 10 20 30 40 50 60 70 80
DR Congo
Ethiopia
India
Cambodia
Nigeria
UR Tanzania
Viet Nam
Zambia
Mozambique
Uganda
South Africa
Botswana
Kenya
Malawi
Brazil
Rwanda
Percentage of all notified TB cases tested

0
10
20
30
40
50
60
70
2003 (47 ,15%) 2004 (25 ,32%) 2005 (47 ,67%) 2006 (54 ,75%)
Th
ou
san
ds
70% 52%
35%
41%
Figures on top of bars indicate theproportion of all HIV positive TBpatients who received ART
(Number of Countries reporting; % of total estimated HIV+ TB patients accounted for by those Countries)
Antiretroviral therapy for HIV-positiveTB patients, 2003–2006

Countries with policy to provide IPT to PLHIV,2006 (N=82)
The boundaries and names shown and the designations used on this map do not imply the expression of any opinion whatsoever on the part of the World Health Organization concerning the legal status of any country, territory, city or areaor of its authorities, or concerning the delimitation of its frontiers or boundaries.
Dotted lines on maps represent approximate border lines for which there may not yet be full agreement.© WHO 2006. All rights reserved
No policy on IPT
policy on IPT
Key
Djibouti, India, Indonesia, Lesotho, Rwanda and Zambia excludeIPT as a national policy

Countries reported provision of IPT to PLHIV,2006 (N=24)
No reported IPT
Countries reported IPT
Key
* Brazil provide IPT but did not report for 2006
The boundaries and names shown and the designations used on this map do not imply the expression of any opinion whatsoever on the part of the World Health Organization concerning the legal status of any country, territory, city or area or ofits authorities, or concerning the delimitation of its frontiers or boundaries.
Dotted lines on maps represent approximate border lines for which there may not yet be full agreement.© WHO 2006. All rights reserved
• Only 0.08% of PLHIV put on IPT globally
• Botswana report 70% of the global PLHIV on IPTNo reported activity
Countries reporting IPT
Key

0
50
100
150
200
250
300
350
Screened for TB
(44, 52%)
Diagnosed with
TB (58, 58%)
Started on IPT
(25, 38%)
0.96%
12%
0.08%
Number of people receiving theintervention as % of estimatedPLHIV in reporting Countries
(Number of Countries reporting; % of total estimated HIV+ TB patients accounted for by those Countries)
Intensified TB case finding, diagnosis of TBand IPT provision among PLHIV, 2006

Proportion of PLHIV screened and diagnosedwith TB in selected countries, 2006
0
20,000
40,000
60,000
80,000
100,000
120,000
South Africa India Ethiopia Rwanda
PLHIV screened for TB
PLHIV with TB after screening
29%
20% 31% 72%

Global progress in implementationof TB-HIV interventions (2002-2006)
99 5 1 4 4 4
92
5627 47 3 3 5
84
7226
25
7
3 3
118
104
4147
13
17 10
111
102
46
54
44
57
24
0
100
200
300
400
500
600
700
800
Tested for
HIV
HIV-positive CPT ART Screened
for TB
Diagnosed
with TB
IPT
Th
ou
san
ds
of
pa
tien
ts
2002
2003
2004
2005
2006
Diagnosis and treatment of HIV in TB patients Dx, Rx and prevention of TB in PLHIV
TOTAL
Figures on top ofbars indicate then u m b e r o fc o u n t r i e sr epo r t i n g t h ea c t i v i t y

Outline
• Epidemiology• Interventions• Response• Challenges and Opportunities
Challenges• Unsatisfactory performance of TB diagnostics• Slow rate of implementation of:
– HIV testing in TB– TB Screening in HIV– IPT
• Infection control often nonexistent• Health system weaknesses:
– Weak M&E systems– Insufficient HR planning and development– Weak commodity-procurement and distribution systems– Weak laboratory networks

Opportunities• Unprecedented funding, e.g. GF, PEPFAR• Momentum gained through the 3 by 5 initiative• Provider-initiated HIV testing and counseling
policy• Lessons from:
– Successful pilots of integrated TB and HIV care (e.g.Khayelistha, SA; START study, Durban, SA; Cambodia)
– National IPT programmes (Botswana)• Accelerated R&D in TB diagnostics• Advocacy impact of XDR-TB-HIV outbreak with
98% case fatality in Tugela Ferry, SA

Conclusions
• Encouraging, yet insufficient, progress inscaling-up collaborative TB/HIV activities
• Some progress in providing HIV care to TBpatients (testing, CTX, ART)
• IPT, intensified case finding, and TB careshould be core functions of HIV services
• Infection control is lacking in most settingsand must become a top priority for all

“We can’t fight AIDS unless we domuch more to fight TB as well."
Nelson MandelaBangkok, 15 July 2004
Source: From the CREATE projectNelson Mandela, Former President of South Africa and Nobel peace prize winner 1993


![MultifocalTubercularOsteomyelitis:ACasewith ...downloads.hindawi.com/journals/trt/2011/483802.pdf · of TB and 10% of all cases of extrapulmonary TB [1]. Spinal tuberculosis accounts](https://img.dokumen.tips/doc/110x75/5fc50df01ca4e1756528a853/multifocaltubercularosteomyelitisacasewith-of-tb-and-10-of-all-cases-of-extrapulmonary.jpg)