Embed Size (px)
Citation preview

UNIVERSIDADE DE SÃO PAULO
INSTITUTO DE QUÍMICA
Programa de Pós-Graduação em Química
TAYANA MAZIN TSUBONE
Especificidade e biodisponibilidade de
fotossensibilizadores: Em busca de um
fotossensibilizador otimizado para Terapia
Fotodinâmica
Versão corrigida da Tese conforme Resolução CoPGr 5890
O original se encontra disponível na Secretaria de Pós-Graduação do IQ-USP
São Paulo
Data do Depósito na SPG: 23/02/2017

TAYANA MAZIN TSUBONE
Specificity and bioavailability of
photosensitizers: In the search of an optimized
photosensitizer for Photodynamic Therapy
Thesis presented to the Graduate
Program in Chemistry at the Institute of
Chemistry, University of Sao Paulo to
obtain the degree of Doctor in Science.
Advisor: Prof. Dr. Maurício da Silva Baptista
São Paulo
2017


DEDICATED
to
My parents, Elza e Mário, for making me be who I am and always encouraging me to reach my dreams and goals.
My sister, Luana, for the all the care, love and friendship since childhood.
My husband, Tiago, for being my partner and my best friend. His
support during all the way with patience, love and encouragement
gave me strength in this step of my life.

ACKNOWLEDGEMENTS
I deeply acknowledge my advisor Prof. Dr. Maurício S. Baptista for all
opportunities and learning provided to me. I also would like to express my
gratitude for the patience and comprehension during the whole process of my
training, professional growth and development of this thesis. For sure, Professor
Maurício is an example of leadership and professionalism to inspire.
I acknowledge Dr. Waleska K. Martins for the collaboration always with new
ideas. Thanks to be friendly, always willing to help me and show me that strategy
and persuasion is so important as working hard.
I acknowledge Dr. Christiane Pavani for the friendship, collaboration and support
on experiments with culture cell. Thank you to encourage me to extend from the
boundaries of fundamental chemistry to a slightly more biological world.
I acknowledge Dr. Rosangela Itri and Dr. Helena Junqueira for the collaboration
and for receiving and supporting me in your laboratory during experiments with
GUVs at Institute of Physics.
I thank the laboratory staff: Alessandra and Helena for maintain the organization
and performance of laboratory. Also, my gratitude for providing optimized work
conditions which are essential to the development of our scientific job.
I thank technical assistance: Cleidiane, Laryssa, Rebeca, Luana and Ingrid to
prepare and organize all solutions and materials necessary to work at the cell
culture room. Your job is so important and facilitate a lot our work in the lab.
I thank everybody from my laboratory who have contributed direct or indirectly
during my graduate: Nayra, Orlando, Mariana, Isabel, Tatiana, Laryssa, Paulo,
Juliana, Marina, Aline, Carolina, Felipe, Thiago Tasso, Tiago dos Santos
Rodrigues, Divino, Adjaci, Waleska, Christiane, Helena.
I acknowledge Adjaci to help me with the synthesis of porphyrin.
I thank Cleidiane Sousa for the friendship and by the teachings on my initial
phase on cell culture room.
I thank Laryssa Santos for your friendship and by helping me with some
experiments.
I would like to thank to Mariana Reis for the friendship and funny moments in
the lab.
I thank Adriana Matsukuma and Wilton Rocha Lima for technical assistance with
confocal microscopy and flow cytometer.

I acknowledge the staff from Secretary Office of Graduate Program (Milton,
Marcelo and Emiliano) for the help and cooperation with required
documentation to important steps in the Graduate Program.
I deeply acknowledge Dr. Joachim Kohn for receiving me during three months in
your laboratory (New Jersey Center for Biomaterials – Rutgers University) by
the International Summer Exchange Program – 2014 to develop part of my PhD
thesis (Chapter 4).
I acknowledge Dr. Zheng Zhang for collaboration, patience and for helping me
even after I left the New Jersey Center for Biomaterials. My gratitude for be
always willing to support and encourage me with Tyrospheres work.
I acknowledge Dr. Ritu Goyal for collaboration and helping me during the period
I was on New Jersey Center for Biomaterials.
I thank Carmen for helping me with all visa process to USA and for welcome me
so kindly. My gratitude for make me feel as I was in home even in another country.
I thank everybody from New Jersey Center for Biomaterials who helped me
direct or indirectly.
My gratitude to my friends Maria, Jessica, Pryia and Carmen for making my
experience abroad fun, full of adventure and unforgettable. Your friendship has
made the distance from my country, my husband and my family less arduous.
I thank my friends André, Nathalia, Layara and Denize for friendship and fun
weekends in the “stone city”.
I would also like to highlight the importance of my family (Tiago, Elza, Luana and
Mario) in my journey as PhD student. Their patience, encouragement, love and
support gave me the strength and resilience to complete this marathon.
I thank CNPq for the scholarship grant during the first semester of my graduate.
I acknowledge FAPESP for the grant fellowship during the direct PhD
(2012/10049-4 and 2013/16532-1). I also would like to thank the opportunities
to participate of three months internship and international
conferences/congress.

“Be the change you want to see in the word.”
Mahatma Gandhi

RESUMO
Tsubone, T. M. Especificidade e biodisponibilidade de fotossensibilizadores: Em
busca de um fotossensibilizador otimizado para Terapia Fotodinâmica. 2017. 163p.
Tese de Doutorado - Programa de Pós-Graduação em Química. Instituto de Química,
Universidade de São Paulo, São Paulo.
Terapia fotodinâmica (TFD) tem sido foco substancial de investigação e
desenvolvimento para aplicação na área da medicina por várias décadas. Entretanto, TFD
é ainda muito menos conhecido que tratamentos já bem consolidados (quimioterapia,
radioterapia, cirurgia) e não tem alcançado uma posição proeminente na prática clínica.
Na expectativa de levantar alguns pontos sobre estratégias a nível molecular para
aumentar a eficácia da TFD tornando os protocolos de TFD mais preciso e confiável, três
principais estratégias são destacadas nesta tese: (i) otimização da interação do
fotossensibilizador (FS) com membranas, (ii) especificidade do fotossensibilizador em
alvos intracelulares e (iii) biodisponibilidade do fotossensibilizador na forma
monomérica através do uso de um nanocarreador.
Uma série de fotossensibilizadores anfifílicos (PpNetNI, CisDiMPyP, TPPS2a,
AlPcS2a) foram avaliados em termos de propriedades fotofísica e fotoquímica, interação
com membranas e fotodano em membranas. Os dados indicaram que os diferentes grupos
periféricos não afetam significativamente as propriedades fotofísicas das porfirinas,
entretanto isso impacta diretamente na interação FS-membrana. CisDiMPyP exibe maior
ligação em membranas do que PpNetNI (ambos são porfirinas anfifílicas positivamente
carregadas e com propriedades fotofísicas similares), provavelmente porque os grupos
periféricos fenil fornecem impedimento estérico evitando empilhamento π-π e também
aumentando as interações hidrofóbicas com a membrana. Embora TPPS2a contém dois
grupos com cargas negativas, este tem maior interação com membranas negativamente
carregadas do que PpNetNI indicando que interações hidrofóbicas e dipolares
desempenham um papel importante na definição da afinidade destas moléculas em
membranas. A menor incorporação da AlPcS2a em membranas foi atribuída à maior
rigidez da molécula e maior polaridade no centro de seu cromóforo devido ao metal.
Dentro desta série de quatro compostos anfifílicos estudados em membranas, foram
selecionadas as duas porfirinas com maiores interações e fotodano em membrana
(CisDiMPyP and TPPS2a) para maiores investigações em células eucarióticas.
Apesar da similaridade de estrutura e propriedades fotofísicas, CisDiMPyP e
TPPS2a dispõem de cargas opostas. Como consequências destas cargas opostas, cada

fotossensibilizador é direcionado para uma organela específica. No caso de porfirina
carregada positivamente (CisDiMPyP), esta se localiza principalmente em mitocôndrias
e desencadeia a morte apoptótica. Por outro lado, a porfirina carregada negativamente
(TPPS2a) é direcionada para os lisossomos prejudicando as funções pró-sobrevivência da
autofagia e resultando em morte celular associada a autofagia. O fotodano em lisossomos
e a indução da morte celular associada à autofagia causada por TPPS2a mostraram ser
mais eficazes para inibir a proliferação celular, mesmo que a incorporação celular e a
eficiência de ligação em membrana da TPPS2a sejam mais baixas. Isso vai contra alguns
paradigmas da literatura que descrevem que a relação entre a maior fototoxicidade e maior
interação com membranas e ressalta a mitocôndria como alvo intracelular chave.
Nanoesferas derivadas da tirosina foram utilizadas como nanocarreadores das
porfirinas CisDiMPyP and TPPS2a com o objetivo de aumentar a biodisponibilidade do
FS. A escolha deste copolímero foi devida sua biodegradabilidade, biocompatibilidade,
boa capacidade de encapsulamento, fácil micelização e extrema estabilidade das micelas.
Embora as porfirinas não alteram as propriedades das nanoesferas (ex. tamanho, carga
superficial, estabilidade), as nanoesferas são capazes de melhorar as propriedades
fotoquímicas e fotofísicas fornecendo melhor geração e tempo de vida do 1O2. Além
disso, estas nanopartículas aumentar a fototoxicidade de porfirinas sem alterar a
localização intracelular e o mecanismo de morte celular.
Palavras-chave: Terapia Fotodinâmica, porfirinas, membranas, nanoesferas poliméricas,
localização intracelular, mecanismo de morte celular.

ABSTRACT
Tsubone, T. M. Specificity and bioavailability of photosensitizers: In the search of an
optimized photosensitizer for Photodynamic Therapy. 2017. 163p. PhD Thesis -
Graduate Program in Chemistry. Instituto de Química, Universidade de São Paulo, São
Paulo.
For several decades, Photodynamic Therapy (PDT) has been the focus of research
and development to facilitate medical field application. However, PDT is still much less
known than conventional treatments (e.g. chemotherapy, radiotherapy, surgery). Despite
advantages of PDT for a variety of applications, it has not achieved an equally prominent
position in clinical practice.
A critical aspect during PDT treatments is the PDT efficacy and the determination
of accurate treatment protocols. Three main strategies are highlighted in this thesis, to
elucidate mechanisms at the molecular level to enhance the PDT efficiency and
furthermore facilitate more accurate and reliable PDT protocols: (i) optimization of the
photosensitizer (PS) interaction with membranes, (ii) specificity of PS to intracellular
targets and (iii) bioavailability of photosensitizers in a monomeric form by using a
nanocarrier.
A series of amphiphilic photosensitizers (PpNetNI, CisDiMPyP, TPPS2a, AlPcS2a)
were evaluated in terms of photophysical and photochemical properties, membrane
interaction and membrane photodamage. Data indicated that the different peripheral
groups do not significantly affect the photophysical properties of the porphyrins.
However, these groups directly impact the membrane interaction. CisDiMPyP exhibits a
higher binding to membranes than PpNetNI (both are positively-charged amphiphilic
porphyrins with similar photophysical properties), probably because the phenyl
peripheral hydrophobic groups provide a steric barrier, avoiding π-π stacking and also
increasing the hydrophobic interaction with the membrane. Although TPPS2a contains
two negatively charged groups, it has a larger interaction with negatively charged
membranes than PpNetNI indicating that both, hydrophobic and dipolar, interactions play
an important role for the affinity of these molecules to membranes. The smaller
incorporation of AlPcS2a into membranes was attributed to the higher rigidity of this
molecule and larger polarity in the center of chromophore due to the metal. Within the
series of four amphiphilic photosensitizers studied in membranes, it was selected two
porphyrins (CisDiMPyP and TPPS2a) with the best membrane interaction and membrane
photodamage to further investigations in eukaryotic cells.

While the structure and the photophysical properties ofCisDiMPyP and TPPS2a are
similar, these PS have opposite charges. As a consequence of the opposite charges, each
photosensitizer aims at different organelle. In case of the positively-charged porphyrin
(CisDiMPyP), it localizes mainly in mitochondria and triggersapoptotic death. On the
other hand, the negatively-charged porphyrin (TPPS2a) are directed to lysosomes,
impairing the autophagy pro-survival functions and resulting in autophagy-associated cell
death. The lysosomal photodamage and induction of autophagy-associated cell death
caused by TPPS2a showed to be more effective to inhibit cell proliferation, even though
the cellular uptake and the membrane binding efficiency of TPPS2a is lower. This goes
against some paradigms in literature which describe a relationship between stronger
phototoxicity and larger interaction with membranes and defend mitochondria as key
intracellular target.
Tyrosine-derived nanospheres were used as nanocarriers for porphyrins
(CisDiMPyP and TPPS2a) aiming at an increased bioavailability of the PS. The choice of
this copolymers is due its biodegrability, biocompatibility, high loading capacity, high
micellization yield and extremely stable micelles. Although porphyrins provide no
changes to nanospheres properties (e.g. size, superficial charge, stability), Tyrospheres
are able to improve photophysical and photochemical properties with better 1O2
generation and lifetimes. Moreover, Tyrospheres enhance phototoxicity of porphyrins
without alter subcellular localization and cell death mechanism
Keywords: Photodynamic Therapy, porphyrins, membranes, polymeric nanospheres,
intracellular localization, cell death mechanism.

LIST OF FIGURES
Figure 1.1. Summary of the relevant dates and discovery related to Photodynamic
Therapy. Reprinted by permission from Macmillan Publishers Ltd (Dolmans, Fukumura,
and Jain 2003). ................................................................................................................ 28
Figure 1.2. Jablonski diagram depicting the possible photophysical processes. ............ 30
Figure 1.3. Orbital representation of triplet (3O2) and singlet (1O2) states of oxygen.
Reprinted by permission from (Ormond & Freeman 2013). .......................................... 31
Figure 1.4. Trends in lifetime, reactivity with biomolecules and diffusion distance of
common ROS in cells. Reprinted by permission from John Wiley and Sons (Robert W
Redmond and Kochevar 2006). ...................................................................................... 32
Figure 1.5. Comparison of cell death, ROS and singlet oxygen generation between two
photosensitizers: methylene blue (MB) and crystal violet (CV). Reprinted with
permission from Elsevier (Oliveira et al. 2011). ............................................................ 33
Figure 1.6. Morphological features of major types of cell death: apoptosis, autophagy and
necrosis. Reprinted from open access Metallomics Journal (Tan et al. 2014). .............. 34
Figure 1.7. Extrinsic and intrinsic pathways involved in apoptosis. Adapted with
permission from Elsevier (Beesoo et al. 2014)............................................................... 36
Figure 1.8. Main steps of the autophagic flux. Adapted with permission from Elsevier
(Gump and Thorburn 2011). ........................................................................................... 38
Figure 1.9. Examples of nanocarriers. Adapted from open access of Frontiers in
Chemistry (Conniot et al. 2014). .................................................................................... 48
Figure 1.10. Polymeric micelles as intelligent nanocarriers. Reprinted with permission
from Elsevier (Nishiyama and Kataoka 2006). .............................................................. 50
Figure 2.1. Scheme showing the probable disposition in biological membranes of
porphyrins with the different number of charges and symmetry. P2c: meso-di-cis(4-N-
methyl-pyridyl)diphenylporphyrin, P2t: meso-trans-cis(4-N-methyl-
pyridyl)diphenylporphyrin, P3: meso-tri(4-N-methyl-pyridyl)monophenylporphyrin,
P4: meso-tetra(4-N-methyl-pyridyl)porphyrin. Reprinted by permission from Springer
(Fabio M. Engelmann et al. 2007). ................................................................................. 56
Figure 2.2. Molecular structure of the amphiphilic photosensitizers studied in this work
(PpNetNI, CisDiMPyP, TPPS2a e AlPcS2a). ................................................................... 57

Figure 2.3. Synthetic route to the production of PpNetNI. Reprinted and adapted with
permission from (Uchoa, Oliveira, and Baptista 2010). ................................................. 63
Figure 2.4. Mass spectrometry of PpNetNI. ................................................................... 64
Figure 2.5. NMR 1H spectrum of PpNetNI in MeOD. Chemical shift range of
(A) 1.6 – 2.0 ppm, (B) 10.10 – 10.40 ppm, (C) 4.20 – 4.65 ppm, (D) 3.60 – 3.85 ppm and
(E) 6.10 – 6.45 ppm. ....................................................................................................... 65
Figure 2.6. (A) Electronic absorption spectra of photosensitizers in methanol. PS
concentrations: 9.5 µM PpNetNI, 5 µM AlPcS2a, 8 µM CisDiMPyP, 5 µM TPPS2a. (B)
Fluorescence emission spectra of photosensitizers in methanol. (λexc = 502 nm for
PpNetNI, λexc = 603 nm for AlClPcS2a, λexc = 513 nm for CisDiMPyP and TPPS2a). ... 66
Figure 2.7. (A) Binding constant (Kb) to DSPC/CL vesicles (8 µmol of DSPC and 2 µmol
CL in 2mL of 5 mM Tris buffer at pH 7.4). (B) Percentage of binding to soy lecithin
vesicles (0.12 mM soy lecithin in 5 mM Tris buffer at pH 7.4), (C) Percentage of binding
to erythrocytes (1x10⁷ erythrocytes/mm3 in PBS pH 7.4). [Photosensitizer] = 7 µM. Bars
represent the mean ± SD (*p<0.05, **p<0.03 and ***p<0.001). .................................. 69
Figure 2.8. Absorption spectrum of photosensitizers (7 µM) in Tris buffer 5 mM (pH 7.4).
........................................................................................................................................ 70
Figure 2.9 (A) Light attenuation monitored at 650 nm during photoirradiation of
erythrocytes in the presence of photosensitizers. Each point corresponds to the mean of
two independent experiments and error bars represent standard deviation (SD). (B) Time
(in seconds) to reach 50% photodamage induced in the erythrocytes membranes by each
photosensitizer. [photosensitizer] = 7 µM in PBS pH 7.4, LED 522 ± 20nm in case of
porphyrins and LED 633 ± 20nm in case of phthalocyanine, 7 mW/cm2. ..................... 71
Figure 2.10. (Upper line) Phase contrast optical microscopy images of the giant vesicles
(GUVs) and (Lower line) intensity profiles across the equator of GUVs as a function of
time (in seconds) during photoactivation with 0.7 µM TPPS2a. The scale bars are 10 µm.
........................................................................................................................................ 72
Figure 2.11. Phase-contrast intensity decay of DOPC-GUVs during photoirradiation in
the presence of (A) 0.7 µM CisDiMPyP (B) 0.7 µM TPPS2a and (C) 0.7 µM AlClPcS2a.
Each point corresponds to the average of at least six vesicles and standard deviation (SD)
is represented by the error bars. (D) Time (in seconds) to reach 50% photodamage induced
in the GUVs by each photosensitizer. Box plots shows minimum to maximum values
(*p<0.05 and ***p<0.001 are considered statistically significant). [DOPC]=2.5 mM,
0.2 M sucrose inside vesicle, 0.2 M glucose outside vesicle. Irradiation carried out using
the Zeiss Filter Set 05 for porphyrins (excitation BP 395-440 nm, beam splitter
FT 460nm, emission LP 470nm, 135 µW/cm2) and the Zeiss Filter Set 32 for
phthalocyanine (excitation BP 665/45 nm, beam splitter FT 695nm, emission

BP 725/50nm, 135 µW/cm2). The number of photons absorbed by the different
photosensitizers were normalized. .................................................................................. 73
Figure 2.12. Cell death versus membrane binding measured in multilamellar vesicles.
1: TMePyP, 2: Zn-TMePyP, 3: TC18PyP and 4: Zn-TC18PyP. Reprinted by permission
from John Wiley and Sons (Pavani, Iamamoto, and Baptista 2012). ............................. 74
Figure 3.1. Overlay of LED emission and absorption spectra of both porphyrins. ........ 81
Figure 3.2. (A) Uptake of TPPS2a and CisDiMPyP in HeLa cells after 3 hours incubation
in the dark. [Porphyrins]=5 µM, 5x10⁴ cells/cm2 in DMEM culture medium 1% FBS,
pH 7.4, Bars represent mean ± SD of three independent experiments (n = 9, ***p<0.001
are considered statistically significant). (B) MTT assay. Cell viability in the dark and
48 hours after irradiation as a function of the PS concentration. Each point represents the
mean ± SD of three independent experiments (n = 9). (C) Clonogenic assay. Survival cells
in the dark and 8 days after irradiation as a function of PS concentration determined by
clonogenicity. Each point represents the mean ± SD (n = 4). (A, B and C) Incubation of
HeLa cells with porphyrins for 3 hours in DMEM with 1% FBS. (B and C) After
incubation with PS, irradiation was performed in PBS using a LED system emitting at
522 ± 20 nm with a light dose of 2.1 J/cm2. ................................................................... 89
Figure 3.3. (A) Confocal fluorescence microscopy images of HeLa cells with blue
fluorescence of nucleus (DAPI), red fluorescence of porphyrins (1 μM) and green
fluorescence of mitochondria (150 nM MitoTracker®). Right column shows the overlay
from three channels (blue, red and green). (B) Confocal fluorescence microscopy images
of HeLa cells with blue fluorescence of nucleus (DAPI), red fluorescence of porphyrins
(1 μM) and green fluorescence of lysosomes (150 nM LysoTracker®). Right column
shows the overlay from three channels (blue, red and green). Scale bars corresponds to
20 µm. ............................................................................................................................. 91
Figure 3.4. (A) Flow cytometry histograms of rhodamine 123 (Rh123) fluorescence, 3
hours after irradiation, in control cells and in HeLa cells treated with 30 nM TPPS2a,
100 nM CisDiMPyP (left) and irradiated (2.1 J/cm2 at 522nm). (B) Percentage of
mitochondrial membrane potential (Δψm) depolarization in comparison with control cells.
Δψm values were calculated from the data shown in the left figure. Box plots correspond
to minimum and maximum values of at least two independent experiments (n = 6,
***p<0.001 are considered statistically significant). ..................................................... 92
Figure 3.5. (A) Fluorescence images obtained 3 hours after irradiation of control HeLa
cells, and cells incubated with 100 nM CisDiMPyP or 30 nM TPPS2a and irradiated. First
column: blue fluorescence of nucleus DAPI staining; second column: red fluorescence of
MitoTracker® Red, staining actively-respiring mitochondria; third column: both
channels (blue and red) merged; Fourth column: surface plots of red intensity from
MitoTracker®. Scale bar of 20 μm. (B) Fluorescence images obtained 3 hours after
irradiation of control HeLa cells, and of cells incubated with 100 nM CisDiMPyP or

30 nM TPPS2a. First column: blue fluorescence of DAPI nucleus staining; second
column: green fluorescence of cleaved caspase-3 antibody; third column: both channels
(blue and green) merged; fourth column: surface plots of green intensity from cleaved
caspase-3 antibody. Scale bar of 20 μm. ........................................................................ 93
Figure 3.6. Fluorescence images obtained 3 hours after photosensitization of control
HeLa cells and of cells incubated with 100 nM CisDiMPyP and 30 nM TPPS2a. (A) First
column: blue fluorescence of DAPI staining nucleus; second column: red fluorescence of
LysoTracker® Red staining lysosomes; third column: both channels (blue and red)
merged; Fourth column: surface plots of red fluorescence from LysoTracker®. Scale bar
of 20 μm. (B) First column: blue fluorescence of DAPI staining nucleus; second column:
green fluorescence of cathepsin B anti-body; third column: both channels (blue and green)
merged; fourth column: surface plots of green intensity from cathepsin B antibody. Scale
bar of 20 μm. Incubation of HeLa cells with porphyrins for 3 hours in DMEM with
1% FBS followed by irradiation with LEDs emitting at 522 ± 20 nm and light dose
2.1 J/cm2. ........................................................................................................................ 95
Figure 3.7. Molecular characteristics of autophagy, apoptosis and necrosis. (a)
Autophagy, which is phenotypically detectable by acid vacuoles (vacuolization), LC3-II
in the autophagosomal membrane (LC3 lipidation) and adaptor proteins (P62-SQSTM1)
linked to LC3-II. Apoptosis is morphologically characterized by nuclear condensation
and pyknosis followed by DNA fragmentation. Also, biochemical changes such as
phosphotisylserine exposure in the plasma membrane occur, as well as mitochondrial
membrane permeabilization (MMP) and caspase cascade activation. Necrosis typically
manifests with oncosis and shares some features with apoptosis. (b) Fluorescence
microscopy for the detection of multiple cell death modes: human osteosarcoma U2OS
cells stably expressing a green fluorescent protein (GFP)–LC3 chimaera were kept in
control conditions (homeostasis) or treated for 12 hours with 1 μM of rapamycin (an
autophagic stimulus) or 1 μM of staurosporine, either alone (triggering apoptosis) or
together with 20 μM of Z-VAD-fmk (leading to necrosis). Cells were then co-stained with
the nuclear dye Hoechst 33342 and the exclusion dye propidium iodide. Reprinted by
permission from Macmillan Publishers Ltd (Kepp et al. 2011). .................................... 96
Figure 3.8. (A) Cell viability (by MTT assay) of control and cells incubated with 100 nM
of CisDiMPyP and 30 nM of TPPS2a, 3 hours after irradiation. Bars represent the mean ±
SD of at least three independent experiments (n = 6, ***p<0.001 is considered
statistically significant). (B) AO/PI double staining micrographs obtained 3 hours after
irradiation of control cells and cells incubated with 100 nM of CisDiMPyP or with 30 nM
of TPPS2a. Scale bar is 50 μm. (C) Pseudo-color scatter-plots showing gating in 4
populations, according to positive and negative responses to Annexin V-FITC and
Propidium iodide of non-treated cells (control) and of cells treated with: 100 nM
CisDiMPyP, or 30 nM TPPS2a, or 1 μg/mL Staurosporine. (D) Fold change in comparison
with the control of the 4 gated populations showed in (C). (A, B, C and D) HeLa cells

were incubated with porphyrins in DMEM (1% FBS) for 3 hours, and then irradiated with
LEDs emitting at 522 ± 20 nm and light dose 2.1 J/cm2. ............................................... 99
Figure 3.9. (A) (i) Micrographs obtained 48 hours after irradiation of control cells and of
cells incubated with 100 nM of CisDiMPyP or with 30 nM of TPPS2a, using AO/PI
double staining. Scale bar of 50 µm. (ii) Bars represent red and green fluorescence ratio
of AO/PI double staining from micrographs of cells showed in the left and of cells treated
with 60 μM of Chloroquine (CQ). (n = 6, **p<0.03 and ***p<0.001). (B) Autophagy
arbitrary units calculated 48 hours after the irradiation of cells previously incubated with
either CisDiMPyP or TPPS2a as function of porphyrin concentration (nM). ............... 102
Figure 3.10. (i) Expression levels of LC3I and LC3-II by western blot analysis of control
cells and of cells previously incubated with 100 nM of CisDiMPyP or 30 nM of TPPS2a,
48h after irradiation in the absence or presence of 5 nM of baflomicyn-A1 (BAF). (ii)
Bars represent the results from 2 independents experiments and indicate the relative
amounts of LC3-II (%) normalized by baseline expression of α-tubulin and the standard
deviation (SD) is represented by error bars (n = 4, **p<0.03 and ***p<0.001). ......... 103
Figure 3.11. (A) Images of HeLa cells non-treated (Control) and treated with
photosensitizers (100 nM CisDiMPyP or 30 nM TPPS2a) and 2 nM baflomycin-A1
(BAF) followed by immunostaining for P62/SQSTM1 (red fluorescence) and cathepsin
B (green fluorescence). The scale bars are 20 µm. (B) Fluorescence intensity of
P62/SQSTM1 (red fluorescence) and (C) cathepsin B (green fluorescence) from control
cells and of cells previously incubated with 100 nM of CisDiMPyP or 30 nM of TPPS2a
in the absence or presence of 2 nM of baflomycin-A1 (BAF). Bars correspond the
mean ± SD of at least two independent experiments (n = 6, **p<0.03 and ***p<0.001 are
considered statistically significant). ............................................................................. 104
Figure 3.12. Effect of autophagy inhibition by 3-MA. Cell viability 48h after irradiation
of cells previously treated with 100 nM of CisDiMPyP or 30 nM of TPPS2a in the absence
or presence of 5mM of 3-MA. The viability of cells exposed to 3-MA alone was 52 ± 2%
compared to untreated control cells, then cell survival data in presence of 3-MA were
normalized to control exposed to 3-MA. Bars correspond the mean ± SD (n = 6, **p<0.03
is considered statistically significant). .......................................................................... 105
Figure 3.13. Scheme showing consequence of photodamaging cells with porphyrins
containing opposite charges.......................................................................................... 107
Figure 4.1. Tyrosine-derived, ABA-type poly(ethylene glycol)-b-oligo(desaminotyrosyl-
tyrosine octyl ester suberate)-b-poly(ethylene glycol) triblock copolymer (PEG-
oligo(DTO-SA)-PEG) used in the preparation of Tyrospheres. ................................... 120
Figure 4.2. (A) Size stability of Tyrospheres in function of time encapsulating none
compound (circle with solid line), CisDiMPyP (square with dashed line) and TPPS2a
(triangle with dotted line) at room temperature. (B) polydispersity index (PDI) of

Tyrospheres as a function of time, without any incorporated compound (circle with solid
line), with CisDiMPyP (square with dashed line) and TPPS2a (triangle with dotted line)
at room temperature. ..................................................................................................... 121
Figure 4.3. (A) Absorption spectrum of CisDiMPyP (5μM) and TPPS2a (3μM) in PBS
(solid line), Tyrospheres (dashed line) and methanol (dotted line). Empty Tyrospheres
were used as baseline at the same concentration as the PS-loaded Tyrospheres in order to
compensate for scattered light. (B) Fluorescence emission of CisDiMPyP and TPPS2a in
PBS (solid line), Tyrospheres (dashed line) and methanol (dotted line). (C) Resonance
light scattering spectrum (RLS) of CisDiMPyP and TPPS2a in PBS (solid line),
Tyrospheres (dashed line) and methanol (dotted line). (D) Fluorescence quantum yield
(ϕF) values of porphyrins in PBS, Tyrospheres and methanol (MeOH). Bars correspond
the mean ± SD and *p<0.05, **p<0.01 are considered statistically significant. .......... 123
Figure 4.4. (A) Phosphorescence emission spectrum of singlet oxygen generated by
porphyrins in aqueous media (Tyrospheres or PBS) and the insert shows the emission
spectrum of PS in methanol. (B) Singlet oxygen quantum yield (ϕΔ) for each PS in PBS,
Tyrospheres and methanol. Bars correspond the mean ± SD of at least two independent
experiments and ***p<0.001 is considered statistically significant. ........................... 125
Figure 4.5. (A) Fluorescence lifetimes (τF) of photosensitizers (free or encapsulated)
before (solution) and after incubation (3 hours) in living HeLa cells. Box plot correspond
to the minimum and maximum values, including the mean. **p<0.01, ***p<0.001 are
considered statistically significant. (B) Fluorescence lifetime imaging microscopy
(FLIM) of HeLa cells incubated for 3 hours with CisDiMPyP (free or in Tyrospheres)
and TPPS2a (free or in Tyrospheres). λexc = 405nm and emission with filter long pass
630nm. The scale bar is 20 μm. .................................................................................... 128
Figure 4.6. (A) Confocal fluorescence microscopy images of HeLa cells with blue
fluorescence of nucleus (DAPI), red fluorescence of CisDiMPyP encapsulated in
Tyrospheres and green fluorescence of organelle-probe (MitoTracker® or
LysoTracker®). Right column shows the overlay from three channels (blue, red and
green). Scale bar corresponds to 20 µm. (B) Confocal fluorescence microscopy images
of HeLa cells with blue fluorescence of nucleus (DAPI), red fluorescence of TPPS2a
encapsulated in Tyrospheres and green fluorescence of organelle-probe (MitoTracker®
or LysoTracker®). Right column shows the overlay from three channels (blue, red and
green). Scale bar corresponds to 20 µm (C) Bars correspond to the mean ± SD from
calculated percent of colocalization between red fluorescence of porphyrins and green
fluorescence of organelle-probe to each case (porphyrin free or encapsulated in
Tyrospheres). (D) On left: Bars represent the mean ± SD of the mitochondria and
lysosomes ratio (M/L) to each porphyrin (free and encapsulated in Tyrospheres). On
right: Bars represent the mean ± SD of total percentage of localization in lysosomes and
mitochondria (% M+L) to each porphyrin (free and encapsulated in Tyrospheres).
*p<0.05, **p<0.01, ***p<0.001 are considered statistically significant. .................... 131

Figure 4.7. (A) Micrographs obtained 3 and 48 hours after PDT in HeLa cells treated
without porphyrins (control), incubated with 100 nM CisDiMPyP-loaded Tyrospheres or
with 30 nM TPPS2a-loaded Tyrospheres, using AO/PI double staining. Scale bar of 20
µm. (B) Bars represent red and green fluorescence ratio from micrographs of HeLa cells
48 hours after PDT with PS-loaded Tyrospheres. ***p<0.001 are considered statistically
significant. .................................................................................................................... 132
Figure 4.8. (A) Uptake of free phorphyrins or encapsulated in Tyrospheres after 3 hours
of incubation in HeLa cells. Porphyrins 5 µM and 5x10⁴ cells/cm2 in DMEM culture
medium 1% FBS. Bars represent the mean ± SD of at least two independent experiments
(***p<0.001 are considered statistically significant). (B) Percentage of surviving cells,
48 hours after PDT as a function of PS (free or encapsulated) concentration, determined
by MTT. Each point represents the mean ± SD of at least three independent experiments.
Incubation of HeLa cells with porphyrins for 3 hours in DMEM with 1% FBS in the dark.
Following the incubation the samples were irradiated in PBS using a LED system emitting
at 522±20nm, light dose of 2.1 J/cm2. (C) Bars correspond to the mean ± SD of PDT
efficiencies (ηPDT) for each photosensitizer (free or encapsulated) in the LC50 corrected
by their respective cellular uptake levels (***p<0.001 are considered statistically
significant). ................................................................................................................... 134
Figure 4.9. Cell viability of HeLa cells incubated for 3 hours with empty-TyroSpheres
under the same conditions used to fabricate PS-loaded Tyrospheres. .......................... 135
Figure 5.1. Schematic illustration of the PCI process. Reprinted with permission from
Elsevier (Norum et al. 2009). ....................................................................................... 141

LIST OF TABLES
Table 1.1. Reaction occurring during photodynamic action. Reproduced from (Ormond
& Freeman 2013). ........................................................................................................... 30
Table 2.1. Elemental analysis data of carbon, hydrogen and nitrogen. .......................... 64
Table 2.2. Molar absorptivity values (ε) in the maximum absorption wavelength (λmax),
emission bands, fluorescence (ϕf) and singlet oxygen quantum yields (ϕ∆) of each
photosensitizer. ............................................................................................................... 67
Table 3.1. Co-localization percentage of porphyrins with Mitotracker® green and
Lysotracker® green after 3h incubation in HeLa cells. .................................................. 90
Table 4.1. Values of size, polydispersity index (PDI), zeta potential of PS-TyroSpheres,
binding and loading efficiencies. .................................................................................. 121
Table 4.2. Fluorescence lifetimes of porphyrins (τF) from free photosensitizers in PBS
and PS loaded Tyrospheres in aqueous media.............................................................. 126
Table 4.3. Fluorescence lifetimes of porphyrins (τF) from photosensitizers free and in
Tyrospheres in living cells. ........................................................................................... 127

LIST OF ABREVIATIONS
1O2 Singlet Oxygen
3-MA 3-methyladenine
AAU Autophagy arbitrary units
ALA 5-aminolevulinic acid
AlPcS2a Al(III) Phthalocyanine chloride disulfonate disodium salt
(adjacent isomer)
AO Acridine Orange
ATP Adenosine triphosphate
AV Annexin V-FITC
BAF Baflomicin-A1
BPD-MA benzoporphyrin derivative monoacid ring A
BSA Bovine serum albumin
CASP3 Caspase-3
CisDiMPyP Cis-di(4-N-methyl-pyridyl)diphenylporphyrin
CL Cardiolipin
CQ Chloroquine
CTSB Cathepsin B
CV Crystal violet
DAPI 4',6-diamidino-2-phenylindole
DLS Dynamic light scattering
DMEM Dubelcco´s Modified Eagle medium
DMF Dimethyl formamide
DMSO Dimethyl sulfoxide
DOPC Dioleoyl phosphatidylcholine
DPPC Dipalmitoyl phosphatidylcholine

DPPG Dipalmitoyl phosphatidylglycerol
DSPC Distearoyl phosphatidylcholine
ER Endoplasmic Reticulum
FACS Flow cytometer
FBS Fetal bovine serum
FLIM Fluorescence lifetime imaging
GUV Giant unillamelar vesicles
HeLa Human adenocarcinoma cell line
Kb Binding constant
LC3 Microtubule-associated protein light chain 3
LC3-I Cytosolic form of LC3
LC3-II LC3-phosphatidylethanolamine conjugate
LC50 Lethal concentration to kill 50% of cells
LED Light emission diode
LMP Lysosome membrane permeablization
LTR LysoTracker Red
MAL Methyl-aminolevulinate
MB Methylene Blue
m-THPC meta-tetra(hydrohyphenyl)chlorin
MTR MitoTracker Red
MTT (3-(4,5-Dimethylthiazol-2-yl)-2,5-diphenyltetrazolium bromide
NPe6 N-aspartyl chlorin e6
NR Neutral Red
P62-SQSTM1 Ubiquitin-binding protein p62
PBS Phosphate buffered saline
PDI polydispersity index

PDT Photodynamic Therapy
PEG Poly(ethylene glycol)
PI Propidium Iodide
PI3K Phosphatidylinositol 3-kinase
PpIX Protoporphyrin IX
PpNetNI Dimethyl-8,13-divinil-3,7,12,17-tetramethyl-21H, 23H-
porphyrins-2,18-bis[N,N,N-trimethyl-2-(propanoilamino)etanoamonium
PS Photosensitizer
Rh123 Rhodamine 123
RLS Resonant light scattering
ROS Reactive oxygen species
SD Standard deviation
TNF Tumor necrosis factor
TPPS2a Tetraphenylporphine disulphonic acid disodium salt (adjacent
isomer)
Δψm Mitochondrial membrane inner potential
ϕf Fluorescence quantum yield
ϕΔ Singlet oxygen quantum yield

CONTENTS
CHAPTER 1: INTRODUCTION ............................................................................... 27
1.1. Historic development of Photodynamic Therapy (PDT) ................................. 27
1.2. Photophysics and photochemistry process on PDT ......................................... 29
1.3. Specificity rather than total power .................................................................. 32
1.4. Intracellular targets and cell death mechanisms in PDT ................................ 34
1.5. Structure-activity relationship of targeting cell organelles ............................. 40
1.6. Historical perspective of the development of photosensitizers (PS) ................ 42
1.7. Nanoparticles as tool for increase bioavailability of PS ................................. 47
1.8. OBJECTIVES ....................................................................................................... 52
CHAPTER 2: MEMBRANE INTERACTION OF AMPHIPHILIC
PHOTOSENSITIZERS ............................................................................................... 55
2.1. INTRODUCTION ............................................................................................ 55
2.2. METHODOLOGY ............................................................................................ 57
2.2.1. Synthesis of PpNetNI ............................................................................... 57
2.2.2. Photophysical properties .......................................................................... 58
2.2.3. PS binding to membranes ......................................................................... 59
2.2.4. Photoactivity of photosensitizers in membranes ...................................... 61
2.3. RESULTS AND DISCUSSION ......................................................................... 62
2.3.1. Synthesis and characterization of PpNetNI .............................................. 62
2.3.2. Spectroscopy and photophysical studies .................................................. 66
2.3.3. Evaluation of photosensitizer affinity to membranes ............................... 68
2.3.4. Photoactivity of photosensitizers in membranes ...................................... 70
2.4. CONCLUSION ................................................................................................. 75
CHAPTER 3: MODULATING PDT EFFICIENCY BY THE CHARGE OF
PHOTOSENSITIZER .................................................................................................. 79
3.1. INTRODUCTION ............................................................................................ 79
3.2. METHODOLOGY ............................................................................................ 80
3.2.1. Cells and culture conditions ..................................................................... 80
3.2.2. Cellular uptake of photosensitizers in HeLa cells .................................... 80
3.2.3. Photosensitization in HeLa cells .............................................................. 81
3.2.4. Cell viability assays .................................................................................. 81
3.2.5. Subcellular localization and site-specific photodamage ........................... 82
3.2.6. Investigation of the photoinduced cell death mechanism ......................... 83
3.2.8. Acridine orange and propidium iodide double staining ........................... 84
3.2.9. Quantification of autophagy arbitrary units (AAU) ................................. 85

3.2.10. Western Blot ......................................................................................... 86
3.2.11. Statistics ................................................................................................ 86
3.3. RESULTS AND DISCUSSION ......................................................................... 87
3.3.1. Uptake and phototoxicity in HeLa cells ................................................... 87
3.3.2. Porphyrins-charge governing intracellular localization and subcellular
photodamage ........................................................................................................... 90
3.3.3. Consequences of the organelle-specific photodamage ............................. 96
3.4. CONCLUSION ............................................................................................... 105
CHAPTER 4: ENHANCED PDT EFFICIENCY PROVIDED BY TYROSINE-
DERIVED NANOSPHERES ..................................................................................... 111
4.1. INTRODUCTION .......................................................................................... 111
4.2. METHODOLOGY .......................................................................................... 113
4.2.1. Preparation of photosensitizer-loaded TyroSpheres ............................... 113
4.2.2. Characterization of photosensitizer-loaded TyroSpheres ....................... 113
4.2.3. Photophysical properties of PS-loaded Tyrospheres .............................. 114
4.2.4. Singlet oxygen generation of PS-loaded Tyrospheres ............................ 115
4.2.5. Time-resolved fluorescence measurements in aqueous media ............... 116
4.2.6. Fluorescence lifetime imaging (FLIM) in living cells............................ 116
4.2.7. Subcellular localization .......................................................................... 116
4.2.8. Acridine orange and propidium iodide double staining ......................... 117
4.2.9. Cellular uptake of PS-loaded Tyrospheres in HeLa cells ....................... 118
4.2.10. Phototoxicity of PS-loaded Tyrospheres in HeLa cells ...................... 118
4.2.11. Statistical analysis ............................................................................... 119
4.3. RESULTS AND DISCUSSION ....................................................................... 119
4.3.1. Properties of PS-loaded Tyrospheres ..................................................... 119
4.3.2. Influence of Tyrospheres on photophysical properties of PS ................. 122
4.3.3. Importance of Tyrospheres on singlet oxygen generation of PS ............ 124
4.3.4. Release of PS from Tyrospheres in living cells by time-resolved
luminescence ........................................................................................................ 125
4.3.5. Tyrospheres keeping subcellular localization and cell death mechanism of
PS 129
4.3.6. Tyrospheres providing enhanced photodynamic activity of PS ............. 132
4.4. CONCLUSION ............................................................................................... 135
CHAPTER 5: CONCLUSION AND FUTURE PERSPECTIVE .......................... 139
6. REFERENCES ................................................................................................... 143
7. CURRICULUM VITAE .................................................................................... 159
APPENDIX I...............................................................................................................163

PREFACE ______________________________________________________________________
This PhD thesis consists of three separate works that will be published in
peer reviewed journals. Although they belong to related themes, each report can
be read and understood independently. An introduction provides an overview of
the relevant aspects of the overall topic, essential background information and a
general literature review. Following the three-main works, a general conclusion
briefly summarizes the major findings of this thesis and the perspectives for
further research. Specifically, this PhD thesis composed of:
Chapter 1: Introduction and objectives to the general topic area,
Chapter 2: Work describing the relationship photosensitizer-membrane
and its importance,
Chapter 3: Work demonstrating the relevance of charges bearing
photosensitizer and their consequences in terms of intracellular localizations and
cell death mechanism,
Chapter 4: Work revealing the use of a tyrosine-derived polymer as carrier
of photosensitizers in Photodynamic Therapy,
Chapter 5: General conclusion and implications for further research.


CHAPTER 1
INTRODUCTION AND OBJECTIVES
The essential background information to the overall
topic, general literature review and the aim of this work
is provided in this chapter.


_______________________________ Chapter 1: Introduction and Objectives
27
1. INTRODUCTION
Photosensitization reactions play a fundamental role in our world for the interaction
between light and matter. It is still a matter of conjecture as to whether life evolved by the use
of sun energy reacting photochemically, generating simple gaseous molecules such as methane,
ammonia, and carbon dioxide - providing early organic molecules, which eventually formed
nucleic acids and proteins (Rohatgi-Mukherjee 1978; Suppan 1994). Through the ages, nature
has improved the use of sunlight for various beneficial and essential photobiological processes
such as photosynthesis, biosynthesis of vitamin D, vision and phototaxis (considered a very
early form of “vision”). Although the beneficial roles of light on living systems have been well
established, it is important to mention that photochemical reactions also result in damage or
even in lethal consequences to living organisms (Suppan 1994). For example, the
photosensitization process can modify or destroy nucleic acids, which carry the genetic code in
a sequence of nucleotides. This results in profound consequences, such as mutagenic effects,
photoaging, and death of organisms (e.g. microbes) (Suppan 1994). Over time, humans have
observed spontaneous photoinduced phenomena and gathered knowledge, eventually
transformed into technology. The special interest of this thesis is the application of
photoinduced processes as a strategy for the treatment of diseases, also known as Photodynamic
Therapy (PDT).
1.1. Historic development of Photodynamic Therapy (PDT)
Since ancient times, the Egyptians used the photosensitization reactions to treat diseases
such as vitiligo through ingestion of plants containing psoralens, followed by the exposure to
sunlight (Sternberg, Dolphin, and Brickner 1998). In 1900, Raab demonstrated that unicellular
organisms (e.g. Paramecia) could be effectively killed by the combination of acridine dye and
light (Raab 1900). At the end of the 19th century, Niels Finsen found that red-light exposure

Chapter 1: Introduction and Objectives _______________________________
28
could treat lupus vulgaris, which was a very common skin disease at that time (Finsen 1901).
The awarding of the Nobel Prize to Finsen in 1903, for the development of phototherapy
(Dolmans, Fukumura, and Jain 2003), is considered the beginning of the modern light therapy
Later, Tappeiner and Jesionek treated skin tumors with eosin and white light and described this
phenomenon as “Photodynamic action” (Von Tappeiner and Jesionek 1903). These early
developments were followed by a large burst of experiments to test combinations of reagents
and light which led to the identification of many photosensitizing compounds, such as
anthracenes, tetrapyrroles, thiazines and xanthenes (see timeline in Figure 1.1).
Figure 1.1. Summary of the relevant dates and discovery related to Photodynamic
Therapy. Reprinted by permission from Macmillan Publishers Ltd (Dolmans, Fukumura, and
Jain 2003).
The application of photosensitization reactions to clinical medicine (currently known as
Photodynamic Therapy) has been used in the treatment of several illness, starting in the 1940´s
(Auler and Banzer 1942). First successful applications of skin cancer were reported in the
1970´s (T J Dougherty et al. 1975). Finally, the first PDT drug was approved in the late 1990´s
in Canada. Nowadays, PDT is commonly used to treat a variety of malignant tumors and
furthermore for many non-oncological diseases such as for the treatment of age-related macular
degeneration (Bressler and Bressler 2000), psoriasis (C. a Morton et al. 2002), arthritis (K B

_______________________________ Chapter 1: Introduction and Objectives
29
Trauner et al. 1998; Kenneth B Trauner and Hasan 1996) and photoinactivation of virus and
bacteria (Jori and Brown 2004).
1.2. Photophysics and photochemistry process on PDT
The basic concept of PDT involves two individually non-toxic components that are
combined to induce cellular and tissue effects in an oxygen-dependent manner (Henderson and
Dougherty 1992; Dolmans, Fukumura, and Jain 2003). The components consist of a
photosensitizer (PS) and light (on suitable wavelength), which together and in the presence of
oxygen generate reactive oxygen species (ROS), cytotoxic agents that can inactivate tumor
cells.
The photophysical action behind PDT starts when the PS absorbs light energy. After
absorption of a photon, the PS molecule gets excited from its singlet ground state (PS) to an
electronically excited higher singlet state (1PS*) – Figure 1.2., process A. Almost instantaneous
on the time scale of singlet oxygen kinetics the higher excited singlet state of the PS undergoes
internal conversion into its first excited singlet state (Kasha’s rule, process E). From this state,
inter-system crossing can occur (Figure 1.2, process C), allowing a multiplicity change of the
PS, converting the photosensitizer to an excited triplet state (3PS*). Species on the excited triplet
state (3PS*) are more easily reduced or oxidized than the molecules in the ground state (PS) and
have a longer lifetime than singlet excited state (1PS*) (Itri et al. 2014). Therefore, subsequent
of the generation of the excited triplet state (3PS*) two types of reactions may occur: Type I
and Type II (Foote 1987; Foote 1991; Vidòczy 1992; Baptista et al. 2017).

Chapter 1: Introduction and Objectives _______________________________
30
Figure 1.2. Jablonski diagram depicting the possible photophysical processes.
Table 1.1. Reaction occurring during photodynamic action. Reprinted by permission from
(Ormond & Freeman 2013).
Excitation PS + hυ 1PS* 3PS*
Photoprocess Reaction Product
Type I 3PS* + PS PS-• + PS+•
3PS* + D PS-• + D+
PS-• + O2 PS + O2-•
3PS* + O2 PS+• + O2-•
2O2-• + 2H+
O2 + H2O2
Fe2+ + O2-• Fe2+ + O2
Fe2+ + H2O2
O2 + OH- + OH•
Tipo II 3FS* + O2 FS + 1O2
D is an electron donor molecule.

_______________________________ Chapter 1: Introduction and Objectives
31
Type I processes involve an electron (or hydrogen) transfer process, where the triplet state
of the photosensitizer interacts with the biological substrate resulting in the formation of
radicals and radical ions - which on subsequent interaction with molecular oxygen give rise to
reactive oxygen species (ROS) (see Table 1.1) such as hydroxyl radical (OH•), superoxide ion
(O2- •) and hydrogen peroxide (H2O2) - (Foote 1987; Ormond and Freeman 2013; Baptista et al.
2017).
Type II processes involve a direct energy transfer between the excited triplet state of the
photosensitizer (3PS*) and molecular oxygen (3O2) producing singlet oxygen (1O2) - (Foote
1968b; Foote 1987). Singlet oxygen (1O2) is a highly reactive species because of its diamagnetic
spin configuration (Figure 1.3), which favors the electrophilic attack of electrons donor
molecules (Frankel 1984). The empty orbital present in 1O2 (Figure 1.3) enables its addition to
double bonds of lipids, proteins and nucleic acids, consequently oxidizing such biomolecules
(Politzer, Griffin, and Laseter 1971; Davies 2003; Girotti 2001).
Figure 1.3. Orbital representation of triplet (3O2) and singlet (1O2) states of oxygen.
Reprinted by permission from (Ormond & Freeman 2013).
In general, both mechanisms (Type I and Type II) may occur simultaneously. The relative
importance of one mechanism with respect to the other will depend, among other factors, on
the substrate, the distance between the photosensitizer and the substrate as well as the oxygen
concentration. The main targets of excited PS or 1O2 are electron donor molecules, i.e., carbon-
carbon unsaturated bonds, amines, sulfides, anions and neutral nucleophiles (Frankel 1984;

Chapter 1: Introduction and Objectives _______________________________
32
Foote 1968a; Cadet and Mascio 2006; Itri et al. 2014; Baptista et al. 2017). It means that these
photosensitization reactions can induce the photooxidation of relevant biomolecules (such as
membranes, proteins and DNA), impairing their biological functions and promoting cell death
(Thomas J. Dougherty et al. 1998; Henderson and Dougherty 1992).
1.3. Specificity rather than total power
Reactive oxygen species (ROS) are responsible by photooxidation of biomolecules and
the cell death. However, ROS are very reactive towards biomolecules and thus have short
lifetimes in biological environments, which implies that these species have a limited diffusion
distance within cells. The relationship between the lifetime, reactivity and the diffusion distance
for these species is illustrated in Figure 1.4 (Robert W Redmond and Kochevar 2006).
Figure 1.4. Trends in lifetime, reactivity with biomolecules and diffusion distance of common
ROS in cells. Reprinted by permission from John Wiley and Sons (Robert W Redmond and
Kochevar 2006).
To give just two examples: The OH• lifetime in cells was estimated to be around 9 ns,
which results in an average diffusion distance of 93 Å (Roots and Okada 1975). The lifetime of
1O2 in living cells already reported vary between 0.4 µs – 1.7 µs, which means that 1O2 diffusion
distance is limited to less than 0.3 µm (Schlothauer, Hackbarth, and Röder 2009; Steffen
Hackbarth et al. 2010; S. Hackbarth et al. 2012; Robert W Redmond and Kochevar 2006). This
is a very small distance on the scale of cell dimensions. Typical cells in tissue have diameters
of 10 – 30 µm; organelles such as mitochondria, lysosomes and endoplasmic reticulum exhibit

_______________________________ Chapter 1: Introduction and Objectives
33
a diameter of around 500 nm, the size of a globular protein and the thickness of typical
membranes are approximately 10 nm (Robert W Redmond and Kochevar 2006).
Therefore, the high reactivity and, respectively, the short lifetime are limiting factors for
the distribution of ROS within cells. It is fundamentally important that the photosensitizer
localizes close to the target which is intended to be damaged. In fact, Oliveira and co-workers
demonstrated that producing ROS in specific intracellular targets is the best strategy to
maximize the PDT efficacy instead of generating large amounts of ROS in a non-specific way
(Oliveira et al. 2011). They compared two photosensitizers: methylene blue (MB) and crystal
violet (CV), which have a different ability of generating ROS. Even though MB produces ROS
with a higher quantum yield compared to CV (Figure 1.5), CV showed same efficiency in
killing cells as MB (Figure 1.5). It was attributed to the highly specific localization of CV in
mitochondria (99%), supporting the idea that generating big amounts of ROS does not means
that the PS will be more effective. A high degree of intracellular specificity may provide a
greater magnitude of photoinduced cell death (Oliveira et al. 2011).
Figure 1.5. Comparison of cell death, ROS and singlet oxygen generation between two
photosensitizers: methylene blue (MB) and crystal violet (CV). Reprinted with permission from
Elsevier (Oliveira et al. 2011).
Taking into account that localization and the possible diffusion of ROS are very
imporantant features, the development of better new-photosensitizers that are more efficient in

Chapter 1: Introduction and Objectives _______________________________
34
cell killing should focus on intracellular specificity rather than high ability of ROS generation
nonspecific.
1.4. Intracellular targets and cell death mechanisms in PDT
Improving intracellular specificity triggers to different biological consequences in terms
of mechanisms of cell death. The cell death mechanisms are generically classified into three
types of cell death: apoptosis or type I programmed cell death, autophagy or type II programmed
death and necrosis or non-regulated cell death (Figure 1.6).
Figure 1.6. Morphological features of major types of cell death: apoptosis, autophagy and
necrosis. Reprinted from open access Metallomics Journal (Tan et al. 2014).
Necrosis occurs as a result of extreme physical conditions or severe cellular damage
induced by e.g. an external injury. It is characterized by cell swelling, morphological changes,
hampered organelle integrity, loss of cell membrane integrity and eventual breakdown of the
cell with a leakage of its contents into the surrounding area (Yoo and Ha 2012) - see Figure 1.6.
The uncontrolled release of cell fragments due to necrotic death into the extracellular space
initiate an inflammatory response, which hampers the elimination of dead cells by phagocytosis

_______________________________ Chapter 1: Introduction and Objectives
35
(Yoo and Ha 2012; Ana P. Castano, Demidova, and Hamblin 2004). Depending on the level of
inflammation it can be necessary to remove necrotic tissue surgically.
Apoptosis is a programmed and regulated cell death mechanism. Unlike necrosis,
apoptosis prevents uncontrolled leakage of intracellular material into the neighboring
environment and thereby avoids uncontrolled tissue inflammation (Yoo and Ha 2012; Ana P.
Castano, Demidova, and Hamblin 2004; Buytaert, Dewaele, and Agostinis 2007). Apoptotic
cells are morphologically characterized by cell shrinkage, chromatin condensation,
chromosomal DNA fragmentation and membrane blebbing while maintenaning the integrity of
the organelles and plasma membrane (Plaetzer et al. 2005; Agostinis et al. 2004) – Figure 1.6.
Besides characteristic morphological changes, apoptosis also is accompanied by characteristic
intracellular biochemical changes which can be used to identify cells in the process of apoptosis.
Apoptosis is mediated by the activation of a protease family that has a cysteine in its active site:
caspases, which act as death effector molecules. There are two signaling systems that can induce
the activation of caspases: the extrinsic death receptor pathway and the intrinsic mitochondrial
pathway, which are represented in Figure 1.7.
The extrinsic pathway of apoptosis is activated when proteins of extracellular signaling
bind to death receptors on the cell surface. Death receptors belong to the receptor superfamily
of tumor necrosis factor receptors (TNFR), which includes the TNF-related apoptosis inducing
ligand (TRAIL) receptor and Fas (Beesoo et al. 2014). After activation, death receptors promote
the recruitment of initiator procaspases (procaspase-8, procaspase-10 or both). The activation
of caspase 8 can trigger the activation of downstream effector caspases such as caspase 3 which
cleaves target proteins leading to apoptosis as illustrated in Figure 1.7 (Hirsch et al. 1998;
Ashkenazi and Dixit 1998).
The intrinsic signaling pathway involves a stimulus (e.g. mitochondrial photodamage)
that produces intracellular signals, acting directly on targets within cells and are mitochondrial-

Chapter 1: Introduction and Objectives _______________________________
36
initiated events. The stimulus activates the mitochondrial pathway, resulting in the release of
cytochrome c and the formation of apoptosome complex (see Figure 1.7). Then, caspase-9 is
activated by the apoptosome and in turn activates caspase-3 (Beesoo et al. 2014). Intrinsic and
extrinsic pathways are not isolated processes but, instead, there can be much crosstalk between
them. For example, the pro-apoptotic protein Bid can serve as a crosstalker between both
(intrinsic and extrinsic pathway), inducing a mitochondrial amplification loop upon its caspase-
mediated proteolytic processing (Beesoo et al. 2014).
Figure 1.7. Extrinsic and intrinsic pathways involved in apoptosis. Adapted with
permission from Elsevier (Beesoo et al. 2014).
Apoptosis has been shown to be a dominant form of cell death by following PDT in
multiple experimental settings (Oleinick, Morris, and Belichenko 2002; Luo, Chang, and Kessel
1996; Plaetzer et al. 2005), however, it is known that cancer cells can be resistant to apoptosis
as cell death mechanism (Mohammad et al. 2015).

_______________________________ Chapter 1: Introduction and Objectives
37
In addition to necrosis and apoptosis, PDT protocols can also induce autophagy-
associated cell death. Autophagy is a catabolic pathway, fundamental for cell homeostasis,
removing misfolded proteins, clearing damaged organelles as well as eliminating intracellular
pathogens (Glick, Barth, and Macleod 2010). The first step of the autophagy process is an
isolation of membranes, also known as a phagophore, which are derived from lipid bilayers of
the endoplasmic reticulum (ER) and/or the Golgi. The nucleation and assembly of the initial
phagophore membrane requires the class III phosphatidylinositol 3-kinase (PI3K) complex,
which is composed of the vacuolar protein sorting 34 (VPS34) PI3K, along with its regulatory
subunits ATG14L, VPS15 and beclin 1. The phagophore membrane elongation and
autophagosome formation requires two ubiquitin-like conjugation pathways. The first produces
the ATG5–ATG12 conjugate, which forms a multimeric complex with ATG16L, whereas the
second involves the cleavage of LC3 to LC3-I and its subsequent conjugation to
phosphatidylethanolamine (PE) to form LC3-II in the autophagosomal membrane. Then, LC3-
II binds to the adaptor proteins (e.g. p62-SQSTM 1) and their associated protein or organellar
cargo (Abounit, Scarabelli, and Mccauley 2012). This loaded autophagosome matures through
fusion with the lysosome, forming a structure called autolysosomes (Figure 1.8), which contains
lysosomal proteases and enzymes (e.g. cathepsins) able to degrade the cargo (Mizushima 2007;
Glick, Barth, and Macleod 2010). The steady-state formation and degradation of these
structures is named autophagic flux (Figure 1.8).

Chapter 1: Introduction and Objectives _______________________________
38
Figure 1.8. Main steps of the autophagic flux. Adapted with permission from Elsevier
(Gump and Thorburn 2011).
Although autophagy is primary developed as a survival strategy of cells, an unbalance of
autophagic flux (intense induction or inhibition of the autophagy process) can lead to cell death
related with autophagy. In 2006, Kessel and Agostinis groups were the first to report that PDT
can induce cell death associated with autophagy under conditions in which apoptosis was
inhibited (David Kessel, Vicente, and Reiners 2006; Buytaert et al. 2006). After that, Oleinick´s
group showed that autophagy occurs during cell death following PDT in human cancer cells,
competent or not, for normal apoptosis (Xue et al. 2007). Three years later, Dini and
collaborators described that the use of the pan-caspase inhibitor (z-VAD) and necrosis inhibitor
Necrostatin-1 (Nec-1) was unable to completely prevent cell death, suggesting that autophagy
plays a crucial role in the death process (Dini et al. 2010). Note that in both cases the authors
indicate that the autophagy-associated cell death is independent of whether the cells are
apoptosis-deficient (Xue et al. 2007; Dini et al. 2010). The implication of apoptosis in
autophagy-associated cell death is still unclear: some works suggests that autophagy can occur
independent of the presence of apoptotic pathways, while other reports demonstrating that when
apoptosis is substantially delayed, autophagy has a cytoprotective role (Dewaele et al. 2011;
Andrzejak, Price, and Kessel 2011; Du et al. 2014; Lihuan et al. 2014). Also, it is still not

_______________________________ Chapter 1: Introduction and Objectives
39
completely understood whether the main role of autophagy in PDT protocols is rather pro-
survival or pro-death (Garg et al. 2015).
After this overview of the main cell death mechanisms reported in PDT, it is important to
keep in mind that these cell death pathways are defined by the intracellular target and the
amount of photooxidative damage (Mroz et al. 2011; Ana Paula Castano, Demidova, and
Hamblin 2005; Agostinis et al. 2004; Bacellar et al. 2015; T. M. Tsubone et al. 2017).
Photosensitizers that localize mainly in the plasma membrane can produce irreparable damage,
resulting in necrotic cell death, probably due to loss of plasma membrane integrity and rapid
depletion of intracellular ATP (Yoo and Ha 2012; Ana P. Castano, Demidova, and Hamblin
2004). Once it has already been established that the plasma membrane is not a good target due
to tendency of generating necrotic cells (Yoo and Ha 2012; Fabris et al. 2001), three other
intracellular sites for PS accumulation will be analyzed: (i) mitochondria, (ii)
Gogi/Endoplasmic reticulum (ER) and (iii) lysosomes.
(i) It is well known that damage to mitochondria is the key to induce apoptotic cell death
(David Kessel and Luo 1998; Mroz et al. 2011). The localization of photosensitizers in
mitochondria can photodamage the anti-apoptotic proteins (e.g. Bcl-2 and Bcl-xL)
and/or the mitochondrial membrane with subsequent alteration in the mitochondrial
membrane potential, a release of cytochrome c to the cytoplasm and the activation of
caspase cascades (similar consequences of photodamaging Bcl-2) triggering the
apoptotic response (D Kessel and Castelli 2001; David Kessel and Reiners 2002).
Mitochondrial photodamage can also trigger necrosis or cell death related to autophagy,
depending on the PDT - dose (PS concentration and light dose). When high PDT doses
are applied, drastic mitochondrial permeability and ATP level depletion can take place
in an uncontrolled manner, resulting in necrosis. Low PDT doses promote limited
mitochondrial permeability, which activates autophagy as repair mechanism to protect

Chapter 1: Introduction and Objectives _______________________________
40
cells, this process can end up with autophagy-associated cell death (Andrzejak, Price,
and Kessel 2011; David Kessel and Jr 2007; Garg et al. 2015).
(ii) Golgi/ER apparatus has been less considered than the damage in mitochondria, but can
also trigger programmed cell death if the PDT dose is not too high. The main
consequence of the ER photodamage is the loss of SERCA2 (sarco/endoplasmic
reticulum Ca2+-ATPase) protein levels causing breakage of calcium homeostasis and
triggering of apoptosis (Agostinis et al. 2004; Buytaert et al. 2006). Also, it has been
reported that ER photodamage can trigger autophagy-associated cell death, when the
cells are protected from apoptosis (e.g. by Bax/Bak knockout)- (Buytaert et al. 2006).
(iii) Lysosomal photodamage leads to membrane rupture and the release of lysosomal
proteolytic enzymes into the cytoplasm. These enzymes can cleave the proapoptotic
protein Bid to a truncated form inducing an indirect apoptotic response (Reiners et al.
2002). It has also been proposed that lysosomal photodamage should prevent lysosome
fusion with autophagosomes impairing autophagic processes by negating autophagic
pro-survival functions (D. H. Kessel, Price, and Reiners 2012).
Although it is well established, which could be the consequences of photosensitization in
each organelle, it is still not clear which is the most effective intracellular targetto provide a
better cell-killing efficiency of PDT. Chapter 3 of this thesis adresses the question, whether
mitochondria or lysosomes are the better intracellular target of photo-oxidation.
1.5. Structure-activity relationship of targeting cell organelles
The photosensitizers’ structure is an important parameter to determine the subcellular
localization and consequently the efficiency and mode of cell death. There are three
fundamental properties governing the sites of photosensitizer uptake and distribution within
cells: the degree of hydrophobicity, the type and number of charges and the degree of

_______________________________ Chapter 1: Introduction and Objectives
41
asymmetry present in molecule (Bacellar et al. 2015; Ana P. Castano, Demidova, and Hamblin
2004; Ezzeddine et al. 2013).
• Polarity, asymmetry and hydrophobicity: The degree of hydrophobicity is generally
measured by Log P, defined as the logarithm of the partition coefficient of the molecule
between organic solvent (e.g. octanol) and water or by simple pharmacokinetic models
based on alternating aqueous and lipid compartments (Gerola, Tsubone, et al. 2011; Fábio
M. Engelmann et al. 2007). As example, Pavani and co-workers demonstrated that an
increase in the size of the alkyl chains around the chromophore is directly associated to a
photosensitizer accumulation and enhanced photodynamic efficiency (Pavani et al. 2009).
Usually, a higher asymmetry can also provide a better interaction with plasma membrane
and/or organelles membranes (Fabio M. Engelmann et al. 2007; Ezzeddine et al. 2013).
Engelmann and co-authors showed that binding and photodynamic efficiency is inversely
proportional to the number of positively charges groups of porphyrins, except for cis-
molecules due the amphiphilic nature of this asymmetric compound (Fabio M.
Engelmann et al. 2007). The effect of side chains attached in different positions (ortho,
meta and para) may also affect the cellular uptake and photodynamic efficiency. Ezzedine
et al. demonstrated that cellular uptake and photodynamic efficiency of cationic hexyl
isomers increase in the followed order: para > meta > ortho (Ezzeddine et al. 2013). This
is because the variation of the position of substituents directly affects the polarity,
asymmetry and hydrophobicity of compound (Ezzeddine et al. 2013).
• Charge: The total net charge and charge position within the molecule strongly influences
the uptake and intracellular localization of photosensitizers. For example,
photosensitizers with cationic side chains usually localize in mitochondria, because it has
a negative electrochemical transmembrane potential (six times higher than the plasma
membrane) which promotes initial electrostatic attraction to positive compounds (Jensen

Chapter 1: Introduction and Objectives _______________________________
42
et al. 2010; Pavani et al. 2009; Hoye et al. 2008; Kandela, Bartlett, and Indig 2002;
Oseroff et al. 1986). On the other hand, negatively charged compounds tends to localize
in lysosomes (Woodburn et al. 1991; Reiners et al. 2002; D. H. Kessel, Price, and Reiners
2012) due to actively concentrated H+ ions (protons) that lysosomes must maintain, which
results in positive electrochemical potentials. Additionally, photosensitizers that bear
weakly basic amines can enter in lysosomes in their uncharged form, get protonated due
to the low pH inside this organelle and become trapped in lysosomes (Zong et al. 2014;
Boya and Kroemer 2008).
1.6. Historical perspective of the development of photosensitizers (PS)
In the 1990s, Photofrin® (Table 1.2) was the first photosensitizer approved by the Food
and Drug Administration (FDA) in Canada (1993), for the treatment of bladder cancer. After
that, it was approved for early stage lung cancer in Japan in 1994, for esophageal cancer in
1995, to treat early non-small cell lung cancer in 1998 and for Barrett´s esophagus in 2003
(Pushpan et al. 2002). After several PDT treatments performed with Photofrin®, scientists
realized that it was far from being the ideal compound for PDT applications. The main
disadvantages of using Photofrin® as PS are: (a) the long-lasting skin photosensitivity in such
a way that patients may have to avoid sunlight for up to around eight weeks, (b) the low
absorption in the wavelength range between 600-800nm (known as “therapeutic window”), (c)
a low tumor selectivity, and (d) Photofrin® is a complex mixture of several unidentified
structures (D Kessel 1986; David Kessel et al. 1987; Ana P. Castano, Demidova, and Hamblin
2004).
Because of the prolonged skin photosensitization and difficulties with topical application
of Photofrin® (poor skin penetration), 5-aminolevulinic acid (Levulan®) was introduced to
circumvent these problems. It was a milestone in the development of PDT; it is a porphyrin
precursor and the small molecules show a better penetration into the epidermis (Kennedy,

_______________________________ Chapter 1: Introduction and Objectives
43
Pottier, and Pross 1990; Szeimies and Abels 2001). The 5-aminolevulinic acid (ALA)-based
drugs are not photoactive by themselves, but they are metabolized in the heme biosynthesis
cycles to photosensitizing porphyrins compounds, such as Protoporphyrin IX (PpIX) (Babilas
et al. 2010).
Although ALA presents some advantages compared to Photofrin®, when using ALA as
precursor of Protoporphyrin (PpIX) the tumor thickness should not exceed 2 – 3 nm to induce
sufficient damage on the tumor tissues portions. An alternative is the methyl ester of ALA
(methyl-aminolevulinate, MAL), whose maximum intracellular concentration of
protoporphyrin IX is reached after a shorter incubation time (MAL: 3h vs ALA: 4–6h)
(Juzeniene et al. 2002).
The reduction of one or two of the macrocyclic peripheral conjugated double bonds in
porphyrins ring give rise to chlorin and bacteriochlorin. The main advantage of this this change
is a shift of the wavelength of maximum absorption to the red, facilitating light absorption in
deeper sites. Because of the high absorption of melanin and hemoglobin at wavelengths
< 600 nm and the high absorption of water molecules at wavelengths > 1200 nm, the
wavelength range between 600 and 800 nm has been determined as “therapeutic window” for
clinical PDT, considering that in wavelengths > 850-900 nm the photons may not have
sufficient energy to participate in a photochemical reaction. Then, several photosensitizers of
chlorin and bacteriochlorin families have been evaluated for PDT, mainly because they show a
high absorption in the “therapeutic window”. The approved photosensitizers based on these
families include: benzoporphyrin derivative monoacid ring A (BPD-MA, Visudyne®), meta-
tetra(hydroxyphenyl)chlorin (m-THPC, Foscan®), tin ethyl etiopurpurin (SnET2, Purlytin™),
N-aspartyl chlorin e6 (NPe6, Talaporfin, Ls11) and palladium bacteriopheophorbide (WST09,
Tookad®) (Ormond and Freeman 2013) - Table 1.2.

Chapter 1: Introduction and Objectives _______________________________
44
The Phthalocyanines (Pc) dyes family is suitable for photodynamic applications also
mainly because of the high absorption in the “therapeutic window” (Ali and van Lier 1999).
Aluminum phthalocyanine tetrasulphonate (AlPcS4, Photosen®) has been approved in Russia
to treat stomach, skin, lip, oral, and breast cancer. Silicon phthalocyanine (Pc4) is another
photosensitizer in clinical trials for treatment of actinic keratosis, Bowen’s disease, skin cancer
(Ormond and Freeman 2013) - Table 1.2.
Table 1.2. Properties of some photosensitizer dyes approved for PDT treatment and used
in PDT-related clinical trials.
Compound Trademark Application
Porfimer sodium
Photofrin® Bladder cancer, esophageal cancer,
lung cancer, Barrett´s esophagus
5-Aminolevulinic acid (ALA)
Levulan® Actinic keratosis
Methyl-aminolevulinate (MAL)
Metvix® Actinic keratosis
Benzoporphyrin derivate
monoacid ring A (BPD-MA)
Visudine® Age-related macular degeneration

_______________________________ Chapter 1: Introduction and Objectives
45
Meta-tetra(hydroxyphexyl)chlorin
(m-THPC)
Foscan® Neck and head cancer
Tin ethyl etiopurpurin (SnET2)
Purlytin® Breast adenocarcinoma, basal cell
carcinoma, Kaposi´s sarcoma, age-
related macular degeneration
N-aspartyl chlorin e6 (NPe6)
Laserphyrin®,
Litx®
Lung cancer
Palladium bacteriopheophorbide
(WST09)
Tookad® Prostate cancer

Chapter 1: Introduction and Objectives _______________________________
46
WST11
Stakel® Prostate cancer
Aluminum phothalocyanine
tetrasulphonate (AlPcS4)
Photosens® Stomach, skin, lips, oral cavity,
tongue, breast cancer
Silicon phthalocyanine (Pc4)
Clinical trial Actinic keratosis, Bowen´s disease,
skin cancer, mycosis fungoides

_______________________________ Chapter 1: Introduction and Objectives
47
Basically, photosensitizers can be classified according to their chemical structure and
generation. First generation of photosensitizers are porphyrin-based PS and included
hematopophyrin and its derivatives, named hematoporphyrin derivative (HpD). Second
generation photosensitizers were developed to circumvent some deficiencies of the first-
generation compounds and include expanded porphyrins, chlorins, bacteriochlorins,
pheophorbides and phthalocyanines. Third generation photosensitizers contain first and second
generation PS conjugated to, or packaged within carrier molecules such as antibodies,
liposomes and polymers in order to improve selectivity and bioavailability (Moser 1998).
Significant process has already been made in terms of developing new photosensitizers,
providing some advances in clinical PDT protocols, as described in the examples above.
However, some features of photosensitizer, such as low solubility, low bioavailability and low
specificity still need to be overcome. Most photosensitizers are aromatic compounds with large
delocalized π electron systems (e.g. porphyrins, chlorins, phthalocyanines), favoring strong π-
π interactions between two molecules. This means that photosensitizers can form dimers and/or
larger aggregates in aqueous media, which reduces their photoactivity due to self-quenching of
the excited state (Nishiyama et al. 2009). Therefore, considerable efforts have been directed at
the design of delivery systems that can incorporate photosensitizers in monomeric form without
decreasing their activity and without toxic effects (see further discussion on section 1.7).
1.7. Nanoparticles as tool for increase bioavailability of PS
The use of several nanoparticles, including liposomes, dendrimers, polymeric
nanoparticles, polymeric micelles, and hydrogel nanoparticles (Figure 1.9) has been a strategy
for overcoming some of the afore-mentioned problems. The main advantages that these types
of systems offer are: (i) protection of PS from premature degradation, (ii) increased PS
solubility and circulation time in the bloodstream, (iii) improved intracellular penetration, (iv)

Chapter 1: Introduction and Objectives _______________________________
48
good biodegradability and biocompatibility, (v) improvement of intrinsic efficiency and (vi)
controlled delivery of PS (Garapati et al. 2015; Jia and Jia 2012).
Figure 1.9. Examples of nanocarriers. Adapted from open access of Frontiers in
Chemistry (Conniot et al. 2014).
One example of a nanoformulation already commercially available is the liposomal
formulation of Foscan (Foslip®) which consist in 5,10,15,20-tetra(m-5,10,15,20-
tetra(mhydroxyphenyl) chlorin (mTHPC or Foscan) loaded into dipalmitoyl
phosphatidylcholine/dipalmitoyl phosphatidylglycerol (DPPC/DPPG) liposomes, in a ratio of
9:1 (Buchholz et al. 2005). This liposomal formulation (Foslip®) presents a higher efficacy,
reduced damage of healthy tissue and lower toxicity in the absence of light compared to the
non-formulated Foscan® (Kiesslich et al. 2007; Lassalle et al. 2009). Another example of a
liposomal formulation of a photosensitizer used in PDT is verteporfin (Visudyne®), the first
photodynamic drug approved for the treatment of age related macular degeneration (Paszko et
al. 2011). The liposomes of Visudyne® are composed of unsaturated egg phosphatidyl glycerol
(EPG) and dimyristoyl phosphatidyl choline (DMPC) in a 3:5 molar ratio and are clinically
used to reduce the risk of vision loss (Chang and Yeh 2012).
Our group also has previous examples for nanoparticles produced with phenothiazines or
porphyrins (Tada et al. 2014; Tada and Baptista 2015; Tada et al. 2007; Rossi et al. 2008; Tada
et al. 2010). For instance, in 2008 Rossi et al. proposed a nanoparticle-carrier based on silica
for the photosensitizer Protoporphyrin (PpIX), aiming at an application in PDT (Rossi et al.
2008). As a result, PpIX loaded silica particles have been shown to have an efficiency of singlet
oxygen generation, much higher than free PpIX. This was attributed to changes of the

_______________________________ Chapter 1: Introduction and Objectives
49
monomer-dimer equilibrium due to photosensitizer immobilization in the silica nanoparticles
(Rossi et al. 2008). In 2010, Tada and co-workers demonstrated that nanoparticles can be used
as a tool to modulate the generation of singlet oxygen and to protect the PS from medium
interferences (Tada et al. 2010). This type of modulation was based on the thionin and
methylene blue at different ratios of dimer to monomer into silica nanoparticles. As a
consequence, nanoparticles with an excess of dimer have a lower singlet oxygen generation
efficiency than those without dimer formation (Tada et al. 2010). Both examples denote the
importance of dimer/monomer ratio as a parameter that must be considered in the controlled
rational design of nanoparticles to photosensitizers.
Also physicochemical properties of nanoparticles such as size, surface charge, shape,
hydrophobicity, surface chemistry can influence the interaction and uptake by cells (Frohlich
2012). The nanoparticles size strongly influences the cellular uptake mechanism, dictating their
ultimate intracellular fate and thus overall biological effect. Usually, nanoparticles with larger
diameters (> 0.5µm) tend to be taken up via macropinocytosis and/or phagocytosis by specific
cells, such as macrophages, while smaller nanoparticles (< 150nm) usually enter the cell
through endocytosis via classic receptor-mediated endocytosis (clathrin-dependent) or
caveolae-mediated endocytosis (Conniot et al. 2014). The nanoparticles surface charge also
seems to play an important role in their particle internalization. In general, positively charged
molecules/systems will show a high affinity to the cell membrane due to its negative charge.
On the other hand, after cellular uptake, it has been observed that negatively charged or neutral
nanoparticles tend to localize within lysosomes, whilst positively charged nanoparticles showed
the ability to escape from these (Murugan et al. 2015). These physicochemical properties
modulated by the molecular structures can govern the characteristics of nanoparticles (e.g.
hydrophobic and charge) in such a way that manipulating these pertinent nanoparticles

Chapter 1: Introduction and Objectives _______________________________
50
characteristics may facilitate PDT applications of nanoparticles at specific target sites (Murugan
et al. 2015; Conniot et al. 2014).
Recently, polymeric micelles have been especially recognized as a promising system for
a photosensitizer carrier (Avci, Sibel Erdem, and Hamblin 2014). Block copolymers with
amphiphilic character generally are defined as macromolecules with a large solubility
difference between the hydrophilic and hydrophobic segments (see Figure 1.10). This
immiscibility results in their self-assembled structure, spontaneously forming polymeric
micelles (Karayianni and Pispas 2016). Then, polymeric micelles have a core-shell structure in
which the inner core accommodates hydrophobic drugs, improving solubility and stability in
the biological system, while hydrophilic segment provide the compatibility of the micelles in
the aqueous environment (Figure 1.10) and protect the loaded drugs from interaction with blood
components (Biswas et al. 2016).
Figure 1.10. Polymeric micelles as intelligent nanocarriers. Reprinted with permission
from Elsevier (Nishiyama and Kataoka 2006).
Several amphiphilic copolymers including di-block (A–B) or triblock (A–B–A) have
been used to form micelles. The most common hydrophilic block in the copolymeric structure

_______________________________ Chapter 1: Introduction and Objectives
51
is poly(ethylene glycol) (PEG). The PEG end blocks are well characterized and known to be
non-toxic, electrically neutral, biodegradable and a flexible polymer that has commonly been
used to coat nanoparticles. PEG also provides low interaction of the nanocarrier-surface with
serum components (e.g. proteins) prolonging their circulation time and making it attractive for
in vivo applications (Biswas et al. 2016; Nardin, Bolikal, and Kohn 2004). There are various
polymer blocks used to form the inner cores of micelles such as polyethers (e.g. poly(propylene
oxide) (PPO)), polyesters (e.g. poly(L-lactide) (PLA)) and polyamino acids (e.g. poly(L-
histidine) (pHis)). As example, Li and coworkers described a formulation of protoporphyrin XI
(PpIX) with MePEG500-b-PCL4100 (methoxy poly (ethylene glycol)-b-poly-caprolactone)
diblock copolymer, able to keep the subcellular localization (in or around the plasma
membrane) and increase the cellular uptake (around two-fold magnitude) and the phototoxicity
(one order of magnitude using 18 J/cm2) in RIF-cells when compared to free PpIX (Li et al.
2007). Another example of better results in PDT by using polymeric micelles was reported by
Knop et al. who showed that the pheophorbide-a incorporated in poly(ethyleneoxide-b-ɛ-
caprolactone) micelles was able to efficiently generate singlet oxygen in the medium and also
showing an enhanced photocytotoxicity (ca 2-fold) and cellular uptake compared to free
pheophorbide-a. They explain this by to the incorporation of unaggregated monomeric
molecules of the PS in the polymeric micelles, i.e. 200 molecules of polymer and 4 molecules
of monomeric pheophorbide-a per nanostructure (Knop et al. 2009). These examples suggest
that formulation of photosensitizers with polymeric micelles may allow a higher PDT efficiency
that can be achieved at a reduced dose of photosensitizer and light.
Using amino acids as hydrophobic core has the advantage of biocompatibility and
biodegradability, due to the use of naturally occurring amino acids (Biswas et al. 2016). Kohn´s
group has demonstrated the applicability of an amphiphilic triblock copolymer (ABA-type)
made of poly(ethylene glycol) and oligomers of desaminotyrosyl-tyrosine esters in the
Chapter 1: Introduction and Objectives _______________________________
52
treatment of skin diseases such as psoriasis (Zhang et al. 2013a). This type of triblock
copolymer forms a nanoparticle family that is fully-degradable and nontoxic in vitro and in vivo
(Larisa Sheihet et al. 2012; Nardin, Bolikal, and Kohn 2004). These tyrosine-derived
nanospheres (Tyrospheres) provide a hydrophobic core, a naturally compatible environment for
loading hydrophobic compounds together with hydrophilic shells (PEG) that stabilizes the
nanospheres. Further details about Tyrospheres are provided in the introduction of Chapter 4.
1.8. OBJECTIVES
The overall goal of this thesis is to uncover mechanisms to improve the PDT efficiency
by causing specific damage and controlled cell death. The specific objectives cited bellow will
be discussed in three different chapters:
❖ Chapter 2 – Membrane interaction of amphiphilic photosensitizers: Investigate the
interaction and photoactivity of several amphiphilic photosensitizers with membranes model in
order to figure out which molecular features can improve PS uptake;
❖ Chapter 3 – Modulating PDT efficiency by the charge of the photosensitizer: Study the
effect of two photosensitizers with similar structure but opposite charges in the intracellular
localization, mode of cell death and phototoxicity aiming understand which subcellular target
can provide enhanced phototoxicity with minimum PDT-dose;
❖ Chapter 4 – Enhanced PDT efficiency provided by tyrosine-derived nanospheres:
Evaluate if tyrosine-derived nanospheres can improve solubility and bioavailability of PS as
well the PDT efficiency in cells.
CHAPTER 2
MEMBRANE INTERACTION OF AMPHIPHILIC
PHOTOSENSITIZERS
The level of interaction between photosensitizers and
membranes was evaluated by binding and photoactivity
assays using different membrane mimic systems, which
were small unilamellar liposomes and giant unilamellar
vesicles and erythrocytes from human blood. Our results
give insights about the structure-photoactivity
relationship allowing the choice of two PS with better
interaction and stronger photoactivity in terms of
membrane damage to continue studies in eukaryotic
cells.*
* Part of the work presented in this chapter is derived from submitted paper to Scientific
Reports. “Enhanced efficiency of cell death by lysosome-specific photodamage.” Tayana M.
Tsubone, Waleska K. Martins, Christiane Pavani, Helena C. Junqueira, Rosangela Itri and
Maurício S. Baptista.
This work was presented as poster on 37ª Reunião Anual da Sociedade Brasileira de
Química in May 2014 at Natal – Brazil and in 16th International Congress on Photobiology
in September 2014 at Cordoba - Argentina.


_____________Chapter 2: Membrane interaction of amphiphilic photosensitizers
55
2. MEMBRANE INTERACTION OF AMPHIPHILIC
PHOTOSENSITIZERS
2.1. INTRODUCTION
Membranes exhibit an important role in organisms, mainly organizing tissues, cells and
organelles. In the case of cell membranes, the role of the cytoplasmic membrane is maintaining
the physical integrity of the cell and controlling the movement of molecules and/or ions into
and out of cells. Consequently, recognition, binding, and permeation of molecules are a
fundamental research topic in terms of new drugs design. In PDT, the role of membrane binding
of photosensitizers (PS) is crucial to the extension of photo-induced damage and consequently
to the efficiency of cell death (Pavani, Iamamoto, and Baptista 2012; Bacellar et al. 2014;
Oliveira et al. 2011). Because the lifetime of 1O2 is short and its diffusion distance is limited, a
PS localization strategically close to the target is always desirable (Robert W Redmond and
Kochevar 2006).
In this regard, new photosensitizers have been developed in the search of more efficient
compounds for photodynamic therapy (PDT). Many structural changes have been made in the
chromophore and the peripheral groups, trying to improve the efficiency of reactive species
generation by light and improving the proximity to targets such as cellular membranes and/or
organelle membrane (Uchoa, Oliveira, and Baptista 2010; Uchoa et al. 2011; Gerola, Tsubone,
et al. 2011; F. Ricchelli 1995). Many studies on the interaction of photosensitizers with cells or
organisms indicate that the degree of hydrophobicity, the type and number of charges and the
degree of structural asymmetry in a molecule, plays an important role in the PS-membrane
interaction, intracellular localization and cell-killing efficiency (Mojzisova et al. 2009; Ana P.
Castano, Demidova, and Hamblin 2004).
Engelmann and collaborators reported a detailed study comparing the efficiency of a
series of porphyrins in photodamaging erythrocyte membranes and demonstrated that

Chapter 2: Membrane interaction of amphiphilic photosensitizers_____________
56
amphiphilic molecules are able to penetrate deeply in membranes and increase the
photodynamic efficiency (Figure 2.1) (Fabio M. Engelmann et al. 2007). In fact, Cordeiro et al.
confirmed this hypothesis by molecular dynamic simulations (Cordeiro, Miotto, and Baptista
2012). They showed that the accessibility of the photosensitizer to the membrane interior rich
in oxygen was correlated with membrane interaction and photodynamic efficiency (Cordeiro,
Miotto, and Baptista 2012).
Figure 2.1. Scheme showing the probable disposition in biological membranes of
porphyrins with the different number of charges and symmetry. P2c: meso-di-cis(4-N-methyl-
pyridyl)diphenylporphyrin, P2t: meso-trans-cis(4-N-methyl-pyridyl)diphenylporphyrin,
P3: meso-tri(4-N-methyl-pyridyl)monophenylporphyrin, P4: meso-tetra(4-N-methyl-
pyridyl)porphyrin. Reprinted by permission from Springer (Fabio M. Engelmann et al. 2007).
Based on this premise, herein we worked with four amphiphilic compounds (Figure 2.2)
with different charges and peripheral groups in order to understand their influence on the
membrane interaction and the consequences on photo-induced damage. In this study the effect
of opposite charges and different substituent groups is investigated. Firstly, we synthesized a
porphyrin derivative from Protoporphyrin IX (PpIX) whose carboxylic groups from positions
133 and 173 were modified to a quaternary ammonium compound (PpNetNI), generating an
amphiphilic structure with positive charges to facilitate the interaction with the membrane
(Uchoa, Oliveira, and Baptista 2010). In addition to the synthesized porphyrin (PpNetNI), three
other commercial amphiphilic photosensitizers were included in the study (CisDiMPyP, TPPS2a

_____________Chapter 2: Membrane interaction of amphiphilic photosensitizers
57
and AlClPcS2a) in such way that we compare the different peripherical groups from two positive
amphiphilic porphyrins and two negative amphiphilic compounds (Figure 2.2).
Figure 2.2. Molecular structure of the amphiphilic photosensitizers studied in this work
(PpNetNI, CisDiMPyP, TPPS2a e AlPcS2a).
2.2.METHODOLOGY
2.2.1. Synthesis of PpNetNI
The functionalization of PpIX was performed in three steps. Firstly, 200mg PpIX were
refluxed under a dry argon atmosphere with an excess of freshly-distilled thionyl chloride
(2 mL). The system was refluxed during 1 hour, the solvent and the excess of thionyl chloride
were removed by suction at reduced pressure. Second, the purple residue formed was cooled to
0ºC under an argon atmosphere and stirred with an excess of nucleophilic compound (N,N-
dimethylethylamine). The system was stirred for 12 hours and the solvent was removed by
suction at reduced pressure. Then, the product was purified by column chromatography using
silica as stationary phase and dichloromethane/methanol = 20:1 (v/v) as mobile phase. In a third
step, the quaternization of PpNetNA was carried out in dichloromethane using methyl iodide.
Purification was accomplished by crystallization in dichloromethane/methanol (Uchoa,
Oliveira, and Baptista 2010).

Chapter 2: Membrane interaction of amphiphilic photosensitizers_____________
58
2.2.2. Photophysical properties
Absorption spectra were registered using a Shimadzu UV-2400-PC spectrophotometer.
Molar absorptivity values (ε) were determined in methanol by plotting the absorption in the
maximum wavelength (λmax) as a function of PS concentration and applying Lambert-Beer’s
law. Fluorescence spectra were recorded with a Varian Cary Eclipse spectrofluorimeter
(excitation at 515 nm, slits: 5 nm on excitation and 10 nm on emission). The fluorescence
quantum yields (ϕf) of the photosensitizers in methanol were calculated by measuring the area
under emission spectrum, using TPPS4 in methanol (ϕf = 0.16) as standard for the porphyrins
and Methylene blue in methanol (ϕf = 0.03) as standard for phthalocyanine (Basu 1991;
Olmsted 1979). Absorbance values of samples and reference solutions were kept below 0.1 at
the excitation wavelength, in order to avoid inner filter effects. The singlet oxygen production
quantum yield (ϕ∆) of the photosensitizers in methanol was determined using an Edinburgh
Analytical Instruments time resolved NIR fluorimeter equipped with a Hamamatsu R55009
photomultiplier cooled by liquid nitrogen (-80ºC), using the F900 6.8.12 acquisition software
(Edinburg Instruments). A Continuum Surelite III Nd:YAG laser (wavelength: 532 nm; pulse
duration: 5 ns; pulse frequency: 10 Hz, Q-switch 240 ns) was used to excite a dye laser with (2-
{2-[4-(dimethylamino)phenyl]ethenyl}-6-methyl-4H-pyran-4-yl-idene)propanedinitrile in
ethanol emitting at 640 nm (Continuum Jaguar). TPPS4 in methanol (ϕ∆ = 0.69) was used as
standard for the porphyrins and Methylene blue (ϕ∆ = 0.50) was used as standard for the
phthalocyanines (R W Redmond and Gamlin 1999). All samples had an absorbance of ~0.3 at
640 nm, in order to equalize the number of absorbed photons. ϕ∆ values were calculated using
the equation 2.1.
𝜙𝛥𝑃𝑆 =
𝐼𝑃𝑆
𝐼𝑆𝑡𝑑 . 𝜙𝛥
𝑆𝑡𝑑 Equation 2.1

_____________Chapter 2: Membrane interaction of amphiphilic photosensitizers
59
I is the maximum phosphorescence intensity of the singlet oxygen decay curve and ϕΔ is
the singlet oxygen quantum yield. Symbols as subscript refer to the standard (Std) and
photosensitizer (PS).
2.2.3. PS binding to membranes
2.2.3.1. Binding constant (Kb)
Liposome suspensions were prepared with 20% cardiolipin (heart-disodium salt, CL) and
80% 1,2-distearoylsn-glycero-3-phosphocholine (DSPC). 6.3 mg (8 μmols) DSPC and 3 mg
(2 μmols) CL were dissolved in chloroform, which was evaporated under argon flux, producing
a film. Next, 2 mL of 5 mM Tris/HCl buffer solution (pH 7.4) was used for hydration and the
system was vortexed for 5 minutes. Heavier liposomes were isolated by three consecutive
cycles of sedimentation (centrifugation at 13500 rpm for 10 min, 25ºC). The supernatant
(containing smaller vesicles) was discarded and the pellet was re-suspended with an equivalent
volume of buffer solution. After repeating this procedure three times, the final lipid
concentration was determined by the molybdate method (Rouser, Fleischer, and Yamamoto
1970). The phospholipid concentration in this solution was 0.1 mM. These suspensions were
incubated with the photosensitizers (~7 µM) for 1 hour followed by a further centrifugation step
to separate the aqueous fraction, containing free PS and the liposomal fraction containing bound
PS (Fabio M. Engelmann et al. 2007). The concentrations of free and bound porphyrins were
determined by measuring the absorption spectra of the supernatant solution and the liposomes
resuspension. The PS binding constants (Kb) to membranes were calculated as described in
Engelmann et al (Fabio M. Engelmann et al. 2007).
2.2.3.2. PS binding percentage to lecithin vesicles
30 mg of soy lecithin was dissolved in chloroform, dried in argon flux and the film was
hydrated with 5 mM Tris/HCl buffer (pH 7.4). The cycles of sedimentation already described

Chapter 2: Membrane interaction of amphiphilic photosensitizers_____________
60
above were performed to obtain the liposome resuspension. Liposomes were incubated in the
presence of photosensitizers (~7 µM) for 15 minutes followed by centrifugation to separate the
aqueous fraction containing free PS from the liposomal fraction containing bound PS. The
absorption spectrum of the supernatant solution and the liposome resuspension were recorded
and Equation 2.2. was used to calculate binding percentage.
% 𝐵𝑖𝑛𝑑𝑖𝑛𝑔 = 100 𝐴𝑏𝑠𝑡−𝐴𝑏𝑠𝑠
𝐴𝑏𝑠𝑡 Equation 2.2
where Abst is the absorbance of photosensitizer in the liposome-free solution (total
amount of photosensitizer) and Abss is absorbance of PS solution in the supernatant (free-
photosensitizer).
2.2.3.3. Binding percentage of photosensitizers in erythrocytes
5 mL of human blood were aspirated in a syringe containing ~ 4 drops of sodium citrate
solution (0.13 M) in phosphate buffer (pH 7.4) to prevent blood coagulation. The blood was
centrifuged at 3000 rpm for 10 minutes at 25°C. Then, the supernatant was discarded and the
pellet was re-suspended with the same volume of phosphate buffered saline (PBS – pH 7.4).
This procedure was repeated three times to isolate erythrocytes and remove proteins, white
blood cells, platelets and coagulation factors (such as Ca2+) (Fabio M. Engelmann et al. 2007).
Erythrocytes (~1x10⁷ erythrocytes/mL) were incubated with the photosensitizers (7 µM) for
20 minutes followed by centrifugation (3000 rpm, 10 minutes at 25°C) to separate the aqueous
fraction containing free photosensitizer from the erythrocytes containing bound
photosensitizers (Fabio M. Engelmann et al. 2007). Since the presence of the heme group in
erythrocytes presents an absorbance spectrum similar to our porphyrins, but shows no
fluorescence emission, we used the fluorescence spectrum to calculate the difference between
free and bound PS using Equation 2.3.

_____________Chapter 2: Membrane interaction of amphiphilic photosensitizers
61
% Binding = 100 Ft-Fs
Ft Equation 2.3
where Ft is fluorescence spectrum area of photosensitizer solution pre-interaction with
erythrocytes (total amount of photosensitizer) and Fs is fluorescence spectrum area of
photosensitizer solution in the supernatant (free-photosensitizer).
2.2.4. Photoactivity of photosensitizers in membranes
2.2.4.1. Erythrocytes
The centrifugation process was performed three times to isolate erythrocytes as described
above in Binding percentage of photosensitizers in erythrocytes.(Fabio M. Engelmann et al.
2007) The final erythrocyte pellet was re-suspended in phosphate buffered saline (PBS –
pH 7.4), and then diluted with PBS buffer to reach a scattering intensity of ~ 1.0 in 650 nm.
Erythrocytes in the absence and presence of photosensitizers (7 µM) were irradiated using a
light emitting diode system (LED), with the maximum emission wavelength at 522 nm ± 20 nm
(wavelength ± spectral width) to porphyrins and 633 nm ± 20 nm to phthalocyanine whose final
light dose was 2.1 J/cm2. The decrease in the suspension light scattering was monitored at
650 nm as a function of the time using an Infinite M200 plate reader.
2.2.4.2.Giant unilamelar vesicles (GUVs)
GUVs of 1,2-dioleoyl-sn-glycero-3-phosphocoline (DOPC) were prepared by using the
electroformation method.(Angelova and Dimitrov 1986) For this, 10 µL of a 2.5 mM lipid
solution (DOPC) in chloroform were spread onto the surfaces of two conductive slides coated
with Fluor Tin Oxide. The slides were placed spaced apart in a Teflon frame with their
conductive sides facing each other. The chamber was filled with 0.2 M sucrose aqueous solution
and connected to a sine wave generator at 2 V and 10 Hz for 2 hours. After this period the
dispersion of GUVs was collected and diluted 15-fold in a 0.2 M glucose solution according to
the previous procedure (Mertins et al. 2014; Caetano et al. 2007).

Chapter 2: Membrane interaction of amphiphilic photosensitizers_____________
62
GUVs were observed by phase contrast microscopy (inverted microscope Axiovert 200,
Carl Zeiss) in the absence and presence of photosensitizers (0.7 µM) under constant irradiation.
The observation of GUVs was performed using Ph2 63x objective and the images were
registered with an Axiocam HSm digital camera (Carl Zeiss). The irradiation of the samples
was performed using the Zeiss Filter Set 05 (excitation BP 395-440 nm, 460nm beam splitter
mirror FT, 470nm emission long-pass filter, 135 µW/cm2) for porphyrins and the Zeiss Filter
Set 32 (excitation BP 665/45 nm, beam splitter FT 695nm, emission BP 725/50nm,
135 µW/cm2) for phthalocyanine. The effects induced by PS photoirradiation of the GUV were
fading of the optical contrast. This was quantified by taking into account the changes in the
brightness intensity using the Image J software ((Mertins et al. 2014).
2.3. RESULTS AND DISCUSSION
2.3.1. Synthesis and characterization of PpNetNI
PpNetNI was synthesized by functionalization of carboxylic groups at positions 133 and
173 from Protoporphyrin IX (PpIX), the synthetic route is illustrated in Figure 2.3. As the first
step the carbonylic groups of PpIX were transformed to acyl chloride as shown in Figure 2.3.
In a second step, the reaction between chloride and N,N- dimethylethylamine generated amine
groups (PpNetNA in Figure 2.3), whose the quaternization using methyl iodide resulted on the
quaternary ammonium compound (PpNetNI in Figure 2.3).

_____________Chapter 2: Membrane interaction of amphiphilic photosensitizers
63
Figure 2.3. Synthetic route to the production of PpNetNI. Reprinted and adapted with
permission from (Uchoa, Oliveira, and Baptista 2010).
The characterization of PpNetNI was performed by elemental analysis, mass
spectrometry and 1H NMR. The results of the elemental analysis confirmed PpNetNI as final
product (Table 2.1). Note that the difference between the experimental values and theoretical
values were less than 2% indicating a satisfactory result (Table 2.1).
Eletrospray ionization mass spectrometry (ESI-MS) showed five main peaks: a higher
peak at m/z 366.24 followed by four other isotopic peaks with Δm/z 0.5 (Figure 2.4). The
number of isotope peaks and the relative intensity of each peak depends on the chemical
formula of the ionic fragment and the natural isotopic composition of its constituting elements.
The highest peak corresponds to isotopes with the lowest mass numbers that predominate in the
nature (i.e. 12C, 1H, 14N and 16O) and represent our base peak (or 100.0% of 12C441H60
14N816O2
with mass = 732.48 and charge = +2). The next intensive peak is at m/z 366.74 which represents
51.7% isotopes which can be attributed to the isotope of carbon (i.e. 13C112C 43
1H6014N8
16O2),
hydrogen (i.e. 12C442H1
1H5914N8
16O2), nitrogen (i.e. 12C441H60
15N114N7
16O2) and/or oxygen (i.e.
12C441H60
14N817O16O). The peak at m/z 367.24 correspond to 12.0% of isotopes and may be
contributed by oxygen (i.e. 12C441H60
14N818O16O). The last two peaks have a negligibly low
intensity (m/z 367.74 is 2.1% and m/z 368.24 is 1.9%) because of the extremely low probability
of occurrence.

Chapter 2: Membrane interaction of amphiphilic photosensitizers_____________
64
Table 2.1. Elemental analysis data of carbon, hydrogen and nitrogen.
Compound % C
Exp (calc)
% H
Exp (calc)
% N
Exp (calc)
PpNetNI 48.95 (50.43) 5.97 (5.83) 11.59 (10.46)
Figure 2.4. Mass spectrometry of PpNetNI.
The nuclear magnetic resonance of proton (1H NMR) identified the signals of the
synthesized compound, also confirming the production of PpNetNI (the 1H NMR spectrum is
showed in Appendix I). The two intense singlet signals at 1.68 ppm and 1.70 ppm (Figure 2.5A)
were attributed to hydrogens 1, 2, 3 and 1’, 2’, 3’ of quaternary ammonium. Also, two triplets
at 1.91 ppm and 1.88 ppm of hydrogens 4 and 4’ next to quaternary ammonium (Figure 2.5A)
were observed. The triplet signal at 4.51 ppm represent hydrogens 5 and 5’ (Figure 2.5C). The
four signals from a singlet localized at 3.76 ppm, 3.74 ppm, 3.72 ppm and 3.70 ppm correspond

_____________Chapter 2: Membrane interaction of amphiphilic photosensitizers
65
to hydrogens e, f, g and h of methyl next to the porphyrin chromophore (Figure 2.5D).
Hydrogens i and j from the vinyl groups cause 4 signals, a dublet of dublets, at 6.40 ppm,
6.36 ppm, 6.20 ppm and 6.17 ppm (Figure 2.5E). Hydrogens of meso positions (a, b, c and d)
were detected as singlet signal at 10.34 ppm, 10.28 ppm, 10.25 ppm and 10.22 ppm (Figure
2.5B).
Figure 2.5. NMR 1H spectrum of PpNetNI in MeOD. Chemical shift range of
(A) 1.6 – 2.0 ppm, (B) 10.10 – 10.40 ppm, (C) 4.20 – 4.65 ppm, (D) 3.60 – 3.85 ppm and (E)
6.10 – 6.45 ppm.
The reaction yield was around 84% (0.21g of PpNetNI), which is similar to that found by
Uchoa et al. (Uchoa, Oliveira, and Baptista 2010).

Chapter 2: Membrane interaction of amphiphilic photosensitizers_____________
66
2.3.2. Spectroscopy and photophysical studies
All four PS exhibit typical photophysical properties, as expected from these class of
compounds. PpNetNI, CisDiMPyP and TPPS2a have absorption spectra typical for free-base
porphyrins (Figure 2.6.A), exhibiting a high intensity band known as Soret band, which results
from transitions of the fundamental state to the second excited state (S0 – S2) and four (less
intense) Q bands, which are caused by transitions from the fundamental state to the first excited
state (S0 – S1) – (Bajema, Gouterman, and Meyer 1968). Unlike porphyrins, the spectrum of the
phthalocyanine (AlClPcS2a) has a higher intensity of the Q band (Figure 2.6.A) that represents
a transition from the fundamental state to the first excited state (S0 – S1) - (Bajema, Gouterman,
and Meyer 1968). Values of the absorption maxima and molar absorption coefficients (ɛ) are
presented in Table 2.2.
Figure 2.6. (A) Electronic absorption spectra of photosensitizers in methanol. PS
concentrations: 9.5 µM PpNetNI, 5 µM AlPcS2a, 8 µM CisDiMPyP, 5 µM TPPS2a. (B)
Fluorescence emission spectra of photosensitizers in methanol. (λexc = 502 nm for PpNetNI,
λexc = 603 nm for AlClPcS2a, λexc = 513 nm for CisDiMPyP and TPPS2a).
The fluorescence emission spectra of the photosensitizers (Figure 2.6B) show two
emission bands, which corresponds to transitions of the excited state to ground state. All
porphyrins have very similar fluorescence spectra with small fluorescence quantum yields
(ϕf < 0.15 - Table 2.2) indicating that fluorescence is not the main decay process of these
molecules. On the other hand, the phthalocyanine shows values of ϕf, which are two times

_____________Chapter 2: Membrane interaction of amphiphilic photosensitizers
67
greater than those of the porphyrins (ϕf < 0.24 - Table 2.2). This is due to higher rigidity of the
phthalocyanine molecular structure compared with the molecular structure of porphyrins
(Joseph R. Lakowicz 2006).
Table 2.2. Molar absorptivity values (ε) in the maximum absorption wavelength (λmax),
emission bands, fluorescence (ϕf) and singlet oxygen quantum yields (ϕ∆) of each
photosensitizer.
PS Absorption λmax/nm (ε/103 M-1cm-1) Emission λ/nm ϕf * ϕ∆
** Soret QIV QIII QII QI QI QII
PpNetNI a 399
(120)
502
(10)
536
(7.5)
572
(4.5)
627
(3.2)
628 695 0.12 ± 0.04 0.72 ± 0.04
CisDiMPyP a 422
(171)
517
(14)
554
(7.3)
590
(6.0)
646
(2.5)
658 717 0.11 ± 0.03 0.74 ± 0.09
TPPS2a a 413
(450)
511
(17)
545
(7.5)
588
(4.2)
645
(3.5)
652 714 0.13 ± 0.03 0.71 ± 0.05
AlPcS2a b 350
(55)
----- 603
(30)
----- 670
(188)
645 712 0.24 ± 0.05 0.40 ± 0.02
**λexc = 640 nm e λem = 1270 nm. *Porphyrins: λexc = 513 nm; emission > 600nm, Slits: 5 nm on
excitation and 10 nm on emission, methanol solutions; Phthalocyanine: λexc = 603 nm, Slits: 2.5 nm on
excitation and 5 nm on emission. aStandard used was TPPS4 ϕ∆ = 0.69 (R W Redmond and Gamlin 1999)
and TPPS4 ϕf = 0.16 (Basu 1991). bStandard used was MB ϕΔ = 0.50 (R W Redmond and Gamlin 1999)
and ϕf = 0.03 (Olmsted 1979).
While the fluorescence quantum yields (ϕf) of the porphyrins are low, the singlet oxygen
quantum yields are very high. In fact, all these tested porphyrins are very efficient generators
of 1O2 (ϕ∆ ~ 0.7), demonstrating that the different peripheral groups do not significantly affect
their photophysical properties (Table 2.2). However, the AlClPcS2a does not generate 1O2 as
efficient as the porphyrins (ϕ∆ = 0.4 - Table 2.2). Note that the consequence of the higher
absorption in red region of phtalocyanines is that the radiative lifetimes of the lowest excited
singlet states are shorter, which means higher fluorescence quantum yields (ϕF) and shorter
excited singlet-lifetimes. This situation results in lower quantum yields for formation of the
excited triplet state (ϕT) and consequently lower 1O2 generation (Darwent et al. 1982).
In summary, the photophysical data indicates that porphyrins have high extinction
coefficients; low fluorescence quantum yields and are efficient generators of 1O2. On the other
hand, phthalocyanine has a lower 1O2 generation and a higher fluorescence quantum yield.

Chapter 2: Membrane interaction of amphiphilic photosensitizers_____________
68
These results are in agreement with other literature reports that show that porphyrins with a
high absorption intensity in the Soret band, exhibit lower fluorescence quantum yields (Seybold
and Gouterman 1969) and a high efficiency of 1O2 generation (R W Redmond and Gamlin
1999; Wilkinson, Helman, and Ross 1993). The phthalocyanines with a high absoprtion in the
Q band have higher values of fluorescence quantum yields (Ogunsipe, Maree, and Nyokong
2003; Ambroz et al. 1991) and a lower generation of 1O2 (R W Redmond and Gamlin 1999;
Wilkinson, Helman, and Ross 1993).
2.3.3. Evaluation of photosensitizer affinity to membranes
The interaction of drugs with cells occurs by the initial binding of the drug to the
cytoplasmic membrane as well as by their ability to enter and permeate membranes. Thus, it is
important to understand the photosensitizer-membrane interaction. Moreover, the level of
interaction of a photosensitizer with membranes has a fundamental role in the extension of
photo-induced damage and consequently, on the cell-killing efficiency (Fernanda Ricchelli et
al. 2005; Bacellar et al. 2014; Pavani, Iamamoto, and Baptista 2012; Gerola, Santana, et al.
2011). Therefore, we evaluate the interaction level of PS to membranes using three different
systems: vesicles containing DSPC/CL (8:2), soy-lecithin liposomes and erythrocyte
membranes (Figure 2.7).

_____________Chapter 2: Membrane interaction of amphiphilic photosensitizers
69
DSPC/CL0
20
40
60
80
100
*** *****
*
Kb/1
06M
-1
Soy lecithin0
20
40
60
80
*** ******
***
***
% B
ind
ing
Erythrocyte0
40
80
120
*** ******
***
***
% B
ind
ing
PpNetNI CisDiMPyP TPPS2a AlClPcS2a
A B C
Figure 2.7. (A) Binding constant (Kb) to DSPC/CL vesicles (8 µmol of DSPC and 2 µmol
CL in 2mL of 5 mM Tris buffer at pH 7.4). (B) Percentage of binding to soy lecithin vesicles
(0.12 mM soy lecithin in 5 mM Tris buffer at pH 7.4), (C) Percentage of binding to erythrocytes
(1x10⁷ erythrocytes/mm3 in PBS pH 7.4). [Photosensitizer] = 7 µM. Bars represent the
mean ± SD (*p<0.05, **p<0.03 and ***p<0.001).
Although all photosensitizers exhibit amphiphilic characteristics, note that AlPcS2a and
PpNetNI have a lower binding to membranes than TPPS2a and CisDiMPyP (Figure 2.7). In the
case of phthalocyanine (AlPcS2a) the smaller incorporation in the membrane is probably due
the higher rigidity, molecular size and to the aluminum coordinated at the center of the molecule
providing larger volume and polarity. As for AlPcS2a, the interaction level of PpNetNI with
membranes was small compared to other photosensitizers (Figure 2.7). The design of PpNetNI
was made to include an amphiphilic character and positive charges on molecule. According to
the literature, these factors should increase the binding to membranes (Uchoa, Oliveira, and
Baptista 2010; Fabio M. Engelmann et al. 2007). However, the binding value of PpNetNI was
even lower than that of TPPS2a, a negatively charged molecule. It is noteworthy that under our
experimental conditions (Tris buffer 5mM pH 7.4) the absorption spectrum indicated
aggregation of PpNetNI (Figure 2.8), such as an increased baseline, band broadening, an
intensity decrease and wavelength shift of the Soret band to blue region (from 399 nm to
378 nm), which is typical for type-H porphyrins aggregates (Maiti, Mazumdar, and Periasamy
1998). These aggregates probably decrease the membrane interaction level.

Chapter 2: Membrane interaction of amphiphilic photosensitizers_____________
70
Figure 2.8. Absorption spectrum of photosensitizers (7 µM) in Tris buffer 5 mM (pH 7.4).
TPPS2a and CisDiMPyP are of similar molecular structure, their affinity to membranes is
larger than AlPcS2a and PpNetNI. This is because the phenyl peripheral hydrophobic groups
have a lesser rigidity than the peripheral groups of AlPcS2a and furthermore provide steric
barriers to avoid chromophore π-π stacking (i.e. type-H aggregation) – in contrast to PpNetNI.
Note also that the positively charged CisDiMPyP exhibits a stronger interaction with
membranes than the negatively charged TPPS2a (Figure 2.7). This is because membranes have
a net negative charge, favoring the electrostatic interaction with CisDiMPyP. Although TPPS2a
contains two negatively charged groups, it also has a considerable interaction with membranes
(larger than AlPcS2a and PpNetNI), indicating that both hydrophobic and dipolar interactions
play an important role in defining the affinity of these molecules to membranes.
All data together (Figure 2.7) demonstrates that the interaction level between
photosensitizer and membrane has the same tendency for three different systems, in such way
that the decreasing order is: CisDiMPyP > TPPS2a > AlPcS2a ≥ PpNetNI.
2.3.4. Photoactivity of photosensitizers in membranes
In order to investigate, if the level of interaction would affect the ability to induce
membrane damage and permeability by photosensitization, the photodynamic efficiency of the

_____________Chapter 2: Membrane interaction of amphiphilic photosensitizers
71
photosensitizers was evaluated in terms of photodamage to the membranes using two different
systems: erythrocytes and giant unilamellar vesicles (GUVs).
The erythrocyte membrane integrity was evaluated by measuring the intensity of light
scattering in the cell suspension. The decrease of the scattering indicates membrane disruption
and equilibration of refractive index between the inner and outer compartments of the
erythrocyte cell. This allowed us to compare the relative efficiency of photosensitizers in terms
of hemolysis kinetics (Fabio M. Engelmann et al. 2007). Erythrocyte suspensions were
irradiated in the presence of the photosensitizers and the decrease in light scattering was
monitored at 650 nm (Figure 2.9.A).
Figure 2.9 (A) Light attenuation monitored at 650 nm during photoirradiation of
erythrocytes in the presence of photosensitizers. Each point corresponds to the mean of two
independent experiments and error bars represent standard deviation (SD). (B) Time (in
seconds) to reach 50% photodamage induced in the erythrocytes membranes by each
photosensitizer. [photosensitizer] = 7 µM in PBS pH 7.4, LED 522 ± 20nm in case of
porphyrins and LED 633 ± 20nm in case of phthalocyanine, 7 mW/cm2.
It was observed that the decrease in scattering intensity was fastest for CisDiMPyP and
slowest for AlClPcS2a (Figure 2.9.A). The elapsed time that caused 50% of photodamage was
90 ± 4 seconds for CisDiMPyP, 172 ± 6 seconds for TPPS2a, 260 ± 3 seconds for PpNetNI and
610 ± 10 seconds for AlClPcS2a (Figure 2.9.B). Therefore, the decreasing order of the relative

Chapter 2: Membrane interaction of amphiphilic photosensitizers_____________
72
efficiency of membrane damage of the photosensitizers is: CisDiMPyP > TPPS2a > PpNetNI >
AlClPcS2a (Figure 2.9).
The observation of GUVs during the photosensitization process by optical microscopy
provides information about membrane leakage and physics alterations. GUVs are made with an
asymmetry in the distribution of sugars (sucrose in the internal compartment and glucose in the
external medium), resulting in an optical contrast when observed by phase contrast microscope
(Figure 2.10A). The loss of phase contrast indicates that the membrane allowed the transition
of glucose and sucrose (Figure 2.10D), while a stable optical indicates that the membrane
remains impermeable to sugars (Mertins et al. 2014). In this regard, the intensity values of phase
contrast were evaluated by the difference between the point of maximum luminosity and
minimum luminosity as function of the irradiation time (Figure 2.10 lower column). The
decrease in contrast indicates membrane leakage.
Figure 2.10. (Upper line) Phase contrast optical microscopy images of the giant vesicles
(GUVs) and (Lower line) intensity profiles across the equator of GUVs as a function of time
(in seconds) during photoactivation with 0.7 µM TPPS2a. The scale bars are 10 µm.

_____________Chapter 2: Membrane interaction of amphiphilic photosensitizers
73
Figure 2.11. Phase-contrast intensity decay of DOPC-GUVs during photoirradiation in
the presence of (A) 0.7 µM CisDiMPyP (B) 0.7 µM TPPS2a and (C) 0.7 µM AlClPcS2a. Each
point corresponds to the average of at least six vesicles and standard deviation (SD) is
represented by the error bars. (D) Time (in seconds) to reach 50% photodamage induced in the
GUVs by each photosensitizer. Box plots shows minimum to maximum values (*p<0.05 and
***p<0.001 are considered statistically significant). [DOPC]=2.5 mM, 0.2 M sucrose inside
vesicle, 0.2 M glucose outside vesicle. Irradiation carried out using the Zeiss Filter Set 05 for
porphyrins (excitation BP 395-440 nm, beam splitter FT 460nm, emission LP 470nm,
135 µW/cm2) and the Zeiss Filter Set 32 for phthalocyanine (excitation BP 665/45 nm, beam
splitter FT 695nm, emission BP 725/50nm, 135 µW/cm2). The number of photons absorbed by
the different photosensitizers were normalized.
PpNetNI induced membrane leakage in the dark even at low concentration (0.3 µM).
Thus, by using GUVs assays we evaluated only the efficiency of photoinduced membrane
damage of three other amphiphilic photosensitizers: CisDiMPyP, TPPS2a, AlClPcS2a.
Nevertheless, the increase in membrane permeability (or phase contrast decay) by sucrose
(inner pool) and glucose (outer solution) exchange was clearly observed by the fading of
membrane contrast of the GUVs (Figure 2.11) in all studied photosensitizers (Figure 2.11A,

Chapter 2: Membrane interaction of amphiphilic photosensitizers_____________
74
Figure 2.11B and Figure 2.11C), the elapsed time to observe a 50% optical contrast loss was
104 ± 22 seconds, 184 ± 4 seconds and 534 ± 37 seconds for CisDiMPyP, TPPS2a, AlClPcS2a.,
respectivately (Figure 2.11D).
Taken together, these findings showd that the photodynamic efficiency in membranes
(erythrocytes and GUVs) of amphiphilic photosensitizers is directly associated with the
efficiency of membrane binding whose descending order was: CisDiMPyP > TPPS2a > PpNetNI
≥ AlPcS2a. This is in agreement with literature, which show that a stronger membrane
interaction is correlated not only with greater membrane damage but also with more effective
photo-induced damage of whole cells and/or organisms (Bacellar et al. 2014; Fabio M.
Engelmann et al. 2007; Ben Amor, Bortolotto, and Jori 2000). As example, Bacellar et al. used
a series of phenothiazinium, containing different degrees of hydrophobicity and demonstrated
that the higher PS-membrane interaction was correlated to more membrane leakage (Bacellar
et al. 2014). Also, Pavani and coworkers demonstrated the direct relationship between the
porphyrins membrane binding and the efficiency in killing eukaryotic cells (Figure 2.12)
(Pavani, Iamamoto, and Baptista 2012).
Figure 2.12. Cell death versus membrane binding measured in multilamellar vesicles.
1: TMePyP, 2: Zn-TMePyP, 3: TC18PyP and 4: Zn-TC18PyP. Reprinted by permission from
John Wiley and Sons (Pavani, Iamamoto, and Baptista 2012).

_____________Chapter 2: Membrane interaction of amphiphilic photosensitizers
75
To further investigate this premise, we selected two photosensitizers (CisDiMPyP and
TPPS2a) to evaluate the biological effects in a human cell line, which is presented in details on
the next chapter (Chapter 3). The choice of CisDiMPyP and TPPS2a for the further studies in
eukaryotic cells is because they may be more efficient to PDT due to the larger membrane
binding and better photoactivity compared to others amphiphilic photosensitizers studied. At
the same time, CisDiMPyP and TPPS2a exhibit similar structures and photophysical properties
(same ϕF and ϕΔ), but different charges which allow the evaluation of the effect of charges in
the photodynamic efficiency.
2.4. CONCLUSION
Within the series of amphiphilic photosensitizers studied by us, we found that the
different peripheral groups do not significantly affect the photophysical properties of
porphyrins. However, the phthalocyanine chromophore exhibits different photophysical
properties from the porphyrins. The photophysical data indicates that the porphyrins have low
fluorescence quantum yields and are efficient generators of 1O2, while the phthalocyanine
presents a two-fold higher fluorescence quantum yield and generates 1O2 less efficient
compared to the porphyrins.
Even though peripheral groups do not significantly affect the photophysical properties of
the photosensitizers, it was shown to have a direct impact on the PS-membrane interaction and
the photo-induced membrane damage. It was found that the photodynamic efficiency is
correlated to the efficiency of membrane binding (The descending order of their efficiency is
CisDiMPyP > TPPS2a > PpNetNI ≥ AlPcS2a). We choose two photosensitizers with larger
interaction and highest ability of photodamage and photophysical properties and molecular
structure (CisDiMPyP and TPPS2a) to further evaluate the biological effects in eukaryotic cells
(Chapter 3).


CHAPTER 3
MODULATING PDT EFFICIENCY BY THE
CHARGE OF PHOTOSENSITIZER
It has been demonstrated that the specificity of
photosensitizers inside eukaryotic cells can increase the
photodynamic effect. When a photosensitizer is localized in a
strategic target, the required PDT dose (PS concentration and
light dose) is much smaller than when the PS is not specific.
By using two porphyrins with similar structure but bearing
opposite charges, it became clear that the affinity to different
organelles induces distinct mechanisms of cell death. Our
results provide insights about the choice of target and cell
death mechanism upon PDT as well as about the rational
design of new drugs for organelle-target therapies.**
** The work described in this chapter is adapted from submitted paper to Scientific Reports.
“Enhanced efficiency of cell death by lysosome-specific photodamage.” Tayana M. Tsubone,
Waleska K. Martins, Christiane Pavani, Helena C. Junqueira, Rosangela Itri and Maurício S.
Baptista.
This work was presented orally on International Photodynamic Association (IPA) in May
2015 at Rio de Janeiro – Brazil and in Tsukuba Global Science Week in September 2016 at
Tsukuba - Japan.


_______________Chapter 3: Modulating PDT efficiency by the charge of photosensitizer
79
3. MODULATING PDT EFFICIENCY BY THE CHARGE OF
PHOTOSENSITIZER
3.1. INTRODUCTION
The search for better new-photosensitizers usually focuses on a higher absorption in the
red region (“therapeutic window”) and/or a higher efficiency in the generation of singlet oxygen
(Bonnett 1995; Pushpan et al. 2002; Derosa and Crutchley 2002). Even though these are
important parameters of PS for PDT application, other factors such as the tendency of
intracellular location and the modes of cell death can be more decisive in the final
photodynamic efficiency in eukaryotic cells and thus should also be considered when planning
the molecular structure of a new photosensitizer. As already mentioned in Chapter 1, the work
of Oliveira et al. demonstrated exactly this point: although methylene blue produces a higher
amount of ROS than crystal violet, crystal violet has a better efficiency of killing cells compared
to methylene blue (Chapter 1 - Figure 1.5) due to a highly specific localization of crystal violet
in mitochondria (Oliveira et al. 2011). However, all these parameters (PS structure, reactive
oxygen species generated, cellular uptake, subcellular localization and consequences of specific
photodamage) are not usually evaluated together, sometimes missing the complete picture of
an ideal PS-structure.
Therefore, this work will discuss how and why the net charges of the porphyrin rings can
define the PDT efficiency and the type of the cell death mechanism by characterizing their
intracellular sites of photodamage, their ability to decrease viability and proliferation of HeLa
cells, and their consequences in terms of cell death mechanisms. Finally, by using
photosensitizers bearing opposite charges (CisDiMPyP and TPPS2a – see structures in Chapter
2 – Figure 2.2), we answer whether mitochondria or lysosomes may be the best intracellular
target of photo-oxidation to kill specific cancer cells.

Chapter 3: Modulating PDT efficiency by the charge of photosensitizer_______________
80
3.2. METHODOLOGY
3.2.1. Cells and culture conditions
The human cervical adenocarcinoma cell line (HeLa – ATCC CCL-2) was cultured in
Dulbecco’s Modified Eagle medium (DMEM) supplemented with 10% (v/v) fetal bovine serum
(FBS) and 1% (v/v) penicillin/streptomycin. HeLa cells were maintained in a humid incubator
(ThermoScientific) at 37ºC under an atmosphere of 5% carbon dioxide (CO2).
3.2.2. Cellular uptake of photosensitizers in HeLa cells
HeLa cells (2x10⁵ cells/well) were seeded in 12-well plates (Corning), incubated for
18 hours for attachment to the bottom of the well and then treated with photosensitizers (5 µM)
in 1 mL DMEM (1% (v/v) FBS) during 3 hours in the dark, 5% CO2 at 37ºC. After this period,
0.5 mL of the supernatant solution (free PS) was removed from the well and diluted with 0.5 mL
Triton X-100 10% (v/v) for spectroscopic investigation. The remaining supernatant was
discarded and the adhered cells were washed twice with PBS buffer and finally lysed in 1.0 mL
Triton X-100 5% (v/v) (bound PS). The Triton X-100 solubilizes the cell membranes and at the
same time avoids PS aggregation. The absorption spectra of supernatant and cell lysate were
put in cuvettes of 1.0 cm optical path length. The absorption spectra wererecorded using a
Shimadzu UV-2400-PC spectrophotometer and the PS uptake in cells was calculated as
described by equation 3.1.
% 𝐶𝑒𝑙𝑙𝑢𝑙𝑎𝑟 𝑢𝑝𝑡𝑎𝑘𝑒 = 100 𝐴𝑏𝑠 𝑐𝑒𝑙𝑙
𝐴𝑏𝑠 𝑐𝑒𝑙𝑙+(2𝑥 𝐴𝑏𝑠 𝑠𝑢𝑝𝑒𝑟𝑛𝑎𝑡𝑎𝑛𝑡) Equation 3.1
where Abs cell is the absorbance of photosensitizer uptake by cells and Abs supernatant is
absorbance of PS solution in the supernatant. The absorbance wavelength used in the
calculation was 424 nm and 418 nm for CisDiMPyP and TPPS2a, respectively. A correction
factor of 2 was added to Abs supernatant to correct for 2-fold dilution of the solution.

_______________Chapter 3: Modulating PDT efficiency by the charge of photosensitizer
81
3.2.3. Photosensitization in HeLa cells
Cells were seeded (2.8x10⁴ cells/well) in a 48-well plate (Corning), incubated 18 hours
for attachment to the flask and then treated with porphyrins CisDiMPyP (50 nM-300 nM) or
TPPS2a (5 nM-100 nM) in 1% (v/v) FBS DMEM media for 3 hours in the dark, 5% CO2 at
37ºC. Next, HeLa cells were washed twice with PBS. 300 µL of PBS was refilled and the cells
were submitted to irradiation for 15 minutes using a light emitting diode system (LED),
emitting at 522 ± 20 nm, up to a final light dose of 2.1 J/cm2 (see spectrum overlay of
porphyrins absorption and LED emission at Figure 3.1). After irradiation, the cells were
incubated in 1% (v/v) FBS DMEM media until the further measurements. For autophagy
monitoring experiments, 2 nM baflomicin-A1 (BAF) or 5 mM 3-methyladenine (3-MA) were
added immediately after irradiation.
500 550 600 650
0
1
2
3
4
LED Emission (522nm)
CisDiMPyP
TPPS2a
/nm
LE
D e
mis
sio
n
0,00
0,05
0,10
0,15
0,20
0,25
Absorbance
Figure 3.1. Overlay of LED emission and absorption spectra of both porphyrins.
3.2.4. Cell viability assays
3.2.4.1. MTT assay
After irradiation, HeLa cells were washed again with PBS. FBS DMEM media 1% (v/v)
was added added and the cells were incubated for 3 and 48 hours in the dark, 5% CO2 at 37ºC.
The cell survival was determined by an MTT assay 3-(4,5-dimethylthiazol-2-yl)-2,5-

Chapter 3: Modulating PDT efficiency by the charge of photosensitizer_______________
82
diphenyltetrazolium bromide, where cells were incubated with 0.15 mg/mL of MTT for 2 hours
in an incubator (5% CO2 at 37ºC). Formazan crystals were solubilized in dimethyl sulfoxide
(DMSO) and quantified by measuring the absorption at 550 nm (Infinite M200 plate reader-
Tecan). The percentage of viable cells was calculated relative to the absorbance of the control
cells (taken as 100% viability).(Meerloo, Kaspers, and Cloos 2011)
3.2.4.2. Clonogenic assay
Immediately after irradiation, control and photosensitized cells were detached by
tripsinization and counted. 500 cells per well were placed in a 6-well plate and incubated during
8 days at 5% CO2 at 37ºC. Then, HeLa cells were washed with PBS and incubated with 6%
(v/v) glutaraldehyde solution for 20 minutes followed by incubation with crystal violet in PBS
(0.5% w/v) for 20 minutes. The crystal violet solution was removed by washing the well under
tap water. The colonies greater than 50 cells were visually counted.(Franken et al. 2006).
3.2.5. Subcellular localization and site-specific photodamage
3.2.5.1. Colocalization fluorescence microscopy
HeLa cells (1x10⁵ cells/well in a 6-well plate) were incubated with porphyrins (1μM in
DMEM supplemented with 1% FSB) for 3 hours at 37ºC, 5% CO2. DAPI, MitoTracker® Green
FM and LysoTracker® Green DND-26 were used as probes for nuclei, mitochondria and
lysosomes, respectively. MitoTracker® Green FM (150 nM) and LysoTracker® Green DND-
26 (150 nM) were added after 150 minutes of PS-incubation, then the cells were incubated for
another 30 min. Microscope slides were prepared by adding ready-to-use Prolong Diamond
Antifade Mountant with DAPI and analyzed under the confocal microscope (ZeissTM Axiovert
200 LSM 510 Laser and Confocor Modules). Porphyrin fluorescence images were then
recorded using 514 nm laser for excitation and a 600-800 nm bandpass filter for emission. The
excitation/emission of MitoTracker® Green and LysoTracker® Green were 488 nm

_______________Chapter 3: Modulating PDT efficiency by the charge of photosensitizer
83
/505-530 nm, and that of DAPI was 358 nm/420 nm (longpass filter). Fluorescence images were
obtained using a confocal Zeiss (LSM 510). Images were analyzed using Image J software and
calculation of colocalization between photosensitizer and organelle-probe were performed
using the Manders overlay coefficient (MOC) plugin of Image J.
3.2.5.2. Mitochondrial membrane depolarization analysis by flow cytometry
Three hours after the irradiation, the treated and control cells (HeLa) were incubated with
rhodamine 123 (200 nM) for 15 minutes (37ºC, 5% CO2). Then, HeLa cells were washed twice
with PBS, detached through trypsinization procedure and centrifuged at 600g for 5 minutes at
4ºC. Pellet cells were re-suspended in buffer and then cytofluorometric analyzed by FACS
VERSE BD® using excitation at 488 nm and emission at 527 ± 32 nm (FL1). Results were
analyzed using FlowJo software.
3.2.5.3. Evaluation of organelle photodamage
Three hours after irradiation with either 100 nM CisDiMPyP or 30 nM TPPS2a, the treated
and control cells (HeLa) were incubated with 1 μM MitoTracker® Red CM-H2XRos (MTR) or
200 nM LysoTracker® Red (LTR) during 30 minutes (37ºC, 5% CO2). We analyzed 4,6-
diamidino-2-phenylindole (DAPI) counterstained slides under confocal microscope (ZeissTM
Axiovert 200 LSM 510 Laser and Confocor Modules) equipped with 63x objective. Images
were analyzed using Image J software.
3.2.6. Investigation of the photoinduced cell death mechanism
3.2.6.1. Annexin V-FITC/PI double-labeled flow cytometry
Three hours after irradiation, the treated and control cells (HeLa) were detached through
trypsinization, washed and centrifuged twice with PBS and re-suspended in 400 µL of binding
buffer. Four µL of a 50 µg/mL Annexin V-FITC (final concentration 0.5 µg/mL to each
sample) were added and 8 µL of a 100 µg/mL propidium iodide (final concentration 2 µg/mL
Chapter 3: Modulating PDT efficiency by the charge of photosensitizer_______________
84
to each sample), followed by incubation at room temperature in the dark for 10 min. Finally,
fluorescence emission was analyzed by cytofluorometry in an FACS VERSE BD®. For Annexin
V-FITC the excitation was at 488 nm, theemission at 527 ± 32 nm (FL1) and for Propidium
iodide (PI) excitation was at 633 nm and emission at 660 ± 22 nm (FL3). At least 20,000 events
were collected in each analysis and data was analyzed by FlowJo software.
3.2.7. Immunofluorescence staining
Caspase/Cathepsin: Three hours after irradiation, the treated and control cells (HeLa)
were fixed and submitted to permeabilization with 0.3 % (v/v) Triton X-100 and blockage,
followed by incubation with primary rabbit or mouse monoclonal antibodies against,
respectively, caspase-3 active form (CASP3, Cell Signaling Technology) or Cathepsin B
(CTSB, Abcam). Next, the primary antibody was revealed using goat secondary antibodies
(Alexa 488) from Molecular probes (Eugene, OR, USA).
Cathepsin/p62: 48 hours after irradiation according to the the same sample preparation
as described above, but applying a double-staining against Cathepsin B (CTSB, Abcam) and
ubiquitin binding protein sequestosome 1 (SQSTM1/p62, Cell Signaling Technology) the
primary antibody was revealed using goat secondary antibodies specific to mouse IgG CTSB
(Alexa 488) and rabbit P62 (Alexa 633), both from Molecular Probes. We analyzed 4,6-
diamidino-2-phenylindole (DAPI) counterstained slides under confocal microscope (ZeissTM
Axiovert 200 LSM 510 Laser and Confocor Modules) equipped with a Plan-Apochromat
63X/1.40 oil DIC M27 objective. Images were analyzed using Image J software.
3.2.8. Acridine orange and propidium iodide double staining
Three and 48 hours after irradiation, HeLa cells were washed with PBS and incubated
with AO/PI solution (1 µg/mL each dye in PBS) for 10 minutes at 5% CO2 and 37ºC.(Abdel
Wahab et al. 2009) A positive control for autophagy inhibition, i.e., 60 µM Chloroquine (CQ)
_______________Chapter 3: Modulating PDT efficiency by the charge of photosensitizer
85
was used for comparison.(Mizushima, Yoshimori, and Levine 2010; Mizushima 2004;
Agholme et al. 2012) Images were acquired under a fluorescence microscope Axiovert 200
(Carl Zeiss) equipped with Zeiss Filter Set 09, which provided excitation in the 450-490 nm
range and emission above 515 nm. The ratio between red and green fluorescence (AO/PI double
staining) was calculated by analyzing at least six different images from random areas of two
independent experiments. ImageJ Software was used to separate green and red channels.
3.2.9. Quantification of autophagy arbitrary units (AAU)
To quantify cell death associated with autophagy, this was quantified in terms of numeric
arbitrary autophagy units – AAU by equation 3.2 (Waleska K. Martins et al. 2013):
𝐴𝐴𝑈 = 𝑥𝑎
[𝑥𝑏+𝑥𝑐]/2 Equation 3.2
Where xa, xb and xc are the survival rates measured by NR, CV and MTT assays
respectively (Waleska K. Martins et al. 2013). This strategy is based on a parallel evaluation of
NR-uptake, weighted by the average of cell survival measured by MTT and CV (Crystal Violet)
assays. The MTT reduction method was conducted as described above. To quantify lysosomal
content after photosensitization, HeLa cells were stained with NR (60 μg/mL) by incubation
for 2 hours at 37C. After washing, NR was then diluted with an alcoholic-based 1% (v/v) acetic
acid fixing solution and measured at 540 nm. Subsequently, these fixed cells after washing with
water were used for CV assay. Finally, following washing of fixed-cells stained with Crystal
Violet at 0.02% (w/v) for 5 minutes at room temperature, we diluted CV with 0.1 M sodium
citrate in 50% (v/v) ethanol, and recorded absorbance values at 585 nm (Waleska K. Martins et
al. 2013). The detection of MTT, NR and CV absorbance was performed using the microplate
reader Infinite® 200 PRO (Tecan).

Chapter 3: Modulating PDT efficiency by the charge of photosensitizer_______________
86
3.2.10. Western Blot
48 hours after irradiation, HeLa cells were lysed [lysis buffer-20 mM PIPES, 100 mM
NaCl, 1 mM EDTA, 10% (w/v) sacarose, 0.1% (v/v) CHAPS, 0.1% (v/v) Triton X-100, 1 mM
PMSF, 2 µM Pepstatin A, 50 µM digitonin]. 20 μg of the total proteins were separated in 12%
(w/v) acrylamide gels and transferred to PVDF membranes (GE healthcare). PVDF membranes
(0.45 μm pore) were blocked with 5% (w/v) BSA in 0.01% (v/v) TBS-T (Tween 20 in TBS)
for one hour at room temperature, followed by incubation with primary antibodies against
LC3B (Cell Signaling Technology) and α-tubulin (Sigma Aldrich) in 0.01% (v/v) TBS-T with
2.5% (w/v) BSA overnight at 4ºC. Next, PVDF membranes were washed three times with
0.01% (v/v) TBS-T for 10 minutes and then incubated with secondary antibodies (anti-rabbit
HRP for LC3B and anti-mouse HRP for α-tubulin) diluted in 0.01% (v/v) TBS-T with
2.5% (w/v) BSA for one hour at room temperature. Again, PVDF membranes were washed
three times with 0.01% (v/v) TBS-T for 10 minutes and revealed using SuperSignal West Pico
Chemiluminescent Substrate. Data acquisition was performed by using the Alliance 6.7-
89WL/20M chemiluminescence detection system. Images were analyzed using NineAlliance
9.717.00b software and the LC3 data were normalized to α-tubulin band intensities.
3.2.11. Statistics
To perform comparative statistical analysis, we first analyzed the variance between the
groups of samples. Next, we analyzed statistical differences by a parametric or non-parametric
T-student test for pair-wise comparisons. In case of multiple comparisons, we performed a one-
way analysis of variance (ANOVA) with Dunnett’s T3 or Bonferroni post-hoc tests, depending
on the homogeneity of variance. The statistical analyses were performed using the IBM SPSS
Statistic software. Data were obtained in most of the experiments from three independent
experiments, in some cases only two independent experiments (n = 6) were available. Results

_______________Chapter 3: Modulating PDT efficiency by the charge of photosensitizer
87
are expressed as mean values ± standard deviation (SD). As statistically significant, we
considered P-values lower than 0.05 (*), lower than 0.01 (**) and lower than 0.001 (***).
3.3. RESULTS AND DISCUSSION
3.3.1. Uptake and phototoxicity in HeLa cells
The uptake of CisDiMPyP by HeLa cells (26% ± 2) was about 35 % larger than that of
TPPS2a (16.6% ± 2.4) (Figure 3.2). In Chapter 2, it was demonstrated that there are the two
major contributions to the PS internalization: the positive charge of CisDiMPyP is promoting a
stronger interaction with the cytoplasmic membrane by electrostatic attraction and the dipolar
interactions, which are present in both porphyrins. The uptake in cells therefore follows the
same trend as found for the interaction with membranes (Chapter 2 - Figure 2.6) confirming
this hypothesis.
The phototoxicity of porphyrins in HeLa cells was assessed by MTT and clonogenic
assays (Figure 3.2B and Figure 3.2C). None of the porphyrins caused a decrease of viability or
proliferation in the dark, thus confirming no dark-cytotoxicity. TPPS2a showed to be more
phototoxic compared to CisDiMPyP (Figure 3.2B and Figure 3.2C). The lethal concentration
to cause 50% of cell death (LC50) estimated for CisDiMPyP (100 nM) was at least 3-fold higher
than for TPPS2a (30 nM).
It is worth mentioning that TPPS2a is more efficient in terms of photo-damaging HeLa
cells regardless of its lower internalization. In order to compare the cell killing efficiency per
molecule of PS, we considered the concentration of PS that is actually internalized at the LC50,
which is 4.5 nM for TPPS2a and 25 nM for CisDiMPyP. Thus, the cell killing efficiency per
molecule of TPPS2a is around 5 times larger than of CisDiMPyP.
TPPS2a and CisDiMPyP have similar values (Chapter 2 - Table 2.2), consequently the
greater molecular photo-efficiency observed for TPPS2a in HeLa cells cannot be explained by
an excess amount of 1O2. It does not correlate neither with cell uptake nor with the efficiency

Chapter 3: Modulating PDT efficiency by the charge of photosensitizer_______________
88
of membrane binding/damaging. This fact is intriguing because it goes against several
paradigms in this field, i.e.: a stronger membrane binding results in greater cell damage
(Bacellar et al. 2015; Fabio M. Engelmann et al. 2007), a higher amount of PS incorporation of
similar PSs in the cell results in a greater efficiency of photo-induced cellular damage (Bacellar
et al. 2015; Fabio M. Engelmann et al. 2007; Ben Amor, Bortolotto, and Jori 2000). We
observed a lack of relationship between the efficiency of cell killing (Figure 3.2) with the other
parameters mentioned above (binding membrane, photodamage in membanes) (Chapter 2 –
Figure 2.6 and Table 2.2). We hypothesize that the observed differences may be due to the
different intracellular localization and induction of distinct cell death mechanisms (Rodriguez
et al. 2009; Fabris et al. 2001; Tardivo et al. 2005; Bacellar et al. 2015).

_______________Chapter 3: Modulating PDT efficiency by the charge of photosensitizer
89
Figure 3.2. (A) Uptake of TPPS2a and CisDiMPyP in HeLa cells after 3 hours incubation
in the dark. [Porphyrins]=5 µM, 5x10⁴ cells/cm2 in DMEM culture medium 1% FBS, pH 7.4,
Bars represent mean ± SD of three independent experiments (n = 9, ***p<0.001 are considered
statistically significant). (B) MTT assay. Cell viability in the dark and 48 hours after irradiation
as a function of the PS concentration. Each point represents the mean ± SD of three independent
experiments (n = 9). (C) Clonogenic assay. Survival cells in the dark and 8 days after irradiation
as a function of PS concentration determined by clonogenicity. Each point represents the mean
± SD (n = 4). (A, B and C) Incubation of HeLa cells with porphyrins for 3 hours in DMEM
with 1% FBS. (B and C) After incubation with PS, irradiation was performed in PBS using a
LED system emitting at 522 ± 20 nm with a light dose of 2.1 J/cm2.

Chapter 3: Modulating PDT efficiency by the charge of photosensitizer_______________
90
3.3.2. Porphyrins-charge governing intracellular localization and subcellular
photodamage
In order to characterize the different locations of these PS in the intracellular environment,
we initially tried lysosome and mitochondria co-localization protocols (Table 3.1 and Figure
3.3). CisDiMPyP showed a higher tendency to accumulate in mitochondria, while TPPS2a
accumulates more in lysosomes, as revealed by the raw percentage data of co-localization with
Lysotracker® and Mitotracker® (Figure 3.3), as well as by the ratio of raw percentages for each
PS (M/L values - Table 3.1). This result was somehow expected, because positively charged
PSs in general are known to accumulate in mitochondrial membranes and negatively charged
PSs in lysosomal membranes (Horobin, Stockert, and Rashid-Doubell 2015; Yue et al. 2011;
Kristian Berg et al. 1990; Dummin, Cernay, and Zimmermann 1997). However, the
experimental conditions of these co-localization protocols were not ideal, because we could
only obtain well-resolved fluorescence images of PS intracellular localization at PS
concentrations, which were a lot higher than the LC50 (one order of magnitude). At these high
concentrations, the PS saturates not only the primary accumulation sites but also other lower
affinity sites. The relatively low percentages of co-localization in mitochondria and in lysosome
by both PSs (<50%, Table 3.1) attest this fact. Because we could not precisely characterize PS
location in the 30-100 nM range directly by fluorescence images, we then relied on protocols
aiming to characterize the specific damages in mitochondria and lysosomes at the LC50.
Table 3.1. Co-localization percentage of porphyrins with Mitotracker® green and
Lysotracker® green after 3h incubation in HeLa cells.
Overlay
(PS/organelle)
LysoTracker®
(L)
MitoTracker®
(M) M/L
CisDiMPyP 20% ± 2 38% ± 5 1.9 ± 0.2
TPPS2a 39% ± 4 30% ± 5 0.7 ± 0.1

_______________Chapter 3: Modulating PDT efficiency by the charge of photosensitizer
91
Figure 3.3. (A) Confocal fluorescence microscopy images of HeLa cells with blue
fluorescence of nucleus (DAPI), red fluorescence of porphyrins (1 μM) and green fluorescence
of mitochondria (150 nM MitoTracker®). Right column shows the overlay from three channels
(blue, red and green). (B) Confocal fluorescence microscopy images of HeLa cells with blue
fluorescence of nucleus (DAPI), red fluorescence of porphyrins (1 μM) and green fluorescence
of lysosomes (150 nM LysoTracker®). Right column shows the overlay from three channels
(blue, red and green). Scale bars corresponds to 20 µm.
The experiments were performed 3 hours after irradiating cells, previously treated with
either 30 nM of TPPS2a or 100 nM of CisDiMPyP. The loss of mitochondrial transmembrane
inner potential (m) was evaluated by means of fluorescence intensity of Rhodamine 123
(Rh123) using flow cytometry. The subcellular photodamage was evaluated by staining

Chapter 3: Modulating PDT efficiency by the charge of photosensitizer_______________
92
mitochondria with MitoTracker® Red CM-H2XRos (MTR) and lysosomes with LysoTracker®
DND-99 Red (LTR). Cathepsin B, which is a lysosomal enzyme released in the cytosol when
the lysosome is damaged, was characterized by immunostaining. The early activation of
apoptosis was evaluated by immunoassays against the activated-form of caspase-3 (Figure 3.5
and Figure 3.6).
Upon CisDiMPyP photosensitization, there is a remarkable decrease in Rh123
fluorescence (FITC-A+ 59.4), indicating a loss of m, while in the case of TPPS2a-treated
cells, the Rh123 fluorescence (FITC-A+ 75.1) (and consequently m) remained at the same
level as the control (Figure 3.4).
Figure 3.4. (A) Flow cytometry histograms of rhodamine 123 (Rh123) fluorescence, 3
hours after irradiation, in control cells and in HeLa cells treated with 30 nM TPPS2a, 100 nM
CisDiMPyP (left) and irradiated (2.1 J/cm2 at 522nm). (B) Percentage of mitochondrial
membrane potential (Δψm) depolarization in comparison with control cells. Δψm values were
calculated from the data shown in the left figure. Box plots correspond to minimum and
maximum values of at least two independent experiments (n = 6, ***p<0.001 are considered
statistically significant).

_______________Chapter 3: Modulating PDT efficiency by the charge of photosensitizer
93
Figure 3.5. (A) Fluorescence images obtained 3 hours after irradiation of control HeLa
cells, and cells incubated with 100 nM CisDiMPyP or 30 nM TPPS2a and irradiated. First
column: blue fluorescence of nucleus DAPI staining; second column: red fluorescence of
MitoTracker® Red, staining actively-respiring mitochondria; third column: both channels (blue
and red) merged; Fourth column: surface plots of red intensity from MitoTracker®. Scale bar
of 20 μm. (B) Fluorescence images obtained 3 hours after irradiation of control HeLa cells, and
of cells incubated with 100 nM CisDiMPyP or 30 nM TPPS2a. First column: blue fluorescence
of DAPI nucleus staining; second column: green fluorescence of cleaved caspase-3 antibody;
third column: both channels (blue and green) merged; fourth column: surface plots of green
intensity from cleaved caspase-3 antibody. Scale bar of 20 μm.

Chapter 3: Modulating PDT efficiency by the charge of photosensitizer_______________
94
There was also a significant loss of MTR-fluorescence intensity in CisDiMPyP-treated
cells, which is a consequence of mitochondrial damage and decrease in m, contrasting the
MTR-fluorescence images observed for TPPS2a and control cells (Figure 3.5A). Surface plot
profiles and quantification of fluorescence intensity support these findings (Figure 3.5A, right
panels). Several literature reports have shown that mitochondrial photodamage may trigger
apoptosis (Spring et al. 2015; Bacellar et al. 2015; C. A. Morton et al. 2013; Pavani, Iamamoto,
and Baptista 2012; David Kessel and Luo 1998; Mroz et al. 2011; D. Kessel and Luo 2001).
Based on this premise, we also measured the profile of activated caspase-3, which is the major
modulator of the apoptotic cascade (Figure 3.5B). Only CisDiMPyP-photosensitized cells
showed a noticeable increase in the levels of caspase-3 (Figure 3.5B). It is clear that unlike
TPPS2a, CisDiMPyP at the LC50 promptly accumulates within mitochondria and upon photo-
activation causes severe damage in this organelle membrane.
In contrast to CisDiMPyP, TPPS2a triggered remarkable photodamage in lysosomes.
TPPS2a-photosensitized cells were not stained by lysosomotropic LTR, while CisDiMPyP-
photosensitized cells showed similar levels of LTR staining as control cells (Figure 3.6A).
Supporting this finding, the level cytosolic Cathepsin B (CTSB release) was higher for TPPS2a
than for CisDiMPyP and control cells, indicating an increase of lysosome membrane
permeability (LMP) after photosensitization (Figure 3.6B). The lack of lysotracker staining and
the diffuse pattern of cathepsin staining are characteristic markers of LMP (Boya and Kroemer
2008). Therefore, at the LC50, TPPS2a caused significant damage in lysosomes.

_______________Chapter 3: Modulating PDT efficiency by the charge of photosensitizer
95
Figure 3.6. Fluorescence images obtained 3 hours after photosensitization of control
HeLa cells and of cells incubated with 100 nM CisDiMPyP and 30 nM TPPS2a. (A) First
column: blue fluorescence of DAPI staining nucleus; second column: red fluorescence of
LysoTracker® Red staining lysosomes; third column: both channels (blue and red) merged;
Fourth column: surface plots of red fluorescence from LysoTracker®. Scale bar of 20 μm. (B)
First column: blue fluorescence of DAPI staining nucleus; second column: green fluorescence
of cathepsin B anti-body; third column: both channels (blue and green) merged; fourth column:
surface plots of green intensity from cathepsin B antibody. Scale bar of 20 μm. Incubation of
HeLa cells with porphyrins for 3 hours in DMEM with 1% FBS followed by irradiation with
LEDs emitting at 522 ± 20 nm and light dose 2.1 J/cm2.

Chapter 3: Modulating PDT efficiency by the charge of photosensitizer_______________
96
3.3.3. Consequences of the organelle-specific photodamage
At this point, our findings indicated that the cell killing capacity changed remarkably,
depending on the PS ability of targeting specific intracellular organelles membranes. We
hypothesize that such differences are correlated to the type of cell death mechanism triggered
by the specific damages induced in mitochondria or in lysosomes by the photosensitized
oxidations produced by CisDiMPyP and TPPS2a, respectively. Therefore, we investigated the
modes of cell death by assessing the main biochemical hallmarks as illustrated in Figure 3.7.
Figure 3.7. Molecular characteristics of autophagy, apoptosis and necrosis. (a)
Autophagy, which is phenotypically detectable by acid vacuoles (vacuolization), LC3-II in the
autophagosomal membrane (LC3 lipidation) and adaptor proteins (P62-SQSTM1) linked to

_______________Chapter 3: Modulating PDT efficiency by the charge of photosensitizer
97
LC3-II. Apoptosis is morphologically characterized by nuclear condensation and pyknosis
followed by DNA fragmentation. Also, biochemical changes such as phosphotisylserine
exposure in the plasma membrane occur, as well as mitochondrial membrane permeabilization
(MMP) and caspase cascade activation. Necrosis typically manifests with oncosis and shares
some features with apoptosis. (b) Fluorescence microscopy for the detection of multiple cell
death modes: human osteosarcoma U2OS cells stably expressing a green fluorescent protein
(GFP)–LC3 chimaera were kept in control conditions (homeostasis) or treated for 12 hours with
1 μM of rapamycin (an autophagic stimulus) or 1 μM of staurosporine, either alone (triggering
apoptosis) or together with 20 μM of Z-VAD-fmk (leading to necrosis). Cells were then co-
stained with the nuclear dye Hoechst 33342 and the exclusion dye propidium iodide. Reprinted
by permission from Macmillan Publishers Ltd (Kepp et al. 2011).
3.3.3.1. Consequences of mitochondrial photodamage by CisDiMPyP
In order to further evaluate the cytotoxic effects of both porphyrins we characterized the
viability of HeLa cells 3 hours after irradiation. Cells previously incubated with 100 nM of
CisDiMPyP suffered a significant decrease in cell viability (68% ± 3) compared to TPPS2a-
photosensitized cells (93% ± 1) (Figure 3.8A). Therefore, just after irradiation the phototoxicity
of CisDiMPyP is actually greater than that of TPPS2a, suggesting a more acute phototoxicity.
Accordingly, by AO/PI double staining assays, it was clear that CisDiMPyP-photosensitized
cells have a larger percentage of membrane permeabilization (PI incorporation), which was not
present in TPPS2a-photosensitized cells (Figure 3.8B). Note also that in CisDiMPyP-
photosensitized cells nuclear dissolution occurred, indicative of pyknosis (blue arrow in Figure
3.8B), a common hallmark of late apoptotic or/and necrotic cells (David Kessel and Luo 1998;
Oleinick, Morris, and Belichenko 2002; Ana P. Castano, Demidova, and Hamblin 2004).
Interestingly, these results are considerably different from those measured 48 h and 8 days after
photosensitization (Figure 3.2B and Figure 3.2C), which showed TPPS2a toxicity being several
times larger than that of CisDiMPyP.
The morphological features of the cells shown in Figure 3.8B suggests apoptosis/necrosis
in the Hela cells after the CisDiMPyP photosensitization. To further investigate this suggestion,
we performed cytofluorometric analysis on by using Annexin V-FICT/PI approach. Scatter-
plots revealed a significant larger percentage of PI(+)/AV(+) cells, which indicates late

Chapter 3: Modulating PDT efficiency by the charge of photosensitizer_______________
98
apoptosis or necro-apoptosis, in CisDiMPyP-treated cells (47 ± 4%) in comparison with control
(15 ± 3%) and TPPS2a-treated (24 ± 4%) cells. The positive control for apoptotic cell death that
we employed in this experiment, i.e. Staurosporine, induced 42 ± 2% of PI(+)/AV(+) cells,
which is similar to the value observed for CisDiMPyP-treated cells. This typical apoptotic
phenotype was observed neither in TPPS2a-treated cells nor in control cells (Figure 3.8C and
Figure 3.8D).
Therefore, by targeting mainly mitochondrial membranes, photoactivation of CisDiMPyP
triggers the intrinsic caspase-dependent pathway, killing cells by a combination of apoptosis
and necrosis. This acute toxicity right after irradiation (3 h) is a common response in the case
of mitochondrial photodamage, as has been reported for several other PSs (D. Kessel and Luo
2001; Mroz et al. 2011; David Kessel and Luo 1998). The percentage of live cells
(45.6% ± 1.9), which was ascribed to irradiating cells previously treated with 100 nM of
CisDiMPyP according to AV/PI approach (Figure 3.8C) is basically the same as the cell
viability measured at 48 hours after the acute toxic effect (LC50, see Figure 3.2B). Therefore,
CisDiMPyP photosensitization induces an acute damage killing a large fraction of the cells.
However, cells did not die during the following hours after irradiation. The number of live cells
determined 3 hours after photosensitization with 30nM of TPPS2a is similar to the control
(Figure 3.8) and a lot larger than the 50% of cell survival determined 48 hours after irradiation
(LC50). Accordingly, TPPS2a-phototoxicity seem to rely on the loss of cellular homeostasis in a
time-dependence manner, unlike CisDiMPyP, which modulated cell death in a more promptly-
acute way.

_______________Chapter 3: Modulating PDT efficiency by the charge of photosensitizer
99
Figure 3.8. (A) Cell viability (by MTT assay) of control and cells incubated with 100 nM
of CisDiMPyP and 30 nM of TPPS2a, 3 hours after irradiation. Bars represent the mean ± SD
of at least three independent experiments (n = 6, ***p<0.001 is considered statistically
significant). (B) AO/PI double staining micrographs obtained 3 hours after irradiation of control
cells and cells incubated with 100 nM of CisDiMPyP or with 30 nM of TPPS2a. Scale bar is
50 μm. (C) Pseudo-color scatter-plots showing gating in 4 populations, according to positive
and negative responses to Annexin V-FITC and Propidium iodide of non-treated cells (control)
and of cells treated with: 100 nM CisDiMPyP, or 30 nM TPPS2a, or 1 μg/mL Staurosporine.
(D) Fold change in comparison with the control of the 4 gated populations showed in (C). (A,
B, C and D) HeLa cells were incubated with porphyrins in DMEM (1% FBS) for 3 hours, and
then irradiated with LEDs emitting at 522 ± 20 nm and light dose 2.1 J/cm2.
Chapter 3: Modulating PDT efficiency by the charge of photosensitizer_______________
100
3.3.3.2. Consequences of lysosomal photodamage by TPPS2a
As already discussed, 3 hours after photosensitization TPPS2a caused lysosomal
instability (Figure 3.6). Some reports described that lysosome-targeted PDT usually induces
apoptotic cell death, which is associated with the permeabilization of the lysosomal membrane
and release of cathepsins, the cleavage of apoptotic effectors (Reiners et al. 2002; D. Kessel
and Luo 2001). However, in our studies we observed neither Annexin V-FITC binding (Figure
3.8C and Figure 3.8D), nor caspase-3 activation (Figure 3.5C) and PI incorporation (Figure
3.8B), indicating that apoptosis is not playing a role in the case TPPS2a-induced cell death. We
cannot suppose that the absence of apoptotic response after lysosome permeabilization is a
consequence of the absence of Bid (cathepsin-mediated cleavage of Bid catalyzes an apoptotic
response), since HeLa cells have shown to have active Bid and to engage in apoptosis induced
by lysosome membrane permeabilization (Cirman et al. 2004; Köhler et al. 2008). We
hypothesize that TPPS2a is triggering cell death by inhibiting autophagy, which is an important
biological process responsible for the maintenance of cellular homeostasis. By triggering
lysosomal impairment, TPPS2a could suppress the autophagic flux, which in turn causes
autophagy-associated cell death, as has been recently shown by Kessel and co-authors (David
Kessel 2015).
In order to uncover the role of TPPS2a-modulated lysosomal impairment, we performed
experimental protocols aiming to monitor autophagy (Klionsky et al. 2016; W.K. Martins et al.
2015). Thus, 48 hours after irradiation we stained HeLa cells with the lysosomotropic dye
acridine orange (AO). As revealed by the orange/red fluorescence dots present in TPPS2a-
photosensitized cells, but not in cells photosensitized with CisDiMPyP, there was a remarkable
accumulation of acid vacuoles (Figure 3.9A-i). The AO red/green fluorescence fold, which is
proportional to the ratio of acidic vacuoles to the total cell staining, increased in the order:
control in absence of porphyrins (1.0 ± 0.1) < CisDiMPyP (1.2 ± 0.4) < TPPS2a (1.7 ± 0.2) ≤

_______________Chapter 3: Modulating PDT efficiency by the charge of photosensitizer
101
Chloroquine (2.0 ± 0.1) (Figure 3.9A-ii). Indeed, the level of accumulation of acidic vacuoles
observed in TPPS2a-photosensitized cells is similar to that observed in cells treated with
chloroquine, which is a known inhibitor of the autophagy flux (Figure 3.9A-ii).
Additionally, we compared the level of autophagy arbitrary units (AAU), which is an
indicator of the magnitude of autophagy-associated cell death (AAU is calculated by comparing
the viability measured by three independent methods, NR, CV and MTT) (Waleska K. Martins
et al. 2013), in cells incubated with either CisDiMPyP or TPPS2a and irradiated (Figure 3.9B).
While dark controls have relatively stable levels of AAU, an increase in AAU was observed as
a function of TPPS2a concentration, while in CisDiMPyP-photosensitized cells there was a
decrease in the AAU level. This finding indicates that autophagy is not correlated with the
decrease in cell viability as CisDiMPyP concentration increases (Figure 3.9B). In the case of
TPPS2a there was a remarkable accumulation of lysosomotropic vacuoles (i.e. increase of
AAU), which significantly and strongly correlate with decrease in cell survival as TPPS2a
concentration increased (W.K. Martins et al. 2015).
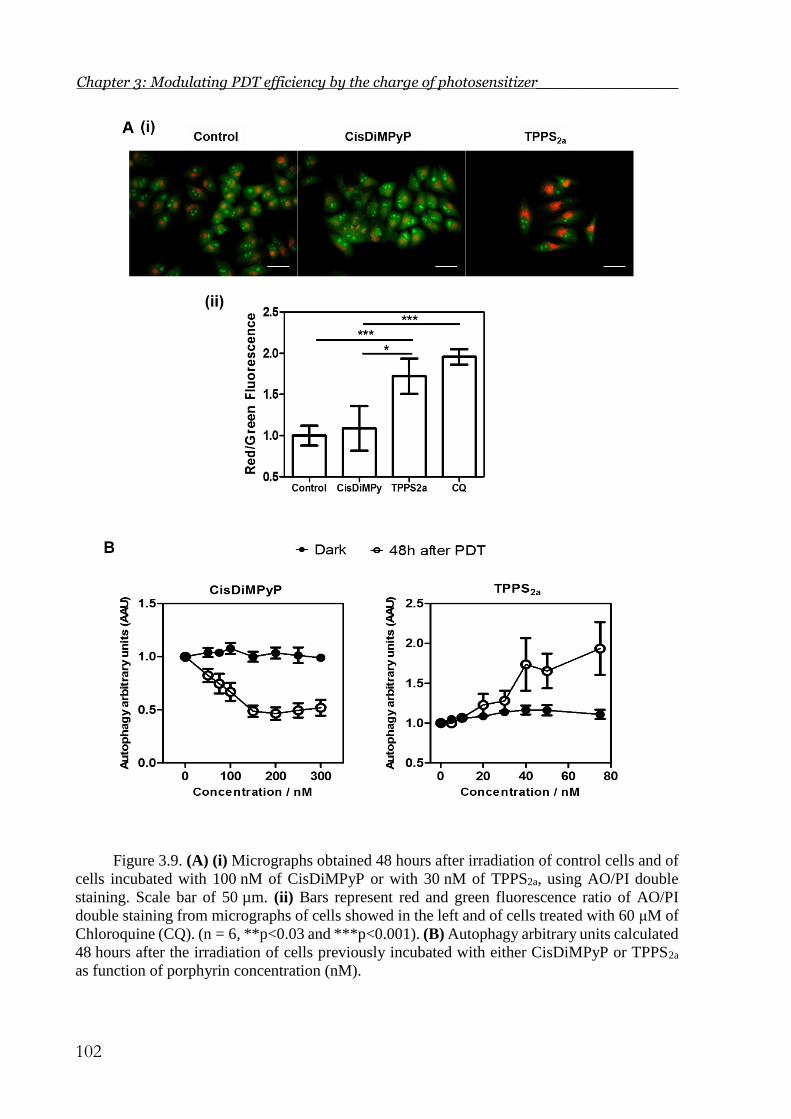
Chapter 3: Modulating PDT efficiency by the charge of photosensitizer_______________
102
Figure 3.9. (A) (i) Micrographs obtained 48 hours after irradiation of control cells and of
cells incubated with 100 nM of CisDiMPyP or with 30 nM of TPPS2a, using AO/PI double
staining. Scale bar of 50 µm. (ii) Bars represent red and green fluorescence ratio of AO/PI
double staining from micrographs of cells showed in the left and of cells treated with 60 μM of
Chloroquine (CQ). (n = 6, **p<0.03 and ***p<0.001). (B) Autophagy arbitrary units calculated
48 hours after the irradiation of cells previously incubated with either CisDiMPyP or TPPS2a
as function of porphyrin concentration (nM).

_______________Chapter 3: Modulating PDT efficiency by the charge of photosensitizer
103
As illustrated in Figure 3.7, autophagy is typically detectable by LC3 lipidation and
adaptor proteins (P62-SQSTM1) linked to LC3-II. Thus, we estimated the autophagic flux in
terms of LC3 by western blotting assay 48 hours after cell irradiation (Figure 3.10i). LC3-II
accumulates in TPPS2a- photosensitized cells, regardless of autophagy inhibition by BAF
(Figure 3.10ii), attesting that there was autophagy inhibition (Klionsky et al. 2016).
Figure 3.10. (i) Expression levels of LC3I and LC3-II by western blot analysis of control
cells and of cells previously incubated with 100 nM of CisDiMPyP or 30 nM of TPPS2a, 48h
after irradiation in the absence or presence of 5 nM of baflomicyn-A1 (BAF). (ii) Bars represent
the results from 2 independents experiments and indicate the relative amounts of LC3-II (%)
normalized by baseline expression of α-tubulin and the standard deviation (SD) is represented
by error bars (n = 4, **p<0.03 and ***p<0.001).
Next, we also evaluated the recruitment of adaptor molecules such as P62/SQSTM1,
which represents a selective degradation signal in mammalian cells (Pankiv et al. 2007; Bjørkøy
et al. 2009) (Figure 3.11A). The labeling of the endogenous P62/SQSTM1 in the cytosol of
TPPS2a-photosensitized cells significantly increased 48 hours after irradiation, compared to
control and CisDiMPyP-photosensitized cells (Figure 3.11B), regardless of autophagy
inhibition by BAF. In the case of CisDiMPyP, recruitment of endogenous P62/SQSTM1
happens only in the presence of BAF, which is a condition with parallel damage in mitochondria
and lysosome, previously described to cause strong autophagy inhibition (W.K. Martins et al.
2015). Moreover, confocal microscopy revealed a larger recruitment of lysosomal enzymes
(cathepsin B) for TPPS2a-photosensitized cells compared with those photosensitized with
CisDiMPyP (Figure 3.11C).

Chapter 3: Modulating PDT efficiency by the charge of photosensitizer_______________
104
Figure 3.11. (A) Images of HeLa cells non-treated (Control) and treated with
photosensitizers (100 nM CisDiMPyP or 30 nM TPPS2a) and 2 nM baflomycin-A1 (BAF)
followed by immunostaining for P62/SQSTM1 (red fluorescence) and cathepsin B (green
fluorescence). The scale bars are 20 µm. (B) Fluorescence intensity of P62/SQSTM1 (red
fluorescence) and (C) cathepsin B (green fluorescence) from control cells and of cells
previously incubated with 100 nM of CisDiMPyP or 30 nM of TPPS2a in the absence or
presence of 2 nM of baflomycin-A1 (BAF). Bars correspond the mean ± SD of at least two
independent experiments (n = 6, **p<0.03 and ***p<0.001 are considered statistically
significant).

_______________Chapter 3: Modulating PDT efficiency by the charge of photosensitizer
105
Autophagy can be a dual-function process, facilitating both, protecting against cell death
and/or promoting cell death. Its role was examined by using an inhibitor of phosphatidylinositol
3-kinases (PI3K): 3-methyladenine (3-MA). The inhibition of autophagy by 3-MA provides
protection against the loss of viability in TPPS2a-photosensitized HeLa cells (Figure 3.12),
suggesting that the impairment of autophagic pro-survival functions is responsible for a more
efficient long-term phototoxicity. Contrasting this result, the effect of 3-MA was absent in
CisDiMPyP-photosensitized cells (Figure 3.12). Taken together, these results showed that
TPPS2a inhibited autophagic flux resulting in autophagy-associated cell death.
Figure 3.12. Effect of autophagy inhibition by 3-MA. Cell viability 48h after irradiation
of cells previously treated with 100 nM of CisDiMPyP or 30 nM of TPPS2a in the absence or
presence of 5mM of 3-MA. The viability of cells exposed to 3-MA alone was 52 ± 2%
compared to untreated control cells, then cell survival data in presence of 3-MA were
normalized to control exposed to 3-MA. Bars correspond the mean ± SD (n = 6, **p<0.03 is
considered statistically significant).
3.4. CONCLUSION
The net charge of the PS plays a major role in the efficiency and mechanism of cell death.
Amphiphilic cationic compounds are known to accumulate in mitochondrial membranes
because of the negative electrochemical potential (~ -180 mV) of this organelle. Mitochondrial
oxidative stress leads to a decrease in cellular ATP and to several signaling responses, which
can trigger cell death trough apoptotic and/or necrotic pathways (Bacellar et al. 2015; Pavani,
Iamamoto, and Baptista 2012; David Kessel and Luo 1998), in short-time periods (few hours)

Chapter 3: Modulating PDT efficiency by the charge of photosensitizer_______________
106
after irradiation. This scenario was in fact observed after irradiating cells previously incubated
with CisDiMPyP (Figure 3.13). Although the acute toxicity of CisDiMPyP was larger
(compared with TPPS2a), surviving cells seem to recover fairly well and behave as control cells
some days after irradiation. On the other hand, amphiphilic anionic compounds usually localize
preferentially in lysosomes (Kristian Berg et al. 1990; Woodburn et al. 1991; K. Berg and Moan
1994). Upon photo-stimulation, TPPS2a caused remarkable lysosomal impairment and triggered
the regulated cell death associated with autophagy, which manifested itself days after
irradiation, by causing cell death and proliferation decrease with a higher efficiency at
extremely low PS concentration (Figure 3.13). Therefore, by targeting lysosomes, instead of
mitochondria, we provided insights into a more effective PDT protocol. This information is in
agreement with a previous literature report with a mechanistic explanation (Rodriguez et al.
2009). Cells photoactived with TPPS2a show the absence of active caspase-3, lower levels of
apoptosis, damage in the lysosomal membrane, interruption in the final stage of autophagy
involving fusion of autophagosomes and lysosomes, proliferation of autophagosomes
(accumulation of acidic vacuoles and increased levels of LC3-II and P62/SQSTM1), inability
of cells to recycle proteins and other components, leading to autophagy-associated cell death.

_______________Chapter 3: Modulating PDT efficiency by the charge of photosensitizer
107
Figure 3.13. Scheme showing consequence of photodamaging cells with porphyrins
containing opposite charges.
By addressing the relationship between the chemical structure of the PS, the site of
intracellular damage and the mechanism of photo-induced cell death, we showed that PSs can
be planned to precisely target organelles and to specifically trigger regulated cell death
mechanisms. This work stands as a proof of concept that lysosomal membrane damage and
induction of autophagy-associated cell death is long-lasting and a more effective way to
decrease cell proliferation. Conceivably, this knowledge will help in the rational design of new
drugs for organelle-target therapies.


CHAPTER 4
ENHANCED PDT EFFICIENCY PROVIDED BY
TYROSINE-DERIVED NANOSPHERES
Third-generation photosensitizers aim to improve
bioavailability. They consist of first and second
generation PS, conjugated to or packaged within carrier
molecules such as polymers. In this chapter, we
demonstrate that tyrosine-derived nanospheres
(Tyrospheres) can encapsulate amphiphilic
photosensitizers in monomeric form, improving their
photophysical and photochemical properties. Our data
indicate the great potential of Tyrospheres in PDT as
nanocarrier.‡
‡ The work described in this chapter is in the final stage of writing for submission. Tyrosine-
derived nanospheres as carrier of porphyrins in Photodynamic Therapy. Tayana M.
Tsubone, Zheng Zhang, Ritu Goyal, Joachim Kohn and Maurício S. Baptista.
This work was presented orally on 10th World Biomaterials Congress (WBC) in May 2016
at Montréal – Canada.


________Chapter 4: Enhanced PDT efficiency provided by tyrosine-derived nanospheres
111
4. ENHANCED PDT EFFICIENCY PROVIDED BY TYROSINE-DERIVED
NANOSPHERES
4.1. INTRODUCTION
As already commented in Chapter 1, even though the extended delocalized aromatic π
electron system of photosensitizers allows efficient light absorption, the same π electron system
may favor π-π stacking and hydrophobic interactions, therefore forming aggregates in aqueous
media. One the one hand, hydrophobicity is a desirable characteristic of PS to improve their
affinity to lipid bilayers, as already pointed out in Chapter 2. On the other hand, this feature
leads to a poor water solubility, contributing to its aggregation tendency (Brown, Shillcock, and
Jones 1976). This affects the bioavailability of the photosensitizer and hampers its ROS
generation ability, causing a reduction of the PDT efficiency. Thus, attempts have been made
to create suitable carrier systems that can transport photosensitizers in a stable monomeric form
without altering their spectroscopic properties, without decreasing their activity, and without
causing toxicity.
Most of the delivery systems are based on nanostructures such as liposomes, dendrimers
and polymers. Polymeric micelles have been shown to have a good PDT outcome because of
their targeting ability and pharmacokinetic functions, which can be controlled by their
composition, size, surface charge, morphology and hydrophobicity (Avci, Sibel Erdem, and
Hamblin 2014; Lucky, Soo, and Zhang 2015; Chatterjee, Fong, and Zhang 2008). Typically,
polymeric micelles are formed by self-assembly of amphiphilic block copolymers, in which the
inner core holds hydrophobic compounds and the hydrophilic shell provides protection of
loaded drugs from the external environment.
Among various biocompatible polymer blocks used to form the inner core of micelles
that are also occurring naturally, the most commonly used is poly(amino acids) (Khan et al.
2011; Nair and Laurencin 2007). Kohn´s group has revealed the applicability of tyrosine-

Chapter 4: Enhanced PDT efficiency provided by tyrosine-derived nanospheres________
112
derived polymers with various applications in the biomedical field (e.g. bone regeneration, drug
delivery, 3D printed scaffold) due to a number of favorable properties (Bourke and Kohn 2003).
For instance, the poly(ethylene glycol)-block-oligo(desaminotyrosyltyrosine octyl ester
suberate)-block-poly(ethylene glycol) (abbreviated as PEG5K-b-oligo(DTO-SA)-b-PEG5K)
exhibits a glass transition temperature (Tg) of 21ºC which provides a sufficient flexibility of
copolymer to self-assemble into a dynamic and soluble structure under physiological conditions
(Larisa Sheihet et al. 2005; Nardin, Bolikal, and Kohn 2004). Also, PEG5K-b-oligo(DTO-SA)-
b-PEG5K (also named Tyrospheres or Tyrosine-derived nanospheres) presents a significantly
low critical aggregation concentration (cac ~ 0.26 µg/mL at 37ºC) (Larisa Sheihet et al. 2005;
Nardin, Bolikal, and Kohn 2004) when compared with other polymeric micelles commercially
available, as for example F127 (cac ~ 0.025 g/L at 35ºC) and P123 (cac ~ 0.001 g/L at 35ºC)
(Alexandridis, Holzwarth, and Hatton 1994). This implies that Tyrosine-derived nanospheres
are very stable upon strong dilution, a desirable feature in case intravenous administration and
distribution in the blood volume. Because the advantages that Tyrospheres offer (i.e.
biodegrability, biocompatibility, high loading capacity, easily micellize yielding, extremely
stable micelles), we consider them very attractive as carriers for photosensitizers.
A great part of PDT treatments is directed at the treatment of superficial tumors (e.g. in
the skin) or other non-oncological skin conditions. Tyrospheres have already been patented in
USA and are used for the delivery of several drugs, including topical application methods. They
have been used for the delivery of paclitaxel (a chemotherapeutic agent), Vitamin D3 and
Betamethasone dipropionate (for treatment of psoriasis) (Kilfoyle et al. 20012; Kilfoyle 2011).
The authors showed that Tyrospheres deliver twice the amount of active substance to the
epidermis than commercially available cream (Batheja et al. 2011; Kilfoyle et al. 20012). This
may probably be, because tyrosine-derived nanospheres facilitate the transport of lipophilic
substances to deeper layers of skin (L. Sheihet et al. 2008).

________Chapter 4: Enhanced PDT efficiency provided by tyrosine-derived nanospheres
113
Together with the advantages of Tyrospheres, mentioned above, we were encouraged to
investigate the possibility of the use of Tyrospheres as nanocarriers for amphiphilic
photosensitizers (CisDiMPyP and TPPS2a).
4.2. METHODOLOGY
4.2.1. Preparation of photosensitizer-loaded TyroSpheres
Photosensitizers were encapsulated in tyrosine-derived nanospheres (Tyrospheres) by a
self-assembly technique according to previously established protocols (L. Sheihet et al. 2008;
Larisa Sheihet et al. 2012; Larisa Sheihet et al. 2007). The polymer PEG-oligo(DTO-SA)-PEG
was synthesized and gently supplied by Kohn´s group (New Jersey Center for Biomaterials –
Rutgers University). Then, 60 mg of PEG-oligo(DTO-SA)-PEG was dissolved in 400 µL
dimethylformamide (DMF) and mixed with 300 µL of 1 mg/mL photosensitizer (CisDiMPyP
or TPPS2a) in DMF. This solution was added drop-wise to 14.3 mL of deionized water under
constant stirring. The resulting suspension was passed through 0.22 μm PVDF filters and ultra-
centrifuged for 3 hours at 65,000 rpm and 18ºC. The supernatant was removed and the pellet of
nanospheres was washed twice with PBS and re-suspended in 1 mL PBS at 25ºC, diluted to 3
mL using PBS, and filtered again through 0.22 μm PVDF filters (L. Sheihet et al. 2008; Larisa
Sheihet et al. 2012; Larisa Sheihet et al. 2007).
4.2.2. Characterization of photosensitizer-loaded TyroSpheres
The nanospheres containing PS were characterized by their particle size, size distribution,
zeta potential, and binding and loading efficiency. The hydrodynamic diameters and
polydispersity index of the Tyrospheres with or without porphyrins were obtained using
dynamic light scattering, as previously described (L. Sheihet et al. 2008). The stability of the
nanosphere size was monitored also by dynamic light scattering (DLS) as a function of the time,

Chapter 4: Enhanced PDT efficiency provided by tyrosine-derived nanospheres________
114
whereas time zero is just after the Tyrosphere preparation. To determine binding and loading
efficiency a predetermined aliquot (50 μL) of PS-loaded Tyrosphere suspension was dissolved
in 2 mL methanol. The absorbance spectrum of PS extracted from polymer was measured using
UV-Vis spectrophotometer and values of binding and loading efficiency were calculated by
equation 4.1 and 4.2 (Larisa Sheihet et al. 2007; L. Sheihet et al. 2008).
𝐵𝑖𝑛𝑑𝑖𝑛𝑔 𝐸𝑓𝑓𝑖𝑐𝑖𝑒𝑛𝑐𝑦 =Amount of PS in TyroSpheres
Amount of PS in Initial Feed 𝑥 100% (Equation 4.1)
𝐿𝑜𝑎𝑑𝑖𝑛𝑔 𝐸𝑓𝑓𝑖𝑐𝑖𝑒𝑛𝑐𝑦 =Amount of PS in TyroSpheres
Amount of Polymer in TyroSpheres 𝑥 100% (Equation 4.2)
Mean value ± SD were acquired from three independent experiments with at least 3 identical
samples in each experiment (n=9).
4.2.3. Photophysical properties of PS-loaded Tyrospheres
The absorption spectrum of PS-Tyrospheres was recorded at room temperature for the
wavelength range of 350 to 700 nm using a Shimadzu UV2401-PC spectrophotometer. The
fluorescence emission spectrum and resonant light scattered (RLS) were registered on a Varian
Cary Eclipse spectrofluorimeter. For the fluorescence emission experiments spectra were
recorded in the 600-800 nm range, using an excitation wavelength of 515 nm, excitation slit
5 nm and emission slit 10 nm. Absorbance values of samples and reference solutions were kept
below 0.1 at the excitation wavelength, to avoid inner filter effects. Fluorescence quantum
yields (ϕF) of porphyrins in methanol were calculated by measuring the area under the emission
spectrum and comparison with TPPS4 in methanol (ϕF = 0.16)(Basu 1991) as standard (equation
4.3) (D’Souza et al. 2015).
𝜙𝐹𝑃𝑆 =
𝐹𝑃𝑆 . 𝜂𝑆𝑡𝑑2
𝐹𝑆𝑡𝑑 . 𝜂𝑃𝑆2 . 𝜙𝐹
𝑆𝑡𝑑 Equation 4.3

________Chapter 4: Enhanced PDT efficiency provided by tyrosine-derived nanospheres
115
Where F is the fluorescence spectrum area, η is the refraction index and ϕF is the
fluorescence quantum yield. The symbols reported as subscript represent the standard (Std) and
photosensitizer (PS).
RLS spectra were obtained at wavelengths from 200 to 800 nm with Δλ = 0 nm
(synchronous mode), excitation and emission slits 2.5 nm. RLS spectra of PS-Tyrospheres were
subtracted by RLS spectra of empty-Tyrospheres to eliminate the scattering signal from
Tyrosine-derived nanospheres. Quartz cuvettes with a path length of 1.0 cm were used for all
measurements and all experiments were performed at room temperature.
4.2.4. Singlet oxygen generation of PS-loaded Tyrospheres
A home-made setup for singlet oxygen luminescence detection was implemented by
Edinburgh Instruments. It consists of a time resolved near-infrared fluorimeter with a
Hamamatsu R55009 photomultiplier cooled to -80ºC. Laser excitation was performed with a
Nd:YAG coupled to an OPO (Quantel laser Brilliant, 3W, Rainbow OPOTEC) set to 515 nm,
delivering 5 ns pulses at 10 Hz, with a pulse energy of 2 mJ/pulse. Decays were obtained with
a MSA_300 and spectra were obtained with an Edinburgh Instruments acquisition with F900
software. The singlet oxygen quantum yield (ϕ∆) of porphyrins in methanol was determined
using TPPS4 in methanol (ϕ∆ = 0.70) as reference (R W Redmond and Gamlin 1999), while ϕ∆
of porphyrins in PBS and Tyrospheres was calculated using TPPS4 in 2% Triton X-100 (ϕ∆ =
0.80) (R W Redmond and Gamlin 1999) as standard (equation 4.4) (Kempa et al. 2015). All
photosensitizer (in solution or suspension) had an absorbance of 0.3 at 515 nm to ensure the
same number of photons absorbed for all samples.
𝜙𝛥𝑃𝑆 =
𝐼𝑃𝑆
𝐼𝑆𝑡𝑑 . 𝜙𝛥
𝑆𝑡𝑑 Equation 4.4

Chapter 4: Enhanced PDT efficiency provided by tyrosine-derived nanospheres________
116
I is the maximum phosphorescence intensity of the singlet oxygen decay curve and ϕΔ is
the singlet oxygen quantum yield. Symbols as subscript refer to the standard (Std) and
photosensitizer (PS).
4.2.5. Time-resolved fluorescence measurements in aqueous media
Time-resolved fluorescence measurements were performed by time-correlated single-
photon counting (TCSPC) using a TimeHarp 260 PICO board (PicoQuant, Berlin, Germany).
The samples were excited with a 405 nm picosecond pulsed diode laser (LDH-P-C-405,
PicoQuant, Berlin, Germany) and the emission was detected with a long-pass filter 630LP. For
data analysis, the SymPhoTime64 software version 2 1 3813 was used. The fluorescence
lifetimes (τF) were obtained by deconvolution fitting.
4.2.6. Fluorescence lifetime imaging (FLIM) in living cells
The time-resolved luminescence imaging of HeLa cells incubated 3 hours with 1 μM
porphyrins (free or encapsulated) was acquired using a MicroTime 200 time-resolved confocal
fluorescence microscope (PicoQuant, Berlin, Germany) was used, which consists of an inverted
microscope (IX 73, Olympus) equipped with an Olympus UPlanSApo 60 × /NA 1.2 water
immersion objective. A pulsed diode laser (LDH-P-C-405, PicoQuant, Berlin, Germany)
operating at 405 nm with a pulse width of <64 ps was used as an excitation source. For the
separation of luminescence and rejection of the excitation light, a long-pass filter 630LP was
used.
4.2.7. Subcellular localization
HeLa cells (1x10⁵ cells/well at 6-well plate) were incubated with porphyrins (1μM in
DMEM supplemented with 1% FSB) for 3 hours at 37ºC, 5% CO2. DAPI, MitoTracker® Green

________Chapter 4: Enhanced PDT efficiency provided by tyrosine-derived nanospheres
117
FM and LysoTracker® Green DND-26 were used as probes for nuclei, mitochondria and
lysosomes, respectively. MitoTracker® Green FM (150 nM) and LysoTracker® Green DND-
26 (150 nM) were added after 150 minutes of PS-incubation, and then the cells were incubated
for another 30 min. Microscope slides were placed with ready-to-use Prolong Diamond
Antifade Mountant with DAPI and analyzed under confocal microscope (ZeissTM Axiovert 200
LSM 510 Laser and Confocor Modules). Porphyrin fluorescence images were then recorded
using a 514 nm laser for excitation and a bandpass filter, 600-800 nm, for emission. Note:
excitation/emission of MitoTracker® Green and LysoTracker® Green were 488 nm /505-530
nm, and that of DAPI was 358 nm/460 nm. Fluorescence images were obtained using a confocal
Zeiss (LSM 510). Images were analyzed using Image J software. The calculation of the
colocalization between photosensitizer and organelle-probe was performed by Manders overlay
coefficient (MOC) plugin from Image J.
4.2.8. Acridine orange and propidium iodide double staining
After 3 and 48 hours of PDT, cells were washed with PBS and incubated with AO/PI
solution (1µg/mL each dye in PBS) for 10 minutes, at 5% CO2 and 37ºC (Abdel Wahab et al.
2009) Images were acquired with a fluorescence microscope Axiovert 200 (Carl Zeiss),
equipped with Zeiss Filter Set 09, which provides excitation in the 450-490 nm range and
emission above 515nm. The ImageJ software was used to separate the green channel from the
red channel in each micrograph and quantify the red and green fluorescence intensity of AO/PI
double staining. Then, the ratio between red and green fluorescence of micrographs (AO/PI
double staining assays) was calculated by analyzing at least four different images from random
areas covering several cells of two independent experiments.

Chapter 4: Enhanced PDT efficiency provided by tyrosine-derived nanospheres________
118
4.2.9. Cellular uptake of PS-loaded Tyrospheres in HeLa cells
HeLa cells were seeded in a 12-well plate and incubated in DMEM (1% (v/v) FBS), 5%
CO2 at 37ºC for 18 hours for attachment to the wells. Next, PS-loaded Tyrospheres were added
(the final concentration of PS in the cell culture medium was 5 µM) and the cells kept for 3
hours in the dark. After this period, the supernatant solution was diluted 1:1 (v/v) with 10%
(v/v) Triton X-100, while the adhered cells were washed using PBS buffer and lysed in 5%
(v/v) Triton X-100. In this case, Triton X-100 was used to solubilize cell membrane and the PS.
The absorption spectra of supernatant and cell lysate were recorded and the PS uptake in cells
was estimated using equation 4.5.(9)
% 𝑈𝑝𝑡𝑎𝑘𝑒 = 100 . 𝐴𝑏𝑠𝑐
(𝐴𝑏𝑠𝑐)+(2𝑥 𝐴𝑏𝑠𝑠) Equation 4.5
Where Absc is the absorbance intensity of the porphyrin in the cell lysate and Abss is the
absorbance intensity of porphyrin in the supernatant. A correction factor of 2 was required to
Abss due a 2-fold dilution of the suspension. At least two independent experiments were
performed in triplicate (n=6).
4.2.10. Phototoxicity of PS-loaded Tyrospheres in HeLa cells
Cells (2.8x10⁴ cells/well) were seeded in a 48-well plate and incubated for 18 hours for
attachment to the wells. Then, the cells were treated with the porphyrin TPPS2a-loaded
TyroSpheres and CisDiMPyP-loaded TyroSpheres in DMEM (1% (v/v) FBS) for 3 hours in the
dark, at 5% CO2 and 37ºC. Next, the HeLa cells were washed twice with PBS and submitted to
irradiation in 300 µL PBS for 15 min using a light emitting diode system (LED), emitting at
522 ± 20 nm, with final light dose of 2.1 J/cm2. After irradiation, the cells were washed again
with PBS and DMEM (1% (v/v) FBS) was added. The cells were then kept for 48 hours in the
dark, at 5% CO2 and 37ºC. The cell survival was determined by the 3-(4,5-dimethylthiazol-2-
yl)-2,5-diphenyltetrazolium bromide (MTT) method (Meerloo, Kaspers, and Cloos 2011). The

________Chapter 4: Enhanced PDT efficiency provided by tyrosine-derived nanospheres
119
cells were incubated with 0.15 mg/mL of MTT for 2 hours at5% CO2 and 37ºC. The formed
crystals were solubilized in dimethyl sulfoxide (DMSO) and quantified by absorption
measurement at 550 nm using a TECAN Infinite M200 plate reader. The percentage of viable
cells was calculated relative to the absorbance of the control cells (taken as 100% viability).
Mean values ± standard deviation was acquired from two independent experiments, with 3
replicates per each experiment (n=6).
The values of PDT efficiency (ηPDT) was calculated as indicated by equation 4.6:
𝑃𝐷𝑇 𝑒𝑓𝑓𝑖𝑐𝑖𝑒𝑛𝑐𝑦 (ηPDT) =% 𝑆𝑢𝑟𝑣𝑖𝑣𝑎𝑙 𝑐𝑒𝑙𝑙𝑠
[𝑃𝑆] 𝑖𝑛𝑐𝑜𝑟𝑝𝑜𝑟𝑎𝑡𝑒𝑑 𝑖𝑛 𝑐𝑒𝑙𝑙𝑠 Equation 4.6
4.2.11. Statistical analysis
To perform comparative statistical analysis, we analyzed statistical differences by a student’s
t-test or one-way ANOVA using GraphPrism 5.0 software. Data was obtained from at least two
independent experiments (n = 6) and expressed as mean values ± standard deviation (SD). As
statistically significant, we considered P-values lower than 0.05 (*), lower than 0.01 (**) and
lower than 0.001 (***).
4.3. RESULTS AND DISCUSSION
4.3.1. Properties of PS-loaded Tyrospheres
The same amphiphilic porphyrins as studied in Chapter 3 (i.e. CisDiMPyP and TPPS2a)
were used for encapsulation in tyrosine-based triblock copolymer (see polymer structure in
Figure 4.1) and formation of nanospheres. The preparation method of the PS-loaded
Tyrospheres depends on the self-assembly of the tyrosine-derived copolymer in aqueous
solution in such a way that the use of external stabilizers is not required, since the amphiphilic
characteristic of PEG-oligo(DTO-SA)-PEG is able to stabilize the nanospheres (Zhang et al.
2014; Goyal, Macri, and Kohn 2015).

Chapter 4: Enhanced PDT efficiency provided by tyrosine-derived nanospheres________
120
Figure 4.1. Tyrosine-derived, ABA-type poly(ethylene glycol)-b-oligo(desaminotyrosyl-
tyrosine octyl ester suberate)-b-poly(ethylene glycol) triblock copolymer (PEG-oligo(DTO-
SA)-PEG) used in the preparation of Tyrospheres.
The average hydrodynamic diameter of the produced nanospheres was measured by
dynamic light scattered (DLS). A range of 60-70 nm with low polydispersity index (~ 0.2) –
Table 4.1 was determined. The zeta potential (ξ) of the Tyrospheres was approximately zero
(Table 4.1) confirming a neutral surface charge of Tyrospheres due the presence of PEG on the
out shell (Larisa Sheihet et al. 2012; Goyal, Macri, and Kohn 2015). The characterization of the
nanospheres showed that neither the presence of the photosensitizers nor their charge (positive
or negative) significantly affects the size, size distribution and surface charge of the
Tyrospheres (Table 4.1). Additionally, the stability of the nanospheres, as monitored by
changes of the size and size distribution over time, showed no significant variation within 84 h
at room temperature protected from light. This indicates that neither aggregation nor
degradation occurs under these conditions (Figure 4.2). Note that these properties of the PS-
loaded Tyrospheres are consistent with other literature reports showing that size and size
distribution of Tyrospheres (size range 60-80nm and PDI <0.25) have not been affected by
incorporation of different drugs or fluorescent compounds and that the formulation stability
may be months (Zhang et al. 2014; Zhang et al. 2013b; Larisa Sheihet et al. 2012; L. Sheihet et
al. 2008; Batheja et al. 2011).

________Chapter 4: Enhanced PDT efficiency provided by tyrosine-derived nanospheres
121
Table 4.1. Values of size, polydispersity index (PDI), zeta potential of PS-TyroSpheres,
binding and loading efficiencies.
PS-loaded TyroSpheres
Size (nm) PDI Zeta Potential
(mV)
Binding
efficiency (%)
Loading
efficiency (%)
Empty- TyroSpheres 67 ± 3 0.20 ± 0.05 -0.3 ± 0.9 ---- ----
CisDiMPyP-TyroSpheres 63 ± 3 0.17 ± 0.04 -1.2 ± 0.7 70 ± 6 0.55 ± 0.09
TPPS2a-Tyrospheres 63 ± 4 0.16 ± 0.04 -0.5 ± 1 67 ± 4 0.56 ± 0.08
Figure 4.2. (A) Size stability of Tyrospheres in function of time encapsulating none
compound (circle with solid line), CisDiMPyP (square with dashed line) and TPPS2a (triangle
with dotted line) at room temperature. (B) polydispersity index (PDI) of Tyrospheres as a
function of time, without any incorporated compound (circle with solid line), with CisDiMPyP
(square with dashed line) and TPPS2a (triangle with dotted line) at room temperature.
The amount of encapsulated PS was evaluated by quantifying binding and loading
efficiencies, which were approximately 70% and 0.5% (w/w), respectively, for both porphyrins
(Table 4.1). It is noteworthy that the binding affinity was independent of the porphyrin charge,
suggesting that the interaction between the amphiphilic photosensitizer and the polymer
depends mainly on the hydrophobic effect. In fact, studies based on computational modeling
reported that hydrophobicity and interactions such as hydrogen binding and π-π stacking are
responsible for the strong interaction between amphiphilic drugs and the tyrosine-derived
copolymer (Costache et al. 2010; Zhang et al. 2014).
A B

Chapter 4: Enhanced PDT efficiency provided by tyrosine-derived nanospheres________
122
All data together demonstrates that photosensitizers do not cause changing on the
nanosphere properties such as size, charge and stability. However, we hypothesized that
Tyrospheres may provide important alterations on the photosensitizers properties.
4.3.2. Influence of Tyrospheres on photophysical properties of PS
The photophysical parameters are of key interest to evaluate the potential of a
photosensitizer formulation aiming at a PDT application. The absorption spectra (Figure 4.3A)
show a broadening, an intensity decrease and a maximum wavelength shift of the Soret band
(400-450 nm) of both porphyrins in PBS, typical for porphyrin aggregates (Robert F Pasternack
et al. 1971; Brown, Shillcock, and Jones 1976). However, in a polar solvent (e.g. methanol) or
when encapsulated in Tyrospheres, both porphyrins present a sharp Soret band (Figure 4.3A)
indicating that molecules are mostly monomeric (Bajema, Gouterman, and Meyer 1968).
The photosensitizers showed a lower fluorescence intensity in PBS compared to methanol
and when encapsulated in Tyrospheres (Figure 4.3B). Although porphyrins exhibit low
fluorescence quantum yields (ϕF ~ 0.16) due other competitive relaxation processes (Joseph R.
Lakowicz 2006), it was possible to note that Tyrospheres provide approximately 2-fold increase
in fluorescence quantum yields (ϕF) with respect to aqueous media (Figure 4.3D). It suggests
the monomerization of compounds by encapsulation in the nanospheres.
Further evidence for porphyrin aggregation in aqueous media was found by resonance
light scattering (RLS) spectroscopy which is a technique extremely sensitive and suitable to
explore chromophore aggregation (R F Pasternack and Collings 1995). The presence of a
scattering signal, characteristic for aggregates, was detected at 457 nm and 485 nm for
CisDiMPyP and TPPS2a, respectively, in PBS (Figure 4.3C). However, after being encapsulated
in the Tyrospheres there is no more resonant light scattering in any of the porphyrins (Figure
4.3C) confirming that the Tyrospheres are able to keep photosensitizers monomeric.

________Chapter 4: Enhanced PDT efficiency provided by tyrosine-derived nanospheres
123
Figure 4.3. (A) Absorption spectrum of CisDiMPyP (5μM) and TPPS2a (3μM) in PBS
(solid line), Tyrospheres (dashed line) and methanol (dotted line). Empty Tyrospheres were

Chapter 4: Enhanced PDT efficiency provided by tyrosine-derived nanospheres________
124
used as baseline at the same concentration as the PS-loaded Tyrospheres in order to compensate
for scattered light. (B) Fluorescence emission of CisDiMPyP and TPPS2a in PBS (solid line),
Tyrospheres (dashed line) and methanol (dotted line). (C) Resonance light scattering spectrum
(RLS) of CisDiMPyP and TPPS2a in PBS (solid line), Tyrospheres (dashed line) and methanol
(dotted line). (D) Fluorescence quantum yield (ϕF) values of porphyrins in PBS, Tyrospheres
and methanol (MeOH). Bars correspond the mean ± SD and *p<0.05, **p<0.01 are considered
statistically significant.
4.3.3. Importance of Tyrospheres on singlet oxygen generation of PS
The PDT effects of PS-free and PS-loaded Tyrospheres depends on their ability to
generate singlet oxygen (1O2) (Tada and Baptista 2015; Robert W Redmond and Kochevar
2006; Tanielian, Heinfuch, and Pascal 1995). Then, in order to evaluate the impact of
Tyrospheres on photosensitizers photochemical properties, the amount and lifetime of singlet
oxygen (1O2) was quantified by the phosphorescence emission spectra. Figure 4.4A shows that
both PS, after encapsulation in Tyrospheres, exhibit a higher phosphorescence intensity at
1275nm compared to the PS in PBS. It means that the generation of singlet oxygen for the PS-
loaded Tyrospheres is higher than for the free PS in PBS. In fact, the singlet oxygen quantum
yield (ϕΔ) values were higher to PS-loaded Tyrospheres (similar to organic solvent, e.g.
methanol) than to the free ones (Figure 4.4B). This is in accordance to the previous findings
(section 4.3.2) and the literature, reporting that porphyrins are monomeric inside the
nanospheres (Ding et al. 2011; Tada et al. 2010; Tanielian, Heinfuch, and Pascal 1995).
Therefore, encapsulating porphyrins in Tyrospheres remarkably increase the efficiency in
singlet oxygen generation (1O2) compared to the free ones in aqueous media.

________Chapter 4: Enhanced PDT efficiency provided by tyrosine-derived nanospheres
125
Figure 4.4. (A) Phosphorescence emission spectrum of singlet oxygen generated by
porphyrins in aqueous media (Tyrospheres or PBS) and the insert shows the emission spectrum
of PS in methanol. (B) Singlet oxygen quantum yield (ϕΔ) for each PS in PBS, Tyrospheres and
methanol. Bars correspond the mean ± SD of at least two independent experiments and
***p<0.001 is considered statistically significant.
4.3.4. Release of PS from Tyrospheres in living cells by time-resolved luminescence
The fluorescence lifetime of photosensitizers is extremely sensitive to physicochemical
effects, such as aggregation and the interaction of the photosensitizer with a polymer coating
or cytosol in a cell. Furthermore, changes in fluorescence lifetimes indicate changes of the
photophysical parameters and may also be indicative of changes of the intersystem crossing
rate which finally affects the efficiency of the photodynamic effect (Berezin and Achilefu 2010;
Xu et al. 2015; Simon et al. 2015). Therefore, we investigated the photosensitizer fluorescence

Chapter 4: Enhanced PDT efficiency provided by tyrosine-derived nanospheres________
126
lifetimes in both aqueous solution and living cells by time correlated single photon counting
(TCSPC) and fluorescence lifetime imaging microscope (FLIM).
The fluorescence lifetime of PS-loaded Tyrospheres was 10 ns and 12 ns (to CisDiMPyP
and TPPS2a, respectively), and therefore around 2 nanoseconds longer than that of the free PS
in PBS solution (8 ns and 10 ns to CisDiMPyP and TPPS2a, respectively, Table 4.2 and Figure
4.5A). This lifetime increase upon loading in nanospheres has been attributed to the PS
disaggregation, as aggregation induces a self-quenching mechanism This data is in agreement
with literature (Ding et al. 2011; Berezin and Achilefu 2010; Yeh et al. 2014; Simon et al. 2015)
and our other results of the steady-state photophysical properties and singlet oxygen generation.
Table 4.2. Fluorescence lifetimes of porphyrins (τF) from free photosensitizers in PBS
and PS loaded Tyrospheres in aqueous media.
PS A1 τF (ns) Χ2
Free CisDiMPyP 0.6 ± 0.2 8.8 ± 0.5 0.97
TPPS2a 1.1 ± 0.2 10.4 ± 0.3 1.01
Tyrospheres
CisDiMPyP 0.42 ± 0.08 10.2 ± 0.7 1.05
TPPS2a 0.4 ± 0.2 12.3 ± 0.5 1.04
The fluorescence lifetimes in living cells showed a bi-exponential decay (Table 4.3). The
longer fluorescence lifetimes (τ1) was attributed to porphyrins since their values were close to
that one which characterized the compounds in solution (Table 4.2). The shorter lifetimes (τ2)
were designed be auto-fluorescence from cells once these values were identical to the shorter
lifetimes of control cells (without photosensitizers or with empty-Tyrospheres) – Table 4.3.
Due the fact that the interesting point for monitoring photosensitizer environment is longer
fluorescence lifetimes (τ1), it will be highlighted in the discussion.
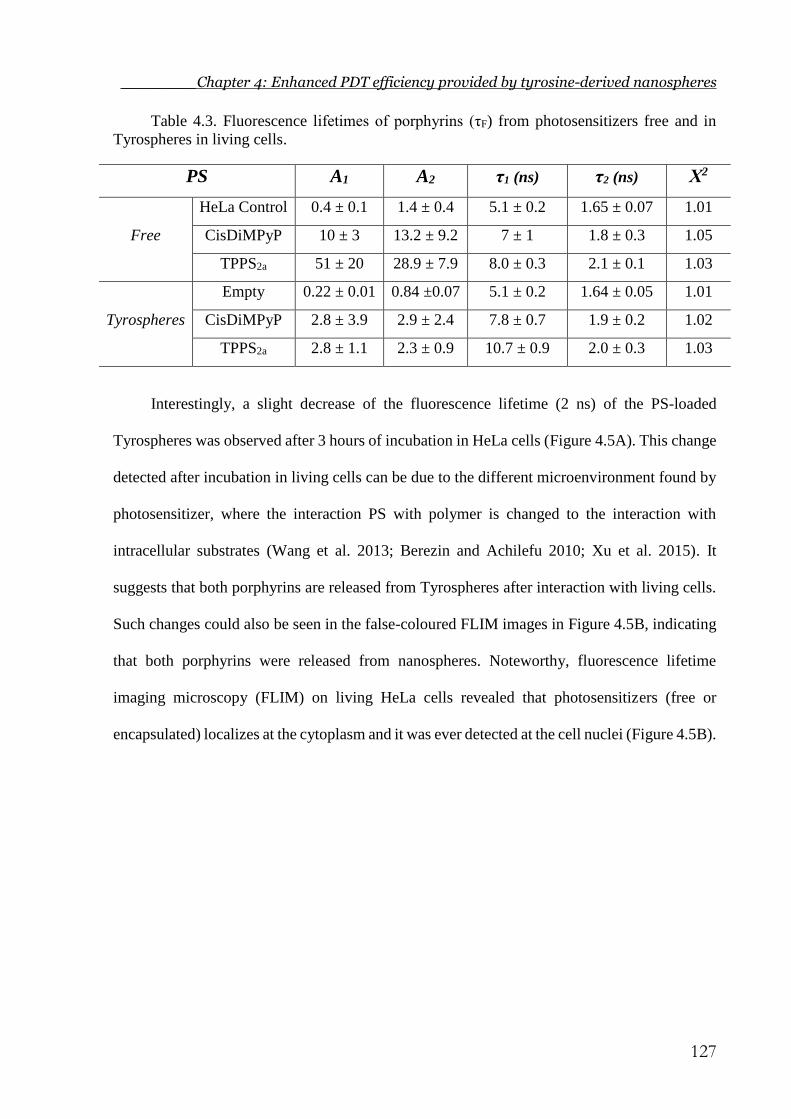
________Chapter 4: Enhanced PDT efficiency provided by tyrosine-derived nanospheres
127
Table 4.3. Fluorescence lifetimes of porphyrins (τF) from photosensitizers free and in
Tyrospheres in living cells.
PS A1 A2 τ1 (ns) τ2 (ns) Χ2
Free
HeLa Control 0.4 ± 0.1 1.4 ± 0.4 5.1 ± 0.2 1.65 ± 0.07 1.01
CisDiMPyP 10 ± 3 13.2 ± 9.2 7 ± 1 1.8 ± 0.3 1.05
TPPS2a 51 ± 20 28.9 ± 7.9 8.0 ± 0.3 2.1 ± 0.1 1.03
Tyrospheres
Empty 0.22 ± 0.01 0.84 ±0.07 5.1 ± 0.2 1.64 ± 0.05 1.01
CisDiMPyP 2.8 ± 3.9 2.9 ± 2.4 7.8 ± 0.7 1.9 ± 0.2 1.02
TPPS2a 2.8 ± 1.1 2.3 ± 0.9 10.7 ± 0.9 2.0 ± 0.3 1.03
Interestingly, a slight decrease of the fluorescence lifetime (2 ns) of the PS-loaded
Tyrospheres was observed after 3 hours of incubation in HeLa cells (Figure 4.5A). This change
detected after incubation in living cells can be due to the different microenvironment found by
photosensitizer, where the interaction PS with polymer is changed to the interaction with
intracellular substrates (Wang et al. 2013; Berezin and Achilefu 2010; Xu et al. 2015). It
suggests that both porphyrins are released from Tyrospheres after interaction with living cells.
Such changes could also be seen in the false-coloured FLIM images in Figure 4.5B, indicating
that both porphyrins were released from nanospheres. Noteworthy, fluorescence lifetime
imaging microscopy (FLIM) on living HeLa cells revealed that photosensitizers (free or
encapsulated) localizes at the cytoplasm and it was ever detected at the cell nuclei (Figure 4.5B).

Chapter 4: Enhanced PDT efficiency provided by tyrosine-derived nanospheres________
128
Figure 4.5. (A) Fluorescence lifetimes (τF) of photosensitizers (free or encapsulated)
before (solution) and after incubation (3 hours) in living HeLa cells. Box plot correspond to the
minimum and maximum values, including the mean. **p<0.01, ***p<0.001 are considered
statistically significant. (B) Fluorescence lifetime imaging microscopy (FLIM) of HeLa cells
incubated for 3 hours with CisDiMPyP (free or in Tyrospheres) and TPPS2a (free or in
Tyrospheres). λexc = 405nm and emission with filter long pass 630nm. The scale bar is 20 μm.

________Chapter 4: Enhanced PDT efficiency provided by tyrosine-derived nanospheres
129
4.3.5. Tyrospheres keeping subcellular localization and cell death mechanism of PS
Another important key parameter for the photodynamic efficiency is the PS intracellular
localization which may avoid generation of reactive oxygen species in a non-specific and
inefficient way (Oliveira et al. 2011; Deda et al. 2013). Then, we investigated the effect of
encapsulation on the specific sites of subcellular localization. For this, red fluorescence of
porphyrins was monitored with green fluorescence of organelle-probe (lysosomes or
mitochondria) by confocal fluorescence images (Figure 4.6A and Figure 4.6B) and the percent
values of colocalization were calculated (Figure 4.6C).
Results demonstrate that Tyrospheres do not influence the intracellular localization with
respect to free compounds. CisDiMPyP and CisDiMPyP-loaded TyroSpheres accumulate two
times more (M/L = 1.9 ± 0.1 for free and M/L = 1.9 ± 0.3 to Tyrospheres) in mitochondria than
lysosomes while TPPS2a and TPPS2a-loaded TyroSpheres localize two times more
(M/L = 0.76 ± 0.05 for free and M/L = 0.55 ± 0.05 to Tyrospheres) in lysosomes than in
mitochondria (Figure 4.6D-left). Therefore, the accumulation tendency of the free PS is partly
maintained. However, the total percentage of PS localized in lysosomes or mitochondria (M+L
in Figure 4.6D-right) of the free photosensitizers is considerably higher compared to the
Tyrospheres incorporated PS (M+L decreases from 58% ± 4 to 31% ± 4 and from 69% ± 4 to
45% ± 3 in the case of CisDiMPyP and TPPS2a, respectively).
The influence of Tyrospheres on the mechanism of cell death was investigated using
acridine orange (AO) and propidium iodide (PI) assays (Figure 4.7). Results demonstrate that
cells treated with CisDiMPyP-loaded TyroSpheres had dead cells stained with PI (white arrow)
3 hours after PDT (Figure 4.7) suggesting necrosis/apoptosis as mechanism of cell death (David
Kessel and Luo 1998; Oleinick, Morris, and Belichenko 2002). Forty-eight hours after PDT,
treatment with TPPS2a-loaded TyroSpheres indicated an increased amount of red fluorescence
(blue arrow) which represent enhancement of acids organelles (Figure 4.7). Contrast between

Chapter 4: Enhanced PDT efficiency provided by tyrosine-derived nanospheres________
130
treatments has been clearly on bars graph suggesting cell death related to autophagy due the
larger amount of acids organelles (Du et al. 2014; Lihuan et al. 2014). Similar results were
observed to the free form of PS (discussed in Chapter 3) revealing that encapsulating process
do not alter cell death mechanism induced by PS. This is not a surprise once the subcellular
localization was also kept even after encapsulation.

________Chapter 4: Enhanced PDT efficiency provided by tyrosine-derived nanospheres
131
Figure 4.6. (A) Confocal fluorescence microscopy images of HeLa cells with blue
fluorescence of nucleus (DAPI), red fluorescence of CisDiMPyP encapsulated in Tyrospheres

Chapter 4: Enhanced PDT efficiency provided by tyrosine-derived nanospheres________
132
and green fluorescence of organelle-probe (MitoTracker® or LysoTracker®). Right column
shows the overlay from three channels (blue, red and green). Scale bar corresponds to 20 µm.
(B) Confocal fluorescence microscopy images of HeLa cells with blue fluorescence of nucleus
(DAPI), red fluorescence of TPPS2a encapsulated in Tyrospheres and green fluorescence of
organelle-probe (MitoTracker® or LysoTracker®). Right column shows the overlay from three
channels (blue, red and green). Scale bar corresponds to 20 µm (C) Bars correspond to the mean
± SD from calculated percent of colocalization between red fluorescence of porphyrins and
green fluorescence of organelle-probe to each case (porphyrin free or encapsulated in
Tyrospheres). (D) On left: Bars represent the mean ± SD of the mitochondria and lysosomes
ratio (M/L) to each porphyrin (free and encapsulated in Tyrospheres). On right: Bars represent
the mean ± SD of total percentage of localization in lysosomes and mitochondria (% M+L) to
each porphyrin (free and encapsulated in Tyrospheres). *p<0.05, **p<0.01, ***p<0.001 are
considered statistically significant.
Figure 4.7. (A) Micrographs obtained 3 and 48 hours after PDT in HeLa cells treated
without porphyrins (control), incubated with 100 nM CisDiMPyP-loaded Tyrospheres or with
30 nM TPPS2a-loaded Tyrospheres, using AO/PI double staining. Scale bar of 20 µm. (B) Bars
represent red and green fluorescence ratio from micrographs of HeLa cells 48 hours after PDT
with PS-loaded Tyrospheres. ***p<0.001 are considered statistically significant.
4.3.6. Tyrospheres providing enhanced photodynamic activity of PS
The cellular uptake of porphyrins in the free form and loaded in Tyrospheres was
measured in HeLa cells after 3 hours of incubation. PS-loaded Tyrospheres presented reduced
uptake (6-fold lower to CisDiMPyP and 4-fold lower to TPPS2a) with respect to free compounds
(Figure 4.8A). This result suggests that cellular interaction and uptake occur by different
mechanism for photosensitizer free and encapsulated in Tyrospheres. The reduced PS uptake
in cells upon incorporation in nanospheres has also been observed in other similar experimental
systems (Deda et al. 2013; Silva et al. 2016).

________Chapter 4: Enhanced PDT efficiency provided by tyrosine-derived nanospheres
133
Phototoxicity was measured 48h post-irradiation in cells incubated for 3 hours with PS-
free or PS-loaded Tyrospheres. None of the PS (encapsulated or free) showed cytotoxicity in
the dark under similar experimental conditions (Figure 4.8B). The photoinduced cell death
gradually increased in a concentration dependent manner for both porphyrins in the free form
and incorporated in Tyrospheres (Figure 4.8B). The PS-loaded Tyrospheres seem to result in a
similar cell killing efficiency than PS-free (Figure 4.8B). However, this initial interpretation of
the raw data does not reflect the amount of PS that is actually internalized in each condition.
Therefore, considering the value of incorporated porphyrin, the calculated PDT efficiencies
(ηPDT) (Figure 4.8C) increased for both photosensitizers (3-fold to CisDiMPyP and 5-fold to
TPPS2a) after encapsulated in Tyrospheres (Figure 4.8C). This indicates that PS-loaded
Tyrospheres have a larger phototoxic effect compared to the same amount of free PS. It seems
to be not related to tyrosine-derived nanospheres cytotoxicity, since empty-Tyrospheres have
not shown any cytotoxic effects (Figure 4.9).
We therefore demonstrate an enhanced PDT activity of PS-loaded Tyrospheres in HeLa
cells in comparison to free PS. The Tyrospheres are able to improve photophysical properties,
the generation of singlet oxygen and release their cargo into the intracellular environment,
preserving the biological consequences of each photosensitizer.

Chapter 4: Enhanced PDT efficiency provided by tyrosine-derived nanospheres________
134
Figure 4.8. (A) Uptake of free phorphyrins or encapsulated in Tyrospheres after 3 hours
of incubation in HeLa cells. Porphyrins 5 µM and 5x10⁴ cells/cm2 in DMEM culture medium
1% FBS. Bars represent the mean ± SD of at least two independent experiments (***p<0.001
are considered statistically significant). (B) Percentage of surviving cells, 48 hours after PDT
as a function of PS (free or encapsulated) concentration, determined by MTT. Each point
represents the mean ± SD of at least three independent experiments. Incubation of HeLa cells
with porphyrins for 3 hours in DMEM with 1% FBS in the dark. Following the incubation the
samples were irradiated in PBS using a LED system emitting at 522±20nm, light dose of 2.1
J/cm2. (C) Bars correspond to the mean ± SD of PDT efficiencies (ηPDT) for each photosensitizer
(free or encapsulated) in the LC50 corrected by their respective cellular uptake levels
(***p<0.001 are considered statistically significant).

________Chapter 4: Enhanced PDT efficiency provided by tyrosine-derived nanospheres
135
Figure 4.9. Cell viability of HeLa cells incubated for 3 hours with empty-TyroSpheres
under the same conditions used to fabricate PS-loaded Tyrospheres.
4.4. CONCLUSION
This work evaluates potential application of Tyrospheres as a nanocarrier system for
photosensitizers used in Photodynamic Therapy (PDT). PS-loaded Tyrospheres form stable
nanospheres with identical structure and stability compared to unloaded ones. Tyrosine-derived
nanospheres provide greatly enhanced physical-chemical properties of both CisDiMPyP and
TPPS2a, improving their photophysical properties and causing a large increase in the yield of
singlet oxygen generation. Fluorescence lifetime image microscopy (FLIM) suggests that
photosensitizers are released from nanospheres inside cells, allowing their distribution in
mitochondria and lysosome as the same way that free porphyrins. Also, PS-loaded Tyrospheres
presented similar characteristics of cell death to free porphyrins as already discussed in Chapter
3, confirming that Tyrospheres do not change the subcellular localization neither biological
consequences. Interesting, in addition to keeping subcellular localization and cell death
mechanism, the PDT efficiencies (ηPDT) to PS-loaded Tyrospheres were larger compared to the
free compounds demonstrating a significant improvement in the photoactivity efficiency. All
data together indicate the great potential of Tyrospheres in Photodynamic Therapy as
nanocarrier and their role to improve photophysical properties, increase singlet oxygen
generation, keep biological consequences and enhance photodynamic efficiency of the
photosensitizers.


CHAPTER 5
CONCLUSION AND FUTURE PERSPECTIVE
A general conclusion of the work described in
previous chapters as well as suggestions for future
work are given in this chapter.


__________________________ Chapter 5: Conclusion and future perspective
139
5. CONCLUSION AND FUTURE PERSPECTIVE
PDT has been receiving substantial attention of the academic and industrial communities,
aiming at the development of new applications in medicine and correlated fields (cosmetics,
veterinary, etc). Even though several photosensitizers have been tested and approved by
regulatory agencies for the treatment of oncological and non-oncological diseases, PDT
treatments are still not prominent in routine clinical practice and less known than well-
established treatments (e.g. chemotherapy, radiotherapy, surgery). It is not an easy task to prove
the medical benefits of PDT compared to conventional treatments, when commercial interests
are in place. In fact, pharmaceutical companies, favor to sell medicines alone instead of selling
medicines together with photons. This thesis provides new insights on the molecular level
about strategies to enhance the PDT efficiency. One of the main strategies is to maximize the
intrinsic efficiency of the photosensitizers to make to protocols more accurate and reliable. This
thesis provides some insights at molecular level (not clinical or in vivo) about strategies to
enhance the PDT efficiency.
Chapter 2 was dedicated to an in-depth study of the importance of the molecular
amphiphilicity of differently charged PS to achieve a high degree of PS-membrane interaction.
Most notably, it was found that the negatively-charged amphiphilic molecule (TPPS2a) was also
able to interact efficiently with negative membranes – which has previously been assumed to
rather be a property of positively-charged amphiphilic molecules. It is probable that, in the case
of amphiphilic molecules, the main forces driving PS-membrane interaction involve the
hydrophobic and dipolar interactions and not only electrostatics. Overall, the efficiency of
membrane photodamage exhibits a good correlation with the ability of the PS binding to
membranes. The order of photodamage efficiency in the studied molecules was: CisDiMPyP >
TPPS2a > PpNetNI > AlPcS2a. The two best PS in terms of binding/photodamage (CisDiMPyP
and TPPS2a) were selected for further investigations on eukaryotic cells.

Chapter 5: Conclusion and future perspective __________________________
140
In Chapter 3, we demonstrated that the cell killing efficiency of TPPS2a is larger than
CisDiMPyP, even the cellular uptake and the membrane binding efficiency of TPPS2a is lower.
This was intriguing because previous results from our and other labs had confirmed that the
efficiency of membrane binding and of intracellular accumulation was correlated with the
efficiency of cell, tissue and animal killing. The detailed studied of the intracellular damage
caused by TPPS2a and CisDiMPyP confirmed that the first target mainly lysosomes and the last
mitochondria. Therefore, our data indicates that lysosome is a better intracellular target than
mitochondria. By studying the mechanisms of cell death, it is shown that the lysosome damage
caused by photoactivation of TPPS2a triggers cell death associated to autophagy in a long-term
response compared to the acute promptly mitochondria damage, which results in the classical
apoptotic/necrotic cell death. Our data therefore question two important concepts in PDT: (i)
higher ability of PS-membrane interaction causes stronger phototoxicity and (ii) mitochondria
is the most efficient target to induce photoinduce cell killing. Moreover, LC50 values exhibited
in this work was on the nanomolar magnitude, while known PS molecules found in literature
are on the order of micromolar.
Since cancer cells can upregulate autophagy to survive under metabolic and
microenvironmental stress, the inhibition of autophagy pathway can be crucial and strategical
to improve results of therapies (White 2015). Thus, we have found that photodamaging
lysosomes impair the autophagic flux removing the ability of cytoprotection and decreases the
ability of cells to survive and proliferate in a more efficient way than a more acute damage in
mitochondria.
Another technology based on photosensitized oxidations, which is named Photochemical
Internalization (PCI), also uses endosomes/lysosomes as target of photosensitizers (Selbo et al.
2010; Norum et al. 2009). Usually, photosensitizers used in PCI are negatively-charged
amphiphilic molecules such as TPPS2a in order to release chemotherapeutics, proteins, acid

__________________________ Chapter 5: Conclusion and future perspective
141
nucleic or other macromolecules with inefficient ability to escape of lysosomes (Figure 5.1).
The enhanced efficiency of PCI is attributed to the delivery of these compounds from lysosomes
to cytosol avoiding their degradation inside lysosomes (Figure 5.1). However, our data showed
that an enhanced PDT effect can be observed only by the fact of using a lysosomal-
photosensitizer (in this case TPPS2a) due to impairment of autophagy after lysosome
photodamage. Therefore, future works could elucidate if cell death associated to autophagy
could be correlated to the better efficacy observed in PCI protocols.
Figure 5.1. Schematic illustration of the PCI process. Reprinted with permission from
Elsevier (Norum et al. 2009).
In Chapter 4, it was demonstrated the use of polymeric nanospheres made by tyrosine-
derived polymer also increase the efficiency in PDT. In fact, Tyrospheres kept photosensitizers
in a monomeric form, upgrading their photophysical properties and causing a large increase in
the singlet oxygen generation when compared to free photosensitizers. Because of this, a
significant improvement in the photoactivity efficiency was observed.
It was clear that using Tyrospheres as nanocarriers improve the photodynamic efficacy,
however it still needs to be understood how Tyrospheres delivery PS into cells. Although this
type of ABA-type amphiphilic triblock copolymers that self-assemble into nanospheres were

Chapter 5: Conclusion and future perspective __________________________
142
intentionally designed to degrade via the hydrolysis of ester bonds, experimental data have
already demonstrated that there is no degradation of the polymer in the presence of enzymes
(e.g. carboxylesterase) that cleave carboxylic ester, thioester and amine ester linkages (Kilfoyle
2011). Then, future works could explain how occurs the release mechanism of Tyrospheres.

143
6. REFERENCES
Abdel Wahab, Siddig Ibrahim, Ahmad Bustamam Abdul, Adel Sharaf Alzubairi, Manal
Mohamed Elhassan, and Syam Mohan. 2009. “In Vitro Ultramorphological Assessment
of Apoptosis Induced by Zerumbone on (HeLa).” Journal of Biomedicine and
Biotechnology 2009. doi:10.1155/2009/769568.
Abounit, Kadija, Tiziano M Scarabelli, and Roy B Mccauley. 2012. “Autophagy in
Mammalian Cells.” World Journal of Biological Chemistry 3 (1): 1–6.
doi:10.4331/wjbc.v3.i1.TOPIC.
Agholme, Lotta, Maria Agnello, Patrizia Agostinis, Julio a Aguirre-ghiso, Hyung Jun Ahn,
Ouardia Ait-mohamed, Jay E Brenman, et al. 2012. “Guidelines for the Use and
Interpretations of Assays for Monitoring Autophagy.” Autophagy 8 (4): 445–544.
Agostinis, Patrizia, Esther Buytaert, Hilde Breyssens, and Nico Hendrickx. 2004. “Regulatory
Pathways in Photodynamic Therapy Induced Apoptosis.” Photochemical &
Photobiological Sciences : Official Journal of the European Photochemistry Association
and the European Society for Photobiology 3 (8): 721–29. doi:10.1039/b315237e.
Alexandridis, Paschalis, Josef F Holzwarth, and T Alan. Hatton. 1994. “Micellization of
Poly(ethylene Oxide)-Poly(propylene Oxide)-Poly(ethylene Oxide) Triblock
Copolymers in Aqueous Solutions: Thermodynamics of Copolymer Association.”
Macromolecules 27 (9): 2414–25. doi:10.1021/ma00087a009.
Ali, Hasrat, and Johan E van Lier. 1999. “Metal Complexes as Photo- and Radiosensitizers.”
Chemical Reviews 99 (9): 2379–2450. doi:10.1021/cr980439y.
Ambroz, M, A Beeby, Aj Macrobert, Msc Simpson, Rk Svensen, and D Phillips. 1991.
“Preparative, Analytical and Fluorescence Spectroscopic Studies of Sulfonated
Aluminum Phthalocyanine Photosensitizers.” J Photochem Photobiol B: Biol 9: 87–95.
http://discovery.ucl.ac.uk/84806/.
Andrzejak, Michelle, Michael Price, and David H. Kessel. 2011. “Apoptotic and Autophagic
Responses to Photodynamic Therapy in 1c1c7 Murine Hepatoma Cells.” Autophagy 7
(9): 979–84. doi:10.4161/auto.7.9.15865.
Angelova, Miglena I, and Dimiter S Dimitrov. 1986. “Liposome Electro Formation.” Faraday
Discuss. Chem. SO 81: 303–11.
Ashkenazi, Avi, and Vishva M Dixit. 1998. “Death Receptors: Signaling and Modulation.”
Science (New York, N.Y.) 281 (5381): 1305–8. doi:10.1126/science.281.5381.1305.
Auler, H., and G. Banzer. 1942. “Untersuchungen Über Die Rolle Der Porphyrine Bei
Geschwulstkranken Menschen Und Tieren.” Z. Krebsforsch. 53: 65–72.
Avci, Pinar, S. Sibel Erdem, and Michael R. Hamblin. 2014. “Photodynamic Therapy: One
Step Ahead with Self-Assembled Nanoparticles.” Journal of Biomedical
Nanotechnology 10 (9): 1937–52. doi:10.1166/jbn.2014.1953.
Babilas, Philipp, Stephan Schreml, Michael Landthaler, and Rolf Markus Szeimies. 2010.
“Photodynamic Therapy in Dermatology: State-of-the-Art.” Photodermatology
Photoimmunology and Photomedicine 26 (3): 118–32. doi:10.1111/j.1600-
0781.2010.00507.x.
Bacellar, Isabel O L, Christiane Pavani, Elisa M. Sales, Rosangela Itri, Mark Wainwright, and
Mauricio S. Baptista. 2014. “Membrane Damage Efficiency of Phenothiazinium
Photosensitizers.” Photochemistry and Photobiology 90: 801–13.
doi:10.1111/php.12264.
Bacellar, Isabel O L, Tayana M Tsubone, Christiane Pavani, and Mauricio S Baptista. 2015.
“Photodynamic Efficiency : From Molecular Photochemistry to Cell Death,” 20523–59.
doi:10.3390/ijms160920523.

144
Bajema, Larry, Martin Gouterman, and Beat Meyer. 1968. “Spectra of Porphyrins.” Journal
of Molecular Spectroscopy 27: 225–35. doi:10.1016/0022-2852(68)90032-5.
Baptista, Mauricio S, Jean Cadet, Paolo Di Mascio, Ashwini A. Ghogare, Alexander Greer,
Michael R. Hamblin, Caroline Lorente, et al. 2017. “Type I and II Photosensitized
Oxidation Reactions: Guidelines and Mechanistic Pathways.” Photochemistry and
Photobiology 38 (1): 42–49. doi:10.1111/php.12716.
Basu, Sekbar. 1991. “Fluorescence Enhancement of Tetrakis (Sulfonatophenyl) Porphyrin in
Homogeneous and Micellar Solutions.” J Photochem Photobiol A:Chem 56: 339–47.
Batheja, Priya, Larisa Sheihet, Joachim Kohn, Adam J. Singer, and Bozena Michniak-Kohn.
2011. “Topical Drug Delivery by a Polymeric Nanosphere Gel: Formulation
Optimization and in Vitro and in Vivo Skin Distribution Studies.” Journal of Controlled
Release 149 (2). Elsevier B.V.: 159–67. doi:10.1016/j.jconrel.2010.10.005.
Beesoo, Rima, Vidushi Neergheen-Bhujun, Ranjeet Bhagooli, and Theeshan Bahorun. 2014.
“Apoptosis Inducing Lead Compounds Isolated from Marine Organisms of Potential
Relevance in Cancer Treatment.” Mutation Research 768 (March). Elsevier B.V.: 84–97.
doi:10.1016/j.mrfmmm.2014.03.005.
Ben Amor, T, L Bortolotto, and G Jori. 2000. “Porphyrins and Related Compounds as
Photoactivatable Insecticides. 3. Laboratory and Field Studies.” Photochemistry and
Photobiology 71 (2): 124–28. doi:10.1562/0031-
8655(2000)071<0124:SIPPAR>2.0.CO;2.
Berezin, M Y, and S Achilefu. 2010. “Fluorescence Lifetime Measurements and Biological
Imaging.” Chem. Rev. 110 (5): 2641–84. doi:10.1021/cr900343z.
Berg, K., and J. Moan. 1994. “Lysosomes as Photochemical Targets.” International Journal
of Cancer 59 (6): 814–22. doi:10.1002/ijc.2910590618.
Berg, Kristian, André Western, Jerry C Bommer, and Johan Moan. 1990. “Intracellular
Localization of Sulfonated Meso-Tetraphenylporphines in a Human Carcinoma Cell
Line.” Photochemistry and Photobiology 52 (3). Blackwell Publishing Ltd: 481–87.
doi:10.1111/j.1751-1097.1990.tb01789.x.
Biswas, Swati, Preeti Kumari, Prit Manish Lakhani, and Balaram Ghosh. 2016. “Recent
Advances in Polymeric Micelles for Anti-Cancer Drug Delivery.” European Journal of
Pharmaceutical Sciences 83: 184–202. doi:10.1016/j.ejps.2015.12.031.
Bjørkøy, Geir, Trond Lamark, Serhiy Pankiv, Aud Øvervatn, Andreas Brech, and Terje
Johansen. 2009. “Chapter 12 Monitoring Autophagic Degradation of p62/SQSTM1.”
Methods in Enzymology 451 (C): 181–97. doi:10.1016/S0076-6879(08)03612-4.
Bonnett, Raymond. 1995. “Photosensitizers of the Porphyrin and Phthalocyanine Series for
Photodynamic Therapy.” Chemical Society Reviews.
Bourke, Sharon L, and Joachim Kohn. 2003. “P Olymers Derived from the Amino Acid L -
Tyrosine : Polycarbonates , Polyarylates and Copolymers with Poly ( Ethylene Glycol ).”
Advanced Drug Delivery Reviews 55: 447–66.
Boya, P, and G Kroemer. 2008. “Lysosomal Membrane Permeabilization in Cell Death.”
Oncogene 27: 6434–51. doi:10.1038/onc.2008.310.
Bressler, Neil M, and Susan B Bressler. 2000. “Photodynamic Therapy with Verteporfin
(Visudyne): Impact on Ophthalmology and Visual Sciences.” Iovs 41 (3): 624–28.
Brown, S B, M Shillcock, and P Jones. 1976. “Equilibrium and Kinetic Studies of the
Aggregation of Porphyrins in Aqueous Solution.” The Biochemical Journal 153 (2):
279–85.
http://www.pubmedcentral.nih.gov/articlerender.fcgi?artid=1172573&tool=pmcentrez&r
endertype=abstract.
Buchholz, Julia, Barbara Kaser-Hotz, Tania Khan, Carla Rohrer Bley, Katja Melzer, Reto A.
Schwendener, Malgorzata Roos, and Heinrich Walt. 2005. “Optimizing Photodynamic

145
Therapy: In Vivo Pharmacokinetics of Liposomal Meta-(Tetrahydroxyphenyl) Chlorin in
Feline Squamous Cell Carcinoma.” Clinical Cancer Research 11 (20): 7538–44.
doi:10.1158/1078-0432.CCR-05-0490.
Buytaert, Esther, Geert Callewaert, Nico Hendrickx, Luca Scorrano, Dieter Hartmann,
Ludwig Missiaen, Jackie R Vandenheede, Ingeborg Heirman, Johan Grooten, and
Patrizia Agostinis. 2006. “Role of Endoplasmic Reticulum Depletion and Multidomain
Proapoptotic BAX and BAK Proteins in Shaping Cell Death after Hypericin-Mediated
Photodynamic Therapy.” The FASEB Journal 20 (6): 756–58. doi:10.1096/fj.05-4305fje.
Buytaert, Esther, Michael Dewaele, and Patrizia Agostinis. 2007. “Molecular Effectors of
Multiple Cell Death Pathways Initiated by Photodynamic Therapy.” Biochimica et
Biophysica Acta - Reviews on Cancer 1776 (1): 86–107.
doi:10.1016/j.bbcan.2007.07.001.
Cadet, J, and P D Mascio. 2006. “Peroxides in Biological Systems.” The Chemistry of
Peroxides, Parts 1&2 2: 915–1000.
Caetano, Wilker, Paula S. Haddad, Rosangela Itri, Divinomar Severino, Vinicius C. Vieira,
Mauricio S. Baptista, André P. Schröder, and Carlos M. Marques. 2007. “Photo-Induced
Destruction of Giant Vesicles in Methylene Blue Solutions.” Langmuir 23 (17): 1307–
14. doi:10.1021/la061510v.
Castano, Ana P., Tatiana N. Demidova, and Michael R. Hamblin. 2004. “Mechanisms in
Photodynamic Therapy: Part One - Photosensitizers, Photochemistry and Cellular
Localization.” Photodiagnosis and Photodynamic Therapy 1 (2004): 279–93.
doi:10.1016/S1572-1000(05)00007-4.
Castano, Ana Paula, Tatiana N. Demidova, and Michael R. Hamblin. 2005. “Mechanisms in
Photodynamic Therapy: Part Two - Cellular Signaling, Cell Metabolism and Modes of
Cell Death.” Photodiagnosis and Photodynamic Therapy 2 (1 SPEC. ISS.): 1–23.
doi:10.1016/S1572-1000(05)00030-X.
Chang, Hsin-I, and Ming-Kung Yeh. 2012. “Clinical Development of Liposome-Based
Drugs: Formulation , Characterization , and Therapeutic Efficacy.” International Journal
of Nanomedicine 7: 49–60.
Chatterjee, Dev Kumar, Li Shan Fong, and Yong Zhang. 2008. “Nanoparticles in
Photodynamic Therapy: An Emerging Paradigm.” Advanced Drug Delivery Reviews 60
(15): 1627–37. doi:10.1016/j.addr.2008.08.003.
Cirman, Tina, Kristina Orešić, Gabriela Droga Mazovec, Vito Turk, John C. Reed, Richard
M. Myers, Guy S. Salvesen, and Boris Turk. 2004. “Selective Disruption of Lysosomes
in HeLa Cells Triggers Apoptosis Mediated by Cleavage of Bid by Multiple Papain-like
Lysosomal Cathepsins.” Journal of Biological Chemistry 279 (5): 3578–87.
doi:10.1074/jbc.M308347200.
Conniot, João, Joana M Silva, Joana G Fernandes, Liana C Silva, Rogério Gaspar, Steve
Brocchini, Helena F Florindo, and Teresa S Barata. 2014. “Cancer Immunotherapy:
Nanodelivery Approaches for Immune Cell Targeting and Tracking.” Frontiers in
Chemistry 2 (November): 105. doi:10.3389/fchem.2014.00105.
Cordeiro, Rodrigo M, Ronei Miotto, and Maurício S Baptista. 2012. “Photodynamic
Efficiency of Cationic Meso-Porphyrins at Lipid Bilayers: Insights from Molecular
Dynamics Simulations.” The Journal of Physical Chemistry. B 116 (50): 14618–27.
doi:10.1021/jp308179h.
Costache, Aurora D, Larisa Sheihet, Krishna Zaveri, Doyle D Knight, and Joachim Kohn.
2010. “Polymer-Drug Interactions in Tyrosine-Derived Triblock Copolymer
Nanospheres: A Computational Modeling Approach.” Mol Pharm 6 (5): 1620–27.
doi:10.1021/mp900114w.Polymer-Drug.
D’Souza, Sarah, Reama George, Meltem Göksel, Devrim Atilla, Mahmut Durmuş, and

146
Tebello Nyokong. 2015. “Enhanced Triplet State Yields in Aqueous Media of
Asymmetric Zinc Phthalocyanines When Conjugated to Silver Nanoflowers.”
Polyhedron 100: 296–302. doi:10.1016/j.poly.2015.08.017.
Darwent, James R., Peter Douglas, Anthony Harriman, George Porter, and Marie-Claude
Richoux. 1982. “Metal Phthalocyanines and Porphyrins as Photosensitizers for
Reduction of Water to Hydrogen.” Coordination Chemistry Reviews 44: 83–126.
Davies, Michael J. 2003. “Singlet Oxygen-Mediated Damage to Proteins and Its
Consequences.” Biochemical and Biophysical Research Communications 305 (3): 761–
70. doi:10.1016/S0006-291X(03)00817-9.
Deda, Daiana K., Christiane Pavani, Eduardo Caritá, Maurício S. Baptista, Henrique E. Toma,
and Koiti Araki. 2013. “Control of Cytolocalization and Mechanism of Cell Death by
Encapsulation of a Photosensitizer.” Journal of Biomedical Nanotechnology 9 (8): 1307–
17. doi:10.1166/jbn.2013.1614.
Derosa, Maria C, and Robert J Crutchley. 2002. “Photosensitized Singlet Oxygen and Its
Applications” 234.
Dewaele, Michael, Wim Martinet, Noemí Rubio, Tom Verfaillie, Peter a. de Witte, Jacques
Piette, and Patrizia Agostinis. 2011. “Autophagy Pathways Activated in Response to
PDT Contribute to Cell Resistance against ROS Damage.” Journal of Cellular and
Molecular Medicine 15 (6): 1402–14. doi:10.1111/j.1582-4934.2010.01118.x.
Ding, Huiying, Baran D. Sumer, Chase W. Kessinger, Ying Dong, Gang Huang, David A.
Boothman, and Jinming Gao. 2011. “Nanoscopic Micelle Delivery Improves the
Photophysical Properties and Efficacy of Photodynamic Therapy of Protoporphyrin IX.”
Journal of Controlled Release 151 (3): 271–77. doi:10.1016/j.jconrel.2011.01.004.
Dini, Luciana, Valentina Inguscio, Bernardetta Tenuzzo, and Elisa Panzarini. 2010. “Rose
Bengal Acetate Photodynamic Therapy-Induced Autophagy.” Cancer Biology and
Therapy 10 (10): 1048–56. doi:10.4161/cbt.10.10.13371.
Dolmans, Dennis E. J. G. J., Dai Fukumura, and Rakesh K. Jain. 2003. “Photodynamic
Therapy for Cancer.” Nature Reviews. Cancer 3 (May): 380–87. doi:10.1038/nrc1070.
Dougherty, T J, G B Grindey, R Fiel, K R Weishaupt, and D G Boyle. 1975. “Photoradiation
Therapy. II. Cure of Animal Tumors With Hematoporphyrin and Light.” Journal of the
National Cancer Institute 55 (1): 115–21. doi:10.1093/jnci/55.1.115.
Dougherty, Thomas J., Charles J. Gomer, Barbara W. Henderson, Giulio Jori, David Kessel,
Mladen Korbelik, Johan Moan, and Quian Peng. 1998. “Photodynamic Therapy.”
Journal of the National Cancer Institute 90 (12): 889–905.
Du, Lihuan, Ning Jiang, Guozeng Wang, Yiwei Chu, Wei Lin, Jing Qian, Yuanfang Zhang,
Jingcun Zheng, and Gang Chen. 2014. “Autophagy Inhibition Sensitizes Bladder Cancer
Cells to the Photodynamic Effects of the Novel Photosensitizer Chlorophyllin e4.”
Journal of Photochemistry and Photobiology B: Biology 133. Elsevier B.V.: 1–10.
doi:10.1016/j.jphotobiol.2014.02.010.
Dummin, H., Th Cernay, and H. W. Zimmermann. 1997. “Selective Photosensitization of
Mitochondria in HeLa Cells by Cationic Zn(II)phthalocyanines with Lipophilic Side-
Chains.” Journal of Photochemistry and Photobiology B: Biology 37 (3): 219–29.
doi:10.1016/S1011-1344(96)07416-7.
Engelmann, Fabio M., Ildemar Mayer, Dino S. Gabrielli, Henrique E. Toma, Alicia J.
Kowaltowski, Koiti Araki, and Mauricio S. Baptista. 2007. “Interaction of Cationic
Meso-Porphyrins with Liposomes, Mitochondria and Erythrocytes.” Journal of
Bioenergetics and Biomembranes 39: 175–85. doi:10.1007/s10863-007-9075-0.
Engelmann, Fábio M., S. V O Rocha, Henrique E. Toma, Koiti Araki, and Maurício S.
Baptista. 2007. “Determination of N-Octanol/water Partition and Membrane Binding of
Cationic Porphyrins.” International Journal of Pharmaceutics 329: 12–18.

147
doi:10.1016/j.ijpharm.2006.08.008.
Ezzeddine, Rima, Anwar Al-Banaw, Artak Tovmasyan, James D Craik, Ines Batinic-Haberle,
and Ludmil T Benov. 2013. “Effect of Molecular Characteristics on Cellular Uptake,
Subcellular Localization, and Phototoxicity of Zn(II) N-Alkylpyridylporphyrins.” The
Journal of Biological Chemistry 288 (51): 36579–88. doi:10.1074/jbc.M113.511642.
Fabris, Clara, Giuliana Valduga, Giovanni Miotto, Lara Borsetto, Giulio Jori, Spiridione
Garbisa, and Elena Reddi. 2001. “Photosensitization with Zinc (II) Phthalocyanine as a
Switch in the Decision between Apoptosis and Necrosis.” Cancer Research 61: 7495–
7500.
Finsen, N. R. 1901. Phototherapy. Edward Arnold, London,.
Foote, Christopher S. 1987. “Type I and Type II Mechanisms of Photodynamic Action.” In
Light-Activated Pesticides. ACS Symposium Series, Chapter 2:22–38. doi:10.1021/bk-
1987-0339.ch002.
———. 1991. “Definition of Type I and Type II Photosensitized Oxidation.” Photochemistry
and Photobiology 54 (5): 659. doi:10.1111/j.1751-1097.1991.tb02071.x.
Foote, Christopher S. 1968a. “Mechanisms of Photosensitized Oxidation.” Sciences-New York
162 (3857): 963–70.
———. 1968b. “Photosensitized Oxygenations and the Role of Singlet Oxygen.” Accounts of
Chemical Research 1 (6): 104–10. doi:10.1021/ar50004a002.
Frankel, E. N. 1984. “Chemistry of Free Radical and Singlet Oxidation of Lipids.” Progress
in Lipid Research 23 (4): 197–221. doi:10.1016/0163-7827(84)90011-0.
Franken, Nicolaas a P, Hans M Rodermond, Jan Stap, Jaap Haveman, and Chris van Bree.
2006. “Clonogenic Assay of Cells in Vitro.” Nature Protocols 1 (5): 2315–19.
doi:10.1038/nprot.2006.339.
Frohlich, Eleonore. 2012. “The Role of Surface Charge in Cellular Uptake and Cytotoxicity
of Medical Nanoparticles.” International Journal of Nanomedicine 7: 5577–91.
doi:10.2147/IJN.S36111.
Garapati, Chandrasekhar, Brandon Clarke, Steven Zadora, Charles Burney, Brent D.
Cameron, Ronald Fournier, Reginald F. Baugh, and Sai H S Boddu. 2015. “Development
and Characterization of Erythrosine Nanoparticles with Potential for Treating Sinusitis
Using Photodynamic Therapy.” Photodiagnosis and Photodynamic Therapy 12 (1).
Elsevier B.V.: 9–18. doi:10.1016/j.pdpdt.2015.01.005.
Garg, A. D.;, H.; Maes, E.; Romano, and P. Agostinis. 2015. “Autophagy, a Major Adaptation
Pathway Shaping Cancer Cell Death and Anticancer Immunity Responses Following
Photodynamic Therapy.” Photochemical & Photobiological Sciences 14. Royal Society
of Chemistry: 1410–24. doi:10.1039/C4PP00031E.
Gerola, Adriana P., Amanda Santana, Polyana B. França, Tayana M. Tsubone, Hueder P M
De Oliveira, Wilker Caetano, Elza Kimura, and Noboru Hioka. 2011. “Effects of Metal
and the Phytyl Chain on Chlorophyll Derivatives: Physicochemical Evaluation for
Photodynamic Inactivation of Microorganisms.” Photochemistry and Photobiology 87:
884–94. doi:10.1111/j.1751-1097.2011.00935.x.
Gerola, Adriana P., Tayana M. Tsubone, Amanda Santana, Hueder P M De Oliveira, Noboru
Hioka, and Wilker Caetano. 2011. “Properties of Chlorophyll and Derivatives in
Homogeneous and Microheterogeneous Systems.” Journal of Physical Chemistry B 115:
7364–73. doi:10.1021/jp201278b.
Girotti, Albert W. 2001. “Photosensitized Oxidation of Membrane Lipids: Reaction Pathways,
Cytotoxic Effects, and Cytoprotective Mechanisms.” Journal of Photochemistry and
Photobiology B: Biology 63: 103–13. doi:10.1016/S1011-1344(01)00207-X.
Glick, Danielle, Sandra Barth, and Kay F Macleod. 2010. “Autophagy: Cellular and
Molecular Mechanisms.” Journal of Pathology 221 (1): 3–12.

148
doi:10.1002/path.2697.Autophagy.
Goyal, Ritu, Lauren Macri, and Joachim Kohn. 2015. “Formulation Strategy for the Delivery
of Cyclosporine A: Comparison of Two Polymeric Nanospheres.” Scientific Reports 5
(August). Nature Publishing Group: 13065. doi:10.1038/srep13065.
Gump, Jacob M., and Andrew Thorburn. 2011. “Autophagy and Apoptosis: What Is the
Connection?” Trends in Cell Biology 21 (7). Elsevier Ltd: 387–92.
doi:10.1016/j.tcb.2011.03.007.
Hackbarth, S., J. Schlothauer, A. Preuß, C. Ludwig, and B. Röder. 2012. “Time Resolved
Sub-Cellular Singlet Oxygen Detection - Ensemble Measurements versus Single Cell
Experiments.” Laser Physics Letters 9 (6): 474–80. doi:10.7452/lapl.201110146.
Hackbarth, Steffen, Jan Schlothauer, Annegret Preu??, and Beate R??der. 2010. “New
Insights to Primary Photodynamic Effects - Singlet Oxygen Kinetics in Living Cells.”
Journal of Photochemistry and Photobiology B: Biology 98 (3). Elsevier B.V.: 173–79.
doi:10.1016/j.jphotobiol.2009.11.013.
Henderson, B W, and T J Dougherty. 1992. “How Does Photodynamic Therapy Work?”
Photochemistry and Photobiology 55 (1): 145–57. doi:10.1111/j.1751-
1097.1992.tb04222.x.
Hirsch, T, J Xiang, D T Chao, S J Korsmeyer, J F Scaife, A Colell, A Morales, et al. 1998.
“Caspases: Enemies Within.” Science 281 (August): 1312–16.
doi:10.1126/science.281.5381.1312.
Horobin, Richard W, Jc Stockert, and H Rashid-Doubell. 2015. “Uptake and Localization
Mechanisms of Fluorescent and Colored Lipid Probes. Part 3. Protocols for Predicting
Intracellular Localization of Lipid Probes Using QSAR Models.” Biotechnic &
Histochemistry 90 (4): 255–63. doi:10.3109/10520295.2010.515489.
Hoye, Adam T., Jennifer E. Davoren, Peter Wipf, Mitchell P. Fink, and Valerian E. Kagan.
2008. “Targeting Mitochondria.” Accounts of Chemical Research 41 (1): 87–97.
doi:10.1021/ar700135m.
Itri, Rosangela, Helena C. Junqueira, Omar Mertins, and Maurício S. Baptista. 2014.
“Membrane Changes under Oxidative Stress: The Impact of Oxidized Lipids.”
Biophysical Reviews 6 (1): 47–61. doi:10.1007/s12551-013-0128-9.
Jensen, Timothy J., M. Graça H Vicente, Raymond Luguya, Jolanna Norton, Frank R.
Fronczek, and Kevin M. Smith. 2010. “Effect of Overall Charge and Charge Distribution
on Cellular Uptake, Distribution and Phototoxicity of Cationic Porphyrins in HEp2
Cells.” Journal of Photochemistry and Photobiology B: Biology 100 (2). Elsevier B.V.:
100–111. doi:10.1016/j.jphotobiol.2010.05.007.
Jia, Xiao, and Lee Jia. 2012. “Nanoparticles Improve Biological Functions of Phthalocyanine
Photosensitizers Used for Photodynamic Therapy.” Current Drug Metabolism 13 (8):
1119–22. doi:10.2174/138920012802850074.
Jori, Giulio, and Stanley B Brown. 2004. “Photosensitized Inactivation of Microorganisms.”
Photochemical & Photobiological Sciences 3 (5): 403–5. doi:10.1039/b311904c.
Joseph R. Lakowicz. 2006. Principles of Fluorescence Spectroscopy.
Juzeniene, Asta, Petras Juzenas, Vladimir Iani, and Johan Moan. 2002. “Topical Application
of 5-Aminolevulinic Acid and Its Methylester, Hexylester and Octylester Derivatives:
Considerations for Dosimetry in Mouse Skin Model.” Photochemistry and Photobiology
76 (3): 329–34. doi:10.1562/0031-8655(2002)076<0329:TAOAAA>2.0.CO;2.
Kandela, Rawati K, Jeremy a Bartlett, and Guilherme L Indig. 2002. “Effect of Molecular
Structure on the Selective Phototoxicity of Triarylmethane Dyes towards Tumor Cells.”
Photochemical & Photobiological Sciences : Official Journal of the European
Photochemistry Association and the European Society for Photobiology 1 (5): 309–14.
doi:10.1039/b110572h.

149
Karayianni, Maria, and Stergios Pispas. 2016. “Self-Assembly of Amphiphilic Block
Copolymers in Selective Solvents.” In Fluorescence Studies of Polymer Containing
Systems, 16:27–64. doi:10.1007/978-3-319-26788-3.
Kempa, Marta, Patrycja Kozub, Joseph Kimball, Marcin Rojkiewics, Piotr Kus, Zugmunt
Gryczynski, and Alicja Ratuszna. 2015. “Physicochemical Properties of Potential
Porphyrin Photosensitizers for Photodynamic Therapy.” Spectrochimica Acta Part A :
Molecular and Biomolecular Spectroscopy 146: 249–54.
Kennedy, J. C., R. H. Pottier, and D. C. Pross. 1990. “Photodynamic Therapy with
Endogenous Protoporphyrin. IX: Basic Principles and Present Clinical Experience.”
Journal of Photochemistry and Photobiology, B: Biology 6 (1–2): 143–48.
doi:10.1016/1011-1344(90)85083-9.
Kepp, Oliver, Lorenzo Galluzzi, Marta Lipinski, Junying Yuan, and Guido Kroemer. 2011.
“Cell Death Assays for Drug Discovery.” Nature Reviews. Drug Discovery 10 (3).
Nature Publishing Group: 221–37. doi:10.1038/nrd3373.
Kessel, D. 1986. “Proposed Structure of the Tumor-Localizing Fraction of HPD
(Hematoporphyrin Derivative).” Photochemistry and Photobiology 44 (2): 193–96.
http://www.ncbi.nlm.nih.gov/pubmed/2946048.
Kessel, D., and Y. Luo. 2001. “Intracellular Sites of Photodamage as a Factor in Apoptotic
Cell Death.” Journal of Porphyrins and Phthalocyanines 5 (2): 181–84.
doi:10.1002/jpp.331.
Kessel, D, and M Castelli. 2001. “Evidence That Bcl-2 Is the Target of Three Photosensitizers
That Induce a Rapid Apoptotic Response.” Photochemistry and Photobiology 74 (2):
318–22. doi:10.1562/0031-8655(2001)074<0318:ETBITT>2.0.CO;2.
Kessel, David. 2015. “Autophagic Death Probed by Photodynamic Therapy.” Autophagy 11
(10): 1941–43. doi:10.1080/15548627.2015.1078960.
Kessel, David H., Michael Price, and John J. Reiners. 2012. “ATG7 Deficiency Suppresses
Apoptosis and Cell Death Induced by Lysosomal Photodamage.” Autophagy 8 (9):
1333–41. doi:10.4161/auto.20792.
Kessel, David, and John J Reiners Jr. 2007. “Apoptosis and Autophagy After Mitochondrial
or Endoplasmic Reticulum,” no. 13: 1024–28.
Kessel, David, and Yu Luo. 1998. “Mitochondrial Photodamage and PDT-Induced
Apoptosis.” Journal of Photochemistry and Photobiology B: Biology 42: 89–95.
doi:10.1016/S1011-1344(97)00127-9.
Kessel, David, and John J Reiners. 2002. “Apoptotic Response to Photodynamic Therapy
versus the Bcl-2 Antagonist HA14-1.” Photochemistry and Photobiology 76 (3): 314–19.
doi:10.1562/0031-8655(2002)076<0314:ARTPTV>2.0.CO;2.
Kessel, David, Paul Thompson, B Musselman, and C K Chang. 1987. “Chemistry of
Hematoporphyrin-Derived Photosensitizers.” Photochemistry and Photobiology 46 (5):
0–5.
Kessel, David, M. Graça H Vicente, and John J. Reiners. 2006. “Initiation of Apoptosis and
Autophagy by Photodynamic Therapy.” Autophagy 2 (4): 289–90.
doi:10.1002/lsm.20334.
Khan, Wahid, Saravanan Muthupandian, Shady Farah, Neeraj Kumar, and Abraham J. Domb.
2011. “Biodegradable Polymers Derived from Amino Acids.” Macromolecular
Bioscience 11 (12): 1625–36. doi:10.1002/mabi.201100324.
Kiesslich, Tobias, Juergen Berlanda, Kristjan Plaetzer, Barbara Krammer, and Frieder Berr.
2007. “Comparative Characterization of the Efficiency and Cellular Pharmacokinetics of
Foscan- and Foslip-Based Photodynamic Treatment in Human Biliary Tract Cancer Cell
Lines.” Photochemical & Photobiological Sciences : Official Journal of the European
Photochemistry Association and the European Society for Photobiology 6 (6): 619–27.

150
doi:10.1039/b617659c.
Kilfoyle, Brian E. 2011. “Tyrosine-Derived Nanoparticles for the Topical Treatment of
Psoriasis.”
Kilfoyle, Brian E., Larissa Sheihet, Zheng Zhang, Marissa Laohoo, Joachim Kohn, and
Bonzena B. Michniak-Kohn. 20012. “Development of Paclitaxel-Tyrospheres for
Topical Skin Treatment.” Journal of Controlled Release 163 (1): 18–24.
doi:10.1016/j.immuni.2010.12.017.Two-stage.
Klionsky, D, Lotta Agholme, Maria Agnello, Patrizia Agostinis, Julio A Aguirre-ghiso,
Hyung Jun Ahn, Ouardia Ait-mohamed, et al. 2016. “Guidelines for the Use and
Interpretation of Assays for Monitoring Autophagy.” Autophagy 8 (April): 445–544.
doi:10.4161/auto.19496.
Knop, Katrin, Anne-Françoise Mingotaud, Naram El-Akra, Frédéric Violleau, and Jean-Pierre
Souchard. 2009. “Monomeric Pheophorbide(a)-Containing Poly(ethyleneglycol-B-E-
Caprolactone) Micelles for Photodynamic Therapy.” Photochemical & Photobiological
Sciences 8: 396–404. doi:10.1039/b811248g.
Köhler, Barbara, Sergio Anguissola, Caoimhin G. Concannon, Markus Rehm, Donat Kögel,
and Jochen H M Prehn. 2008. “Bid Participates in Genotoxic Drug-Induced Apoptosis of
HeLa Cells and Is Essential for Death Receptor Ligands’ Apoptotic and Synergistic
Effects.” PLoS ONE 3 (7). doi:10.1371/journal.pone.0002844.
Lassalle, Henri Pierre, Dominique Dumas, Susanna Gräfe, Marie Ange D’Hallewin, François
Guillemin, and Lina Bezdetnaya. 2009. “Correlation between in Vivo Pharmacokinetics,
Intratumoral Distribution and Photodynamic Efficiency of Liposomal mTHPC.” Journal
of Controlled Release 134 (2). Elsevier B.V.: 118–24. doi:10.1016/j.jconrel.2008.11.016.
Li, Buhong, Eduardo H. Moriyama, Fugang Li, Mark T. Jarvi, Christine Allen, and Brian C.
Wilson. 2007. “Diblock Copolymer Micelles Deliver Hydrophobic Protoporphyrin IX
for Photodynamic Therapy.” Photochemistry and Photobiology 83 (6): 1505–12.
doi:10.1111/j.1751-1097.2007.00194.x.
Lihuan, Du, Zheng Jingcun, Jiang Ning, Wang Guozeng, Chu Yiwei, Lin Wei, Qian Jing,
Zhang Yuanfang, and Chen Gang. 2014. “Photodynamic Therapy with the Novel
Photosensitizer Chlorophyllin F Induces Apoptosis and Autophagy in Human Bladder
Cancer Cells.” Lasers in Surgery and Medicine 46 (4): 319–24. doi:10.1002/lsm.22225.
Lucky, Sasidharan Swarnalatha, Khee Chee Soo, and Yong Zhang. 2015. “Nanoparticles in
Photodynamic Therapy.” Chemical Reviews 115 (4): 1990–2042.
doi:10.1021/cr5004198.
Luo, Y, C K Chang, and D Kessel. 1996. “Rapid Initiation of Apoptosis by Photodynamic
Therapy.” Photochemistry and Photobiology 63 (4): 528–34.
doi:10.1006/bbrc.1996.0547.
Maiti, Nakul C., Shyamalava Mazumdar, and N. Periasamy. 1998. “J- and H-Aggregates of
Porphyrin−Surfactant Complexes: Time-Resolved Fluorescence and Other Spectroscopic
Studies †.” The Journal of Physical Chemistry B 102 (97): 1528–38.
doi:10.1021/jp9723372.
Martins, W.K., E.T. Costa, R. Miotto, R.M. Cordeiro, and M.S. Baptista. 2015. “Parallel
Damage in the Mitochondrial and Lysosome Membranes Leads to Autophagic Cell
Death.” Scientific Reports 5. Nature Publishing Group: 1–17. doi:10.1038/srep12425.
Martins, Waleska K., Divinomar Severino, Cleidiane Souza, Beatriz S. Stolf, and Maurício S.
Baptista. 2013. “Rapid Screening of Potential Autophagic Inductor Agents Using
Mammalian Cell Lines.” Biotechnology Journal 8: 730–37. doi:10.1002/biot.201200306.
Meerloo, Johan Van, Gertjan J L Kaspers, and Jacqueline Cloos. 2011. “Cell Sensitivity
Assay: The MTT Assay.” Methods Mol Biol. 731: 237–45. doi:10.1007/978-1-61779-
080-5.

151
Mertins, Omar, Isabel O L Bacellar, Fabrice Thalmann, Carlos M. Marques, Maurício S.
Baptista, and Rosangela Itri. 2014. “Physical Damage on Giant Vesicles Membrane as a
Result of Methylene Blue Photoirradiation.” Biophysical Journal 106 (January): 162–71.
doi:10.1016/j.bpj.2013.11.4457.
Mizushima, Noboru. 2004. “Methods for Monitoring Autophagy.” International Journal of
Biochemistry and Cell Biology 36 (12): 2491–2502. doi:10.1016/j.biocel.2004.02.005.
———. 2007. “Autophagy: Process and Function.” Genes and Development 21: 2861–73.
doi:10.1101/gad.1599207.eralize.
Mizushima, Noboru, Tamotsu Yoshimori, and Beth Levine. 2010. “Methods in Mammalian
Autophagy Research.” Cell 140: 313–26. doi:10.1016/j.cell.2010.01.028.
Mohammad, Ramzi M., Irfana Muqbil, Leroy Lowe, Clement Yedjou, Hsue Yin Hsu, Liang
Tzung Lin, Markus David Siegelin, et al. 2015. “Broad Targeting of Resistance to
Apoptosis in Cancer.” Seminars in Cancer Biology 35. Elsevier Ltd: S78–103.
doi:10.1016/j.semcancer.2015.03.001.
Mojzisova, Halina, Stéphanie Bonneau, Philippe Maillard, Kristian Berg, and Daniel Brault.
2009. “Photosensitizing Properties of Chlorins in Solution and in Membrane-Mimicking
Systems.” Photochemical & Photobiological Sciences : Official Journal of the European
Photochemistry Association and the European Society for Photobiology 8: 778–87.
doi:10.1039/b822269j.
Morton, C. A., R. M. Szeimies, A. Sidoroff, and L. R. Braathen. 2013. “European Guidelines
for Topical Photodynamic Therapy Part 1: Treatment Delivery and Current Indications -
Actinic Keratoses, Bowen’s Disease, Basal Cell Carcinoma.” Journal of the European
Academy of Dermatology and Venereology 27 (5): 536–44. doi:10.1111/jdv.12031.
Morton, Colin a, Colin a Morton, S B Brown, S B Brown, S Collins, S Collins, S Ibbotson, et
al. 2002. “Guidelines for Topical Photodynamic Therapy: Report of a Workshop of the
British Photodermatology Group.” The British Journal of Dermatology 146 (4): 552–67.
doi:10.1046/j.1365-2133.2002.04719.x.
Moser, J. G. 1998. “Definitions and General Properties of 2nd and 3rd Generation
Photosensitizers.” In Photodynamic Tumor Therapy: 2nd and 3rd Generation
Photosensitizers, 256.
Mroz, Pawel, Anastasia Yaroslavsky, Gitika B. Kharkwal, and Michael R. Hamblin. 2011.
“Cell Death Pathways in Photodynamic Therapy of Cancer.” Cancers 3 (2): 2516–39.
doi:10.3390/cancers3022516.
Murugan, Karmani, Yahya E. Choonara, Pradeep Kumar, Divya Bijukumar, Lisa C. du Toit,
and Viness Pillay. 2015. “Parameters and Characteristics Governing Cellular
Internalization and Trans-Barrier Trafficking of Nanostructures.” International Journal
of Nanomedicine 10: 2191–2206. doi:10.2147/IJN.S75615.
Nair, Lakshmi S., and Cato T. Laurencin. 2007. “Biodegradable Polymers as Biomaterials.”
Progress in Polymer Science (Oxford) 32 (8–9): 762–98.
doi:10.1016/j.progpolymsci.2007.05.017.
Nardin, Corinne, Durgadas Bolikal, and Joachim Kohn. 2004. “Nontoxic Block Copolymer
Nanospheres: Design and Characterization.” Langmuir 20 (26): 11721–25.
doi:10.1021/la0490285.
Nishiyama, Nobuhiro, and Kazunori Kataoka. 2006. “Current State, Achievements, and
Future Prospects of Polymeric Micelles as Nanocarriers for Drug and Gene Delivery.”
Pharmacology & Therapeutics 112 (3): 630–48. doi:10.1016/j.pharmthera.2006.05.006.
Nishiyama, Nobuhiro, Yuji Morimoto, Woo Dong Jang, and Kazunori Kataoka. 2009.
“Design and Development of Dendrimer Photosensitizer-Incorporated Polymeric
Micelles for Enhanced Photodynamic Therapy.” Advanced Drug Delivery Reviews 61
(4). Elsevier B.V.: 327–38. doi:10.1016/j.addr.2009.01.004.

152
Norum, Ole Jacob, Pål Kristian Selbo, Anette Weyergang, Karl Erik Giercksky, and Kristian
Berg. 2009. “Photochemical Internalization (PCI) in Cancer Therapy: From Bench
towards Bedside Medicine.” Journal of Photochemistry and Photobiology B: Biology 96
(2). Elsevier B.V.: 83–92. doi:10.1016/j.jphotobiol.2009.04.012.
Ogunsipe, Abimbola, David Maree, and Tebello Nyokong. 2003. “Solvent Effects on the
Photochemical and Fluorescence Properties of Zinc Phthalocyanine Derivatives.”
Journal of Molecular Structure 650 (1–3): 131–40. doi:10.1016/S0022-2860(03)00155-
8.
Oleinick, Nancy L, Rachel L Morris, and Irina Belichenko. 2002. “The Role of Apoptosis in
Response to Photodynamic Therapy: What, Where, Why, and How.” Photochemical &
Photobiological Sciences : Official Journal of the European Photochemistry Association
and the European Society for Photobiology 1: 1–21. doi:10.1039/b108586g.
Oliveira, Carla S., Rozane Turchiello, Alicia J. Kowaltowski, Guilherme L. Indig, and
Mauricio S. Baptista. 2011. “Major Determinants of Photoinduced Cell Death:
Subcellular Localization versus Photosensitization Efficiency.” Free Radical Biology
and Medicine 51 (4). Elsevier Inc.: 824–33. doi:10.1016/j.freeradbiomed.2011.05.023.
Olmsted, John. 1979. “Calorimetric Determinations of Absolute Fluorescence Quantum
Yields.” The Journal of Physical Chemistry 83 (20): 2581–84. doi:10.1021/j100483a006.
Ormond, Alexandra B., and Harold S. Freeman. 2013. “Dye Sensitizers for Photodynamic
Therapy.” Materials 6: 817–40. doi:10.3390/ma6030817.
Oseroff, A. R., D. Ohuoha, G. Ara, D. McAuliffe, J. Foley, and L. Cincotta. 1986.
“Intramitochondrial Dyes Allow Selective in Vitro Photolysis of Carcinoma Cells.”
Proceedings of the National Academy of Sciences of the United States of America 83
(24): 9729–33. doi:10.1073/pnas.83.24.9729.
Pankiv, Serhiy, Terje Høyvarde Clausen, Trond Lamark, Andreas Brech, Jack Ansgar Bruun,
Heidi Outzen, Aud Øvervatn, Geir Bjørkøy, and Terje Johansen. 2007. “p62/SQSTM1
Binds Directly to Atg8/LC3 to Facilitate Degradation of Ubiquitinated Protein
Aggregates by autophagy*[S].” Journal of Biological Chemistry 282 (33): 24131–45.
doi:10.1074/jbc.M702824200.
Parkash, Jai, John H Robblee, John Agnew, Esther Gibbs, Peter Collings, Robert F
Pasternack, and Julio C De Paula. 1998. “Depolarized Resonance Light Scattering by
Porphyrin and Chlorophyll a Aggregates.” Biophysical Journal 74 (January): 2089–99.
Pasternack, R F, and P J Collings. 1995. “Resonance Light Scattering: A New Technique for
Studying Chromophore Aggregation.” Science (New York, N.Y.) 269 (5226): 935–39.
doi:10.1126/science.7638615.
Pasternack, Robert F, Peter R Huber, Boyd P, G Engasser, L Francesconi, E Gibbs, P Fasella,
and G Cerio Venturo. 1971. “On the Aggregation of Meso-Substituted Water-Soluble
Porphyrins.” Journal of the American Chemical Society 669 (1968): 4511–17.
doi:10.1021/ja00768a016.
Paszko, Edyta, Carsten Ehrhardt, Mathias O. Senge, Dermot P. Kelleher, and John V.
Reynolds. 2011. “Nanodrug Applications in Photodynamic Therapy.” Photodiagnosis
and Photodynamic Therapy 8 (1): 14–29. doi:10.1016/j.pdpdt.2010.12.001.
Pavani, Christiane, Yassuko Iamamoto, and Maurício S. Baptista. 2012. “Mechanism and
Efficiency of Cell Death of Type II Photosensitizers: Effect of Zinc Chelation.”
Photochemistry and Photobiology 88 (Cm): 774–81. doi:10.1111/j.1751-
1097.2012.01102.x.
Pavani, Christiane, Adjaci F Uchoa, Carla S Oliveira, Yassuko Iamamoto, and Maurício S
Baptista. 2009. “Effect of Zinc Insertion and Hydrophobicity on the Membrane
Interactions and PDT Activity of Porphyrin Photosensitizers.” Photochemical &
Photobiological Sciences 8: 233–40. doi:10.1039/b810313e.

153
Plaetzer, Kristjan, Tobias Kiesslich, Christian Benno Oberdanner, and Barbara Krammer.
2005. “Apoptosis Following Photodynamic Tumor Therapy: Induction, Mechanisms and
Detection.” Current Pharmaceutical Design 11 (9): 1151–65.
doi:10.2174/1381612053507648.
Politzer, Ieva Ruks, Gary W. Griffin, and John L. Laseter. 1971. “Singlet Oxygen and
Biological Systems.” Chemico-Biological Interactions 3 (2): 73–93. doi:10.1016/0009-
2797(71)90088-3.
Pushpan, S K, S Venkatraman, V G Anand, J Sankar, D Parmeswaran, S Ganesan, and T K
Chandrashekar. 2002. “Porphyrins in Photodynamic Therapy - a Search for Ideal
Photosensitizers.” Current Medicinal Chemistry. Anti-Cancer Agents 2 (512): 187–207.
doi:10.2174/1568011023354137.
Raab, O. 1900. “Uber Die Wirkung Fluoreszierender Stoffe Auf Infusorien.” Zeitung Biol 39:
524–526.
Redmond, R W, and J N Gamlin. 1999. “A Compilation of Singlet Oxygen Yields from
Biologically Relevant Molecules.” Photochemistry and Photobiology 70 (4): 391–475.
doi:10.1111/j.1751-1097.1999.tb08240.x.
Redmond, Robert W, and Irene E Kochevar. 2006. “Spatially Resolved Cellular Responses to
Singlet Oxygen.” Photochemical and Photobiology 82: 1178–86. doi:10.1562/2006-04-
14-1R-874.
Reiners, J J, J a Caruso, P Mathieu, B Chelladurai, X-M Yin, and D Kessel. 2002. “Release of
Cytochrome c and Activation of pro-Caspase-9 Following Lysosomal Photodamage
Involves Bid Cleavage.” Cell Death and Differentiation 9 (9): 934–44.
doi:10.1038/sj.cdd.4401048.
Ricchelli, F. 1995. “Photophysical Properties of Porphyrins in Biological Membranes.”
Journal of Photochemistry and Photobiology B: Biology 29: 109–18. doi:10.1016/1011-
1344(95)07155-U.
Ricchelli, Fernanda, Lisa Franchi, Giovanni Miotto, Lara Borsetto, Silvano Gobbo, Peter
Nikolov, Jerry C. Bommer, and Elena Reddi. 2005. “Meso-Substituted Tetra-Cationic
Porphyrins Photosensitize the Death of Human Fibrosarcoma Cells via Lysosomal
Targeting.” International Journal of Biochemistry and Cell Biology 37 (2): 306–19.
doi:10.1016/j.biocel.2004.06.013.
Rodriguez, Myrian E., Pnig Zhang, Kashif Azizuddin, Grace B. Delos Santos, Song-mao
Chiu, Liang-yan Xue, Jeffery C. Berlin, et al. 2009. “Structural Factors and Mechanisms
Underlying the Improved Photodynamic Cell Killing with Silicon Phthalocyanine
Photosensitizers Directed to Lysosomes versus Mitochondria.” Photochemistry and
Photobiology 85 (5): 1189–1200. doi:10.1016/j.biotechadv.2011.08.021.Secreted.
Rohatgi-Mukherjee, K. K. 1978. Fundamentals of Photochemistry.
Roots, Ruth, and Shigefumi Okada. 1975. “Estimation of Life Times and Diffusion Distances
of Radicals Involved in X-Ray-Induced DNA Strand Breaks or Killing of Mammalian
Cells.” Radiation Research 64 (2): 306–20. doi:10.2307/3574267.
Rossi, Liane M, Paulo R Silva, Adjaci U Fernandes, Dayane B Tada, and Mauricio S
Baptista. 2008. “Protoporphyrin IX Nanoparticle-Carrier: Preparation, Optical Properties
and Singlet Oxygen Generation.” Langmuir 24 (21): 12534–12538.
Rouser, George, Sidney Fleischer, and Akira Yamamoto. 1970. “Two Dimensional Thin
Layer Chromatographic Separation of Polar Lipids and Determination of Phospholipids
by Phosphorus Analysis of Spots.” Lipids 5: 494–96. doi:10.1007/BF02531316.
Schlothauer, J., S. Hackbarth, and B. Röder. 2009. “A New Benchmark for Time-Resolved
Detection of Singlet Oxygen Luminescence - Revealing the Evolution of Lifetime in
Living Cells with Low Dose Illumination.” Laser Physics Letters 6 (3): 216–21.
doi:10.1002/lapl.200810116.

154
Selbo, Pål Kristian, Anette Weyergang, Anders Høgset, Ole Jacob Norum, Maria Brandal
Berstad, Marie Vikdal, and Kristian Berg. 2010. “Photochemical Internalization Provides
Time- and Space-Controlled Endolysosomal Escape of Therapeutic Molecules.” Journal
of Controlled Release 148: 2–12. doi:10.1016/j.jconrel.2010.06.008.
Seybold, Paul G., and Martin Gouterman. 1969. “Porphyrins XIII: Fluorescence Spectra and
Quantum Yields.” Journal of Molecular Spectroscopy 31: 1–13.
Sheihet, L., P. Chandra, P. Batheja, D. Devore, J. Kohn, and B. Michniak. 2008. “Tyrosine-
Derived Nanospheres for Enhanced Topical Skin Penetration.” International Journal of
Pharmaceutics 350 (1–2): 312–19. doi:10.1016/j.ijpharm.2007.08.022.
Sheihet, Larisa, Robert a. Dubin, David Devore, and Joachim Kohn. 2005. “Hydrophobic
Drug Delivery by Self-Assembling Triblock Copolymer-Derived Nanospheres.”
Biomacromolecules 6 (5): 2726–31. doi:10.1021/bm050212u.
Sheihet, Larisa, Olga B. Garbuzenko, Jared Bushman, Murugesan K. Gounder, Tamara
Minko, and Joachim Kohn. 2012. “Paclitaxel in Tyrosine-Derived Nanospheres as a
Potential Anti-Cancer Agent: In Vivo Evaluation of Toxicity and Efficacy in
Comparison with Paclitaxel in Cremophor.” European Journal of Pharmaceutical
Sciences 45 (3). Elsevier B.V.: 320–29. doi:10.1016/j.ejps.2011.11.017.
Sheihet, Larisa, Karolina Piotrowska, Robert a. Dubin, Joachim Kohn, and David Devore.
2007. “Effect of Tyrosine-Derived Triblock Copolymer Compositions on Nanosphere
Self-Assembly and Drug Delivery.” Biomacromolecules 8 (3): 998–1003.
doi:10.1021/bm060860t.
Silva, Diogo, André Luiz, Francesca Moret, Elisa Gaio, Elena Reddi, Wilker Caetano,
Fabiana Quaglia, and Noboru Hioka. 2016. “Pluronic Mixed Micelles as Efficient
Nanocarriers for Benzoporphyrin Derivatives Applied to Photodynamic Therapy in
Cancer Cells.” Journal of Photochemistry and Photobiology A : Chemistry 314: 143–54.
Simon, Timea, Monica Potara, Ana-Maria Gabudean, Emilia Licarete, Manuela Banciu, and
Simion Astilean. 2015. “Designing Theranostic Agents Based on Pluronic Stabilized
Gold Nanoaggregates Loaded with Methylene Blue for Multimodal Cell Imaging and
Enhanced Photodynamic Therapy.” ACS Applied Materials & Interfaces,
150722085411004. doi:10.1021/acsami.5b04734.
Spring, Bryan Q., Imran Rizvi, Nan Xu, and Tayyaba Hasan. 2015. “The Role of
Photodynamic Therapy in Overcoming Cancer Drug Resistance.” Photochem. Photobiol.
Sci. 14: 1476–91.
Sternberg, Ethan D, David Dolphin, and Christian Brickner. 1998. “Porphyrin-Based
Photosensitizers for Use in Photodynamic Therapy.” Tetrahedron 54 (447): 4151–4202.
doi:S0040-4020(98)00015-5.
Suppan, Paul. 1994. Chemistry and Light. doi:10.1039/9781847550439-00027.
Szeimies, Rolf-markus, and Christoph Abels. 2001. “Chapter 1 History of Photodynamic
Therapy in Dermatology.”
Tada, Dayane B., Emanuel Suraniti, Liane M. Rossi, Carlos a P Leite, Carla S. Oliveira,
Tathyana C. Tumolo, Roberto Calemczuk, Thierry Livache, and Mauricio S. Baptista.
2014. “Effect of Lipid Coating on the Interaction between Silica Nanoparticles and
Membranes.” Journal of Biomedical Nanotechnology 10 (3): 519–28.
doi:10.1166/jbn.2014.1723.
Tada, Dayane B., L. L R Vono, Evandro L. Duarte, Rosangela Itri, Pedro K. Kiyohara,
Maurício S. Baptista, and Liane M. Rossi. 2007. “Methylene Blue-Containing Silica-
Coated Magnetic Particles: A Potential Magnetic Carrier for pHotodynamic Therapy.”
Langmuir 23 (15): 8194–99. doi:10.1021/la700883y.
Tada, Dayane B, and Mauricio S Baptista. 2015. “Photosensitizing Nanoparticles and the
Modulation of ROS Generation.” Frontiers in Chemistry 3 (May): 1–14.

155
doi:10.3389/fchem.2015.00033.
Tada, Dayane B, Liane M Rossi, Carlos A P Leite, Rosangela Itri, and Mauricio S Baptista.
2010. “Nanoparticle Platform to Modulate Reaction Mechanism of Phenothiazine
Photosensitizers.” Journal of Nanoscience and Nanotechnology 10 (5): 3100–3108.
doi:10.1166/jnn.2010.2165.
Tan, Cai-Ping, Yi-Ying Lu, Liang-Nian Ji, and Zong-Wan Mao. 2014. “Metallomics Insights
into the Programmed Cell Death Induced by Metal-Based Anticancer Compounds.”
Metallomics : Integrated Biometal Science 6 (5): 978–95. doi:10.1039/c3mt00225j.
Tanielian, C, G Heinfuch, and Blake Pascal. 1995. “Effect of Aggregation on the
Hematoporphyrin-Sensitized Production of Singlet Molecular Oxygen.” Photochemistry
and Photobiology 61 (2): 131–35.
Tardivo, João Paulo, Auro Del Giglio, Carla Santos De Oliveira, Dino Santesso Gabrielli,
Helena Couto Junqueira, Dayane Batista Tada, Divinomar Severino, Rozane De Fátima
Turchiello, and Mauricio S. Baptista. 2005. “Methylene Blue in Photodynamic Therapy:
From Basic Mechanisms to Clinical Applications.” Photodiagnosis and Photodynamic
Therapy 2: 175–91. doi:10.1016/S1572-1000(05)00097-9.
Trauner, K B, R Gandour-Edwards, M Bamberg, S Shortkroff, C Sledge, and T Hasan. 1998.
“Photodynamic Synovectomy Using Benzoporphyrin Derivative in an Antigen-Induced
Arthritis Model for Rheumatoid Arthritis.” Photochemistry and Photobiology 67 (1):
133–39.
Trauner, Kenneth B, and Tayyaba Hasan. 1996. “Photodynamic Treatment of Rheumatoid
and Inflammatory Arthritis.” Photochemistry and Photobiology 64 (5): 740–50.
Tsubone, T. M., C. Pavani, I. O L Bacellar, and M. S. Baptista. 2017. “In Search of Specific
PDT Photosensitizers Subcellular Localization and Cell Death Pathways.” In Imaging in
Photodynamic Therapy, 149–82.
Tsubone, Tayana M, Gustavo Braga, Bruno H Vilsinski, Adriana P Gerola, Noboru Hioka,
and Wilker Caetano. 2014. “Aggregation of Aluminum Phthalocyanine Hydroxide in
Water/Ethanol Mixtures” 25 (5): 890–97.
Uchoa, Adjaci F., Kleber T. De Oliveira, Mauricio S. Baptista, Adailton J. Bortoluzzi,
Yassuko Iamamoto, and Osvaldo a. Serra. 2011. “Chlorin Photosensitizers Sterically
Designed to Prevent Self-Aggregation.” Journal of Organic Chemistry 76 (21): 8824–32.
doi:10.1021/jo201568n.
Uchoa, Adjaci F., Carla S. Oliveira, and Mauricio S. Baptista. 2010. “Relationship between
Structure and Photoactivity of Porphyrins Derived from Protoporphyrin IX.” Journal of
Porphyrins and Phthalocyanines 14: 832–45. doi:10.1142/S108842461000263X.
Vidòczy, Tamàs. 1992. “Type I and Type II Photosensitized Reactions: Reasons for Dispute.”
Journal of Photochemistry and Photobiology, B: Biology 14 (1–2): 139–42.
doi:10.1016/1011-1344(92)85088-C.
Von Tappeiner, H., and A. Jesionek. 1903. “Therapeutische Versuche Mit Fluoreszierenden
Stoffen.” Muench Med. Wochenschr 47: 2042–2044.
White, Eileen. 2015. “The Role for Autophagy in Cancer.” Journal of Clinical Investigation
125 (1): 42–46. doi:10.1172/JCI73941.Autophagy.
Wilkinson, Francis, W. Philip Helman, and Alberta B. Ross. 1993. “Quantum Yields for the
Photosensitized Formation of the Lowest Electronically Excited Singlet State of
Molecular Oxygen in Solution.” J Phys Chem 22 (1): 113–262.
Woodburn, K W, N J Vardaxis, J S Hill, a H Kaye, and D R Phillips. 1991. “Subcellular
Localization of Porphyrins Using Confocal Laser Scanning Microscopy.”
Photochemistry and Photobiology 54 (5): 725–32.
Xu, Yongkui, Ruoyu He, Dongdong Lin, Minbiao Ji, and Jiyao Chen. 2015. “Laser Beam
Controlled Drug Release from Ce6–gold Nanorod Composites in Living Cells: A FLIM

156
Study.” Nanoscale 7: 2433–41. doi:10.1039/C4NR05574H.
Xue, Liang Yan, Song Mao Chiu, Kashif Azizuddin, Sheeba Joseph, and Nancy L. Oleinick.
2007. “The Death of Human Cancer Cells Following Photodynamic Therapy: Apoptosis
Competence Is Necessary for Bcl-2 Protection but Not for Induction of Autophagy.”
Photochemistry and Photobiology 83 (5): 1016–23. doi:10.1111/j.1751-
1097.2007.00159.x.
Yeh, Shu-Chi, Michael Patterson, Joseph Hayward, and Qiyin Fang. 2014. “Time-Resolved
Fluorescence in Photodynamic Therapy.” Photonics 1 (4): 530–64.
doi:10.3390/photonics1040530.
Yoo, Je-Ok, and Kwon-Soo Ha. 2012. New Insights into the Mechanisms for Photodynamic
Therapy-Induced Cancer Cell Death. International Review of Cell and Molecular
Biology. 1sted. Vol. 295. Elsevier Inc. doi:10.1016/B978-0-12-394306-4.00010-1.
Yue, Zhan-Guo, Wei Wei, Pi-ping Lv, Hua Yue, Lian-yan Wang, Zhi-guo Su, and Guang-hui
Ma. 2011. “Surface Charge Affects Cellular Uptake and Intracellular Trafficking of
Chitosan-Based Nanoparticles.” Biomacromolecules 12: 2440–46.
Zhang, Zheng, Tannaz Ramezanli, Pei-Chin Tsai, and Bozena B. Michniak-Kohn. 2014.
“Drug Delivery Systems Based on Tyrosine-Derived Nanospheres (TyroSpheresTM).” In
Nanotechnology and Drug Delivery, Volume One: Nanoplatforms in Drug Delivery,
210–232. CRC Press. doi:10.1201/b17271-7.
Zhang, Zheng, Pei Chin Tsai, Tannaz Ramezanli, and Bozena B. Michniak-Kohn. 2013a.
“Polymeric Nanoparticles-Based Topical Delivery Systems for the Treatment of
Dermatological Diseases.” Wiley Interdisciplinary Reviews: Nanomedicine and
Nanobiotechnology 5 (3): 205–18. doi:10.1002/wnan.1211.
———. 2013b. “Polymeric Nanoparticles-Based Topical Delivery Systems for the Treatment
of Dermatological Diseases.” Wiley Interdisciplinary Reviews: Nanomedicine and
Nanobiotechnology 5 (3): 205–18. doi:10.1002/wnan.1211.
Zong, D, K Zielinska-Chomej, T Juntti, B Mörk, R Lewensohn, P Hååg, and K Viktorsson.
2014. “Harnessing the Lysosome-Dependent Antitumor Activity of Phenothiazines in
Human Small Cell Lung Cancer.” Cell Death & Disease 5: e1111.
doi:10.1038/cddis.2014.56.

CURRICULUM VITAE


159
7. CURRICULUM VITAE
PERSONAL DATA
Name: Tayana Mazin Tsubone
Date of birth: November 16, 1989 – Andradina/SP - Brazil
EDUCATION
PhD in Science 2012 – 2017
University of Sao Paulo (USP), São Paulo – Brazil
Bachelor of Science in Chemistry 2008 - 2011
State University of Maringa (UEM), Paraná – Brazil
COMPLEMENTARY EDUCATION
• Scientific Instrumentation: Flow Cytometry. September/2015.
Universidade Federal do ABC (UFABC), São Paulo – Brazil
• 2nd Summer School in Colloids and Surfaces. January/2014.
Universidade de São Paulo (USP), São Paulo – Brazil
ACADEMIC PROFESSIONAL EXPERIENCE
❖ February/2012 – current: PhD student under supervision of Prof. Dr. Maurício S. Baptista.
Scholarship grant received from FAPESP (Process number Nº 2012/10049-4 and Nº
2013/16532-1).
❖ May/2014 – August/2014: PhD visiting student on the International Summer Exchange
Program at New Jersey Center for Biomaterials – Rutgers University (USA) to develop
part of this PhD thesis.
❖ August/2012 – December/2013: Teacher assistant in Chemistry course at the Institute of
Chemistry, University of Sao Paulo.
❖ February/2009 – December/2011: Undergraduate researcher assistant under
supervision of Prof. Dr. Wilker Caetano. Scholarship grant received from CNPq by PIBIC
program (Programa Institucional de Bolsas de Iniciação Científica).

160
PAPERS
1. Tayana Mazin Tsubone, Waleska Kerllen Martins, Christiane Pavani, Helena Couto
Junqueira, Rosangela Itri, Maurício S. Baptista. Enhanced Efficiency of Cell Death by
Lysosome-Specific Photodamage. Scientific Reports, submitted.
2. Camila Fabiano de Freitas, Diogo Silva Pellosi, Bianca Martins Estevão, Italo Rodrigo
Calori, Tayana Mazin Tsubone, Mário José Politi, Wilker Caetano, Noboru Hioka.
Nanostructured Polymeric Micelles Carrying Xanthene Dyes for Photodynamic
Evaluation. Photochemistry and Photobiology, 92, p. 790-799, 2016.
DOI: 10.1111/php.12645
3. Isabel Bacellar, Tayana Mazin Tsubone, Christiane Pavani, Maurício Baptista.
Photodynamic Efficiency: From Molecular Photochemistry to Cell Death. International
Journal of Molecular Sciences, v. 16, p. 20523-20559, 2015.
DOI: 10.3390/ijms160920523
❖ This paper was cover of “International Journal of Molecular Science” at September/2015.
4. Tayana Mazin Tsubone; Gustavo Braga, Bruno H. Vilsinski, Adriana P. Gerola; Noboru
Hioka, André L. Tessaro, Wilker Caetano.
Aggregation of Aluminum Phthalocyanine Hydroxide in Water/Ethanol Mixtures. Journal
of the Brazilian Chemical Society, v. 25, p.890-897, 2014.
DOI: 10.5935/0103-5053.20140058
5. Diogo Silva Pellosi, Bianca Martins Estevão, Camila Fabiano de Freitas, Tayana Mazin
Tsubone, Wilker Caetano, Noboru Hioka.
Photophysical Properties of Erythrosin Ester Derivatives in Ionic and Non-Ionic Micelles.
Dyes and Pigments, v. 99, p. 2013-705-712, 2013.
DOI: 10.1016/j.dyepig.2013.06.026
6. Adriana Passarella Gerola, Amanda Santana, Polyana Batoqui França, Tayana Mazin
Tsubone, Hueder Paulo Moisés de Oliveira, Wilker Caetano, Elza Kimura, Noboru Hioka.
Effects of metal and the phytyl chain on chlorophyll derivatives: physicochemical
evaluation for Photodynamic Inactivation of Microorganisms.
Photochemistry and Photobiology, v. 87, p. 884-894, 2011.
DOI: 10.1111/j.1751-1097.2011.00935.x
7. Adriana P. Gerola, Tayana Mazin Tsubone, Amanda Santana, Hueder Paulo Moisés de
Oliveira, Noboru Hioka, Wilker Caetano.
Properties of Chlorophyll and Derivatives in Homogeneous and Microheterogeneous
Systems.
Journal of Physical Chemistry. B, v. 115, p. 7364-7373, 2011.
DOI: 10.1021/jp201278b

161
BOOK CHAPTER
1. Tayana Mazin Tsubone, Christiane Pavani, Isabel Bacellar, Maurício Baptista.
In the search of specific PDT photosensitizers: subcellular localization and cell death
pathways.
Book chapter published on the CRC Press as part of book “Imaging in Photodynamic
Therapy”. Editors: Michael R. Hamblin, Yingying Huang.
DOI: 10.1201/9781315278179-10
ORAL PRESENTATIONS AT INTERNATIONAL CONFERENCES
1. Organelle-specific cell death by photosensitized oxidation.
Oral presentation in Tsukuba Global Science Week. Tsukuba - Japan. September/2016.
❖ This presentation received the Outstanding Speaker Award.
2. Enhanced Photodynamic Efficacy by Encapsulation of Photosensitizers in Tyrosine-
Derived Nanospheres.
Oral presentation in 10th World Biomaterials Congress. Montreal - Canada. May/2016.
3. Modulating the mechanism of photoinduced cell death by using photosensitizers with
different charges.
Oral presentation in International Photodynamic Association. Rio de Janeiro - Brazil.
May/2015.
4. Photoinduced autophagic cell death: an efficient mechanism to kill tumor cells.
Oral presentation in XII Encontro Latino Americano de Fotoquímica e Fotobiologia.
Maresias - Brazil. April/2015.
5. Mechanism of Photochemical Internalization.
Oral presentation at the event organized by Department of Pharmacy at Universidade
Nacional. Córdoba – Argentina. September/2014.
6. Light and Tyrospheres to improve Cancer Therapy.
Oral presentation in a conference at New Jersey Center for Biomaterials - Rutgers
University. Piscataway – United States. August/2014.
AWARDS AND HIGHLIGHTS
❖ Outstanding Speaker Award in Tsukuba Global Science Week. September/2016.

162
PARTICIPATION IN CONFERENCES AND EVENTS
1. 10th World Biomaterials Congress. 2016. (Congress).
2. Tsukuba Global Science Week. 2016. (Conference).
3. International Photodynamic Association. 2015. (Congress).
4. XII Encontro Latino Americano de Fotoquímica e Fotobiologia. 2015. (Congress).
5. 16th International Congress on Photobiology. 2014. (Congress).
6. Canada-Brazil Molecular Sciences Workshop. 2014. (Workshop).
7. Mini-Symposium on Singlet Oxygen. 2014. (Symposium).
8. 34ª Reunião Anual da Sociedade Brasileira de Química. 2011. (Congress).
9. 1º Workshop da Rede NANOBIO - Filmes Finos. 2010. (Workshop).
10. 33ª Reunião Anual Sociedade Brasileira de Química. 2010. (Congress).
11. XIX Encontro Anual de Iniciação Científica. 2010. (Event).
12. XXVI Semana da Química. 2010. (Event).

APPENDIX I