Embed Size (px)
Citation preview

1
Tax Treaties Worldwide: Estimating
Elasticities and Revenue Foregone Petr Janský, Jan Láznička, Miroslav Palanský1
While researchers agree that dividend and interest payments respond to tax treaties, evidence of the
magnitude of this response remains scarce. We combine data from the International Bureau of Fiscal
Documentation and the International Monetary Fund in a set of 65,000 annual country-pair observations
for the 2009–2016 period. We estimate dividend flows to be highly elastic in a cross-country regression
and arrive at somewhat lower and less robust estimates for interest income. While our revenue estimates
are lower than static estimates which do not reflect elasticities, we show that for some countries the
revenue foregone remains non-negligible.
Keywords: foreign direct investment; multinational enterprise; tax treaty; double taxation agreement;
elasticity; withholding tax
JEL classification: F21; F23; H25; H26; H32
1 Charles University, Prague, Czechia. We are grateful for useful related discussions and comments on earlier
versions of this research from the editor, Ronald Davies, an anonymous referee, Martin Hearson, Tomáš Křehlík,
Jan Loeprick, Markus Meinzer, Kunka Petkova, Andrzej Stasio, Marek Šedivý and Martin Zagler. The authors
acknowledge support from the Czech Science Foundation (P403/18-21011S). The corresponding author is Petr
Janský ([email protected]). The data and code can be found on the Open Science Framework website
(https://osf.io/bcz7t).

2
1 Introduction
An ongoing research discussion focuses on the extent to which tax treaties, or double taxation
agreements, are capable of accomplishing one of their stated objectives, i.e. providing support for cross-
border investment. While this discussion currently lacks a conclusive outcome, it has been established
that tax treaties lead to lower withholding tax rates on dividends and interest payments. This practice
lowers government revenues from such taxes worldwide. Although there are now over 3,000 bilateral
tax treaties, little is known about the scale of potential tax revenue foregone associated with the lower
taxation they facilitate. Furthermore, what little we know is mostly based on static estimates, which
unrealistically assume that tax treaties themselves do not influence dividends and interest payments. In
this paper, we overturn this assumption by estimating the extent to which dividend and interest flows
react to changes in withholding rates, and reflect these elasticities in new estimates of potential tax
revenue foregone.
We strive to answer two key research questions: first, what are the elasticities of withholding tax rates
on dividends and interests and, second, what are the revenues foregone of tax treaties. We aim to answer
these questions for as many countries as possible by exploiting the best available cross-country datasets:
we use data from the International Monetary Fund (IMF) to approximate bilateral dividend and interest
flows and combine it with detailed information on withholding tax rates from the International Bureau
of Fiscal Documentation (IBFD). By answering these questions for as many countries as possible, we
hope to contribute to the rapidly developing economics literature on tax treaties. As far as we know, the
only existing rigorous, in-depth study of both elasticities and tax treaties focuses on a single country,
Ukraine (Balabushko, Beer, Loeprick, & Vallada, 2017). We design our empirical model on the basis
of this work and add our cross-country estimates to the existing results for Ukraine. While it is not
possible to achieve such rigorous and comparable estimates for many other countries due to the
unavailability of sufficiently detailed data, our objective in this paper is to provide as rigorous estimates
as possible of the elasticity of dividend and interest taxation and the revenue foregone resulting from
tax treaties for as many countries as possible.

3
Two studies which have calculated cross-country estimates of potential revenue foregone have both
focused on developing countries. Beer & Loeprick (2020) find that for 41 African countries between
1985 and 2015, signing treaties with investment hubs was associated with non-negligible revenue
foregone but not with additional investments. Their unique empirical strategy uses a difference-in-
difference framework and exploits the role of Mauritius, which is a tax treaty hub with treaties with only
some of the sub-Saharan African countries. They suggest that treaty shopping, i.e. the practice of
multinational enterprises (MNEs) diverting cross-border payments through a country with the lowest
withholding tax rate, drives some of the observed flows. Although we are not able to empirically
investigate which of the estimated revenue foregone results from treaty shopping, our data confirms this
observation. Unlike Beer & Loeprick (2020), who focus solely on sub-Saharan Africa, we cover all
countries with available data. Furthermore, while they evaluate both costs and benefits, we focus
exclusively on the tax revenue foregone. Finally, while they do not present country-level estimates, we
do so and provide information on the costliest bilateral tax treaty relationships which might empower
regulators in the affected countries. Such detailed results could influence cooperative bargaining with
investor countries and could result in lower revenue foregone, especially if the foreign direct investment
(FDI) relationship is asymmetric, as suggested by earlier studies of US and OECD tax treaties (Chisik
& Davies, 2004a) and German tax treaties (Rixen & Schwarz, 2009).
Another recent cross-country study has identified non-negligible revenue foregone for a sample of
developing countries. Janský & Šedivý (2019) find that among 14 developing countries in sub-Saharan
Africa and Asia, the highest potential tax revenues foregone are within hundreds of millions USD
(around 0.1% of GDP), with the Philippines incurring the highest tax revenue foregone both in volume
(in USD) and relative to GDP. Indeed, some countries in these regions are beginning to realise how
costly tax treaties can be, and local authorities are taking action. Well-documented cases include the
government of Mongolia’s 2014 cancellation of the Netherlands–Mongolia tax treaty (Redhead &
Mihalyi, 2018) and, more recently, a ruling issued by Kenya’s High Court to annul its tax treaty with
Mauritius (Fitzgibbon, 2019, Hearson, 2019). Janský & Šedivý (2019) further find that a vast majority
of the revenue foregone is due to dividends rather than interests and that only four investor countries –

4
Japan, the Netherlands, Switzerland, and Singapore – are responsible for the majority of revenue
foregone. While the authors acknowledge that since they assume that the existence of tax treaties does
not influence FDI, their results are likely biased upward. In this paper, we explicitly test this assumption
by estimating and reflecting the elasticities of tax treaties.
Six other studies have provided potential revenue cost estimates for single tax treaty partners
individually; most of these have been for developed countries. Weyzig (2013) and McGauran (2013)
provide estimates for the Netherlands, while the IMF (2014) and Van de Poel (2016) study Belgium and
the United States, respectively. Only two single-country studies deal with non-members of the OECD:
ActionAid (2016) for Bangladesh and the above-mentioned study by Balabushko, Beer, Loeprick, &
Vallada (2017) for Ukraine. With the sole exception of the latter, none of the remaining above-
mentioned studies estimate the elasticities or indeed use them to derive estimates of potential tax revenue
foregone. A further set of single-country studies has provided useful discussions of tax treaties without
any revenue estimates whatsoever, including e.g. Bürgi & Meyer (2013) for Switzerland, IBFD (2013)
for the Netherlands, and Kosters, Kool, Groenewegen, Weyzig, & Bardadin (2015) for Ireland, while
others have discussed them for a group of developing countries (Paolini et al., 2016, Hearson, 2016).
By estimating tax revenue foregone for numerous countries worldwide, we join other recent studies –
such as UNCTAD (2015), Janský & Palanský (2019), Crivelli et al. (2016), Cobham & Janský (2018),
Clausing (2016), Johansson, Skeie, Sorbe, & Menon (2017), Tørsløv, Wier, & Zucman (2020), Cobham
& Janský (2019). Although these studies estimate country-level potential revenue foregone for corporate
income tax, this paper is the first to do so for withholding tax.
Although in this paper, we focus purely on the costs of tax treaties and specifically on government tax
revenue foregone, we now briefly discuss existing research focusing on their benefits. The potential
benefits of tax treaties in terms of increased FDI have been extensively discussed in literature, however,
the evidence on these effects remains inconclusive. While some papers suggest that tax treaties have a
positive impact on FDI – e.g. Neumayer (2007), Barthel, Busse, & Neumayer (2010), Egger & Merlo
(2011) or Blonigen, Oldenski, & Sly, 2014, other studies do not find much support for this effect – e.g.
Blonigen & Davies (2002), Hallward-Driemeier (2003), Blonigen & Davies (2004), Egger, Larch,

5
Pfaffermayr, & Winner (2006), Coupé, Orlova, & Skiba (2009), Baker (2014), with Davies (2004)
providing an earlier overview. In a recent addition to this discussion, van‘t Riet & Lejour (2018) consider
an international corporate tax system a network and estimate how MNEs repatriating profits can
minimise their taxes (including corporate income tax rates, withholding taxes on dividends, double tax
treaties, as well as double taxation relief methods). They find that treaty shopping leads to an average
potential reduction of the tax burden on repatriated dividends of approximately 6 percentage points, with
the UK, Luxembourg, and the Netherlands as the most important conduit countries. In a paper that
extends this approach and in another one considering tax treaties as a network, Hong (2018) and Petkova,
Stasio, & Zagler (2018) differentiate between relevant, neutral and irrelevant tax treaties according to
whether or not they provide investors with a financial advantage. They find that only relevant and neutral
tax treaties increase bilateral FDI, whereas irrelevant ones do not. They quantify the increase in FDI due
to a relevant tax treaty at around 22% and argue that significant tax reductions due to treaty benefits will
lead to an increase in FDI.
The above-mentioned study by Beer & Loeprick (2020), another recent addition to the general research
area on the effects of tax treaties, finds no impact on FDI. Furthermore, Beer & Loeprick (2020)
speculate that the inconclusive empirical findings on the importance of tax treaties for FDI might be in
part due to a secondary role that tax plays in FDI decisions and due to MNEs pursuing a variety of
strategies (Carr, Markusen, & Maskus, 2001, Bergstrand & Egger, 2007), including between those
making greenfield investments and mergers and acquisitions (Head & Ries, 2008). While Chisik &
Davies (2004b) provide a model-based explanation for the decreasing trends in withholding tax rates
under tax treaties, a more recent contribution by Azémar & Dharmapala (2019) finds that so-called tax
sparing provisions in tax treaties, which aim to prevent host country tax incentives from being nullified
by residence country taxation (previously studied e.g. by Azémar, Desbordes, & Mucchielli, 2007), are
associated with up to 97% higher FDI. Since we are unable to provide new evidence and thus a
conclusive answer, we do not explicitly address the question of the benefits of tax treaties for increased
FDI; instead, we focus solely on elasticities and revenue foregone.

6
Another more general body of literature which our paper relates to is the extensive literature on dividend
taxation. The various theories of dividend taxation, reviewed and extended e.g. by Chetty & Saez (2010),
produce differing predictions of elasticity and associated efficiency costs, including two traditional
views: positive elasticity and thus non-zero efficiency costs in the so-called old view and zero elasticity
and no efficiency costs in the so-called new view. Based on the new view of dividend taxation, Hartmann
and Sinn’s theoretical result (Hartman, 1985, Sinn, 1993) implies that tax is neutral and that investors
have the same preferences for the shares of repatriated and reinvested profits regardless of the scale of
withholding taxes on dividends. In practice, there might be non-tax preferences for distributed rather
than reinvested earnings. As Griffith, Hines Jr, & Sørensen (2010, p. 958) sum up, if the new view of
dividend taxation is correct, the repatriation taxes collected under existing systems of worldwide
corporate income taxes are essentially lump-sum taxes, generating revenue at zero efficiency cost, while
if the old view comes closer to the truth, the revenue comes at the cost of distortions to foreign
investment and repatriations. Although additional single-country theories do not enable us to draw
straightforward implications for our international cross-country setting, most existing studies on tax
treaties, including our present contribution, seem to be carried out in line with the old view, thus
suggesting that the elasticities are mostly positive and that efficiency costs are thus associated with these
taxes. It must also be noted that related empirical literature focuses on individual countries: while earlier
studies (Poterba & Summers, 1984, Poterba, 2004) use an observational approach similar to our cross-
country analysis, more recent studies (Chetty & Saez, 2005, Yagan, 2015) use more credible quasi-
experimental research designs (similar to those recently applied to tax treaties by Beer & Loeprick,
2020). While we do not use a quasi-experimental research design, we rely on the best available data and
exploit variation across countries and over a number of years to estimate elasticities for many countries.
None of the reviewed tax treaty studies have thus far estimated elasticities and revenues for a large group
of countries worldwide, thereby producing a gap which we aim to fill. Our paper is novel in three aspects,
each of which represents one stage of our empirical analysis. First, we create the largest and most
detailed data set of bilateral FDI flows and related withholding tax rates, both domestic and those
detailed in tax treaties. In addition to tax treaties we include the effects of the EU Parent-Subsidiary and

7
Interest and Royalties Directives, which effectively imply zero withholding rates among all EU member
states and Switzerland. Indeed, we reveal the estimated related revenue foregone due to these directives
to be substantial.
The second and perhaps most important novel aspect of our paper is that we use the detailed data set we
compile to estimate the withholding tax rate elasticities of dividend and interest flows. While economic
theory and a majority of literature agree that dividend and interest payments respond to tax treaties’
provisions, evidence of the magnitude of this response remains scarce. We expand this area
substantially. For example, we estimate dividend flows to be highly elastic: a 1% increase in the
applicable withholding tax is associated with a decrease of 1.9–2.4%. Finally, we estimate the potential
revenue foregone of withholding tax rates included in tax treaties for the largest set of countries thus far.
For example, for dividends, we estimate the highest annual revenue foregone for Canada and the United
States, while the investor country responsible for the highest revenue foregone is the Netherlands. We
incorporate estimated elasticities into the calculations of our headline revenue foregone estimates, which
are substantially lower than static estimates which do not reflect these elasticities, underscoring the
importance of using elasticities. We thus provide estimates of potential tax revenue foregone due to
dividend and interest outflows for the largest sample of countries compiled thus far.
By focusing on potential tax revenue foregone due to tax treaties, we are aware that we estimate only
one type of tax revenue foregone related to MNEs’ international activities. Generally, we argue that the
interactions of governments and MNEs can lead to lower taxation of MNEs’ profits on three levels. The
first level is known as profit shifting. MNEs can shift their profits – by means of transfer pricing, debt
shifting or strategic intellectual property locating – from the country of operation to another country, in
some cases a tax haven, to reduce their tax base for corporate income tax (this level is perhaps the one
that is most studied by economists and has recently been documented e.g. by Fuest et al., 2011,
Dharmapala, 2014, Gresik et al., 2017, Dowd, Landefeld, & Moore, 2017, Laplante & Nesbitt, 2017,
and Merlo et al., 2020). On the second level, MNEs can lower the effective corporate income tax rate
applicable to profits remaining in the country of operation after any profit shifting, e.g. by increasing
tax deductibles or reaching an advantageous tax agreement with the tax authority (as in the case of

8
Luxembourg, see ICIJ, 2014 and Huesecken & Overesch, 2015). This paper focuses specifically on the
third level, where withholding tax rates on dividend and interest income are often reduced from standard
levels stipulated by domestic law by tax treaties signed between particular pairs of countries. This paper
thus examines the elasticity of these income flows and their government tax revenue implications.
The rest of the paper is structured as follows: in section 2, we describe the data sources, the creation of
our final data set and its limitations. In section 3, we outline the methodology we use for estimating
elasticities and revenue effects. In section 4, we present our results. The final section concludes with
implications for policy makers and further research.
2 Data
We now describe the data needed for estimating elasticities and revenue foregone. To obtain estimates
for as many countries as possible, we aim to obtain a panel data set which covers bilateral dividend and
interest flows as comprehensively as possible, along with bilateral withholding tax rates on these types
of income. To create such a data set, we combine multiple sources, each of which offers the best
available information of its kind. We primarily rely on the IBFD for tax rates and the IMF for financial
flows.
The IBFD is a rich source of information on country-pair-specific tax rates established in tax treaties.
We collect information on the tax treaties’ withholding tax rates for dividends and interest (using the
rate applicable for qualifying companies, when distinct from the portfolio investment tax rate) as well
as the domestic withholding rates used when no tax treaty is in place between a given pair of countries.
Our data includes 176 source countries and over 200 recipient countries. While data is available for the
years between 2008 and 2017 for most countries, the final data set is unbalanced due to varying country
coverage over time. In case more than one potentially applicable tax rate is available from the IBFD, we
turn to additional information available in table notes and follow economic logic to select the most
suitable rate. For example, where more than one table with tax rates is available for a given year and
country, we use the one applicable to the largest part of the year in case various versions of the treaties

9
were in force during that year; where this is not the case, we use the rate with the earliest effective date
as likely the most representative of a given year.
We also use additional sources of information on withholding rates to make adjustments, the EU Parent-
Subsidiary and Interest and Royalties Directives in particular. According to these, companies are exempt
from paying withholding taxes on dividends, interest and royalties when two sets of conditions are met.
First, both the country of residence of the distributing company and the country of residence of the
recipient must be either EU member states or Switzerland. Second, other stipulated conditions include
owning a sizable stake in the dividend- or interest-distributing company. We thus input a 0% domestic
rate for all pairs where both the source and recipient countries are EU member states or Switzerland,
and in doing so, we assume that all dividend and interest flows qualify for these directives. We therefore
consider the EU directives analogously to tax treaties and, in our empirical analysis, estimate their joint
effects. For all other country pairs, we use the applicable rates listed in IBFD tables as well as in
accountancy firms’ reports compiled by PwC (2017), Deloitte (2017) and KPMG (2016).
In the case of multiple rates presented by the IBFD, we choose the most suitable tax rate. Our approach
differs depending on whether these withholding tax rates are obtained from country-specific domestic
legislation – few cases, alternative data sources available – or from country-pair-specific tax treaties –
many cases, no alternative sources available, possibly with the exception of some data from accountancy
firms such as PwC (2018), which covers 155 countries in comparison with the IBFD’s 215 countries.
First, for country-specific domestic law, we check the IBFD information on the applicable rates in the
absence of tax treaties against PwC (2017), Deloitte (2017) and KPMG (2016) one by one. When we
find a difference, we study it in greater detail and, if necessary, adjust the rate based on the available
information (i.e. another rate likely covers the majority of dividend or interest outflows). In case we are
unable to choose one rate in the absence of tax treaties, we create an average of the most likely rates and
use this average as the rate for our estimates.
Second, the IBFD also presents multiple rates for many tax treaties. Checking tax treaties thoroughly
one by one is almost impossible due to the amount of information they contain: we obtained 185,545

10
observations on withholding tax rates which we reduced to 65,199 after combining them with IMF data
as described below. We use all tax treaty rates available in the IBFD to develop three different versions
of our data set: a set created using the lowest withholding tax rate (minimum), a set created using the
average of all withholding tax rates (average), and a set created using the highest rate (maximum)
automatically selected from the available rates for every country pair. While this approach produces
three sets of estimates, it seems to be the most appropriate. Furthermore, it provides us with a method
of checking the robustness of our results. The three data set versions are represented in histograms of
dividend and interest withholding tax rates in Figures A1 and A2 in the Appendix. Differences in the
distribution of tax rates across the three data sets seem to warrant the use of all three of them but are
generally not large. We therefore present some results for all three versions as a robustness check, but,
unless otherwise specified, we use the average values in our headline results.
Tax treaty rates are usually lower than domestic ones and average differences are large for some
countries. Figure 1 shows a comparison of domestic and average tax treaty withholding tax rates on
dividends and interest for the most recent year available. Domestic rates on dividends range from 0% to
35%. Switzerland and Chile have the highest rates, but their average tax treaty rates are much lower at
below 10% (in the case of Switzerland this is driven down by the EU directives, as discussed above).
On the other hand, several countries, including e.g. India, Cyprus and the United Kingdom, have
domestic rates set to 0%. The highest average tax treaty rates are in Brazil, New Zealand, the Philippines
and Thailand, ranging between 12% and 15%. As expected, due to the EU directives tax treaty averages
are low in the case of many EU member states; likewise, they are low in Georgia, Macedonia, Panama,
the Seychelles and Venezuela. The picture is quite similar for interest, though individual countries’ tax
rates differ relatively as well as absolutely. For example, the highest domestic withholding tax rate
related to interest is in Argentina at 35%, followed by the United States and Paraguay with 30%.
Furthermore, for both dividends and interest, Figure 1 shows that in a minority of cases, the tax rate
stipulated in a tax treaty is higher than the otherwise applicable rate. This might be due to reductions in
domestic rates in recent years while the original tax treaty rates remain in place. In these cases, we use

11
the lower, domestically legislated, rate instead of the tax treaty rate for our follow-up estimations, as
that lower rate is the tax rate applied in practice.
Figure 1. Domestic and average tax treaty withholding tax rates on dividends and interest, most
recent year available
Source: Authors on the basis of the IBFD and other data sources.
To fulfil our objective of estimating dividend and interest elasticities, it is important to examine changes
in rates in collected data. Figures A3 and A4 in the Appendix show countries ranked by the number of
changes in the applicable withholding rates on dividends and interest from the perspective of source

12
countries. In each of the figures, the left panel shows countries which experienced changes in domestic
and possibly also tax treaty rates while the right panel shows countries which experienced changes only
in tax treaty rates. The differences between these two groups are substantial. Using the example of
dividends, Iceland, a country with certain development in the domestic withholding tax rate on
dividends, exhibits more than 275 dividend rate changes in our sample. The country with the most
changes without any development in its domestic rate in our sample is Korea, with more than 25 changes.
These graphs show us how resetting the domestic rate may be projected into the actual applicable rates
for numerous partner countries. However, large numbers of changes might not actually affect dividend
flows to such a degree, as partners with tax treaties in force might remain subject to the same lower rates
as prior to the change; frequently, those partner countries might have large FDI stocks in the source
country. Their position thus often remains unchanged. A similar observation and logic apply in the case
of interest. Altogether, the extent of changes to withholding tax rates over time seems to be satisfactory
for the purposes of our analysis.
Some of the best information on foreign direct investment payments and stocks is available from the
IMF. The IMF’s Balance of Payments statistics includes country-level information on dividend and
interest outflows from foreign direct investment by a recipient country (i.e. investor) in a source country
(i.e. investment location). Furthermore, we use the IMF’s Coordinated Direct Investment Survey to
obtain information on inward foreign direct investment stocks at country-pair-level. We use these two
sources together to estimate bilateral dividend and interest flows, since neither IMF nor any other
sources include this information at the bilateral level for a large set of countries.
For each country we compute the share of FDI stock it receives from all of its investor countries and
then use this share to divide the unilateral dividend and interest outflows into bilateral ones. In doing so
we assume that the dividend and interest outflows from a source country to an investor country are
proportional to the FDI stock of that investor country in the source country. This assumption is an
important one and the approximation will not reflect reality perfectly. For example, since FDI income
differs according to origin country (Bolwijn, Casella, & Rigo, 2018) and since firms might be more
likely to pay dividends when profits are high, profits may be correlated with economic shocks (e.g. at

13
country or country-pair-year level) which are not correlated with a partner country's share of the FDI
stock. Furthermore, if firms respond to lower withholding rates in a new tax treaty by increasing their
dividend payments more than their FDI stocks, then our approach will attribute too small a share of the
dividend outflows to investors for the pair of countries in question. This could lead to bias in the
estimates as the mismeasurement of the dependent variable (outflows) would correlate with changes in
the independent variable (withholding tax rates). Nevertheless, in the absence of observed bilateral
dividend and interest flows and in the absence of methods designed to attenuate or measure the extent
of the bias, we perceive an approximation using bilateral FDI stocks as the most reasonable approach.
In addition to the IMF’s CDIS data, we explore the possibility of using OECD data, which includes a
division into dividend and interest outflows. However, this data is only available for a small number of
OECD countries and uses a different methodology to divide the outflows than the IMF uses to divide
the stocks; as a result, data from the two sources cannot be directly combined. However, we do use the
OECD data to test the plausibility of the assumption we make for the IMF data, i.e. that dividend and
interest outflows are distributed similarly to FDI equity and debt stocks. We start by constructing shares
of bilateral FDI stocks from each counterpart country on a country’s total FDI stocks, and compare these
with the shares of bilateral FDI incomes on equity from each counterpart country on a country’s total
FDI income on equity. Using 2,594 observations for OECD countries for which we have this data, the
correlation between the two distributions is very high at 0.86, suggesting that FDI income on equity is
generally distributed in a similar way as total FDI equity stocks, thus supporting the notion that our
initial assumption is plausible (albeit imperfect). We obtain similar correlation coefficients for interest
variables. We also run a robustness check on our baseline specifications using the smaller sample of
OECD data (and, as we report below, obtain similar results as with OECD data).
The large cross-country panel data set of bilateral withholding tax rates and bilateral dividend and
interest flows we created includes 65,199 country-pair-year observations, with 87 source and 188
recipient countries for the 2009–2016 period. While it is the largest data set obtainable for the estimation
of withholding tax elasticities and tax treaty revenue foregone, it does have limitations, many of them
shared with other FDI datasets, recently discussed e.g. by Haberly & Wójcik (2015), Blanchard &

14
Acalin, (2016), Damgaard & Elkjaer (2017), Damgaard et al. (2019) and Casella (2019). Although the
IMF data on FDI provides the best cross-country information of its kind, it is unavailable for some
countries or only partially available e.g. for confidentiality reasons; as a result, our estimates are lower
bound estimates of overall worldwide potential revenue foregone since we are not able to provide
estimates for all country pairs. Furthermore, we focus only on dividend and interest income and we do
not include other FDI incomes such as those associated with royalties or capital gains, which are also
affected by tax treaties, but for which we lack comparable FDI income data. A case in point is Zain’s
indirect sale of various assets in Africa, discussed in a draft toolkit by the Platform for Collaboration on
Tax (2017): the revenue foregone at stake are large and affected by tax treaties, but not reflected in our
paper’s estimates due to the unavailability of suitable data.
Another important characteristic and limitation of the FDI data is that we only have information on the
immediate investor whose tax treaties apply; our approach thus does not capture FDI diversion via third
countries in response to withholding taxes. As described in detail in the Coordinated Direct Investment
Survey Guide (2015) and the Benchmark Definition of Foreign Direct Investment (2008), the IMF uses
the immediate investor approach to compile its data. This implies that we are not able to distinguish
conduit investor countries from countries where investments originate. Due to the nature of the data, we
are not able to shed much light on the phenomenon of treaty shopping whereby companies adjust their
FDI and ownership structures to avoid taxes. While we likely capture the effects of treaty shopping in
our estimates, we are unable to distinguish it from other factors, i.e. we are unable to capture the
counterfactual FDI relationship which would be in place without treaties or treaty shopping. For
example, we may observe a Netherlands – United States FDI relationship in the data set, but the
underlying relationship might actually be between Germany and the United States with the Netherlands
serving as a treaty shopping intermediary. Unfortunately, we are not able to control for these directly
unobserved relationships or approximate the potential effects this might have on our estimates.
Similarly, the IMF data does not include decomposition into income attributed to special purpose entities
and pass-throughs (Benchmark Definition of Foreign Direct Investment, 2008), which could provide an
indication of treaty shopping. In contrast, Weyzig (2013) exploits detailed Dutch data for special purpose

15
entities and, more recently, Petkova, Stasio, & Zagler (2020) explicitly account for treaty shopping and
calculate the shortest tax distance between any two countries, allowing corporate income to be
channelled through intermediate jurisdictions. Also, Mintz and Weichenrieder (2010) and Lejour (2014)
include empirical analysis related to treaty shopping. Furthermore, so-called round-tripping might lead
to an overestimation of FDI flows (Ledyaeva et al, 2015). More generally, Haberly and Wójcik (2015)
question the representative nature of the FDI data and argue that rather than providing a robust indicator,
the data can only be considered representative within an order of magnitude. While we are aware of
these limitations, no alternatives to this data are currently available. Therefore, rather than precise
quantifications, we consider our results to be illustrative estimates of the effects of tax treaties.
3 Methodology
We now explain the methodological approach we apply to the data set in order to shed more light on
foreign direct investment and tax treaties. We estimate the withholding tax rate elasticities of dividend
and interest outflows, which enables us to observe differences in these elasticities for source countries
worldwide. We then calculate potential tax revenue foregone arising from tax treaties for the source
countries in our data set, incorporating the elasticity estimates into the calculation.
One general way of thinking about the framework for estimating the withholding tax rate elasticities of
dividend and interest outflows is a gravity equation. Although in economics gravity equations have been
used most intensively in the international goods trade, their uses are rather varied, including for fitting
stocks of FDI, as discussed in a recent review by Head & Mayer (2014). Their first definition of a gravity
equation of bilateral trade for our case of FDI and dividend and interest outflows is:
𝑋𝑖𝑗 = 𝐺𝑆𝑗𝑀𝑖𝜙𝑖𝑗
where 𝑋𝑖𝑗 is the dependent variable: the outflow of dividends (or interest) from source country i to
recipient country j. 𝑆𝑗 represents the capabilities of source country j which are relevant to all investor
countries (e.g. its GDP). 𝑀𝑖 captures all of the characteristics of investor country i which affect dividends
from all source countries. The bilateral accessibility of source country i to investor country j is captured

16
by 0 ≤ 𝜙𝑖𝑗 ≤ 1, which specifies the characteristics of these countries including, significantly, the
withholding rates implied by their tax treaties. While we recognise that withholding rates, and – more
generally, tax treaties – are likely to be endogenous to dividend and interest outflows (for a general
equilibrium discussion see Egger et al., 2006), we do not see a method, tool or other means of addressing
this endogeneity. Finally, G may be termed the gravitational constant; however, it is held constant only
in the cross-section and may be linked to the inclusion of time dummies, which remain the same across
countries but differ over time. While this gravity equation provides us with a general framework for our
methodology, our particular specification is based on a recent paper by Balabushko, Beer, Loeprick, &
Vallada (2017) who estimate a similar equation for Ukraine, which we now adopt for our cross-country
analysis.
We estimate the following equation:
log(𝑑𝑖𝑣𝑖𝑑𝑒𝑛𝑑 𝑜𝑢𝑡𝑓𝑙𝑜𝑤)𝑖𝑗𝑡
= 𝛼 + 𝛽1 ∗ 𝑑𝑖𝑣𝑖𝑑𝑒𝑛𝑑 𝑟𝑎𝑡𝑒𝑖𝑗𝑡 + 𝛽2 ∗ 𝑑𝑖𝑗𝑡 + 𝛽3 ∗ 𝑑𝑜𝑚𝑒𝑠𝑡𝑖𝑐 𝑑𝑢𝑚𝑚𝑦𝑖𝑗𝑡 + 𝛽4
∗ (𝑑𝑖𝑣𝑖𝑑𝑒𝑛𝑑 𝑟𝑎𝑡𝑒𝑖𝑗𝑡 × 𝑠𝑜𝑢𝑟𝑐𝑒 𝑑𝑢𝑚𝑚𝑖𝑒𝑠) + 𝛾 ∗ 𝑌𝑒𝑎𝑟 + 𝛿 ∗ 𝐹𝐸 + 𝑒𝑖𝑗𝑡
where the left-hand side is the logarithm of dividend outflow (we also construct an analogous equation
for interest) from source country 𝑖 to recipient country 𝑗 in year 𝑡. 𝛽1 is the coefficient we focus on: the
withholding tax elasticity of dividends. We also include variable 𝑑𝑖𝑗𝑡, which stands for average
withholding tax rate with other countries at time 𝑡. We compute this rate as the weighted average (i.e.
weighted by dividend outflow) of withholding tax rates with all partner countries other than country 𝑗.
The logic behind the inclusion of variable 𝑑𝑖𝑗𝑡 is that an increase in withholding tax rates with other
partners could re-route some dividend flows through the given partner country, which is in agreement
with Balabushko, Beer, Loeprick, & Vallada (2017). We further include a 𝑑𝑜𝑚𝑒𝑠𝑡𝑖𝑐 𝑑𝑢𝑚𝑚𝑦 variable
which indicates whether the dividend rate is the result of a double tax treaty (value of 1) or a domestic
rate (value of 0). 𝛽4 then represents the coefficient for interaction terms between the dividend rate and
country source dummies and captures the differences between effects on various source countries. In
accordance with economic logic, we expect the coefficients to be negative for 𝛽1, positive for 𝛽3, and
17
varied for 𝛽2 and 𝛽4. The model also includes year dummy variables and various sets of fixed effects
(𝐹𝐸); finally, 𝑒𝑖𝑗𝑡 stands for the error term. The interpretation of the estimation results is standard for a
log-linear regression model: a 1% increase in the applicable withholding tax rate on dividends results in
a ((𝛽1 + 𝛽4) × 100)% change in dividend outflows.
Insufficient data set variation may not facilitate the estimation of source-country-specific elasticities for
every source country. To obtain relevant elasticity estimates for such source countries, we estimate a
slightly simplified and less data-demanding regression model. While all countries are included in this
model, it does not produce source-country-specific estimates but instead provides us with one elasticity
estimate for all countries. Specifically, we estimate the above equation without the term
𝛽4(𝑑𝑖𝑣𝑖𝑑𝑒𝑛𝑑 𝑟𝑎𝑡𝑒𝑖𝑗𝑡 × 𝑠𝑜𝑢𝑟𝑐𝑒 𝑑𝑢𝑚𝑚𝑖𝑒𝑠), which produces the following equation:
log(𝑑𝑖𝑣𝑖𝑑𝑒𝑛𝑑 𝑜𝑢𝑡𝑓𝑙𝑜𝑤)𝑖𝑗𝑡
= 𝛼 + 𝛽1 ∗ 𝑑𝑖𝑣𝑖𝑑𝑒𝑛𝑑 𝑟𝑎𝑡𝑒𝑖𝑗𝑡 + 𝛽2 ∗ 𝑑𝑖𝑗𝑡 + 𝛽3 ∗ 𝑑𝑜𝑚𝑒𝑠𝑡𝑖𝑐 𝑑𝑢𝑚𝑚𝑦𝑖𝑗𝑡 + 𝛾 ∗ 𝑌𝑒𝑎𝑟
+ 𝛿 ∗ 𝐹𝐸 + 𝑒𝑖𝑗𝑡
The interpretation is slightly different in this case: a 1% increase in the applicable withholding tax rate
on dividends results in a (𝛽1 × 100)% change in dividend outflows. For source countries where we are
unable to estimate the original equation and thus obtain a country-specific elasticity estimate, this
adjusted equation provides a proxy which we subsequently employ in potential revenue foregone
estimates.
The specific equations that we estimate differ according to the fixed effects used; guidance on their
appropriate selection is currently available, as summarised by Bergstrand & Egger (2013). For example,
Mátyás (1997) proposes using separate effects, i.e. in our case: source, investor and time, while Cheng
& Wall (2004) prefer country-pair fixed effects in order to process unobserved heterogeneity within
country pairs. Baltagi, Egger, & Pfaffermayr (2003) add fixed exporter-year and importer-year effects
to the country-pair fixed effects, producing a specification which seems best suited for our case. As we
estimate our gravity equation on panel data, this approach calls for the use of time-varying country
effects that capture time-variant determinants such as GDP. Moreover, we need to leave our country-

18
pair effects without a time dimension, allowing us to input bilateral tax rate variables into our model.
We therefore use exporter–year, importer–year and country–pair fixed effects in the preferred
specification. To check the robustness of the results, we estimate additional regression specifications.
These include e.g. interactions with the World Bank’s region and income group dummies to test for any
differences between these broader groups of countries.
To estimate the equation, we opt for the Poisson pseudo-maximum-likelihood (PPML) method, which
is preferable to the ordinary least squares (OLS) method. PPML, applied recently in the tax treaty context
by Braun & Zagler (2018), helps us address the issue of a large number of zeros in the observations of
our dependent variable, i.e. dividend or interest outflow (6,051 and 5,863 zeros, respectively). Since we
wish to interpret our results as elasticities, the standard approach is to use logarithms of our dependent
variable. However, this would mean dropping all of our zero flows which is undesirable due to the
probability that the zeros in our sample are not randomly distributed and that they contain valuable
information. On the other hand, PPML enables us to use the dependent variable in non-linear form and
still interpret the coefficients as elasticities. Furthermore, Silva & Tenreyro (2006) show that under
heteroscedasticity, common in panel data such as ours, OLS leads to biased estimates, while PPML
outperforms this classic approach.
In the second part of our empirical analysis, we estimate the potential tax revenue foregone stemming
from withholding tax rates set in tax treaties which are lower than the standard domestic rates in the
absence of tax treaties. We arrive at the potential tax revenue foregone in a straightforward way,
calculating it as the difference between hypothetical revenue in the absence of a tax treaty, simulated
with the help of established elasticities, and observed revenue in the presence of a tax treaty. Potential
tax revenue foregone 𝑅𝑖 for source country 𝑖 over all of its investor countries 𝑗 may be expressed as
follows:
𝑅𝑖𝑡 = ∑(𝑎𝑑𝑗𝑢𝑠𝑡𝑒𝑑 𝑑𝑖𝑣𝑖𝑑𝑒𝑛𝑑 𝑜𝑢𝑡𝑓𝑙𝑜𝑤𝑖𝑗𝑡 × 𝑑𝑜𝑚𝑒𝑠𝑡𝑖𝑐 𝑑𝑖𝑣𝑖𝑑𝑒𝑛𝑑 𝑟𝑎𝑡𝑒𝑖𝑡
𝑗
− 𝑑𝑖𝑣𝑖𝑑𝑒𝑛𝑑 𝑜𝑢𝑡𝑓𝑙𝑜𝑤𝑖𝑗𝑡 × 𝑑𝑖𝑣𝑖𝑑𝑒𝑛𝑑 𝑟𝑎𝑡𝑒𝑖𝑗𝑡)

19
where
𝑎𝑑𝑗𝑢𝑠𝑡𝑒𝑑 𝑑𝑖𝑣𝑖𝑑𝑒𝑛𝑑 𝑜𝑢𝑡𝑓𝑙𝑜𝑤𝑖𝑗𝑡 = 𝑑𝑖𝑣𝑖𝑑𝑒𝑛𝑑 𝑜𝑢𝑡𝑓𝑙𝑜𝑤𝑖𝑗𝑡 − 𝑑𝑖𝑣𝑖𝑑𝑒𝑛𝑑 𝑜𝑢𝑡𝑓𝑙𝑜𝑤𝑖𝑗𝑡 ×
𝑑𝑖𝑣𝑖𝑑𝑒𝑛𝑑 𝑒𝑙𝑎𝑠𝑡𝑖𝑐𝑖𝑡𝑦𝑖𝑡 × (𝑑𝑜𝑚𝑒𝑠𝑡𝑖𝑐 𝑑𝑖𝑣𝑖𝑑𝑒𝑛𝑑 𝑟𝑎𝑡𝑒𝑖𝑡 − 𝑑𝑖𝑣𝑖𝑑𝑒𝑛𝑑 𝑟𝑎𝑡𝑒𝑖𝑗𝑡).
In the absence of any tax treaty, the estimate of tax revenue foregone is naturally zero, as in this case
𝑑𝑖𝑣𝑖𝑑𝑒𝑛𝑑 𝑟𝑎𝑡𝑒𝑖𝑗𝑡 equals 𝑑𝑜𝑚𝑒𝑠𝑡𝑖𝑐 𝑑𝑖𝑣𝑖𝑑𝑒𝑛𝑑 𝑟𝑎𝑡𝑒𝑖𝑡. In addition, we estimate revenue foregone
without the use of the estimated elasticities, thus arriving at so-called static estimates of potential
revenue foregone. These static estimates are equivalent to setting all established elasticities to zero,
assuming that 𝑎𝑑𝑗𝑢𝑠𝑡𝑒𝑑 𝑑𝑖𝑣𝑖𝑑𝑒𝑛𝑑 𝑜𝑢𝑡𝑓𝑙𝑜𝑤𝑖𝑗𝑡 = 𝑑𝑖𝑣𝑖𝑑𝑒𝑛𝑑 𝑜𝑢𝑡𝑓𝑙𝑜𝑤𝑖𝑗𝑡. We do this to identify the
differences between these two approaches, i.e. with and without the use of elasticities. The results should
also indicate how biased the results might be in case elasticities are not taken into account, as presented
both in existing research and in the Appendix to this paper. Again, we follow the approach described
for dividends analogously in the case of interest and we report the results for both in the following
section.
4 Results
In this section, we present our estimates of elasticities and subsequently use them to estimate revenue
foregone. We first present the estimates of elasticities without source country interactions in Tables 1
and 2, which include all countries present in our data set. Tables 1 and 2 show estimates of the
withholding tax elasticity of dividend and interest outflows for a number of different specifications and
estimation methods. The first three columns of Tables 1 and 2 show our preferred estimates based on
the PPML baseline specification with time dummies, source-time, recipient-time and country-pair fixed
effects. The first three columns differ only in terms of the data sets used: the first column is based on
the average withholding tax rate data set, the second on the minimum rate set and the third on the
maximum rate set. In addition, we present other specifications as a robustness check only on the basis
of the average withholding tax rate data set. The remaining columns show OLS estimates (the
differences between the number of observations between PPML and OLS estimates are the zeros in the

20
observation of our dependent variables: 6,051 for dividend and 5,863 for interest outflows) and three
sets of PPML estimates with different sets of fixed effects. The estimated scales of elasticities differ
across the specifications, but all point in a similar direction and indicate a similar interpretation across
the specifications; as a result, only our baseline results are discussed below. We provide summary
statistics broken down by income group for the sample used to estimate the baseline models in Table
A1 in the Appendix.
We find both dividend and interest outflows to be elastic. The baseline results are of a similar scale
across the three data sets for dividends. In Table 1 we estimate dividend flows to be highly elastic: a 1%
increase in the applicable withholding tax is associated with a 1.9–2.4% decrease in dividend flows (the
range is given by the lowest and highest estimated elasticity across the three data sets). In Table 2 we
show larger but less statistically significant estimates for interest flows, with a broader interval: 3.9–
7.7%. Although the baseline results for interest in Table 2 differ quite substantially across the three data
sets, they do so in an expected manner, with the lowest values for the minimum data set and highest
values for the maximum data set (i.e. higher withholding tax rates lead to higher estimated elasticities).
It is important to clarify how these results are to be interpreted. The approach we take in this paper
exploits the heterogeneity in the applicable withholding tax rates across country pairs to estimate the
relationship between dividend (and interest) outflows and the withholding tax rates (while controlling
for domestic rates, for whether the applicable rate is the result of a tax treaty or the domestic rate, and
for exporter-year, importer-year and country-pair fixed effects). Since most tax treaties in the database
were signed before the start of the examined time period, the estimated elasticities may be interpreted
as the medium- to long-term effects of changes to an applicable withholding tax rate (either by changing
the domestic rate or by signing a new double tax treaty), rather than as short-term effects.
To show the sensitivity of our results, we use the lowest and highest of the three baseline estimates to
provide the lower and upper bounds of our potential revenue foregone estimates. In addition, we run a
robustness check on our key results using the relatively small sample of OECD data which distinguishes
between dividend and interest outflows (as opposed to IMF data which does not include this

21
information). We obtain similar results (in terms of both their sign and magnitude), although the
coefficients are generally less statistically significant. We report these results in Table A2 in the
Appendix.
We now present the estimates with source country interactions, which cover only a sub-sample of
countries with sufficient data available. Tables 3 and 4 show estimates of the withholding tax elasticity
of dividend and interest outflows (using a model with source country interactions) on the basis of all
three data sets; we report the range for the lowest and highest estimated elasticity across all three. For
example, we estimate dividend flows from Armenia to be highly elastic: a 1% increase in the applicable
withholding tax is associated with a 4.9–5.3% decrease in dividend flows. The results imply highly
elastic outflows for many countries. In the case of dividends, the largest elasticities were established for
Barbados (18–20.5%) and Kazakhstan (20.8–21.3%) while for interest we report the highest values for
Iceland (19.8–20.2%) and Mongolia (10.8–21.5%).
For some countries the coefficients are not statistically significantly different from zero; nevertheless,
we still use them to provide illustrative estimates of potential revenue foregone, keeping in mind the
uncertainty embedded in these results. Furthermore, these estimated elasticities are, in some cases,
positive; however, these are not statistically significantly different from zero with the exception of
Iceland (a closer look at Iceland’s data reveals the existence of a large outlier for dividend outflows to
Luxembourg in 2012; excluding this observation results in estimates which are not statistically
significant). For these source countries we do not calculate estimates of potential revenue foregone in
Tables 5–6 (but instead we provide only static estimates, see Tables A9–A10 in the Appendix). These
positive estimates mean that increasing withholding tax rates on dividends in these countries is
associated with an increase in dividend outflows, which is not in line with basic economic logic. We
recognize two potential explanations for the positive estimates. First, they may be a result of the
endogeneity of withholding tax rates to dividend and interest outflows, i.e. situations in which a
government decides to increase withholding tax rates as a result of an increase in outflows. Second, they
may result from the poor quality of the used data (e.g. due to the severe mismeasurement of bilateral

22
outflows or the strong influence of FDI diversion via third countries); however, as we discuss above, in
view of the limitations of currently available data, we are unable to evaluate these effects.
Overall, we observe a substantial degree of heterogeneity across the estimated elasticities. However, the
observed heterogeneity is difficult to explain even with the best available data. For example, the
elasticities do not seem to differ systematically across regional or income groups of countries, as
highlighted in Tables A3–A6 in the Appendix, where we estimate our models using interactions with
country groups according to region and income. Hardly any statistically significant elasticities have been
established for dividends and only some – with some of them positive – for interest.
Table 1. Withholding tax elasticity of dividend outflows
Dependent variable:
Dividend outflow
PPML PPML PPML OLS PPML PPML PPML
(avg. rates) (min. rates) (max. rates)
(1) (2) (3) (4) (5) (6) (7)
Withholding tax rate -0.0235*** -0.0222*** -0.0193** -0.00722 -0.151*** -0.0168*** -0.107***
(0.00865) (0.00845) (0.00759) (0.00648) (0.00723) (2.46e-05) (7.74e-06)
Withholding tax rate -0.318*** -0.323*** -0.312*** -0.696*** -0.805*** -0.0358*** -0.452***
with other countries (d) (0.0513) (0.0520) (0.0507) (0.185) (0.0357) (4.20e-05) (2.99e-05)
Domestic dummy 0.0867 0.0945 0.0989 0.129 1.159*** 0.215***
(0.0924) (0.0908) (0.0912) (0.0884) (0.162) (0.000282)
Observations 26,987 26,987 26,987 20,936 59,803 27,731 65,199
Source-t FE YES YES YES YES YES
Recipient-t FE YES YES YES YES YES
Pairs FE YES YES YES YES NO YES YES
Source FE YES
Recipient FE YES
Source: Authors. Notes: *** p<0.01%, ** p<0.05%, * p<0.1%. Standard errors in parentheses.
Poisson pseudo maximum-likelihood (PPML); ordinary least squares (OLS), fixed effects (FE).
Table 2. Withholding tax elasticity of interest outflows
Dependent variable:
Dividend outflow
PPML PPML PPML OLS PPML PPML PPML
(avg. rates) (min. rates) (max. rates)
(1) (2) (3) (4) (5) (6) (7)
Withholding tax rate -0.0566 -0.0385 -0.0765** -0.0226** -0.0819*** -0.144*** -0.0239***
(0.0436) (0.0389) (0.0340) (0.0112) (0.0184) (9.10e-06) (0.00266)
Withholding tax rate 0.316 0.0665 -0.396 -0.889*** -0.485*** -0.316*** -0.1336***

23
with other countries (i) (0.406) (0.442) (0.536) (0.154) (0.147) (2.08e-05) (0.00803)
Domestic dummy -0.577 -0.502 -0.656 -0.00590 0.855*** -0.249***
(0.528) (0.514) (0.447) (0.140) (0.258) (0.000133)
Observations 26,657 26,657 26,657 20,972 57,951 27,760 65,199
Source-t FE YES YES YES YES YES - -
Recipient-t FE YES YES YES YES YES - -
Pairs FE - - - - - YES YES
Source FE - - - - - - YES
Recipient FE - - - - - - YES
Source: Authors. Notes: *** p<0.01%, ** p<0.05%, * p<0.1%. Standard errors in parentheses.
Poisson pseudo maximum-likelihood (PPML); ordinary least squares (OLS), fixed effects (FE).
Very few existing studies provide us with an opportunity to compare results. Our estimated elasticities
are in agreement with Balabushko, Beer, Loeprick, & Vallada (2017), who estimated comparable
elasticities for Ukraine at 2.3% for dividends and 7.1% for interest; both of these estimates are within
our own general interval. As Ukraine is not included as a source country in our data set, we are
unfortunately unable to directly compare the country-specific estimates. Other than this pioneering
single-country study, we are unaware of any other work which provides estimates of withholding tax
elasticities of dividend and interest outflows and we believe that our work constitutes the first cross-
country analysis of this phenomenon. Overall, both our general and country-specific estimates clearly
show that dividend and interest flows are sensitive to changes in applicable withholding tax rates and
that they should be taken into account when estimating the revenue foregone of tax treaties.
Table 3. Dividend outflow elasticities, cross-country analysis
Country-specific effects
Source country Minimum rate Average rate Maximum rate
Armenia -4.6% -5.2% -5.3%
Australia 3.9% 4.4% 5.1%
Austria -2.2% -2.4% -2.5%
Barbados -20.2%** -20.5%*** -18.0%*
Belarus -16.9%** -15.4%** -14.3%*
Bolivia 17.4% 25.7% 24.6%
Bosnia 18.8% 18.9% 19.5%
Canada 0.5% 0.2% 0.2%
Costa Rica 0.7% 0.7% 0.7%
Croatia -7.9%* -11.0%* -10.4%*

24
Cyprus -1.2% -1.0% -1.0%
Denmark 1.4% 0.4% 0.4%
Estonia 27.7% 26.7% 25.7%
Georgia -6.3% -6.5% -6.5%
Germany -4.3% -2.7% -4.9%
Ghana 0.5% -1.0% -1.1%
Greece -5.5% -5.7% -6.5%
Hong Kong -3.0% -2.8% -2.8%
Iceland 78.8%** 76.1%** 76.8%**
Israel -0.3% -2.6% -6.0%*
Italy 7.5% 8.1% 8.2%
Japan -3.1% -5.0% -5.4%
Kazakhstan -20.8%*** -21.2%*** -21.3%***
Kyrgyzstan -2.6% -2.5% -2.5%
Lebanon 11.9% 11.5% 11.5%
Mali -4.2% -2.6% 2.6%
Malta -1.5% -1.6% -1.4%
Mexico -1.7% -2.0% -2.1%
Montenegro -12.3%* -12.8%* -13.3%**
Mozambique -10.9%* -11.4%** -11.0%*
Niger -7.3%* -7.5%* -7.5%*
Nigeria 3.6% 3.6% 3.3%
Norway -4.6% -1.9% 1.7%
Panama 27.1% 26.2% 25.1%
Paraguay -3.6% 10.7% 26.9%
Philippines -3.9% -3.9% -4.0%
Poland -0.1% 0.3% 0.1%
Portugal 4.7% 4.7% 4.6%
Romania -13.2%** -17.7%** -3.6%
Senegal -4.1% -4.1% -3.9%
Slovakia 9.0% 8.8% 8.7%
Slovenia 4.1% 4.1% 3.8%
South Africa -1.6% -2.0% -1.8%
Spain 1.1% 0.3% -1.2%
Sweden 0.6% -7.6%* -3.9%
Switzerland -8.3%* -11.0%** -16.6%**
Tajikistan -0.6% -0.5% -0.6%
Turkey -3.5% -3.6% -3.7%
Uganda 26.0% 25.4% -
Uruguay -2.9% -5.2% -1.8%

25
USA -2.5% -4.8% -11.4%**
Venezuela -3.2% -3.3% -3.3%
Source: Authors. Notes: *** p<0.01%, ** p<0.05%, * p<0.1%.
Table 4. Interest outflow elasticities, cross-country analysis
Country-specific effects
Source country Minimum rate Average rate Maximum rate
Argentina -1.0% -1.5% -1.1%
Armenia -8.1% -10.3% -9.6%
Australia 6.1% 12.1% 30.3%
Barbados -6.7% -6.8% -6.6%
Belarus 7.9% 15.9% 16.3%
Bolivia 35.4% 36.3% 32.1%
Bosnia -8.6% -9.5% -7.3%
Bulgaria -0.2% -2.4% -2.5%
Canada -0.5% -0.8% -0.2%
Costa Rica 26.1% 3.4% 10.6%
Croatia - -4.0% -3.2%
Cyprus -1.6% -2.0% -1.6%
Denmark 2.1% 0.5% 0.7%
Germany -0.5% -0.3% 0.6%
Greece -4.7% -11.0% -
Hong Kong -5.6% -7.5% -7.7%
Iceland -19.9% -20.2%* -19.8%*
India -1.0% -5.3% 5.7%
Ireland 12.3% 14.4% 18.5%
Israel 9.1% 11.1% 16.7%
Italy 3.0% 4.4% 7.8%
Japan -3.1% -6.2% -6.6%
Kazakhstan -7.4% -16.9% -36.9%**
Kosovo -5.7% -6.1% -5.5%
Kyrgyzstan -1.2% -0.7% -0.5%
Lebanon -8.3% -8.4% -8.0%
Mali 1.4% -3.0% -4.5%
Malta -3.4% -4.3% -3.3%
Mexico -2.5% -2.9% -1.8%
Mongolia -10.8% -20.1%* -21.5%*
Montenegro 36.4% 32.7% 30.9%
Mozambique -7.0% -11.3% -6.7%

26
Niger 2.6% 2.3% 2.8%
Norway 38.8% 39.8% 35.0%
Paraguay -1.9% -6.6% -1.3%
Philippines -0.4% -2.7% -3.0%
Poland 0.9% 1.3% 0.9%
Portugal -2.2% -3.0% -3.3%
Romania -8.8% -9.2% -8.0%
Senegal -4.7% -5.2% -3.8%
Seychelles -3.7% -4.4% -3.5%
Slovakia 3.1% 3.8% 6.3%
Slovenia -1.4% -1.3% -1.1%
South Africa -0.2% -0.5% -0.1%
Spain -1.0% 4.6% 5.4%
Tajikistan - 3.2% 1.8%
Thailand 31.5% 0.1% 10.7%
Turkey 11.8% 41.8% 36.1%
Uganda 32.1% 32.7% 29.0%
United Kingdom -2.8% -3.6% -4.0%
Uruguay -2.0% -2.2% -2.0%
United States -2.1% -4.6% -2.1%
Venezuela 35.4% 38.1% 30.1%
Source: Authors. Notes: *** p<0.01%, ** p<0.05%, * p<0.1%.
We now present our estimates of the potential tax revenue foregone resulting from tax treaties’ lower
withholding tax rates on dividend and interest flows. As with the elasticities, we estimate three sets of
potential revenue foregone estimates associated with the three versions of our data set: minimum,
average, maximum. Of these three estimates, we consider the lowest and the highest estimates (either of
which could arise from any of the three estimated elasticities) for each pair of countries and take them
into account as approximate lower and upper bounds of the estimated effects. We present the results
from the point of view of both source and investor countries, so as to learn which countries have the
highest revenue foregone and which countries are responsible for the revenue foregone. In addition to
thousand-dollar values, we express the estimated revenue foregone as shares of GDP to provide a
relative perspective for each of the economies comparable across countries (we use GDP instead of tax
revenues due to better data coverage available for the former). We also present the share of each

27
country’s revenue foregone related to relationships with EU member states. Due to the important role
of the EU’s Parent-Subsidiary and Interest and Royalties Directives for EU member states and
Switzerland, the EU share is bound to be substantial for these countries; however, it will also be
important for other countries indirectly affected by these directives. The presented results provide
estimates of tax revenue foregone for the widest possible range of countries.
For a number of countries our results suggest substantial revenue foregone due to both interest and
dividend payments. In agreement with estimated elasticities, revenue foregone intervals (between the
lower and upper bound estimates) are significantly wider for interest payments. Tables 5 and 6 show the
potential annual revenue foregone associated with dividends and interest by source country, while
Tables 7 and 8 do so by recipient country (and only show countries with upper bound estimates of more
than 10 million USD; full results are available in the online appendix). Let us illustrate the aggregate
scale of the estimated revenue foregone: if we sum all the potential revenue foregone across countries,
the ranges are 11.7 to 19.5 billion USD for dividends and 1.0 to 7.8 billion USD for interest, or 12.8 to
27.4 billion USD altogether, which is approximately 0.02–0.04% of the total world GDP.
Approximately half of this estimated revenue foregone incurs to EU member states, most of which is a
result of EU directives rather than of standard tax treaties. The highest revenue foregone relative to GDP
related to dividends is estimated for Czechia (0.54–0.68%), where most of the revenue foregone is
related to the EU directives (95%) rather than to tax treaties (in this respect it is similar to other EU
member states, as reported for each country in Tables 5 and 6). The highest revenue foregone resulting
from tax treaties and dividends alone (as relative to GDP) are estimated for New Zealand (0.14–0.18%),
Canada (0.11–0.12%), and Mongolia (0.09–0.1%). Where interest is concerned, the highest revenue
foregone relative to GDP resulting from tax treaties alone is estimated for Canada (0.17–0.19%).
Source countries with the highest estimated revenue foregone in absolute values include some of the
world’s largest economies. For example, the United States’ estimated revenue foregone values are
relatively high for both dividends (with an upper bound estimate of 2.6 billion USD) and interest (upper
bound estimate of 4.6 billion USD). From the opposite point of view, we find that as a recipient country,
the Netherlands is responsible for the largest share of potential revenue foregone worldwide, 2.2–2.5

28
billion USD for dividends and 0.4–1.3 billion USD for interest, with a large share of both related to the
EU directives. The Netherlands is also perceived as important in similar analyses by McGauran &
Fernandez (2013), Weyzig (2012), Garcia-Bernardo, Fichtner, Takes, & Heemskerk (2017) and Janský
& Šedivý (2019).
The results shown in Tables 5–8 only include country-level sums for country-pair-level estimates of
potential revenue foregone due to space constraints; our results are presented in full at the country-pair-
level in the online appendix. Tables A7 and A8 in the Appendix show potential revenue foregone by
source country for three recipient countries associated with the highest potential revenue foregone for
dividends and interest, respectively. For France and dividends, for example, these three countries are
Luxembourg, the Netherlands, and the United Kingdom; together, they account for around 35 per cent
of France’s overall potential revenue foregone.
We demonstrate the significance of reflecting elasticities in our headline potential tax revenue foregone
estimates by comparing them with so-called static estimates which do not take the estimated elasticities
into consideration. Tables A9 and A10 report our static estimates of the potential revenue foregone by
source country for dividends and interest, respectively. As expected, the static estimates imply
substantially higher tax revenue foregone than our elastic estimates. A case in point is Bangladesh, for
which our static revenue foregone estimate related to dividends is 79 million USD (equivalent static
estimates by ActionAid (2016) and Janský & Šedivý (2019), respectively, were 75 million USD and 85
million USD), whereas our elastic estimate puts the potential revenue foregone at only 42–49 million
USD. We find comparable differences for the majority of countries and confirm the notion that static
estimates tend to overestimate potential tax revenue foregone: when the behavioural reaction is reflected
through the inclusion of elasticities, the estimates of potential revenue foregone are approximately
halved.
5 Conclusion
Tax treaties are designed to support cross-border investment and trade and to avoid double taxation.
However, they are often used for tax avoidance and other purposes by MNEs, resulting in lower tax

29
revenues for the governments of investment-hosting countries. While these revenues foregone are
acknowledged in the existing literature, the extent of revenue at stake has remained unknown for many
countries around the world. Likewise, the reduction in estimated revenue foregone as a result of the
sensitivity of income flows to withholding tax rates has also remained unknown. In this paper we have
filled these gaps and provided approximate estimates of elasticities and potential revenue foregone as a
result of tax treaties for many countries at different levels of income using the most suitable cross-
country data sets. To summarize our results, we found that reflecting elasticities renders the estimated
revenue foregone substantially lower than static estimates, which tend to overestimate the revenue
foregone. Nevertheless, we show that even if foregone tax revenue estimates are considerably lower
than previously suggested by static estimates, the amounts at stake are not negligible. Some countries
appear to be losing significant tax revenues as a result of tax treaties.
While we rely on the best available sources of cross-country information for withholding tax rates, FDI
income flows and standard econometric methods, our methodological approach is naturally not without
its limitations and there are opportunities for further research to refine our estimates of both elasticities
and revenue foregone. One such opportunity is to better reflect so-called tax treaty shopping, perhaps
by applying network analysis methods or more complex data on FDI flows when they become available,
including a clear distinction between investor, conduit and host countries. Improved FDI data coverage
of individual countries would also be a welcome change, since FDI data is available for far fewer
countries than withholding tax information, which leads to sample selection bias. For example, high-
income countries are more likely to be present in the data than low-income countries – and the estimated
revenue foregone should be interpreted with this limitation in mind. While we estimate elasticities and
revenue foregone for both dividend and interest income, we model each of them separately and future
research should investigate how their potential interdependence influences these estimates. Furthermore,
in this paper we have not examined whether the effect of tax treaties has varied over time – for example,
it is possible that dividend and interest outflows are more responsive to tax treaties in recent years (as
compared to previous periods) as multinational companies become more aggressive in their tax planning
strategies. Future research could investigate the development of the estimated elasticities over time.

30
Finally, we only focus on revenue foregone rather than on benefits or other costs such as effects
incorporation in host countries, foreign investment or reinvestment in host economies.

31
Table 5. Potential revenue foregone, source countries – dividends
Lower bound estimate Upper bound estimate
Source country Year Lower bound % EU % GDP Upper bound % EU % GDP
Canada 2015 2,787,421 37.5 0.179 3,025,663 37.5 0.194
United States 2016 0 0 0 2,654,008 72.9 0.014
France 2016 1,475,822 86.5 0.06 2,085,735 87.3 0.085
Poland 2016 1,645,193 96.3 0.349 1,711,489 96.3 0.363
Germany 2016 0 0 0 1,508,634 87.2 0.043
Spain 2016 1,196,669 89.5 0.097 1,467,184 89.2 0.119
Czechia 2016 1,060,903 94.9 0.543 1,330,895 94.9 0.681
Russia 2016 1,145,935 91.5 0.089 1,226,746 91.3 0.096
Japan 2016 0 0 0 1,054,969 50.1 0.021
South Korea 2016 599,374 37.3 0.042 713,991 37.3 0.051
Austria 2016 519,967 80.4 0.133 657,238 80.4 0.168
South Africa 2016 394,817 75.7 0.134 428,736 75.7 0.145
Australia 2016 102,291 24.8 0.008 330,973 20.3 0.027
New Zealand 2015 239,630 0 0.136 318,243 0 0.181
Mexico 2015 114,600 85.7 0.01 190,922 40.5 0.017
Romania 2016 19,031 100 0.01 135,688 100 0.072
Israel 2016 0 0 0 117,054 52.8 0.037
Chile 2016 63,662 49.6 0.026 113,564 50.8 0.046
Lithuania 2014 56,569 92 0.117 62,074 92 0.128
Serbia 2016 46,887 89.7 0.122 54,318 89.7 0.142
Bangladesh 2014 41,977 38.8 0.024 48,630 38.8 0.028
Turkey 2016 42,053 61.7 0.005 47,185 63.6 0.005
Slovenia 2014 40,711 99 0.082 45,469 99 0.091
Greece 2014 27,349 97.4 0.012 35,164 97.4 0.015
Philippines 2016 19,257 26.8 0.006 33,148 55.9 0.011
Bulgaria 2016 28,950 98.4 0.054 29,622 96.9 0.056
Mongolia 2016 10,683 7.3 0.096 12,376 7.3 0.111
Azerbaijan 2016 9,686 90 0.026 10,120 90.2 0.027
North Macedonia 2016 8,821 91 0.081 9,469 91.9 0.087
Ghana 2015 7,746 83.4 0.021 8,153 83.4 0.022
Georgia 2016 1,502 33.2 0.01 7,877 80.2 0.055
Nigeria 2016 5,741 0 0.001 6,010 0 0.001
Pakistan 2015 2,726 0.3 0.001 5,947 0.2 0.002
Thailand 2016 5,617 0 0.001 5,926 0 0.001
Sri Lanka 2016 2,587 0.4 0.003 4,917 0.2 0.006
Albania 2016 4,545 85.6 0.038 4,895 86.2 0.041
Zambia 2015 3,324 60 0.016 3,647 60 0.017
Costa Rica 2016 3,323 100 0.006 3,323 100 0.006
Botswana 2015 2,776 66.5 0.019 2,882 66.5 0.02
El Salvador 2013 2,215 100 0.009 2,566 100 0.011
Armenia 2016 1,334 45.1 0.013 1,707 50.8 0.016
Croatia 2016 0 0 0 1,590 98.6 0.003
Seychelles 2016 1,179 34.9 0.083 1,293 34.9 0.091
Lebanon 2011 836 37.4 0.002 882 37.4 0.002
Uganda 2011 0 0 0 868 35.6 0.004
Kyrgyzstan 2011 260 93.4 0.004 263 93.4 0.004
Tajikistan 2016 211 27 0.003 214 27 0.003
Paraguay 2011 0 0 0 19 0 0
Bosnia and Herzegovina 2015 0 100 0 0 100 0
Source: Authors. Notes: Thousands USD, sorted decreasingly by the upper bound, EU-28 member
countries in bold.

32
Table 6. Potential revenue foregone, source countries – interest
Lower bound estimate Upper bound estimate
Source country Year Lower bound % EU % GDP Upper bound % EU % GDP
United States 2016 0 0.0 0.000 4,634,154 76.0 0.025
Spain 2016 0 0.0 0.000 865,356 86.2 0.070
Canada 2015 489,832 43.6 0.031 596,169 48.7 0.038
Poland 2016 396,761 95.9 0.084 440,536 95.7 0.093
Belgium 2016 0 0.0 0.000 372,336 97.7 0.080
Russia 2016 0 0.0 0.000 225,862 93.4 0.018
Italy 2016 0 0.0 0.000 205,985 95.6 0.011
Portugal 2016 49,624 96.6 0.024 128,697 95.8 0.063
Argentina 2016 41,443 85.1 0.008 67,443 84.5 0.012
Brazil 2013 0 0.0 0.000 42,372 83.8 0.002
New Zealand 2015 0 0.0 0.000 40,727 4.1 0.023
Japan 2016 0 0.0 0.000 26,010 52.2 0.001
Bulgaria 2016 19,332 97.8 0.036 25,888 95.4 0.049
Slovakia 2016 0 0.0 0.000 25,714 95.5 0.029
Australia 2016 0 0.0 0.000 23,795 13.0 0.002
Chile 2016 0 0.0 0.000 22,631 59.2 0.009
Indonesia 2016 0 0.0 0.000 22,210 32.2 0.002
Philippines 2016 5,139 34.6 0.002 17,509 38.3 0.006
South Africa 2016 14,726 83.8 0.005 15,619 84.2 0.005
Croatia 2016 8,898 98.4 0.018 11,565 98.4 0.023
Mexico 2015 6,730 47.5 0.001 11,293 45.5 0.001
South Korea 2016 0 0.0 0.000 10,317 40.0 0.001
Slovenia 2014 9,655 99.1 0.019 10,193 99.2 0.020
India 2015 0 0.0 0.000 7,028 43.1 0.000
Czechia 2016 0 0.0 0.000 6,171 94.9 0.003
Lithuania 2014 2,225 100.0 0.005 5,823 100.0 0.012
Greece 2014 0 0.0 0.000 5,563 94.3 0.002
Georgia 2016 2,116 85.9 0.015 2,856 83.5 0.020
Serbia 2016 0 0.0 0.000 2,796 92.4 0.007
Thailand 2016 0 0.0 0.000 1,182 30.5 0.000
North Macedonia 2016 257 99.8 0.002 1,060 99.9 0.010
Tajikistan 2016 878 39.4 0.013 954 29.0 0.014
Morocco 2016 0 0.0 0.000 640 5.4 0.001
Albania 2016 0 0.0 0.000 366 92.8 0.003
Armenia 2016 0 0.0 0.000 347 35.6 0.003
Belarus 2015 0 0.0 0.000 263 93.6 0.000
Moldova 2015 33 48.1 0.001 260 55.2 0.004
Bosnia and Herzegovina 2015 37 99.7 0.000 182 99.6 0.001
Ghana 2015 0 0.0 0.000 79 29.0 0.000
Costa Rica 2016 0 0.0 0.000 65 100.0 0.000
Nigeria 2016 21 0.0 0.000 56 0.0 0.000
Kosovo 2015 48 100.0 0.001 55 100.0 0.001
Seychelles 2016 16 35.0 0.001 22 35.0 0.002
Bangladesh 2014 0 0.0 0.000 21 40.1 0.000
Kyrgyzstan 2011 3 99.7 0.000 3 99.8 0.000
Lebanon 2011 2 37.4 0.000 3 37.4 0.000
Source: Authors. Notes: Thousands USD, sorted decreasingly by the upper bound, EU-28 member
countries in bold.

33
Table 7. Potential revenue foregone, recipient country – dividends
Lower-bound estimate Upper-bound estimate
Recipient Lower bound % EU Upper bound % EU
Netherlands 2,212,345 61.9 2,521,159 50.6
United States 2,068,634 11 2,311,099 9.5
Luxembourg 1,436,169 77.4 1,593,795 80
United Kingdom 1,084,424 52.3 1,560,739 32.8
Germany 1,099,202 80 1,377,425 67.8
France 562,998 77.6 941,511 44.9
Switzerland 708,611 59.5 939,393 39.7
Japan 453,800 13.2 828,825 6.9
Cyprus 696,419 17.4 768,929 17.9
Italy 345,391 90.9 401,330 92.7
Belgium 346,505 86 358,028 87.3
Canada 74,319 17.8 340,692 2.6
Austria 293,232 82.3 337,123 84.1
Australia 208,716 1.6 322,679 1
Spain 261,989 70.9 281,924 57.5
Sweden 180,316 52.4 256,576 45.5
Singapore 133,557 8.4 221,979 3.9
Hong Kong 103,334 16.6 147,345 12.2
Ireland 92,682 47.2 145,052 28.8
China 128,260 8.9 142,547 6.4
Russia 89,935 86.6 112,187 87
Finland 83,686 69.7 102,247 66.6
Denmark 65,057 65.7 95,110 71.6
South Korea 55,438 52.9 92,438 29.2
United Arab Emirates 69,947 34.6 73,124 36.2
Brazil 58,301 15.7 61,530 8.3
Norway 54,145 0 60,326 0
Malta 47,307 35.7 52,894 33.2
Hungary 40,154 37 48,262 30.8
Poland 38,626 66.3 46,909 63.8
Portugal 41,656 95.6 45,922 96.8
Mexico 31,319 68.4 44,028 49.5
Slovakia 33,921 99.3 42,191 99.3
Taiwan 6,432 8.2 25,303 1.2
Malaysia 18,740 2.9 23,644 2
South Africa 17,432 65.3 23,153 62.1
Czechia 10,896 91.3 21,552 93
Uruguay 15,096 98.4 18,389 98.7
India 13,292 6.5 16,757 2.3
Saudi Arabia 13,383 18.1 14,976 19.1
Lebanon 9,835 93.7 13,714 95.6
Colombia 11,615 59.4 13,594 49.6
Kuwait 11,856 20.3 13,288 23.6
Qatar 9,733 71.8 12,609 78.9
Greece 8,129 52 11,892 62.8
Source: Authors. Notes: Thousands USD, sorted decreasingly by the upper bound, EU-28 member
countries in bold, countries with upper bound estimates below USD 10 million left out for
presentational purposes and are available upon request and in the online data and code repository.

34
Table 8. Potential revenue foregone, recipient country – interest
Lower-bound estimate Upper-bound estimate
Recipient Lower bound % EU Upper bound % EU
Netherlands 354,203 75.8 1,316,648 47.7
Luxembourg 222,087 80.3 1,088,806 39.8
United Kingdom 93,241 51.5 1,043,456 17.7
France 149,617 94.6 738,818 47.1
United States 452,621 43.1 729,598 64.2
Germany 145,631 90.3 693,439 36.0
Switzerland 101,267 63.1 650,388 22.6
Canada 11,531 76.6 552,978 3.5
Japan 45,351 57.5 504,235 11.3
Spain 86,044 78.5 204,018 51.2
Belgium 44,866 95.3 198,347 40.6
Ireland 19,106 73.5 159,462 16.8
Cyprus 19,788 96.2 135,527 18.0
Italy 35,801 94.9 124,641 73.4
Sweden 22,769 90.3 114,433 36.0
Australia 15,219 22.6 85,920 8.6
Austria 30,973 96.2 63,953 67.5
Norway 11,238 0.0 59,813 0.0
Denmark 13,563 91.7 45,882 39.9
China 13,698 12.2 44,060 6.7
South Korea 3,084 70.7 42,354 9.2
Singapore 3,714 81.4 31,893 36.3
Mexico 3,468 63.3 31,257 55.2
Hungary 7,254 77.9 28,871 33.5
Hong Kong 7,721 0.0 24,084 29.8
Portugal 3,815 75.3 23,348 93.9
Finland 5,621 91.3 20,377 40.9
Russia 2,651 74.2 19,853 62.3
United Arab Emirates 6,939 1.2 15,112 52.0
Brazil 9,019 8.7 11,601 13.0
Iceland 164 0.0 10,402 0.0
Source: Authors. Notes: Thousands USD, sorted decreasingly by the upper bound, EU-28 member
countries in bold, countries with upper bound estimates below USD 10 million left out for
presentational purposes and are available upon request and in the online data and code repository.

35
6 References
ActionAid. (2016). Mistreated: The tax treaties that are depriving the world’s poorest countries of vital
revenue. ActionAid. http://www.actionaid.org/publications/mistreated-tax-treaties-are-
depriving-worlds-poorest-countries-vital-revenue
Azémar, C., Desbordes, R., & Mucchielli, J.-L. (2007). Do tax sparing agreements contribute to the
attraction of FDI in developing countries? International Tax and Public Finance, 14(5), 543–
562. https://doi.org/10.1007/s10797-006-9005-9
Azémar, C., & Dharmapala, D. (2019). Tax sparing agreements, territorial tax reforms, and foreign
direct investment. Journal of Public Economics, 169, 89–108.
https://doi.org/10.1016/j.jpubeco.2018.10.013
Baker, P. L. (2014). An Analysis of Double Taxation Treaties and their Effect on Foreign Direct
Investment. International Journal of the Economics of Business, 21(3), 341–377.
https://doi.org/10.1080/13571516.2014.968454
Balabushko, O., Beer, S., Loeprick, J., & Vallada, F. (2017). The direct and indirect costs of tax treaty
policy: Evidence from Ukraine (Policy Research Working Paper Series No. 7982). The World
Bank.
Baltagi, B. H., Egger, P., & Pfaffermayr, M. (2003). A generalized design for bilateral trade flow
models. Economics Letters, 80(3), 391–397.
Barthel, F., Busse, M., & Neumayer, E. (2010). The impact of double taxation treaties on foreign direct
investment: Evidence from large dyadic panel data. Contemporary Economic Policy, 28(3),
366–377.
Beer, S., & Loeprick, J. (2020). Too high a price? Tax treaties with investment hubs in Sub-Saharan
Africa. International Tax and Public Finance. https://doi.org/10.1007/s10797-020-09615-4
Benchmark Definition of Foreign Direct Investment. (2008). OECD.
Bergstrand, J. H., & Egger, P. (2007). A knowledge-and-physical-capital model of international trade
flows, foreign direct investment, and multinational enterprises. Journal of International
Economics, 73(2), 278–308.

36
Bergstrand, J. H., & Egger, P. (2013). Gravity equations and economic frictions in the world economy.
In Palgrave handbook of international trade (pp. 532–570). Springer.
Blanchard, O., & Acalin, J. (2016). What Does Measured FDI Actually Measure? Peterson Institute for
International Economics.
Blonigen, B. A., & Davies, R. B. (2002). Do bilateral tax treaties promote foreign direct investment?
National Bureau of Economic Research.
Blonigen, B. A., & Davies, R. B. (2004). The Effects of Bilateral Tax Treaties on US FDI Activity.
International Tax and Public Finance, 11(5), 601–622.
Blonigen, B. A., Oldenski, L., & Sly, N. (2014). The Differential Effects of Bilateral Tax Treaties.
American Economic Journal: Economic Policy, 6(2), 1–18. https://doi.org/10.1257/pol.6.2.1
Bolwijn, R., Casella, B., & Rigo, D. (2018). An FDI-driven approach to measuring the scale and
economic impact of BEPS. Transnational Corporations, 25(2), 107–143.
https://doi.org/10.18356/c4f9fd3c-en
Braun, J., & Zagler, M. (2018). The true art of the tax deal: Evidence on aid flows and bilateral double
tax agreements. The World Economy. https://doi.org/10.1111/twec.12628
Bürgi, E., & Meyer, S. (2013). Schweizer Doppelbesteuerungsabkommen: Aktuelle Politik und
Entwicklungsrelevanz.
Carr, D. L., Markusen, J. R., & Maskus, K. E. (2001). Estimating the knowledge-capital model of the
multinational enterprise. American Economic Review, 91(3), 693–708.
Casella, B. (2019). Looking through conduit FDI in search of ultimate investors–a probabilistic
approach. Transnational Corporations, 26(1), 109.
Cheng, I.-H., & Wall, H. (2004). Controlling for heterogeneity in gravity models of trade and
integration. Federal Reserve Bank of St. Louis.
Chetty, R., & Saez, E. (2005). Dividend taxes and corporate behavior: Evidence from the 2003 dividend
tax cut. The Quarterly Journal of Economics, 120(3), 791–833.
Chetty, R., & Saez, E. (2010). Dividend and corporate taxation in an agency model of the firm. American
Economic Journal: Economic Policy, 2(3), 1–31.

37
Chisik, R., & Davies, R. B. (2004a). Asymmetric FDI and tax-treaty bargaining: Theory and evidence.
Journal of Public Economics, 88(6), 1119–1148.
Chisik, R., & Davies, R. B. (2004b). Gradualism In Tax Treaties With Irreversible Foreign Direct
Investment*. International Economic Review, 45(1), 113–139. https://doi.org/10.1111/j.1468-
2354.2004.00119.x
Clausing, K. A. (2016). The Effect of Profit Shifting on the Corporate Tax Base in the United States and
Beyond. National Tax Journal, 69(4), 905–934. https://doi.org/10.17310/ntj.2016.4.09
Cobham, A., & Janský, P. (2018). Global distribution of revenue loss from corporate tax avoidance: Re-
estimation and country results. Journal of International Development, 30(2), 206–232.
https://doi.org/10.1002/jid.3348
Cobham, A., & Janský, P. (2019). Measuring misalignment: The location of US multinationals’
economic activity versus the location of their profits. Development Policy Review, 37(1), 91–
110. https://doi.org/10.1111/dpr.12315
Coordinated Direct Investment Survey Guide. (2015). IMF.
Coupé, T., Orlova, I., & Skiba, A. (2009). The effect of tax and investment treaties on bilateral FDI
flows to transition countries. In The Effect of Treaties on Foreign Direct Investment. Oxford
University Press.
Crivelli, E., de Mooij, R., & Keen, M. (2016). Base Erosion, Profit Shifting and Developing Countries.
FinanzArchiv: Public Finance Analysis, 72(3), 268–301.
https://doi.org/10.1628/001522116X14646834385460
Damgaard, J., & Elkjaer, T. (2017). The Global FDI Network: Searching for Ultimate Investors (IMF
Working Paper No. 17/258). International Monetary Fund.
Damgaard, J., Elkjaer, T., & Johannesen, N. (2019). What Is Real and What Is Not in the Global FDI
Network? IMF Working Paper, 2019(274), 1–51.
Davies, R. B. (2004). Tax Treaties and Foreign Direct Investment: Potential versus Performance.
International Tax and Public Finance, 11, 775–802.

38
Dharmapala, D. (2014). What Do We Know about Base Erosion and Profit Shifting? A Review of the
Empirical Literature. Fiscal Studies, 35(4), 421–448. https://doi.org/10.1111/j.1475-
5890.2014.12037.x
Dowd, T., Landefeld, P., & Moore, A. (2017). Profit shifting of U.S. multinationals. Journal of Public
Economics, 148, 1–13. https://doi.org/10.1016/j.jpubeco.2017.02.005
Egger, P., Larch, M., Pfaffermayr, M., & Winner, H. (2006). The impact of endogenous tax treaties on
foreign direct investment: Theory and evidence. Canadian Journal of Economics/Revue
Canadienne d’économique, 39(3), 901–931. https://doi.org/10.1111/j.1540-5982.2006.00375.x
Egger, P., & Merlo, V. (2011). Statutory Corporate Tax Rates and Double-Taxation Treaties as
Determinants of Multinational Firm Activity. FinanzArchiv: Public Finance Analysis, 67(2),
145–170.
Fitzgibbon, W. (2019, March 18). Treaty to ‘dodge Kenyan tax’ deemed unconstitutional. ICIJ.
https://www.icij.org/blog/2019/03/treaty-to-dodge-kenyan-tax-deemed-unconstitutional/
Fuest, C., Hebous, S., & Riedel, N. (2011). International debt shifting and multinational firms in
developing economies. Economics Letters, 113(2), 135–138.
Garcia-Bernardo, J., Fichtner, J., Takes, F. W., & Heemskerk, E. M. (2017). Uncovering Offshore
Financial Centers: Conduits and Sinks in the Global Corporate Ownership Network. Scientific
Reports, 7(1), 6246. https://doi.org/10.1038/s41598-017-06322-9
Gresik, T. A., Schindler, D., & Schjelderup, G. (2017). Immobilizing corporate income shifting: Should
it be safe to strip in the harbor? Journal of Public Economics, 152, 68–78.
Griffith, R., Hines Jr, J. R., & Sørensen, P. B. (2010). International Capital Taxation.
Haberly, D., & Wójcik, D. (2015a). Tax havens and the production of offshore FDI: An empirical
analysis. Journal of Economic Geography, 15(1), 75–101. https://doi.org/10.1093/jeg/lbu003
Haberly, D., & Wójcik, D. (2015b). Regional Blocks and Imperial Legacies: Mapping the Global
Offshore FDI Network. Economic Geography, 91(3), 251–280.
https://doi.org/10.1111/ecge.12078

39
Hallward-Driemeier, M. (2003). Do Bilateral Investment Treaties Attract FDI?: Only a Bit... And They
Could Bite (World Bank Policy Research Paper WPS 3121). World Bank, Development
Research Group, Investment Climate.
Hartman, D. G. (1985). Tax policy and foreign direct investment. Journal of Public Economics, 26(1),
107–121.
Head, K., & Mayer, T. (2014). Gravity equations: Workhorse, toolkit, and cookbook. In Handbook of
international economics (Vol. 4, pp. 131–195). Elsevier.
Head, K., & Ries, J. (2008). FDI as an Outcome of the Market for Corporate Control: Theory and
Evidence. Journal of International Economics, 74(1), 2–20.
Hearson, M. (2016). Measuring Tax Treaty Negotiation Outcomes: The ActionAid Tax Treaties Dataset.
ICTD Working Paper, 2016(47), 1–45.
Hearson, M. (2019, March 18). Unprecedented: Kenya-Mauritius tax treaty ratification struck down in
court. Martin Hearson. https://martinhearson.net/2019/03/18/kenya-mauritius/
Hong, S. (2018). Tax treaties and foreign direct investment: A network approach. International Tax and
Public Finance, 25(5), 1277–1320. https://doi.org/10.1007/s10797-018-9489-0
Huesecken, B., & Overesch, M. (2015). Tax Avoidance through Advance Tax Rulings—Evidence from
the LuxLeaks Firms (SSRN Scholarly Paper ID 2664631). Social Science Research Network.
http://papers.ssrn.com/abstract=2664631
IBFD. (2013). Onderzoek belastingverdragen met ontwikkelingslanden (pp. 1–75).
ICIJ. (2014). Luxembourg leaks: Global companies’ secrets exposed. International Consortium of
Investigative Journalists. http://www.icij.org/project/luxembourg-leaks
International Monetary Fund. (2014). Spillovers in international corporate taxation (IMF Policy Paper).
http://www.imf.org/external/np/pp/eng/2014/050914.pdf
Janský, P., & Palanský, M. (2019). Estimating the scale of profit shifting and tax revenue losses related
to foreign direct investment. International Tax and Public Finance, 26(5), 1048–1103.
https://doi.org/10.1007/s10797-019-09547-8

40
Janský, P., & Šedivý, M. (2019). Estimating the revenue costs of tax treaties in developing countries.
The World Economy, 42(6), 1828–1849. https://doi.org/10.1111/twec.12764
Johansson, A., Skeie, O. B., Sorbe, S., & Menon, C. (2017). Tax planning by multinational firms: Firm-
level evidence from a cross-country database. OECD Economics Department Working Papers,
2017(1355), 64. http://dx.doi.org/10.1787/9ea89b4d-en
Kosters, L., Kool, C. J. M., Groenewegen, J., Weyzig, F., & Bardadin, A. (2015). IBFD Spillover
Analysis: Possible Effects of the Irish Tax System for Developing Economies. IBDF.
Laplante, S. K., & Nesbitt, W. L. (2017). The relation among trapped cash, permanently reinvested
earnings, and foreign cash. Journal of Corporate Finance, 44, 126–148.
https://doi.org/10.1016/j.jcorpfin.2017.03.005
Ledyaeva, S., Karhunen, P., Kosonen, R., & Whalley, J. (2015). Offshore foreign direct investment,
capital round-tripping, and corruption: Empirical analysis of Russian regions. Economic
Geography, 91(3), 305–341.
Lejour, A. (2014). The foreign investment effects of tax treaties. Oxford University Centre for Business
Taxation, Working Paper Series, WP, 14(03), 2–21.
Mátyás, L. (1997). Proper econometric specification of the gravity model. World Economy, 20(3), 363–
368.
McGauran, K. (2013). Should the Netherlands Sign Tax Treaties with Developing Countries? Available
at SSRN. http://www.somo.nl/publications-en/Publication_3958/at_download/fullfile
Merlo, V., Riedel, N., & Wamser, G. (2020). The impact of thin-capitalization rules on the location of
multinational firms’ foreign affiliates. Review of International Economics, 28(1), 35–61.
https://doi.org/10.1111/roie.12440
Mintz, J. M., & Weichenrieder, A. J. (2010). The The Indirect Side of Direct Investment: Multinational
Company Finance and Taxation. MIT press.
Neumayer, E. (2007). Do Double Taxation Treaties Increase Foreign Direct Investment to Developing
Countries? Journal of Development Studies, 43(8), 1501–1519.

41
Paolini, D., Pistone, P., Pulina, G., & Zagler, M. (2016). Tax treaties with developing countries and the
allocation of taxing rights. European Journal of Law and Economics, 42(3), 383–404.
Petkova, K., Stasio, A., & Zagler, M. (2020). On the relevance of double tax treaties. International Tax
and Public Finance, 27(3), 575–605. https://doi.org/10.1007/s10797-019-09570-9
Poterba, J. (2004). Taxation and corporate payout policy. American Economic Review, 94(2), 171–175.
Poterba, J. M., & Summers, L. H. (1984). The economic effects of dividend taxation. National Bureau
of Economic Research Cambridge, Mass., USA.
PwC. (2018). Worldwide Tax Summaries. Corporate Taxes 2017/18.
https://www.pwc.com/taxsummaries
Redhead, A., & Mihalyi, D. (2018). A withhold up in Mongolia? Thoughts on the renewed tax debate
around Oyu Tolgoi – The International Centre for Tax and Development (ICTD). The
International Centre for Tax and Development (ICTD). http://www.ictd.ac/blog/a-withhold-up-
in-mongolia-thoughts-on-the-renewed-tax-debate-around-oyu-tolgoi/
Rixen, T., & Schwarz, P. (2009). Bargaining over the avoidance of double taxation: Evidence from
German tax treaties. FinanzArchiv: Public Finance Analysis, 65(4), 442–471.
Silva, J. S., & Tenreyro, S. (2006). The log of gravity. The Review of Economics and Statistics, 88(4),
641–658.
Sinn, H.-W. (1993). Taxation and the Birth of Foreign Subsidiaries. Trade, Welfare, and Economic
Policies. Essays in Honor of Murray C. Kemp. H. Herberg and L. van Ngo. Ann Arbor,
University of Michigan Press.
The Platform for Collaboration on Tax. (2017). Discussion draft: The Taxation of Offshore Indirect
Transfers—A Toolkit.
http://documents.worldbank.org/curated/en/689091501488467178/pdf/117797-REVISED-
Consultation-Draft-Indirect-Offshore-Transfers-July28-003.pdf
Tørsløv, T., Wier, L., & Zucman, G. (2018). The Missing Profits of Nations. National Bureau of
Economic Research, 24071. https://doi.org/10.3386/w24701

42
UNCTAD. (2015). World Investment Report 2015—Reforming International Investment Governance.
United Nations.
van de Poel, J. (2016). In search of a new balance. The impact of Belgian tax treaties on developing
countries. The Impact of Belgian Tax Treaties on Developing Countries. Brussels.
van ‘t Riet, M., & Lejour, A. (2018). Optimal tax routing: Network analysis of FDI diversion.
International Tax and Public Finance, 25(5), 1321–1371. https://doi.org/10.1007/s10797-018-
9491-6
Weyzig, F. (2012). Tax treaty shopping: Structural determinants of Foreign Direct Investment routed
through the Netherlands. International Tax and Public Finance, 1–28.
https://doi.org/10.1007/s10797-012-9250-z
Weyzig, F. (2013). Taxation and development: Effects of Dutch tax policy on taxation of multinationals
in developing countries.
Yagan, D. (2015). Capital tax reform and the real economy: The effects of the 2003 dividend tax cut.
American Economic Review, 105(12), 3531–63.

43
7 Appendix
Figure A1. Withholding tax rates on dividends (%) – occurrences according to data set versions
Source: Authors on the basis of the IBFD and other data sources.
Notes: The bins of this histogram are of 5% width, always centred on values presented on the x axis.
Figure A2. Withholding tax rates on interest (%) – occurrences according to data set versions
Source: Authors on the basis of the IBFD and other data sources.
Notes: The bins of this histogram are of 5% width, always centred on values presented on the x axis.

44
Figure A3. Number of changes in applicable withholding rates on dividends by source country
Source: Authors on the basis of the IBFD and other data sources.
Note: The left panel shows countries that experienced changes in domestic and possibly also tax treaty
rates. The right panel shows countries that experienced changes only in tax treaty rates.
Figure A4. Number of changes in applicable withholding rates on interest by source country
Source: Authors on the basis of the IBFD and other data sources.
Note: The left panel shows countries that experienced changes in domestic and possibly also tax treaty
rates. The right panel shows countries that experienced changes only in tax treaty rates.

45
Table A1: Summary statistics for the baseline regression sample
Variable Low income Lower middle
income
Upper middle
income High income
Obs. Mean Obs. Mean Obs. Mean Obs. Mean
Dividend outflow 427 1496 4,127 33,147 8,631 47,035 13,802 150,383
WHT rate on dividends (min.) 427 12.15 4,127 7.56 8,631 7.53 13,802 7.45
WHT rate on dividends (avg.) 427 12.20 4,127 7.58 8,631 7.67 13,802 7.59
WHT rate on dividends (max.) 427 12.24 4,127 7.60 8,631 7.73 13,802 7.66
Interest outflow 427 599 4,127 5,009 8,631 6,229 13,802 52,946
WHT rate on interest (min.) 427 13.07 4,127 11.78 8,631 9.12 13,802 6.82
WHT rate on interest (avg.) 427 13.52 4,127 12.22 8,631 10.86 13,802 7.31
WHT rate on interest (max.) 427 13.60 4,127 12.52 8,631 11.15 13,802 7.61
Withholding tax rate with other
countries (d) 427 10.13 4,127 6.24 8,631 5.15 13,802 2.08
Domestic dummy 427 0.24 4,127 0.42 8,631 0.48 13,802 0.61
Source: Authors.
Table A2: Results of the baseline regression using the OECD data
Dividends Interest
(1) (2) (3) (4) (5) (6) PPML
(avg. rates)
PPML
(min. rates)
PPML
(max. rates)
PPML
(avg. rates)
PPML
(min. rates)
PPML
(max. rates)
Withholding tax rate -0.0414 -0.0202 -0.0543*** -0.0568 -0.0519 -0.0498
(0.0338) (0.0440) (0.0207) (0.0560) (0.0639) (0.0467)
Withholding tax rate
with other countries (d)
-0.660 -0.747 -1.949*** 0.859 0.859 0.859
(0.810) (0.781) (0.547) (0.536) (0.537) (0.536)
DTT -0.191 0.0717 -0.563 -1.085 -1.022 -0.994
(0.619) (0.732) (0.499) (0.789) (0.894) (0.669)
Observations 2,355 2,355 2,355 2,365 2,365 2,365
Source-t FE YES YES YES YES YES YES
Recipient-t FE YES YES YES YES YES YES
Pairs FE YES YES YES YES YES YES
Source: Authors. Standard errors in parentheses, *** p<0.01, ** p<0.05, * p<0.1
Table A3: Dividend outflow elasticities – income groups
Income group Minimum rate Average rate Maximum rate
Low -0.1282
(0.12)
-0.1287
(0.12)
-0.1286
(0.11)
Lower middle -0.0199
(0.89)
-0.0226
(0.99)
-0.0254
(0.54)
Upper middle -0.0264
(0.68)
-0.0274
(0.71)
-0.0279
(0.42)
High -0.0212**
(0.03)
-0.0227**
(0.02)
-0.0176*
(0.07)
Source: Authors. Notes: *** p<0.01%, ** p<0.05%, * p<0.1%, p-values in parentheses.
Table A4: Dividend outflow elasticities – regions

46
Region Minimum rate Average rate Maximum rate
South Asia -0.0639
(0.55)
-0.0764
(0.47)
0.6419***
(0)
Europe & Central Asia -0.0301
(0.93)
-0.0298
(0.49)
-0.0284
(0.59)
Middle East & North Africa -0.0136
(0.56)
-0.0222
(0.63)
-0.0259
(0.93)
East Asia, Pacific -0.0310**
(0.04)
-0.0367**
(0.01)
-0.0231
(0.12)
Sub-Saharan Africa 0.0206
(0.14)
0.0205
(0.1)
0.0184
(0.24)
Latin America & Caribbean -0.0069**
(0.04)
-0.0083*
(0.08)
-0.0084
(0.2)
North America -0.0033**
(0.02)
-0.0081**
(0.01)
-0.0096
(0.24)
Source: Authors. Notes: *** p<0.01%, ** p<0.05%, * p<0.1%, p-values in parentheses.
Table A5: Interest outflow elasticities – income groups
Income group Minimal rate Average rate Maximal rate
Low 0.2635***
(0)
0.25513***
(0)
0.27406***
(0)
Lower middle -0.0215***
(0)
-0.02097**
(0.04)
-0.02674
(0.25)
Upper middle -0.0198***
(0)
-0.01977*
(0.05)
-0.02144
(0.43)
High 0.0115
(0.21)
0.00513
(0.58)
-0.00994
(0.28)
Source: Authors. Notes: *** p<0.01%, ** p<0.05%, * p<0.1%, p-values in parentheses.
Table A6: Interest outflow elasticities – regions
Region Minimum rate Average rate Maximum rate
South Asia -0.0400
(0.21)
-0.0318
(0.5)
-0.0549
(0.99)
Europe & Central Asia -0.0017*
(0.06)
-0.0002
(0.87)
-0.0053***
(0)
Middle East & North Africa 0.0411
(0.7)
0.0484
(0.34)
0.0230
(0.1)
East Asia, Pacific 0.0225*
(0.08)
0.0019
(0.88)
-0.0554***
(0)
Sub-Saharan Africa 0.0172
(0.83)
0.0179
(0.51)
0.0179***
(0)
Latin America & Caribbean 0.0091
(0.43)
0.0036
(0.94)
-0.0174**
(0.03)
North America -0.0035*
(0.08)
-0.0004
(0.88)
-0.0148**
(0.01)
Source: Authors. Notes: *** p<0.01%, ** p<0.05%, * p<0.1%, p-values in parentheses.

47
Table A7. Potential revenue foregone (thousands USD), dividends
Source country 1st recipient Lower Bound Upper Bound 2nd recipient Lower Bound Upper Bound 3rd recipient Lower Bound Upper Bound
Albania Greece 849.9 1,169.8 Netherlands 722.2 895.5 Switzerland 424.7 584.6
Armenia Russia 474.7 987.4 Cyprus 226.5 471.1 United Kingdom 75.0 311.9
Australia United States 252,847.9 379,271.8
Austria Germany 139,214.5 176,114.7 Netherlands 83,779.2 105,985.8 Luxembourg 56,399.8 71,349.2
Azerbaijan Netherlands 3,629.1 3,766.0 Switzerland 2,156.1 2,237.5 Germany 1,736.4 1,801.9
Bangladesh United Kingdom 7,789.1 8,690.3 South Korea 4,788.2 5,342.2 Netherlands 4,530.0 5,054.2
Bolivia Sweden 5,572.9 5,860.8 Spain 1,643.0 1,727.9
Bosnia and Herzegovina Ireland 4.8 4.9
Botswana United Kingdom 1,804.8 1,851.8 Mauritius 910.4 934.1 France 2.4 2.5
Bulgaria Netherlands 5,820.5 5,914.1 Austria 3,672.2 3,731.3 Greece 2,327.5 2,365.0
Canada United States 671,574.5 1,580,175.3 Netherlands 160,467.3 377,570.1 Luxembourg 101,265.2 238,271.1
Costa Rica Spain 2,292.5 2,977.2 Germany 458.4 595.4
Czechia Netherlands 212,201.3 254,043.8 Germany 134,599.6 161,140.4 Luxembourg 120,093.4 143,773.8
El Salvador Spain 2,022.9 2,256.9
France Luxembourg 241,316.4 331,009.2 Netherlands 156,702.7 214,946.1 United Kingdom 138,065.5 189,381.8
Germany Netherlands 334,507.2 400,466.3 Luxembourg 328,884.8 393,735.3
Ghana France 4,059.1 4,173.7 South Africa 1,117.3 1,148.8 Switzerland 571.3 587.4
Greece Luxembourg 13,996.6 14,524.8 Germany 13,253.4 13,753.5 Netherlands 10,677.4 11,080.3
Iceland Luxembourg 404.6 442.7 Netherlands 124.2 135.9 Switzerland 32.0 35.0
Italy Luxembourg 53,714.0 65,592.4 Netherlands 53,649.2 65,513.3 France 49,461.1 60,399.0
Japan United States 361,227.3 451,311.2 France 193,595.7 241,875.2 Netherlands 153,787.9 192,140.0
South Korea Japan 160,514.0 183,380.9 United States 82,761.7 94,552.0 United Kingdom 51,970.4 59,374.1
Kyrgyzstan Germany 119.4 123.9 Switzerland 78.7 81.7 Latvia 44.7 46.4
Lebanon United Arab Emirates 771.0 783.4 France 672.5 683.3 Kuwait 355.1 360.8
Lithuania Sweden 13,417.8 14,337.2 Netherlands 6,871.2 7,342.0 Germany 5,267.4 5,628.3
North Macedonia Austria 501.4 2,041.0
Mexico United States 86,322.6 89,580.1 Netherlands 38,517.0 75,333.2 Spain 22,708.4 23,565.3
Mongolia China 3,805.9 4,246.2 Canada 3,345.7 3,732.9 Singapore 1,437.4 1,603.7
Montenegro Russia 178.2 184.1 Netherlands 50.0 51.7 Slovenia 48.7 50.3
New Zealand Australia 0.0 209,543.6
Nigeria China 4,542.3 4,713.7 South Africa 2,113.8 2,193.6

48
Source country 1st recipient Lower Bound Upper Bound 2nd recipient Lower Bound Upper Bound 3rd recipient Lower Bound Upper Bound
Norway Sweden 71,342.7 85,410.2 Netherlands 50,285.6 60,201.1 Luxembourg 29,407.4 35,206.1
Pakistan Japan 2,355.8 4,607.6
Panama Spain 1,760.6 5,200.4 Netherlands 1,628.8 1,671.2 Mexico 794.2 814.9
Paraguay Chile 25.6 27.4
Philippines Japan 18,979.6 20,280.0
Poland Netherlands 173,986.3 192,142.6 Germany 149,132.5 164,695.2 Luxembourg 119,605.1 132,086.5
Portugal Netherlands 84,791.3 101,510.8 Spain 76,266.1 91,304.4 Luxembourg 61,585.2 73,728.7
Romania Netherlands 42,776.6 42,776.6 Germany 23,209.3 23,209.3 Austria 20,901.6 20,901.6
Russia Cyprus 535,670.3 572,372.1 Netherlands 158,857.8 169,742.0
Serbia Netherlands 10,452.6 11,662.0 Austria 6,116.2 6,823.8 Slovenia 3,054.3 3,407.7
Seychelles Mauritius 658.8 704.0 Cyprus 387.8 414.4 United Arab Emirates 37.6 40.2
Slovenia Austria 37,152.7 37,152.7 Switzerland 12,640.3 12,640.3 Germany 11,572.8 11,572.8
South Africa United Kingdom 139,553.1 149,114.6 Netherlands 77,765.6 83,093.8 United States 24,874.4 26,578.7
Spain Netherlands 188,469.1 208,136.8 Luxembourg 118,061.9 130,382.2 United Kingdom 110,890.7 122,462.7
Switzerland Netherlands 301,303.7 605,713.6 Luxembourg 181,043.7 363,953.8 United States 99,373.2 199,770.8
Tajikistan China 77.8 81.5 Russia 29.8 31.3 United Kingdom 19.8 20.7
Thailand Taiwan 5,448.3 5,653.9
Turkey Germany 11,852.8 12,664.9 Spain 9,000.2 9,616.8 Russia 6,455.4 6,897.7
United States United Kingdom 374,865.3 468,657.1 Japan 284,075.2 355,151.2
Venezuela United States 7,431.5 13,192.7 Netherlands 6,384.8 11,334.7 Spain 4,047.0 7,184.4
Zambia United Kingdom 1,277.0 1,364.5 China 910.8 973.2 Ireland 448.1 478.8
Source: Authors. Notes: The table shows estimated potential revenue foregone. For each source countries it shows 3 recipient countries related to the most
revenue foregone for dividends. EU-28 member countries in bold.

49
Table A8. Potential revenue foregone (thousands USD), interest
Source country 1st recipient Lower Bound Upper Bound 2nd recipient Lower Bound Upper Bound 3rd recipient Lower Bound Upper Bound
Albania Greece 127.8 253.1
Belarus Cyprus 477.0 571.3 Austria 105.8 126.7
Belgium Netherlands 125,929.7 249,365.7 France 118,386.1 234,427.9 Luxembourg 103,735.0 205,415.8
Bosnia and Herzegovina Austria 0.0 133.9
Brazil Netherlands 20,114.2 118,318.5 Spain 7,880.2 46,354.1 Luxembourg 5,895.6 34,680.2
Bulgaria Netherlands 3,493.7 5,214.4 Austria 2,204.2 3,289.8 Greece 1,397.1 2,085.2
Burkina Faso France 0.0 354.4
Canada United States 46,459.1 265,480.8 Netherlands 11,101.0 105,724.2 Luxembourg 7,005.5 66,718.8
Croatia Austria 2,363.1 4,679.4 Netherlands 2,191.2 4,339.0 Italy 1,231.7 2,439.0
Czechia Netherlands 6,693.9 38,250.9 Germany 4,246.0 24,262.6 Luxembourg 3,788.4 21,647.7
Georgia United Kingdom 754.3 903.4 Netherlands 689.8 826.1 United Arab Emirates 308.4 369.4
India United States 325.4 1,914.1
Indonesia Singapore 9,366.7 27,549.1 Netherlands 4,906.1 14,429.7 United Kingdom 3,424.0 10,070.7
Ireland United States 74,858.3 220,171.4 Netherlands 35,133.7 103,334.5 Luxembourg 22,188.3 65,259.7
Israel United States 2,689.1 5,378.2 Netherlands 2,562.9 3,844.4 Singapore 1,497.2 1,497.2
Italy Luxembourg 26,711.6 188,110.1 Netherlands 26,679.4 187,883.2 France 24,596.7 173,216.2
Japan United States 3,949.5 23,232.5 France 2,116.7 12,451.2 Netherlands 1,681.5 9,890.9
South Korea Japan 4,716.0 17,211.6 United States 2,870.6 10,476.7
Kosovo Germany 43.4 64.8 Netherlands 21.8 32.5 Slovenia 16.1 24.0
Kyrgyzstan Germany 1.2 1.8 Switzerland 0.8 1.2
Lebanon United Arab Emirates 1.5 1.8 France 1.3 1.6 Kuwait 0.7 0.8
Lithuania Sweden 1,727.3 2,578.1 Netherlands 884.6 1,320.2 Germany 678.1 1,012.1
North Macedonia Austria 288.7 430.8
Mexico United States 1,247.9 12,998.2 Netherlands 828.2 5,559.9 Spain 328.3 3,401.6
Moldova Russia 102.2 122.9 Netherlands 31.2 54.9
Mongolia China 3,092.6 9,095.9 Canada 2,718.7 7,996.2 Singapore 1,168.0 5,153.1
Mozambique United Arab Emirates 2.8 8.2 South Africa 0.9 4.2
Nigeria China 41.8 62.4 South Africa 19.4 29.0
Pakistan Ireland 0.4 0.5
Paraguay Chile 0.0 0.3
Poland Netherlands 35,484.3 104,365.5 Germany 30,415.4 89,457.0 Luxembourg 24,393.3 71,745.1

50
Source country 1st recipient Lower Bound Upper Bound 2nd recipient Lower Bound Upper Bound 3rd recipient Lower Bound Upper Bound
Portugal Netherlands 13,612.5 77,785.8 Spain 12,243.9 69,964.9 Luxembourg 9,887.0 56,497.0
Romania Netherlands 17,734.2 27,653.3 Germany 9,622.0 15,003.8 Austria 8,665.3 13,512.0
Russia Cyprus 158,931.6 467,446.0 Netherlands 47,132.6 138,625.2 Germany 19,138.9 56,291.0
Serbia Netherlands 1,331.1 3,915.1 Germany 414.9 1,220.4 Austria 389.4 1,145.4
Seychelles Mauritius 14.0 27.7 Cyprus 8.2 16.3 United Arab Emirates 0.8 1.6
Slovakia Netherlands 3,123.7 5,878.7 Austria 2,018.5 3,798.7 Czechia 1,471.7 2,769.6
Slovenia Austria 2,171.2 4,299.4 Switzerland 738.7 1,462.8 Germany 676.3 1,339.2
South Africa United Kingdom 3,791.5 7,507.9 Netherlands 2,112.8 4,183.8 United States 675.8 1,338.2
Spain Netherlands 91,589.1 245,547.2 Luxembourg 57,373.8 153,817.1 United Kingdom 53,888.8 144,474.0
Tajikistan China 396.1 655.8
Uganda Mauritius 18.7 37.1 Netherlands 6.5 12.8 India 3.0 6.0
United Kingdom United States 311,430.1 613,700.5 Netherlands 111,638.0 219,992.5 Luxembourg 68,805.6 135,587.6
United States United Kingdom 21,077.3 1,064,405.7 Luxembourg 15,831.6 799,493.3
Source: Authors. Notes: The table shows estimated potential revenue foregone. For each source countries it shows 3 recipient countries related to the most
revenue foregone for interest. EU-28 member countries in bold.

51
Table A9. Potential revenue foregone, static estimates, source countries – dividends
Lower,bound,estimate Upper,bound,estimate
Source country Year Lower,bound %,EU % GDP Upper bound % EU % GDP
United States 2016 9,481,023 72.4 0.05 10,616,033 72.9 0.06
Switzerland 2016 7,879,684 86.3 1.18 7,886,915 86.3 1.18
France 2016 4,954,239 87.3 0.20 5,051,331 85.7 0.20
Germany 2016 4,580,486 88.3 0.13 4,703,413 86.0 0.14
Canada 2015 3,184,193 37.5 0.20 3,185,624 37.5 0.20
Japan 2016 2,284,113 49.5 0.05 2,776,233 50.1 0.06
Czechia 2016 2,571,778 94.9 1.32 2,571,996 94.9 1.32
Russia 2016 1,726,595 91.3 0.13 1,812,974 91.7 0.14
Poland 2016 1,744,64 96.3 0.37 1,744,637 96.3 0.37
Austria 2016 1,663,894 80.4 0.43 1,663,894 80.4 0.43
Spain 2016 1,550,089 89.5 0.13 1,561,648 88.8 0.13
South Korea 2016 1,240,861 37.3 0.09 1,241,018 37.3 0.09
Portugal 2016 878,706 95.7 0.43 878,706 95.7 0.43
Italy 2016 805,221 96.5 0.04 805,221 96.5 0.04
Australia 2016 435,281 24.8 0.04 797,525 20.3 0.07
Norway 2016 787,491 93.9 0.21 787,650 93.9 0.21
South Africa 2016 563,923 75.8 0.19 564,126 75.7 0.19
New Zealand 2015 337,269 0.0 0.19 477,126 0.0 0.27
Chile 2016 349,966 50.8 0.14 367,357 48.4 0.15
Kazakhstan 2016 257,198 67.2 0.19 323,898 74.0 0.24
Mexico 2015 241,673 40.5 0.02 295,283 51.2 0.03
Venezuela 2016 272,159 59.8 - 272,238 59.8 -
Romania 2016 165,473 100.0 0.09 165,493 100.0 0.09
Israel 2016 116,963 48.1 0.04 128,744 52.8 0.04
Slovenia 2014 105,742 99.0 0.21 105,744 99.0 0.21
Turkey 2016 94,502 61.7 0.01 99,337 63.6 0.01
Serbia 2016 88,466 89.8 0.23 88,466 89.8 0.23
Lithuania 2014 87,366 92.0 0.18 87,366 92.0 0.18
Philippines 2016 48,142 26.8 0.02 79,875 55.9 0.03
Bangladesh 2014 79,202 38.8 0.05 79,202 38.8 0.05
Greece 2014 78,141 97.5 0.03 78,141 97.5 0.03
Bulgaria 2016 32,287 100.0 0.06 33,321 96.9 0.06
Croatia 2016 30,575 98.6 0.06 30,575 98.6 0.06
Mongolia 2016 20,157 7.3 0.18 20,157 7.27 0.18
Belarus 2015 7,578 93.1 0.01 13,236 94.6 0.02
Azerbaijan 2016 12,315 89.7 0.03 13,007 90.2 0.03
North Macedonia 2016 10,931 91.0 0.10 12,172 91.9 0.11
Bolivia 2016 10,651 100.0 0.03 11,880 100.0 0.04
Georgia 2016 2,225 33.2 0.02 11,499 80.2 0.08
Panama 2013 6,850 67.6 0.02 11,106 80.0 0.02
Nigeria 2016 8,970 0.0 0.00 8,970 0.0 0.00
Ghana 2015 8,493 83.4 0.02 8,493 83.4 0.02
Pakistan 2015 3,378 0.3 0.00 7,644 0.2 0.00
Thailand 2016 7,343 0.0 0.00 7,343 0.0 0.00
Albania 2016 6,700 84.9 0.06 7,340 86.2 0.06
Sri Lanka 2016 3,206 0.4 0.00 6,320 0.2 0.01
Zambia 2015 5,133 60.0 0.02 5,133 60.0 0.02
El Salvador 2013 4,179 100.0 0.02 4,179 100.0 0.02
Mozambique 2014 3,886 8.7 0.02 3,967 8.6 0.02
Costa Rica 2016 3,573 100.0 0.01 3,573 100.0 0.01
Botswana 2015 3,370 66.5 0.02 3,370 66.5 0.02
Armenia 2016 2,838 45.2 0.03 3,161 50.8 0.03

52
Lower,bound,estimate Upper,bound,estimate
Source country Year Lower,bound %,EU % GDP Upper bound % EU % GDP
Lebanon 2011 2,065 37.4 0.01 2,065 37.4 0.01
Seychelles 2016 1,820 34.9 0.13 1,820 34.9 0.13
Iceland 2016 1,225 97.6 0.01 1,225 97.6 0.01
Uganda 2011 868 35.6 0.00 1,013 44.9 0.01
Montenegro 2015 559 51.9 0.01 569 51.0 0.01
Kyrgyzstan 2011 351 93.4 0.01 351 93.4 0.01
Tajikistan 2016 228 27.0 0.00 228 27.0 0.00
Paraguay 2011 42 - 0.00 42 - 0.00
Bosnia and Herzegovina 2015 6 100.0 0.00 6 100.0 0.00
Source: Authors. Notes: Thousands USD, sorted decreasingly by the upper bound, EU-28 member
countries in bold.
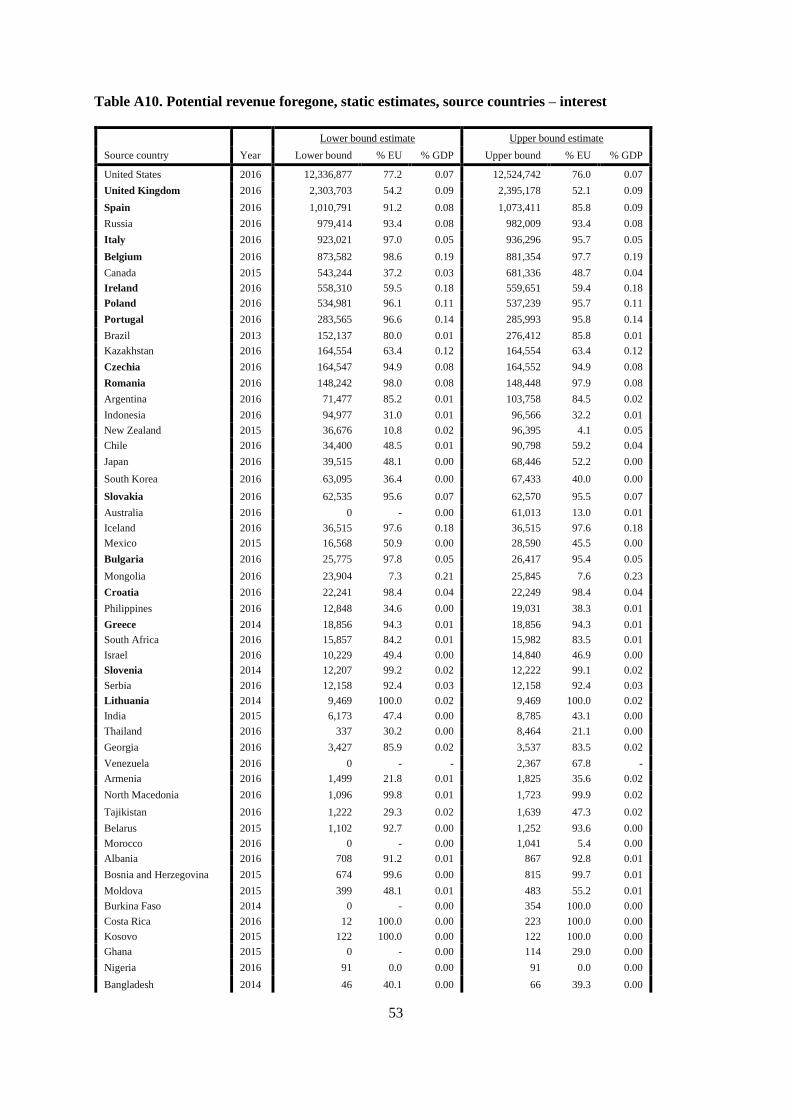
53
Table A10. Potential revenue foregone, static estimates, source countries – interest
Lower bound estimate Upper bound estimate
Source country Year Lower bound % EU % GDP Upper bound % EU % GDP
United States 2016 12,336,877 77.2 0.07 12,524,742 76.0 0.07
United Kingdom 2016 2,303,703 54.2 0.09 2,395,178 52.1 0.09
Spain 2016 1,010,791 91.2 0.08 1,073,411 85.8 0.09
Russia 2016 979,414 93.4 0.08 982,009 93.4 0.08
Italy 2016 923,021 97.0 0.05 936,296 95.7 0.05
Belgium 2016 873,582 98.6 0.19 881,354 97.7 0.19
Canada 2015 543,244 37.2 0.03 681,336 48.7 0.04
Ireland 2016 558,310 59.5 0.18 559,651 59.4 0.18
Poland 2016 534,981 96.1 0.11 537,239 95.7 0.11
Portugal 2016 283,565 96.6 0.14 285,993 95.8 0.14
Brazil 2013 152,137 80.0 0.01 276,412 85.8 0.01
Kazakhstan 2016 164,554 63.4 0.12 164,554 63.4 0.12
Czechia 2016 164,547 94.9 0.08 164,552 94.9 0.08
Romania 2016 148,242 98.0 0.08 148,448 97.9 0.08
Argentina 2016 71,477 85.2 0.01 103,758 84.5 0.02
Indonesia 2016 94,977 31.0 0.01 96,566 32.2 0.01
New Zealand 2015 36,676 10.8 0.02 96,395 4.1 0.05
Chile 2016 34,400 48.5 0.01 90,798 59.2 0.04
Japan 2016 39,515 48.1 0.00 68,446 52.2 0.00
South Korea 2016 63,095 36.4 0.00 67,433 40.0 0.00
Slovakia 2016 62,535 95.6 0.07 62,570 95.5 0.07
Australia 2016 0 - 0.00 61,013 13.0 0.01
Iceland 2016 36,515 97.6 0.18 36,515 97.6 0.18
Mexico 2015 16,568 50.9 0.00 28,590 45.5 0.00
Bulgaria 2016 25,775 97.8 0.05 26,417 95.4 0.05
Mongolia 2016 23,904 7.3 0.21 25,845 7.6 0.23
Croatia 2016 22,241 98.4 0.04 22,249 98.4 0.04
Philippines 2016 12,848 34.6 0.00 19,031 38.3 0.01
Greece 2014 18,856 94.3 0.01 18,856 94.3 0.01
South Africa 2016 15,857 84.2 0.01 15,982 83.5 0.01
Israel 2016 10,229 49.4 0.00 14,840 46.9 0.00
Slovenia 2014 12,207 99.2 0.02 12,222 99.1 0.02
Serbia 2016 12,158 92.4 0.03 12,158 92.4 0.03
Lithuania 2014 9,469 100.0 0.02 9,469 100.0 0.02
India 2015 6,173 47.4 0.00 8,785 43.1 0.00
Thailand 2016 337 30.2 0.00 8,464 21.1 0.00
Georgia 2016 3,427 85.9 0.02 3,537 83.5 0.02
Venezuela 2016 0 - - 2,367 67.8 -
Armenia 2016 1,499 21.8 0.01 1,825 35.6 0.02
North Macedonia 2016 1,096 99.8 0.01 1,723 99.9 0.02
Tajikistan 2016 1,222 29.3 0.02 1,639 47.3 0.02
Belarus 2015 1,102 92.7 0.00 1,252 93.6 0.00
Morocco 2016 0 - 0.00 1,041 5.4 0.00
Albania 2016 708 91.2 0.01 867 92.8 0.01
Bosnia and Herzegovina 2015 674 99.6 0.00 815 99.7 0.01
Moldova 2015 399 48.1 0.01 483 55.2 0.01
Burkina Faso 2014 0 - 0.00 354 100.0 0.00
Costa Rica 2016 12 100.0 0.00 223 100.0 0.00
Kosovo 2015 122 100.0 0.00 122 100.0 0.00
Ghana 2015 0 - 0.00 114 29.0 0.00
Nigeria 2016 91 0.0 0.00 91 0.0 0.00
Bangladesh 2014 46 40.1 0.00 66 39.3 0.00

54
Lower bound estimate Upper bound estimate
Source country Year Lower bound % EU % GDP Upper bound % EU % GDP
Uganda 2011 64 22.7 0.00 64 22.7 0.00
Seychelles 2016 47 35.0 0.00 47 35.0 0.00
Mozambique 2014 15 15.9 0.00 19 25.0 0.00
Lebanon 2011 4 37.4 0.00 4 37.4 0.00
Kyrgyzstan 2011 3 99.7 0.00 4 99.8 0.00
Pakistan 2015 1 100.0 0.00 1 100.0 0.00
Paraguay 2011 0 - 0.00 0 - 0.00
Source: Authors. Notes: Thousands USD, sorted decreasingly by the upper bound, EU-28 member
countries in bold.