Embed Size (px)
Citation preview

Tax Structure Work Group (TSWG) Meeting
December 4, 2020 from 8:00 AM to 12:00 PM

Meeting Set-Up
• For participants - Change your “participant name” to your name and affiliation.
• For legislators – Change your “participant name” to “Senator – Name” or “Rep –Name”.

Welcome & Introductions
• Welcome from Tax Structure Work Group Co-Chairs• Welcome to Tax Structure Work Group Members• Welcome to legislators• Welcome to participants

Technical Ground Rules• Remain on mute unless speaking
• Send a chat directly to Kizz Prusia with any technical difficulties.
• Submit questions for presenters via chat*
• Want to provide public comment? [email protected] with your name and organization by 11 a.m.
*All information entered into the chat box is part of the public record and will be shared as part of the public meeting summary.

Agenda• Introductory and meeting overview• Review of Budget Proviso Key Research Questions & Technical
Advisory Group (TAG) Work• Washington State Economic Competitiveness • Technical Modeling Pt 1: Value Added, Margins, Corporate Income
Net Receipts, and Business Burden• Technical Modeling Pt 2: Personal Income and Household Burden• Technical Modeling Pt 3: WA/OR/ID Tax and Alternative Property Tax• Review of TSWG Report

Tax Structure Work Group: Overview of Economic
Analysis

TSWG Economic Modeling Context
•Reauthorize TSWG•Economic Modeling
•Direct Stakeholder Engagement
2018 TSWG Report
•Technical Advisory Group
•Public Meetings•Presentations•Future Outreach•Direct research for DOR
ESHB 1109
•2002 Gates Study: Update and revenue estimates
•2018 TSWG: Economic modeling and revenue estimates
Dept of Revenue Research
•Create several alternative tax system scenarios•Present to the public for feedback.
2020-21 TSWG
• The 2018 TSWG spelled out a series of requests for economic modeling.• These were codified in ESHB 1109 (also authorizing the continuing work of
TSWG in 2020-2021).• Future work of the TSWG will create alternative tax scenarios.
6

2002 GatesPersonal Income Tax• Flat Rate• Graduated
Rate
Replace B&O with Value-added Tax
2018 TSWGReplace B&O tax with Corporate Income/NR Tax or Margins Tax
Property Tax Rate
Alternative
OR/ID Tax Structure
Household and
Business Tax Burdens
Economic Competitiveness
TSWG Work Programs• The 2002 Gates Study focused on a personal income tax and
refinements to the B&O tax.• The 2018 TSWG asked that elements of the 2002 Gates Study be
updated, estimate alternatives to the B&O, and conduct additional analysis.
7

Technical Work and Advisory Group

Department of Revenue• Emphasized technical modeling
• Determining the Washington tax base for each new tax • Economic analysis of the first incidence of the tax
• Recruited modeling resources• Secure resources outside the department to build capacity• Convene and consult Technical Advisory Group
• Conducted research on other proviso elements• Alternative property tax• OR/ID tax structure
• Contracted (e.g., interagency agreement) with Western Washington University for work on economic competitiveness
9

Technical Advisory Group
The Department created a technical advisory group to provide advice and assistance with analyzing and modeling taxes: • Personal Income Taxes• Corporate Income/Net
Receipt Taxes• Value-Added Taxes• Household Burdens
Katie Baird University of Washington Tacoma
Douglas Conrad, PhD Professor Emeritus at the University of WashingtonLucy Dadayan, PhD Urban Institute
Robert Hamilton Washington State Department of CommerceRachelle Harris House Finance Committee
Hart Hodges, PhDCenter for Economic and Business Research, Western Washington University
D. Patrick Jones, PhD Eastern Washington University
Sharon Kioko, PhDEvans School of Public Policy and Governance, University of Washington
Mike Nelson Washington Society of Certified Public Accountants
Steve Lerch, PhD Economic and Revenue Forecast CouncilJeff Mitchell Senate Ways and Means Committee
Andy Nicholas Washington State Budget & Policy Center
Pete Parcells, PhD Economics Professor at Whitman CollegeRick Peterson Retired, former House Finance and DOR ResearchKriss Sjoblom, PhD Washington Research CouncilNick Tucker House Finance Committee
10

Modeling Approach
Current Washington Taxes
• Business and Occupation Taxes
• Retail Sales tax
• Property Tax
• Real Estate Excise Tax
• Public Utility Taxes
Potential Options for Change
• Corporate Income / Net Receipts
• Value Added Tax
• Margins Tax
• Personal Income Tax
Comparisons
• Business Tax Burden
• Household Tax Burden
Locate Revenue Targets
Identify Washington
Tax Base
Apply Appropriate Tax Policies
Determine Rates that
Meet Targets
11

Economic Competitiveness and
TaxesNovember 27, 2020
Hart Hodges & Brady Anderson (with special thanks to Doug Conrad)
Primary Task
To analyze our economic competitiveness in the context of a national and global economy, provide comparisons of the effective state and local tax rate of the tax structure during the 2017-2019 fiscal biennium and various alternatives under consideration, as they compare to other states and the federal government, as well as consider implications of recent changes to federal tax law
Competitiveness
The World Economic Forum offers the following definition:
“The set of institutions, policies and factors that determine the level of productivity of a country.”

CompetitivenessThe World Economic Forum offers the following definition:
“The set of institutions, policies and factors that determine the level of productivity of a country.”
State
Taxes are only one component – not the whole story

Competitiveness – how to measure it?
• Real GDP (state level) and GDP per capita• Median household income• Labor productivity• Net business openings• Beacon Hill Competitiveness Index

GDP per capita

Median Household Income
WESTERN WASHINGTON UNIVERSITY

Median Household Income

Labor Productivity

Labor Productivity
… a reminder from Census

Labor Productivity, cont.

Beacon Hill Index

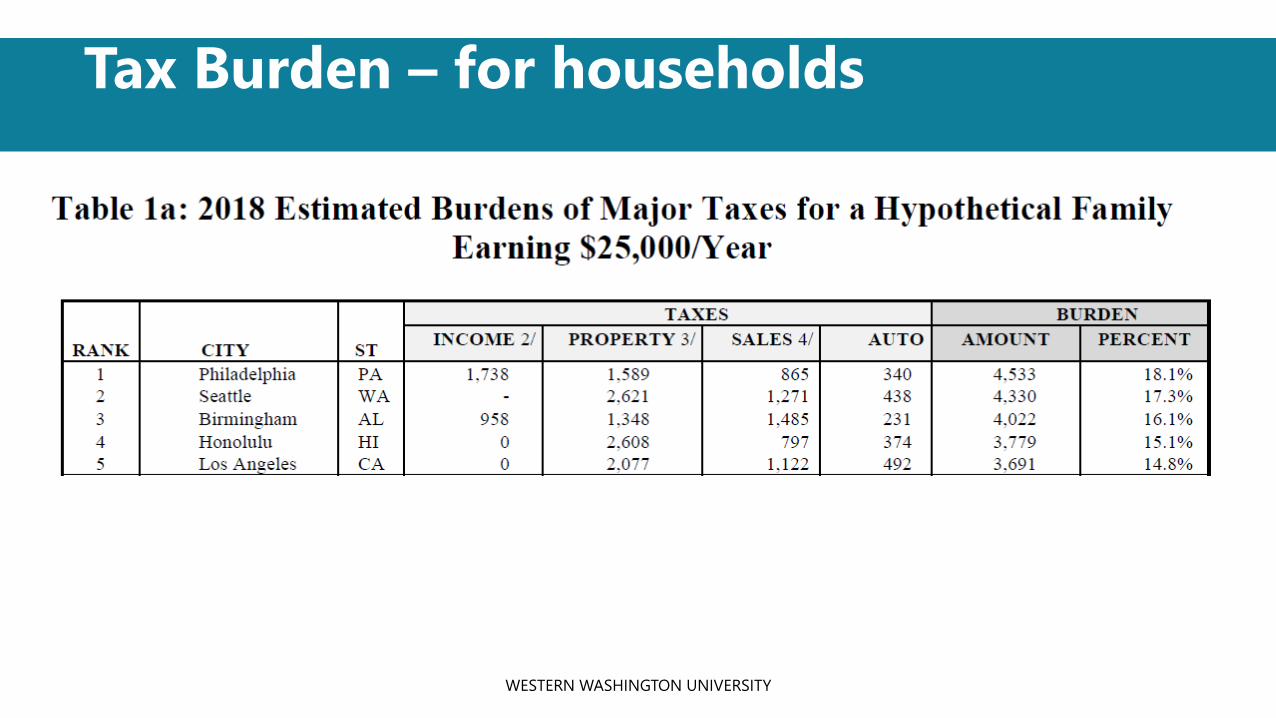
Tax Burden• Different measures of tax burden on households and/or individuals• Focused on tax burden on households – by income level• Data for residents of largest city in each state• Annual study conducted by District of Columbia
• Share of tax revenue from tax type (Data from U.S. Census)• Sales• Income• Other

Tax Burden – by Wallet Hub (2020)

Tax Burden – Corporate Tax Rates

Tax Burden – Source of Revenues
Tax Burden – for households
WESTERN WASHINGTON UNIVERSITY
Factors considered along with tax burden
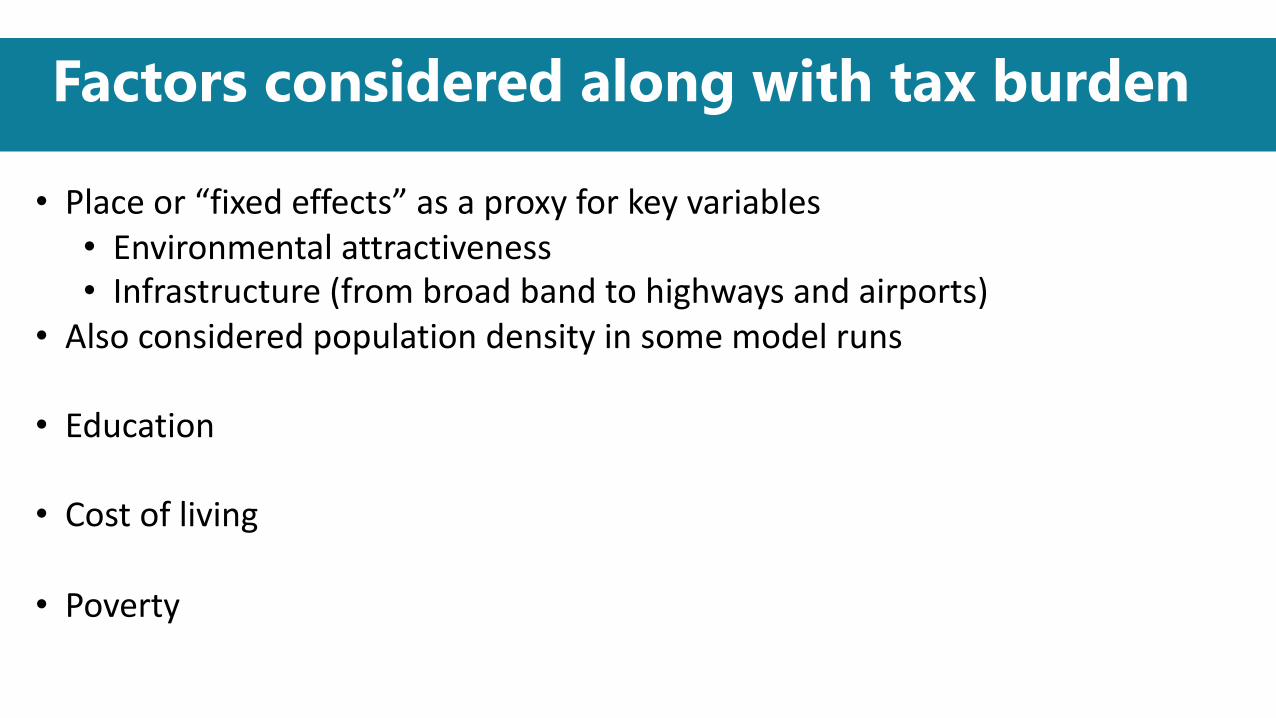
• Place or “fixed effects” as a proxy for key variables• Environmental attractiveness• Infrastructure (from broad band to highways and airports)
• Also considered population density in some model runs
• Education
• Cost of living
• Poverty

The average annual salary in ‘Publishing Industries, Except Internet’ was $258,000 in 2019 in Seattle; compared to $133,500 nationally
Place Matters

Differences Within the State

Differences Within the State

Cost of Living
Different image with C2ER data

Cost of Living – Take 2Area Index Value
Bellingham 121
Tri-Cities 103
Moses Lake 95
Skagit County 119
Olympia – Tumwater 109
Seattle – Bellevue – Everett 158
Spokane 108
Wenatchee 106
US Overall 100

Poverty Rate

Findings:• The relationship between competitiveness and the tax burden on
households depends on the measure of competitiveness and differs across income levels• Some models suggest you could improve competitiveness by reducing the tax
burden on certain households and raising it on others
• The share of revenue from sales and income tax is seldom significant in the models (and only appears to matter when competitiveness is measured with employment)
• College enrollment per capita and other non-tax factors appear to have a stronger relationship with competitiveness than tax burden
• Time and place matter!

Variations:We found little change when we• Ran the model with and without household tax burden, by income level
(focusing only on share of tax revenue by source)
• Considered change in income and employment rather than having those variables in ‘levels’
• Included a measure of environmental attractiveness
The relationship between tax burden and competitiveness changes depending on how you measure competitiveness, but not with the changes listed above.

Thoughts:
• The relationship between tax burden and competitiveness appears to depend on income level – with different relationships for households in different income brackets• Most studies use one variable for tax burden, which misses that point
• Results are very sensitive to model specification • Can generate most of the findings in the literature
• Results invite questions about strategy and equity
• How to include a measure of tax adequacy (is it possible) or how tax revenues are used (which appears to matter)?

Value Added Tax and Margins Tax
Revenue Target Proposals
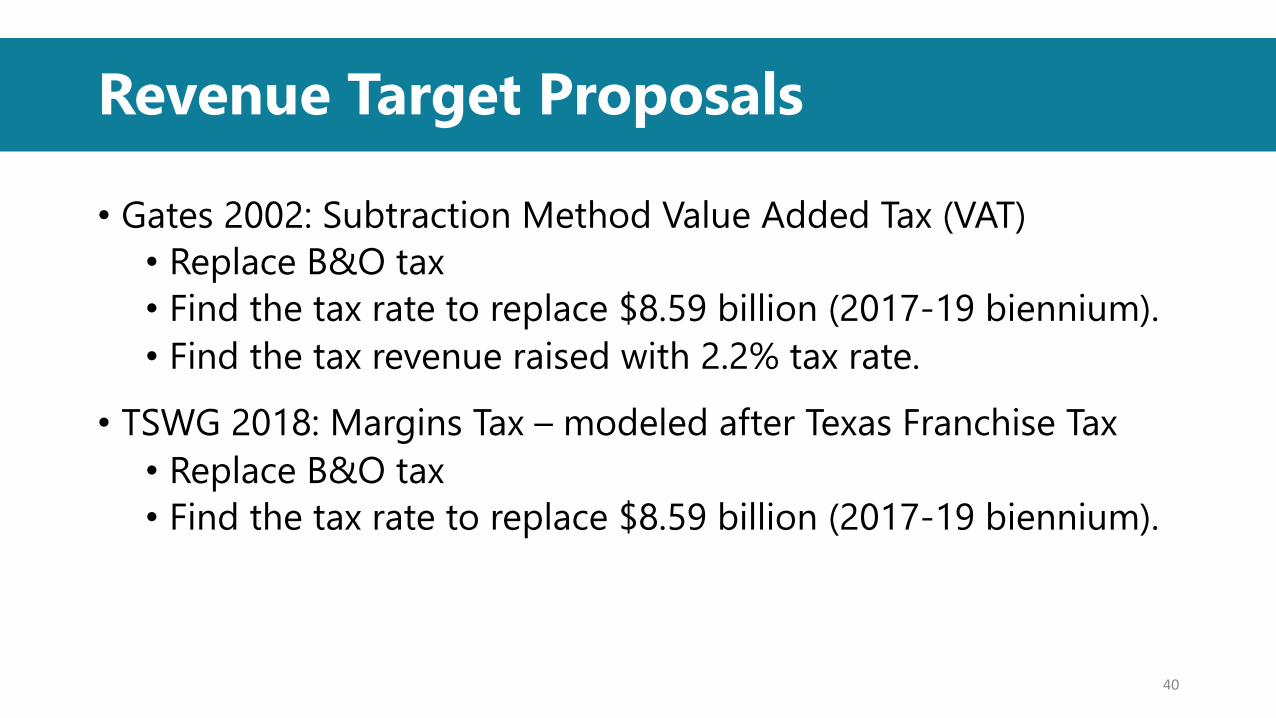
• Gates 2002: Subtraction Method Value Added Tax (VAT)• Replace B&O tax• Find the tax rate to replace $8.59 billion (2017-19 biennium).• Find the tax revenue raised with 2.2% tax rate.
• TSWG 2018: Margins Tax – modeled after Texas Franchise Tax• Replace B&O tax• Find the tax rate to replace $8.59 billion (2017-19 biennium).
40

Key Data Sources
• IRS microdata for federal business tax returns of companies identified as having Washington nexus• Specifically, data from Form 1120 (C-Corps), Form 1120S (S-
Corps), and Form 1065 (Partnerships)
• Washington Department of Revenue (DOR) excise tax data
41
Main Assumptions
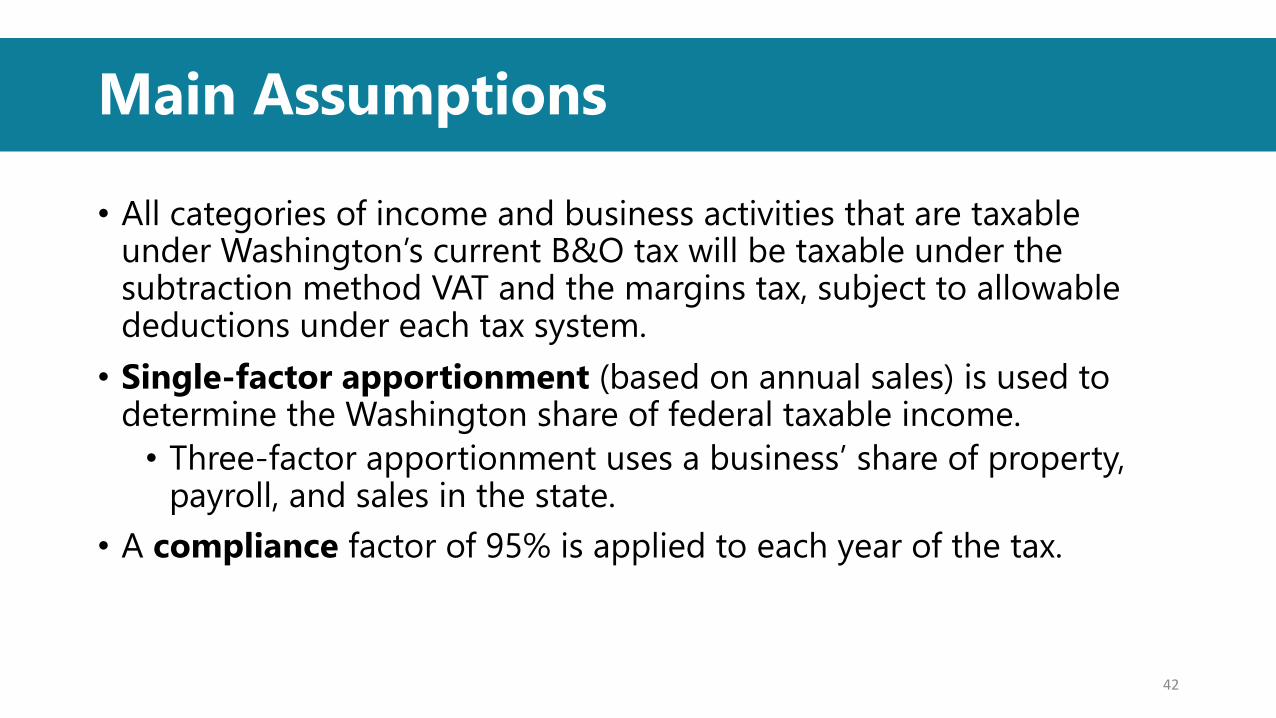
• All categories of income and business activities that are taxable under Washington’s current B&O tax will be taxable under the subtraction method VAT and the margins tax, subject to allowable deductions under each tax system. • Single-factor apportionment (based on annual sales) is used to
determine the Washington share of federal taxable income.• Three-factor apportionment uses a business’ share of property,
payroll, and sales in the state.• A compliance factor of 95% is applied to each year of the tax.
42

Deductions
VAT deductions for the Cost of Intermediate Goods and Services include:
• Cost of Goods Sold (COGS)• Repair and maintenance• Interest expenses of companies
whose interest income is taxable• Advertising• 90% of Other Deductions
Margins Tax deduction is the maximum of:
• COGS• Total compensation• $1 million• 30% of total revenue
43
Main Steps
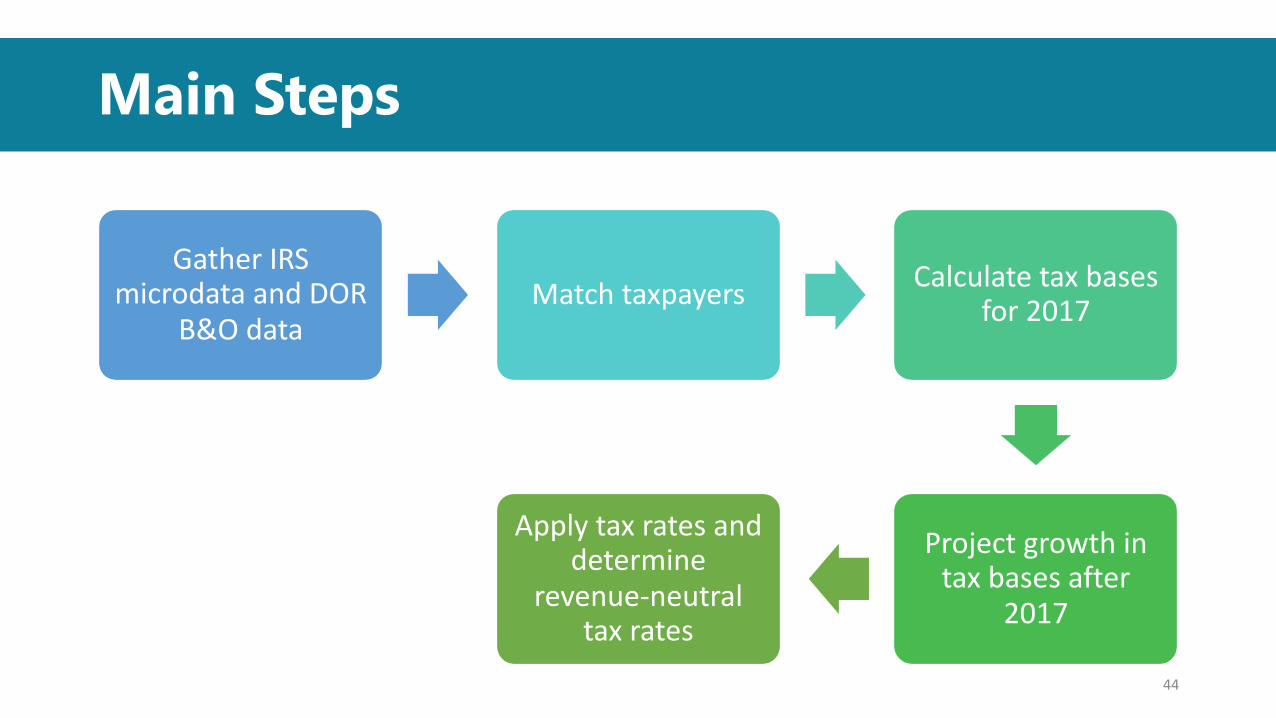
Gather IRS microdata and DOR
B&O dataMatch taxpayers Calculate tax bases
for 2017
Project growth in tax bases after
2017
Apply tax rates and determine
revenue-neutral tax rates
44

Results
Tax Goal Tax Taxable Income (a)
Flat Tax Rate (b)
Compliance Factor (c)
Tax Receipts (d) = (a) x (b) x (c)
VAT Revenue neutral tax rate $383.0 2.36% 95% $8.59
Margins Tax Revenue neutral tax rate $335.2 2.70% 95% $8.59
VATRevenue raised with tax rate suggested by 2002
Gates Study$383.0 2.20% 95% $8.01
Below target
45

Corporate Income/Net Receipts Tax

Revenue Target Estimates
• Gates 2002: Corporate income/net receipts tax (w/PIT) • Eliminate B&O tax + reduce the retail sales tax (to 3.5%)• Find the tax rate to replace $18.79 billion (2017-19 biennium).• Find the tax raised with 3.8% tax rate (2017-19 biennium).
• Gates 2002: Corporate income/net receipts tax (w/PIT)• Eliminate B&O tax and property tax + reduce the retail sales• Find the tax rate to replace $24.82 billion (2017-19 biennium).• Find the tax raised with 5.0% tax rate (2017-19 biennium).
• 2018 TSWG: Corporate income/net receipts tax • Eliminate B&O tax (no other changes)• Find the tax rate to replace $8.59 billion (2017-19 biennium).
47

Key Data SourcesData Sources PurposeInternal Revenue Service (IRS) aggregate data Federal tax collectionsIRS Statistics of Income (SOI) data Federal tax credits, deductions, and other
line itemsIRS Microdata for Washington federal corporate income tax (FTI)
Joint Committee on Taxation (JCT) Impact of federal tax reform on tax credits and deductionsCongressional Budget Office (CBO)
Bureau of Economic Analysis (BEA), Personal Consumption Expenditures
ApportionmentBureau of Labor Statistics (BLS) and Economic Revenue and Forecast Council (ERFC), Employment by SectorIRS SOIU.S. Census of GovernmentsU.S. Department of TreasurySecurities and Exchange Commission Form 10-K
Apportionment adjustmentsWashington State Department of Revenue (DOR) Excise Tax DataBEA, Before tax Corporate Profits (U.S.) Forecasts and quarterly allocations 48

Main Assumptions
• Only C-corporations are assumed to be subject to corporate income/net-receipts tax. • No S-corporations, partnerships, sole proprietors, or non-profits
• No state credits or deductions are modeled. This is in line with the 2002 Gates Study, which stated that the only deductions were those implicit in the federal tax code.• The timing of tax collections are adjusted to align data based
on federal fiscal years to Washington’s fiscal years.• A compliance factor of 95% is applied to each year of the tax.
49

Main Steps
Gather federal tax collection
records
Estimate 2017 federal taxable
income
Project growth for 2018 and
2019
Adjust for estimated effects of Tax Cuts and
Jobs Act
Apportion taxable income to Washington
Adjust the apportionment to account for effects of large
businesses
Apply tax rates and determine
revenue-neutral tax rates
50

Results
Revenue Neutral Rates (2017-19 Biennium)Revenue Target
New Taxes
State Sales/ Use
Tax
State Property
Tax
B&O Tax Corporate Income/ Net Receipts Tax
(and PIT) Rate
CINRT Revenue
PIT Revenue
Total Replaced Revenue
Gates 2002 (A)
CINRT and PIT
Reduce rate to 3.5%
Maintain current
lawEliminate 3.59% $1.95 B $16.84 B $18.79 B
Gates 2002 (B)
CINRT and PIT
Reduce rate to 3.5%
Eliminate Eliminate 4.75% $2.58 B $22.24 B $24.82 B
TSWG 2018 CINRT
Maintain current
rate (6.5%)
Maintain current
lawEliminate 15.80%
(CINRT only) $8.59B $0 $8.59 B
51

Results
Revenue Raised from CINR Tax and PIT Proposed in 2002 Gates Study (2017-19 Biennium)Revenue Target
New Taxes
State Sales/
Use Tax
State Property
Tax
B&O Tax Proposed CINR
Tax/PIT Rate
Revenue Replacement
Target
Total Revenue
Revenue Beyond Target
Gates 2002 (A)
CINRT and PIT
Reduce rate to 3.5%
Maintain current
lawEliminate 3.8% $18.79 B $19.87 B $1.08 B
Gates 2002 (B)
CINRT and PIT
Reduce rate to 3.5%
Eliminate Eliminate 5.0% $24.82 B $26.14 B $1.32 B
52

Business Tax Burden
Overview
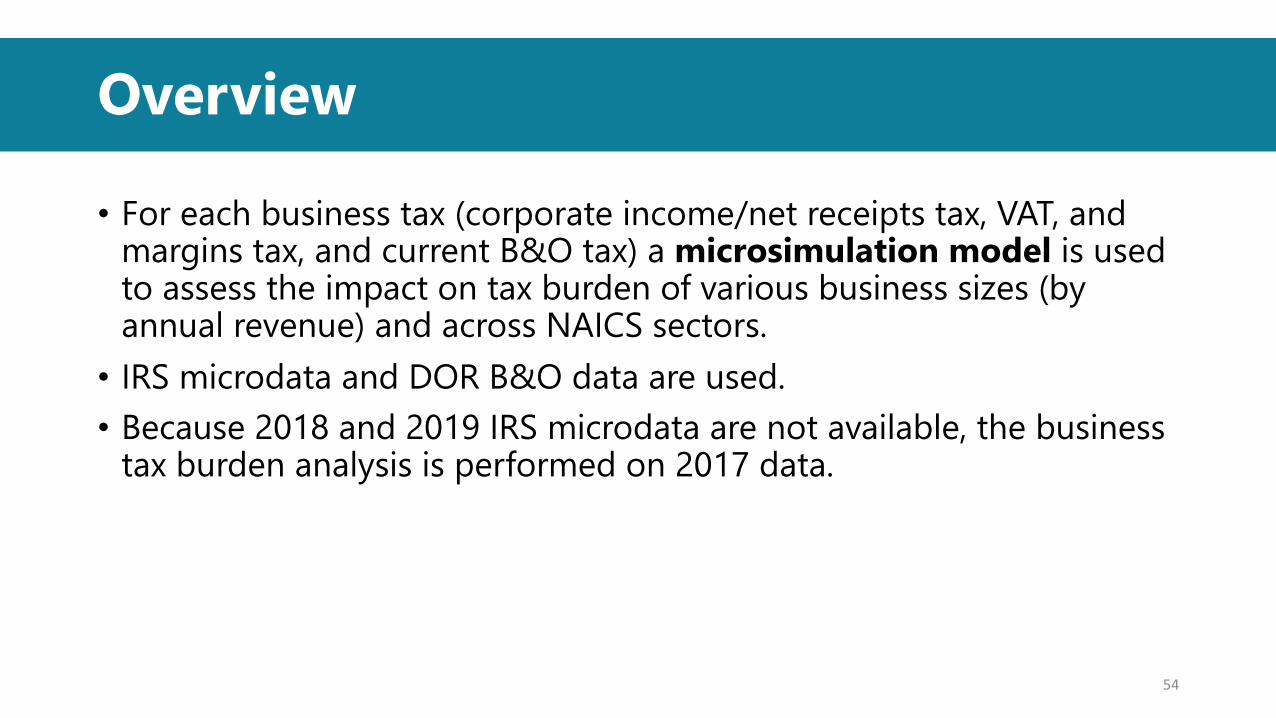
• For each business tax (corporate income/net receipts tax, VAT, and margins tax, and current B&O tax) a microsimulation model is used to assess the impact on tax burden of various business sizes (by annual revenue) and across NAICS sectors.• IRS microdata and DOR B&O data are used.• Because 2018 and 2019 IRS microdata are not available, the business
tax burden analysis is performed on 2017 data.
54

VAT and Margins TaxTax Burden by Size
55
0.0%
0.2%
0.4%
0.6%
0.8%
1.0%
1.2%
Under $250k $250k - $1million
$1 - $3million
$3 - $10million
$10 - $50million
$50 - $250million
Over $250million
Business Size (U.S. Gross Revenue)
Tax Burden as a Share of Gross Revenue
Current Business & Occupation Tax 2.36% Value Added Tax 2.70% Margins Tax

Corporate Income/Net Receipts TaxTax Burden by Size
56
0.0%
0.2%
0.4%
0.6%
0.8%
1.0%
1.2%
Under $250k $250k - $1million
$1 - $3million
$3 - $10million
$10 - $50million
$50 - $250million
Over $250million
Business Size (U.S. Gross Revenue)
Tax Burden as a Share of Gross Revenue
Current Business & Occupation Tax 3.59% Corporate Income/Net Receipts Tax4.75% Corporate Income/Net Receipts Tax 15.80% Corporate Income/Net Receipts Tax

VAT and Margins TaxTax Burden by NAICS Sector
57
Sector Description Current Business & Occupation Tax
2.36% Value Added Tax
2.70% Margins Tax
B&O Rank VAT Rank Margins Tax Rank
Health Care & Social Services 1.27% 1.36% 0.77% 1 1 2Real Estate and Rental & Leasing 1.08% 0.73% 0.64% 2 9 7Utilities 1.00% 0.87% 0.70% 3 6 5Educational Services 0.97% 0.96% 0.62% 4 4 8Administrative Support & Waste Management
0.96% 0.71% 0.52% 5 10 12
Finance & Insurance 0.90% 1.05% 0.67% 6 2 6Arts, Entertainment & Recreation 0.84% 0.87% 0.73% 7 7 4Professional, Scientific & Technical Services
0.79% 0.77% 0.58% 8 8 9
Information 0.71% 0.58% 0.74% 9 11 3All Industries 0.49% 0.49% 0.49%

VAT and Margins TaxTax Burden by NAICS Sector
58
Sector Description Current Business & Occupation Tax
2.36% Value Added Tax
2.70% Margins Tax
B&O Rank VAT Rank Margins Tax Rank
Other Services 0.69% 0.96% 0.57% 10 5 10Transportation & Warehousing 0.55% 0.52% 0.45% 11 13 15Management of Companies 0.54% 0.18% 0.23% 12 19 19Retail Trade 0.51% 0.46% 0.52% 13 15 13Accommodation & Food Services 0.50% 1.00% 0.92% 14 3 1Mining, Oil 0.47% 0.52% 0.54% 15 12 11Construction 0.45% 0.48% 0.40% 16 14 16Agriculture, Forestry, Hunting & Fishing
0.37% 0.37% 0.35% 17 16 17
Manufacturing 0.28% 0.33% 0.46% 18 17 14Wholesale Trade 0.28% 0.25% 0.27% 19 18 18All Industries 0.49% 0.49% 0.49%

Corporate Income/Net Receipts TaxTax Burden by NAICS Sector
59
Sector Description Current Business & Occupation Tax
3.59% Corporate Income/Net Receipts Tax
4.75% Corporate Income/Net Receipts Tax
15.80% Corporate Income/Net Receipts Tax
B&O Rank CINRT Rank
Health Care & Social Services 1.27% 0.03% 0.05% 0.15% 1 13Real Estate and Rental & Leasing 1.08% 0.04% 0.06% 0.19% 2 8Utilities 1.00% 0.05% 0.06% 0.21% 3 6Educational Services 0.97% 0.03% 0.04% 0.13% 4 15Administrative Support & Waste Management
0.96% 0.05% 0.06% 0.21% 5 7
Finance & Insurance 0.90% 0.17% 0.23% 0.77% 6 4Arts, Entertainment & Recreation 0.84% 0.01% 0.01% 0.04% 7 19Professional, Scientific & Technical Services
0.79% 0.04% 0.06% 0.19% 8 9
Information 0.71% 0.21% 0.28% 0.93% 9 3All Industries 0.49% 0.11% 0.15% 0.49%

Corporate Income/Net Receipts TaxTax Burden by NAICS Sector
60
Sector Description Current Business & Occupation Tax
3.59% Corporate Income/Net Receipts Tax
4.75% Corporate Income/Net Receipts Tax
15.80% Corporate Income/Net Receipts Tax
B&O Rank CINRT Rank
Other Services 0.69% 0.02% 0.03% 0.10% 10 16Transportation & Warehousing 0.55% 0.03% 0.05% 0.15% 11 14Management of Companies 0.54% 0.95% 1.26% 4.19% 12 1Retail Trade 0.51% 0.07% 0.09% 0.31% 13 5Accommodation & Food Services 0.50% 0.02% 0.03% 0.10% 14 17Mining, Oil 0.47% 0.04% 0.05% 0.16% 15 10Construction 0.45% 0.02% 0.02% 0.08% 16 18Agriculture, Forestry, Hunting & Fishing
0.37% 0.04% 0.05% 0.17% 17 11
Manufacturing 0.28% 0.22% 0.30% 0.99% 18 2Wholesale Trade 0.28% 0.04% 0.05% 0.17% 19 12All Industries 0.49% 0.11% 0.15% 0.49%

Personal Income Tax Model

Budget Proviso: Update 2002 Study
1. Update the data and research that informed recommendations and other analysis.
2. Estimate how much revenue the PIT replacement alternatives would have generated for the 2017-19 biennium if implemented on January 1, 2003.
3. Estimate the tax rates necessary to implement the PIT in order to achieve the actual revenues generated during the 2017-19 biennium.
62

PIT Revenue Target Estimates
Model both a flat rate tax and graduated rate tax, featuring various combinations of the following (six options evaluated in the 2002 Gates Study):
63

Key AssumptionsTax Collection: All income sourced in WA and income for WA residents are subject to the tax. Compliance: 95% of those who file a federal income tax return comply Tax Due: Tax due for 2018 and 2019 estimated using 2017 returns and reference forecasts.
Main Data Sources and Assumptions
Main Data Sources (2017)• WA Federal Individual Income
Tax Returns• WA Federal Business Tax
Returns• OR Personal Income Tax
summary statistics• Dept of Revenue Excise Tax
Data
*There were several other data sources and assumptions, not included in this presentation due to limited space and time.
64

Overall Method
Step 1: Identify 2017-2019 biennial revenues from the Economic and Revenue Forecast Council for three major excise taxes being reduced or eliminated (retail sales and use tax, property tax, and B&O tax).
Step 2: Obtain revenue targets for each proposal. Calculate the revenues that would need to be collected for each proposal in which the existing taxes would be reduced or eliminated, in order to replace the 2017-2019 biennial revenues collected by each of the existing taxes.
Step 3: Build the PIT model, using the main data sources and several other data sources required for the B&O credit, out-of-state credit, and disabled deduction models.
Step 4: Find the flat and graduated PIT rates that most closely meet the revenue targets for each proposal.
65

Results: Flat Rate Model
2017-2019 Biennium Revenue Neutral Rates – Flat Rate ModelRevenue Target Estimate
State Sales/Use Tax State Property Tax CINR Tax B&O Tax Personal Income Tax
Reduce rate to 3.5%
Eliminate Current Law
Eliminate None PIT rate Current Law
Eliminate
Gates A X X X X 2.30%
Gates B X X X X 3.64%
Gates C X X X X 5.08%
Gates D X X X X 6.40%
Gates E X X X X 3.59%
Gates F X X X X 4.75%
66
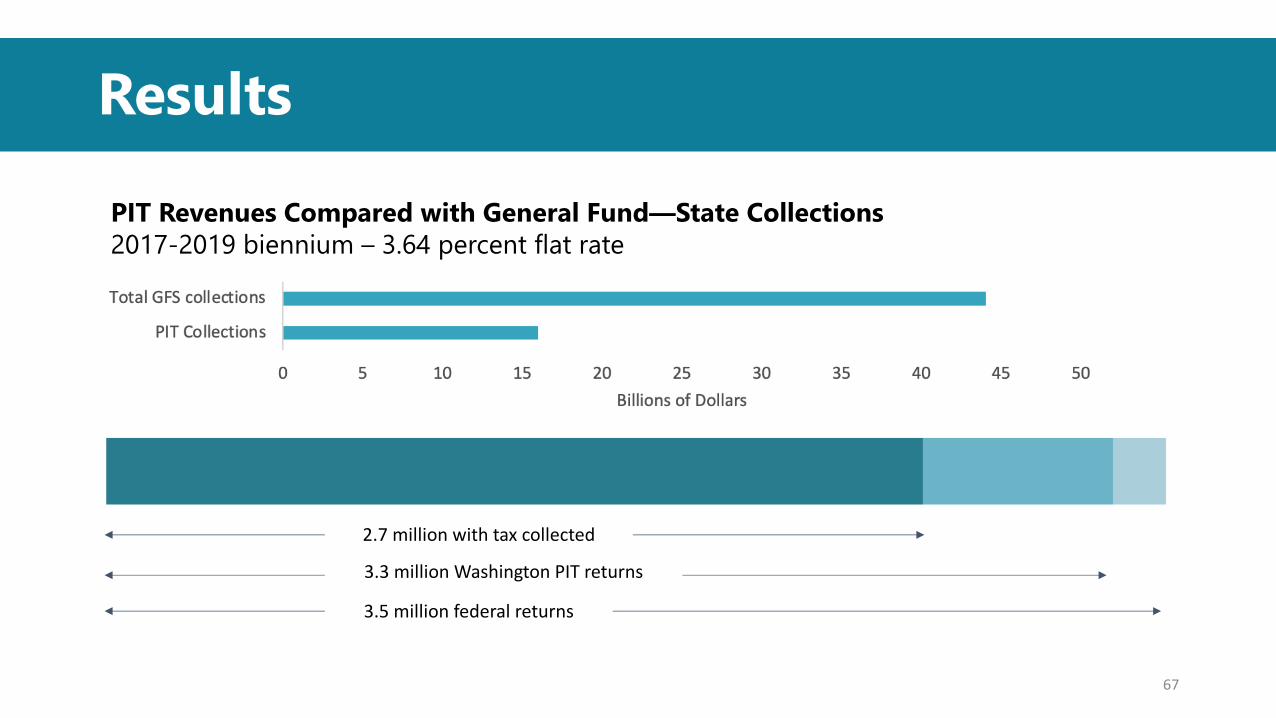
Results
3.5 million federal returns
3.3 million Washington PIT returns
2.7 million with tax collected
PIT Revenues Compared with General Fund—State Collections2017-2019 biennium – 3.64 percent flat rate
67

Results
Gross Tax, Credits, and Net Tax – Tax Year 2017 (Residents)
AGI, Taxable, and CollectionsTY2017 – 3.64 percent flat rate - Residents
AGI: $292 billion
Nonresident collections: $0.2 billion
Taxable: $238 billionNet tax due: $7.8 billion
Gross tax: $8.7 billion
Net tax due: $7.8 billion
Out-of-state credit: $0.4 billionB&O credit: $0.4 billion
68

Results: Flat Rate at 3.64 Percent
69

Model Features: Calculation of WA PIT
[Taxable Income] = AGI – Deductions – Exemptions
• Deductions = [Standard Deduction] + [Elderly Deduction] + [Disabled Deduction]
• Exemptions = $3,650 x [Count of filer, spouse, dependents]Gross Tax = [Tax Rate] x [Taxable Income]
Credits = [B&O Credit] + [Out-of-State Credit]
Tax Due = Tax – Total Credits*$3,650 is the Personal Exemption for 2017.
70

Adjustments to Tax Base
DeductionsTax Year Joint Single
Head of Household
Elderly/Disabled
Personal Exemption
2017 12,500 6,250 8,750 1,250 3,650
2018 12,750 6,375 8,950 1,300 3,700
2019 12,950 6,475 9,050 1,300 3,750
The table below shows the adjustment amounts used for each tax year. We calculated these by inflating the amounts used in the Gates (2002) study.
• Standard deduction for single and joint filers• Deductions for elderly filers and disabled filers• Personal exemption for each filer and dependent
Adjustments as a Percentage of AGI
71

B&O Credit
Pass-through businesses pay federal individual income tax: Roughly half of U.S business activity is reported as individual income
Business income is concentrated among higher-AGI individuals (Represents 11% AGI for residents making $100K or more vs. 4-6% for $100K or less)
Helps avoid double taxing businesses
72

Out-of-State Credit
“A resident individual is allowed a credit against the tax imposed […] for the amount of any income tax imposed by another state” (2003 bill)
The out-of-state credit will apply more often to higher-income residents than lower-income residents.
Most out-of-state credit will be related to Oregon tax payments. Clark County residents receive substantial amount of income from Portland based businesses (where their income is subject to the Oregon income tax).
73

Household Tax Burden

Objectives of the HH Burden Model
1. Estimate and report household tax burdens, measured as the total tax imposed on a household from state and local sources.
2. Estimate the household tax burden as a share of household income.
3. Model the tax burden from alternative rates and types of taxation.
75

Main Data Sources
Data Source Purpose
IRS Individual Income Tax Data Personal Income
County Property Tax Rolls Property Valuations and Property Tax Payments Made
Bureau of Labor Statistics - Consumer Expenditure Survey
Consumer Spending Profile for Households
Real Estate Excise Tax Data Taxable Property Sales
76
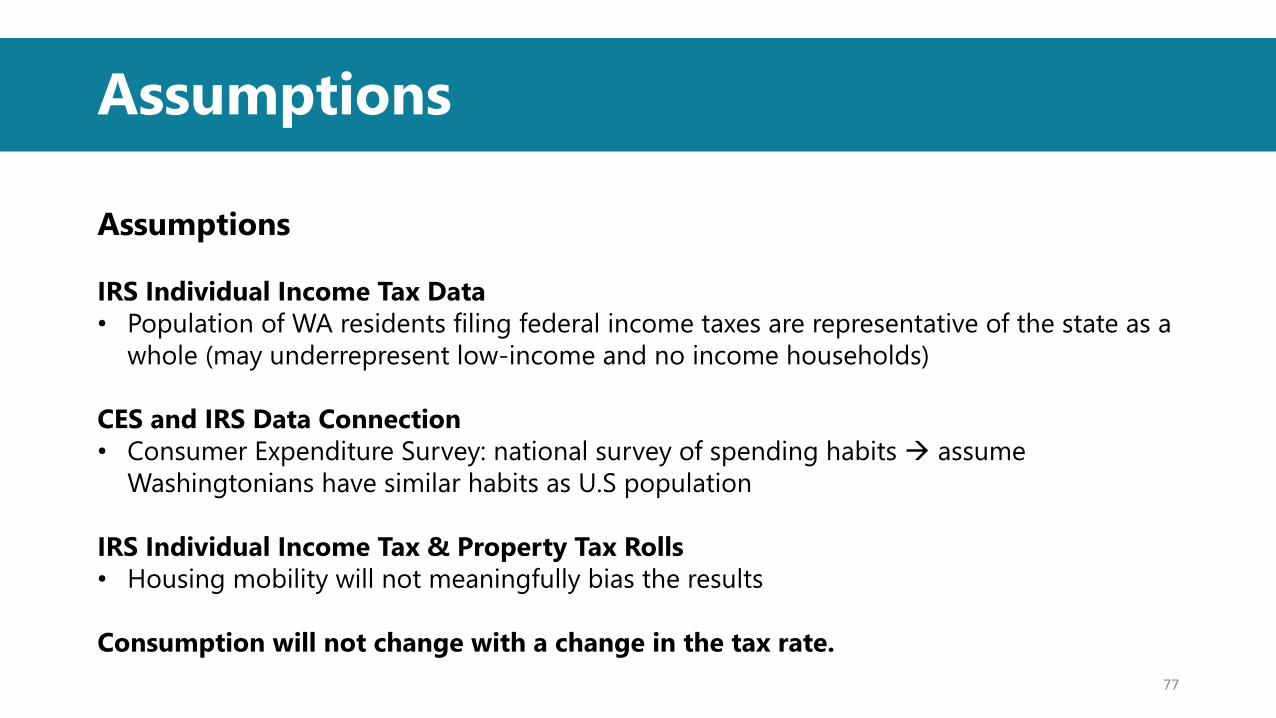
Assumptions
Assumptions
IRS Individual Income Tax Data • Population of WA residents filing federal income taxes are representative of the state as a
whole (may underrepresent low-income and no income households)
CES and IRS Data Connection• Consumer Expenditure Survey: national survey of spending habits à assume
Washingtonians have similar habits as U.S population
IRS Individual Income Tax & Property Tax Rolls• Housing mobility will not meaningfully bias the results
Consumption will not change with a change in the tax rate.77

Method Steps
Step 1: Estimate the tax base for the excise, real estate excise, property, personal income, and capital gains tax using various data sources.
Step 2: Estimate FY 2017 Tax Burdens.
Step 3: Transform FY 2017 Tax Burdens into 2017-2019 Biennium Estimates. Inflate tax burden estimates using actual revenue figures published by the Washington State Economic and Revenue Forecast Council and Internal Department of Revenue data.
78

WA Household Taxes and Alternatives
Current Washington Taxes Possible Alternative Taxes• State and Local Retail Sales Tax• Alcoholic Beverages Taxes• Cigarette & Tobacco Taxes• Insurance Premiums Tax• Gasoline Tax• Real Estate Excise Tax• Public Utility Taxes• State and Local Property Tax
• Personal Income Tax• Capital Gains Tax
The total amount of taxes paid by each household constitutes the household tax burden.
79

Household Tax Burden: Current Law
80
Average Tax Burden on Households (State and Local)2017-2019 Biennium
Current Law2017 Household Income (by decile) $0 $17,000 $30,000 $44,000 $58,000 $74,000 $92,000 $115,000 $146,000 $208,000
$17,000 $30,000 $44,000 $58,000 $74,000 $92,000 $115,000 $146,000 $208,000 ∞
State Retail Sales Tax $878 $1,106 $1,339 $1,680 $1,981 $2,236 $2,643 $3,020 $3,670 $5,392Local Retail Sales Tax $381 $480 $582 $730 $861 $972 $1,148 $1,312 $1,594 $2,342
Alcoholic Beverages Taxes $30 $49 $51 $80 $78 $175 $125 $120 $172 $214Cigarette & Tobacco Taxes $136 $155 $209 $172 $190 $182 $143 $151 $125 $101Insurance Premiums Tax $28 $41 $57 $67 $84 $88 $95 $108 $118 $159Gasoline Tax $142 $187 $247 $270 $298 $334 $376 $401 $439 $416Real Estate Excise Tax $103 $88 $114 $154 $185 $211 $244 $275 $355 $837
State Public Utility Taxes $44 $59 $62 $67 $73 $81 $89 $93 $102 $134Local Public Utility Taxes $91 $119 $128 $142 $152 $166 $185 $192 $200 $259
State Property Tax $391 $337 $405 $550 $645 $742 $805 $885 $1,015 $1,686Local Property Tax $1,247 $1,075 $1,293 $1,753 $2,059 $2,366 $2,568 $2,823 $3,237 $5,377
Total Tax $3,472 $3,695 $4,487 $5,665 $6,607 $7,553 $8,420 $9,380 $11,026 $16,917
Tax as % of Income 15.0% 11.7% 10.7% 9.6% 8.7% 7.8% 7.0% 6.1% 3.4%Note: These are average tax burdens by income group by decile (e.g., tax payments by household decile group averaged by number of household per decile). Not all taxpayers will have taxes in the respective tax type (i.e., not everyone will sell real estate every year and be subject to the real estate excise tax), the figures try to illustrate an payment of an "average" taxpayer.

Household Tax Burden: Current Law
81
Average Annual Household Tax Burden (State only)2017-2019 Biennium
Current Law2017 Household Income (by decile) $0 $17,000 $30,000 $44,000 $58,000 $74,000 $92,000 $115,000 $146,000 $208,000
$17,000 $30,000 $44,000 $58,000 $74,000 $92,000 $115,000 $146,000 $208,000 ∞
State Retail Sales Tax $878 $1,106 $1,339 $1,680 $1,981 $2,236 $2,643 $3,020 $3,670 $5,392
Alcoholic Beverages Taxes $30 $49 $51 $80 $78 $175 $125 $120 $172 $214Cigarette & Tobacco Taxes $136 $155 $209 $172 $190 $182 $143 $151 $125 $101Insurance Premiums Tax $28 $41 $57 $67 $84 $88 $95 $108 $118 $159Gasoline Tax $142 $187 $247 $270 $298 $334 $376 $401 $439 $416Real Estate Excise Tax $103 $88 $114 $154 $185 $211 $244 $275 $355 $837
State Public Utility Taxes $44 $59 $62 $67 $73 $81 $89 $93 $102 $134
State Property Tax $391 $337 $405 $550 $645 $742 $805 $885 $1,015 $1,686
Total Tax $1,753 $2,020 $2,484 $3,040 $3,535 $4,049 $4,519 $5,053 $5,995 $8,938
Tax as % of Income 8.2% 6.5% 5.7% 5.1% 4.7% 4.2% 3.7% 3.3% 1.8%
Note: These are average tax burdens by income group by decile (e.g., tax payments by household decile group averaged by number of household per decile). Not all taxpayers will have taxes in the respective tax type (i.e., not everyone will sell real estate every year and be subject to the real estate excise tax), the figures try to illustrate an payment of an "average" taxpayer.

Household Tax Burden: PIT Estimates
Summary of Proposal Tax Burdens2017 Household Income $0 $17,000 $30,000 $44,000 $58,000 $74,000 $92,000 $115,000 $146,000 $208,000
$17,000 $30,000 $44,000 $58,000 $74,000 $92,000 $115,000 $146,000 $208,000 ∞Tax as a Percent of Income
Gates A Flat PIT Difference 0.0% -0.5% 0.2% 0.5% 0.7% 0.9% 1.0% 1.1% 1.2% 1.4%Gates A Graduated PIT Difference 0.0% -1.4% -0.7% -0.4% -0.2% 0.1% 0.3% 0.5% 0.8% 1.8%Gates B Flat PIT Difference 0.0% -1.2% -0.1% 0.3% 0.6% 0.9% 1.1% 1.3% 1.5% 1.8%Gates B Graduated PIT Difference 0.0% -2.3% -1.3% -0.9% -0.5% -0.1% 0.3% 0.7% 1.3% 2.8%Gates C Flat PIT Difference 0.0% -1.4% 0.1% 0.7% 1.1% 1.5% 1.7% 2.0% 2.2% 2.7%Gates C Graduated PIT Difference 0.0% -2.9% -1.6% -0.9% -0.4% 0.1% 0.6% 1.2% 1.9% 4.0%Gates D Flat PIT Difference 0.0% -1.9% 0.0% 0.7% 1.2% 1.7% 2.0% 2.4% 2.8% 3.4%Gates D Graduated PIT Difference 0.0% -3.9% -2.1% -1.3% -0.7% 0.0% 0.7% 1.4% 2.3% 5.1%Gates E Difference 0.0% -1.2% 0.0% 0.3% 0.6% 0.9% 1.1% 1.4% 1.6% 2.0%Gates F Difference 0.0% 1.0% 1.9% 2.2% 2.5% 2.7% 2.8% 3.0% 3.2% 3.3%
The summary table below shows the difference in tax as a percent of income from the current law for each Gates analysis. The data suggests that:
• Graduated rate PIT increases the tax burden for higher income households relative to a flat PIT rate. • Gates A is the most modest in its effects on household tax burden, estimated to cause the smallest deviation from current law. • Gates F shifts the tax burden more towards households as the tax burden increases for all measured household income groups.
82

Household Burden: Flat Rate PITTarget Revenue Estimate Key
Gates AReduce Sales Tax to 3.5%
Gates BReduce Sales Tax to 3.5%Eliminate State Property Tax
Gates CEliminate Sales Tax
Gates DEliminate Sales TaxEliminate State Property Tax
Gates EReduce Sales Tax to 3.5%Replace B&O Tax with CINR
Gates FReduce Sales Tax to 3.5%Eliminate State Property TaxReplace B&O Tax with CINR
83
0.0%
2.0%
4.0%
6.0%
8.0%
10.0%
12.0%
14.0%
16.0%
18.0%
$17,000-$30,000
$30,000-$44,000
$44,000-$58,000
$58,000-$74,000
$74,000-$92,000
$92,000-$115,000
$115,000-$146,000
$146,000-$208,000
$208,000+
Tax
as a
Per
cent
of I
ncom
e
2017 Household Income
Household Tax Burden: Flat Rate PIT
Current Law
Gates A
Gates B
Gates C
Gates D
Gates E
Gates F
— Federal Poverty Level, Four-Person Household: $26,200Federal Poverty Level:
$26,200 for four-person

Household Burden: Graduated Rate PIT
Target Revenue Estimate Key
Gates AReduce Sales Tax to 3.5%
Gates BReduce Sales Tax to 3.5%Eliminate State Property Tax
Gates CEliminate Sales Tax
Gates DEliminate Sales TaxEliminate State Property Tax
84
0.0%
2.0%
4.0%
6.0%
8.0%
10.0%
12.0%
14.0%
16.0%
18.0%
$17,000-$30,000
$30,000-$44,000
$44,000-$58,000
$58,000-$74,000
$74,000-$92,000
$92,000-$115,000
$115,000-$146,000
$146,000-$208,000
$208,000+
Tax
as a
Per
cent
of I
ncom
e
2017 Household Income
Household Tax Burden: Graduated Rate PIT
Current Law
Gates A
Gates B
Gates C
Gates D
— Federal Poverty Level, Four-Person Household: $26,200
Federal Poverty Level: $26,200 for four-person household
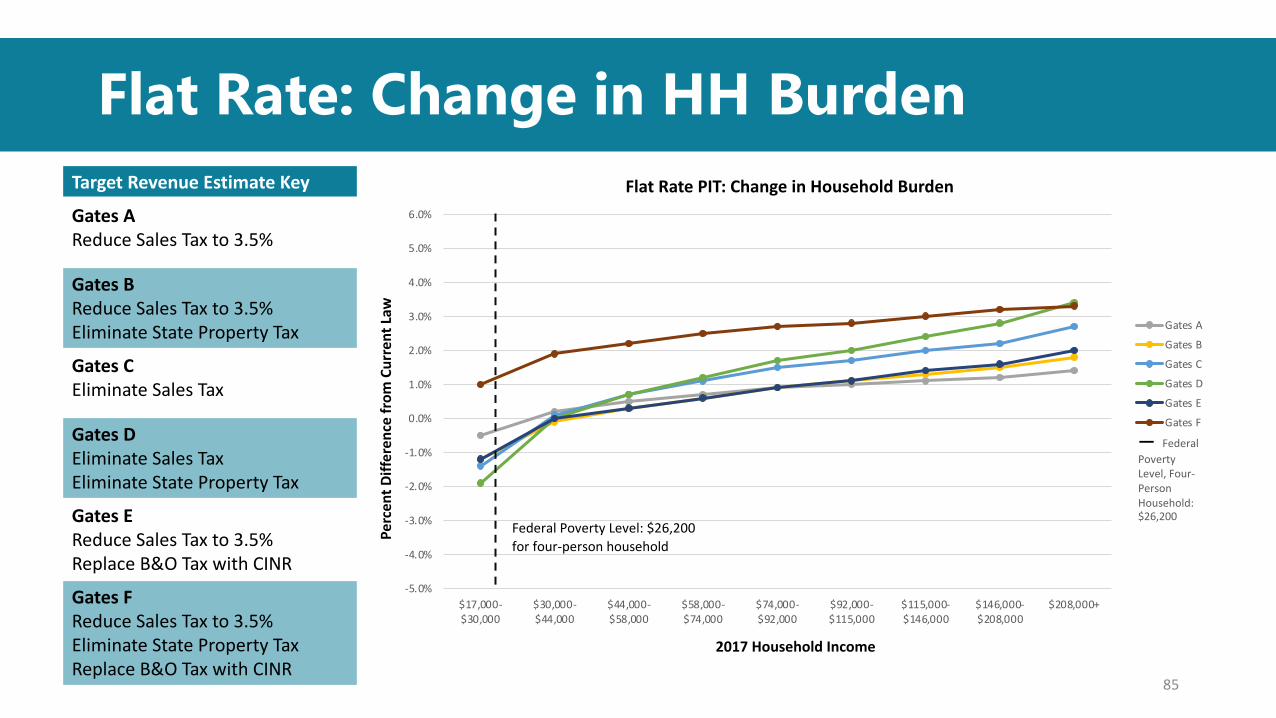
Flat Rate: Change in HH BurdenTarget Revenue Estimate Key
Gates AReduce Sales Tax to 3.5%
Gates BReduce Sales Tax to 3.5%Eliminate State Property Tax
Gates CEliminate Sales Tax
Gates DEliminate Sales TaxEliminate State Property Tax
Gates EReduce Sales Tax to 3.5%Replace B&O Tax with CINR
Gates FReduce Sales Tax to 3.5%Eliminate State Property TaxReplace B&O Tax with CINR
85
-5.0%
-4.0%
-3.0%
-2.0%
-1.0%
0.0%
1.0%
2.0%
3.0%
4.0%
5.0%
6.0%
$17,000-$30,000
$30,000-$44,000
$44,000-$58,000
$58,000-$74,000
$74,000-$92,000
$92,000-$115,000
$115,000-$146,000
$146,000-$208,000
$208,000+
Perc
ent D
iffer
ence
from
Cur
rent
Law
2017 Household Income
Flat Rate PIT: Change in Household Burden
Gates A
Gates B
Gates C
Gates D
Gates E
Gates F
— Federal Poverty Level, Four-Person Household: $26,200
Federal Poverty Level: $26,200 for four-person household

Graduated: Change in HH Burden
Target Revenue Estimate Key
Gates AReduce Sales Tax to 3.5%
Gates BReduce Sales Tax to 3.5%Eliminate Property Tax
Gates CEliminate Sales Tax
Gates DEliminate Sales TaxEliminate State Property Tax
86
-5.0%
-4.0%
-3.0%
-2.0%
-1.0%
0.0%
1.0%
2.0%
3.0%
4.0%
5.0%
6.0%
$17,000-$30,000
$30,000-$44,000
$44,000-$58,000
$58,000-$74,000
$74,000-$92,000
$92,000-$115,000
$115,000-$146,000
$146,000-$208,000
$208,000+
Perc
ent D
iffer
ence
from
Cur
rent
Law
2017 Household Income
Graduated Rate PIT: Change in Household Burden
Gates A
Gates B
Gates C
Gates D
— Federal Poverty Level, Four-Person Household: $26,200
Federal Poverty Level: $26,200 for four-person household

Break: 10:40 – 10:50 a.m.

Property Tax

Property Tax Analysis
Estimate how much revenue would have been generated for the 2017-19 Biennium if the 1 percent revenue growth limit on regular property taxes was replaced with a limit based on population growth and inflation if the state had implemented this alternative on January 1, 2003?
Due to 2017 and 2018 legislative changes to the state property tax levy, two comparative analyses:• Property tax with no changes• Property tax with the changes
89

Comparison of Rates
Lesser of 1% or the Implicit Price Deflator Combined Inflation and Population Rates
90
-1.00%
-0.50%
0.00%
0.50%
1.00%
1.50%
2004
2005
2006
2007
2008
2009
2010
2011
2012
2013
2014
2015
2016
2017
2018
2019
2020
0.000%
1.000%
2.000%
3.000%
4.000%
5.000%
6.000%
7.000%
2004
2005
2006
2007
2008
2009
2010
2011
2012
2013
2014
2015
2016
2017
2018
2019
2020

• Prior to 2017, the state property tax was budget-based• After McCleary, property tax
is two parts (both rate-based)• Both parts revert to budget-
based in tax year 2022 and beyond
Washington State Property Tax
91
$0
$500
$1,000
$1,500
$2,000
$2,500
$3,000
$3,500
$4,000
$4,500
2004 2006 2008 2010 2012 2014 2016 2018 2020
Prop
erty
Tax
Rev
enue
s Mill
ions
Tax Year
Current Law-P1 Current Law-P2
State historical property tax revenues

• A population and inflation rate limitation would have generated more revenue• Approximately 37%
more in taxes over the FY 2017-2019.
Property Tax – without McCleary changes
92
$0
$500
$1,000
$1,500
$2,000
$2,500
$3,000
$3,500
2004 2005 2006 2007 2008 2009 2010 2011 2012 2013 2014 2015 2016 2017 2018 2019 2020
Estim
ated
Pro
pert
y Ta
x Mill
ions
Tax Year
1% Limit Budget-based, Population-Inflation
State Property Tax Levy: Budget-Based ApproachFiscal Year 1% Limit Population-Inflation Revenue Difference Percent DifferenceFY 2017 $2,147,000,000 $2,878,000,000 $731,000,000 34.0%FY 2018 $2,208,000,000 $3,030,000,000 $822,000,000 37.2%FY 2019 $2,272,000,000 $3,181,000,000 $909,000,000 40.0%

• A population and inflation rate limitation would have generated more revenue• Approximately 3.4%
more in taxes over the FY 2017-2019.
Property Tax – with McCleary changes
93
State Property Tax Levy: Rate-Based Approach
Fiscal Year Current Law Population-Inflation Revenue Difference Percent Difference
FY 2017 $2,766,000,000 $3,091,000,000 $324,000,000 11.7%
FY 2018 $3,340,000,000 $3,346,000,000 $6,000,000 0.2%
FY 2019 $3,761,000,000 $3,767,000,000 $6,000,000 0.2%
$0
$500
$1,000
$1,500
$2,000
$2,500
$3,000
$3,500
$4,000
$4,500
2004 2005 2006 2007 2008 2009 2010 2011 2012 2013 2014 2015 2016 2017 2018 2019 2020
Estim
ated
Pro
pert
y Ta
x Mill
ions
Tax Year
Current Law-P1&P2 Rate-based, Population-Inflation

Oregon and Idaho Tax Structure Analysis

Oregon and Idaho Tax Analysis
Estimate the revenue that would have been generated during the 2017-19 Biennium had Washington adopted the tax structure of our border states?
95

• Selected major tax sources from all three states.• Oregon and Idaho
both have state level personal income and corporate income taxes.
Comparative Approach
96
Tax Source Washington Oregon Idaho
Retail Sales Tax X X
Property Tax X X X
Business & Occupation Tax X
Public Utility Tax X
Real Estate Excise Tax X
Gas Tax X X X
Cigarette Tax X X X
Corporate Income Tax X X
Personal Income Tax X X

Analytic Methods
Document fiscal year 2018 and 2019 Washington tax revenues for the selected major state taxes.
Identify and approximate comparative state tax rates applicable to relevant segments of Washington’s tax base for both state and local portions.
Transform Washington respective tax bases to adjust to identified relevant Oregon or Idaho tax law and exemptions and/or deductions.
Estimate alternative Oregon and Idaho tax revenues by applying respective rates to the transformed Washington State tax bases.
97

Comparison of OR & ID Tax Structures
98
• Overall, the application of both states’ tax structures would generate more tax revenues to the state of Washington
• Idaho would outperform Oregon’s in terms of total collections.
Tax Revenues (in millions of dollars)
Washington Oregon Idaho
FY 2018 $21,839 $22,154 $26,799
FY 2019 $23,027 $24,473 $29,655
Total
(FY 18-19)$44,866 $46,627 $56,454
Difference $1,761 $11,588

• Idaho state rate is 6% (no local).• Idaho does not exempt basic
food purchases.• The State would generate less
revenue with OR or ID structure.
Sales Tax
Comparison of Sales Tax Revenues(Tax Revenues in the millions of dollars)
State Local State Local State LocalFY 2018 $10,994 $4,776 $0 $0 $10,148 $0FY 2019 $11,936 $5,189 $0 $0 $11,018 $0
Total (FY 18-19) $22,930 $9,966 $0 $0 $21,166 $0
Difference -$22,930 -$9,966 -$1,764 -$9,966
Washington Oregon Idaho
99

• Both and OR and ID do not have a state portion of the property tax (schools are funded by local levies).• WA’s state and local levies compare ID and OR local levies.• WA State property tax collections would be lower in the OR and ID structure.
Property Tax
State Local State Local State LocalTax Year 2018 $2.70 $8.66 $0.00 $10.89 $0.00 $12.98Tax Year 2019 $2.40 $7.37 $0.00 $10.53 $0.00 $12.41
Washington Oregon Idaho
Comparison of Tax Rates
Comparison of Property Taxes Revenues
State Local State Local State LocalTax Year 2018 $3,346,000,000 $9,894,000,000 $0 $12,598,000,000 $0 $12,795,000,000Tax Year 2019 $3,349,000,000 $9,471,000,000 $0 $13,705,000,000 $0 $13,956,000,000
Total (FY 18-19)
$6,695,000,000 $19,365,000,000 $0 $26,303,000,000 $0 $26,751,000,000
Difference -$6,695,000,000 $6,938,000,000 -$6,695,000,000 $7,386,000,000
Washington Oregon Idaho
100

• The State would generate less revenue with OR or ID structure.
Gas Tax
January 1, 2017Washington Oregon Idaho
State Excise Tax 0.494$ 0.300$ 0.320$ Other State Taxes/Fees 0.001$ 0.011$ 0.010$ Total State Rate 0.495$ 0.311$ 0.330$
January 1, 2018Washington Oregon Idaho
State Excise Tax 0.494$ 0.340$ 0.320$ Other State Taxes/Fees 0.001$ 0.028$ 0.010$ Total State Rate 0.495$ 0.368$ 0.330$
January 1, 2019Washington Oregon Idaho
State Excise Tax 0.494$ 0.340$ 0.320$ Other State Taxes/Fees 0.001$ 0.028$ 0.010$ Total State Rate 0.495$ 0.368$ 0.330$
Comparison of Tax Rates
Comparison of Gas Tax RevenuesWashington Oregon Idaho
FY 2018 $1,380,000,000 $950,000,000 $920,000,000FY 2019 $1,350,000,000 $1,000,000,000 $900,000,000
Total (FY 18-19)
$2,730,000,000 $1,950,000,000 $1,820,000,000
Difference -$780,000,000 -$910,000,000
101

• The State would generate less revenue with OR or ID structure.
Cigarette Tax
Comparison of Tax Rates
Comparison of Gas Tax Revenues
Fiscal Year Washington Oregon IdahoFY 2018 $3.025 $1.330 $0.570FY 2019 $3.025 $1.330 $0.570
102
(Tax revenues in the millions of dollars)Washington Oregon Idaho
FY 2018 $361.5 $234.1 $100.3FY 2019 $342.1 $222.6 $95.4Total (FY 18-19)
$703.6 $456.8 $195.8
Difference -$246.9 -$507.9

• Using Oregon’s tax structure, it is estimated that it could raise $39 billion. • Using Idaho’s tax structure it is
estimated that it could raise $28 billion.
Personal Income Tax
Comparison of Personal Income Tax Revenues
OR and ID Average Tax per Filer
Washington Oregon IdahoFY 2018 $0 $18,701,000,000 $13,611,000,000FY 2019 $0 $20,657,000,000 $14,324,000,000Total (FY 18-19)
$0 $39,358,000,000 $27,935,000,000
Difference $39,358,000,000 $27,935,000,000
103
Min. Up To 2017 2018 2017 2018$0 $5,000 $20 $19 $4 $7
$5,000 $10,000 $110 $114 $13 $7$10,000 $15,000 $284 $303 $55 $17$15,000 $20,000 $522 $551 $166 $99$20,000 $25,000 $802 $833 $328 $257$25,000 $30,000 $1,109 $1,160 $513 $449$30,000 $35,000 $1,426 $1,498 $714 $652$35,000 $40,000 $1,738 $1,822 $899 $868$40,000 $45,000 $2,037 $2,136 $1,098 $1,082$45,000 $50,000 $2,330 $2,439 $1,333 $1,313$50,000 $60,000 $2,700 $2,837 $1,670 $1,658$60,000 $70,000 $3,260 $3,387 $2,172 $2,128$70,000 $80,000 $3,870 $4,008 $2,726 $2,659$80,000 $90,000 $4,496 $4,630 $3,308 $3,182$90,000 $100,000 $5,176 $5,302 $3,929 $3,775
$100,000 $250,000 $9,209 $9,351 $6,984 $6,686$250,000 $500,000 $25,639 $25,940 $20,177 $18,319$500,000 …or more $104,752 $103,351 $84,837 $81,010
Federal AGI Level Oregon Idaho

• Using Oregon’s tax structure, it is estimated that it could raise $4.9 billion. • Using Idaho’s tax structure it is estimated that it could raise $4.6
billion. • Note: Washington B&O raised $8.59 billion (2017-19 biennium).
Corporate Income Tax
Comparison of Corporate Income Tax Revenues
Washington Oregon IdahoFY 2018 $0 $2,274,000,000 $2,022,000,000FY 2019 $0 $2,589,000,000 $2,337,000,000
Total (FY 18-19)
$0 $4,863,000,000 $4,359,000,000
Difference $4,863,000,000 $4,359,000,000
104

Report Outline:TSWG Economic Analysis

TSWG: Economic Analysis Report
Summary Report Technical Notes
Audience: General Public Those interested in the technical details and analysis
Length Approximately 20 pages Detailed, but not voluminous
Orientation: Graphically oriented with charts and infographics
Text with supporting tables and charts
Production Quality: Professional designed and produced
Professional produced
106

Table of Contents• Acknowledgments (DOR,
WWU, Technical Advisory Group)• Submittal Letter from TSWG• Executive Summary• Main Body
Main Body Outline• About the TSWG and Economic Modeling
• Summary of 2018 TSWG Report• Summary of Budget provisos and economic
questions• WA Current Tax Structure
• Summary of 2002 Gates Study• Summary of Tax principles
• 2019-2021 Economic Analysis• Tax Analyses• Household and Business Tax Burden Analyses• Economic Competitiveness
• Next: Overview of 2021 TSWG Work Program 107
Summary Report Sections


